Article

Particle Velocimetry, CFD, and the Role of Particle Sphericity in Cold Spray

by
Ozan Çağatay Özdemir
*,
Joseph Mitchell Conahan
and
Sinan Müftü
Department of Mechanical & Industrial Engineering, Northeastern University, Boston, MA 02115, USA
*
Author to whom correspondence should be addressed.
Coatings 2020, 10(12), 1254; https://doi.org/10.3390/coatings10121254
Submission received: 19 November 2020 / Revised: 12 December 2020 / Accepted: 14 December 2020 / Published: 18 December 2020
(This article belongs to the Special Issue Recent Developments of Cold Spray Coating)

Abstract

:
Implementation of the cold spray (CS) technology in manufacturing and repair creates a demand for reliable quality control and process monitoring measures. In this regard, particle size and impact velocity are undoubtedly the most important control parameters in CS. Several in-flight measurement systems for particle velocimetry are now available commercially for CS. These systems provide great potential to be used as a diagnostic tool for validating CS system performance in industrial applications. However, post processing the velocimetry data is required in many instances for achieving a complete understanding of the particle flow field. In this study, particle velocimetry is used in conjunction with computational fluid dynamics (CFD) simulations to: (i) identify the physical factors that dictate the particle velocity and its variability; (ii) develop high fidelity CFD models to accurately predict particle flight parameters that cannot be measured by available experimental tools; and (iii) present the capabilities of state-of-the-art velocimeters as a reliable diagnostic tool for measuring the consistency and repeatability of CS systems in manufacturing settings. In-flight particle size, location, and velocity are measured using a commercially available velocimeter for aluminum and copper particles sprayed with supersonic nozzles using helium, nitrogen, and air by two high pressure CS systems. As a result of this work, particle sphericity was clearly identified to have strong effects on particle velocity and to be one of the main factors of the variability of particle velocity. Furthermore, methods for building a high-fidelity 3D-CFD model was presented. CFD models were validated using particle velocimetry and schlieren imaging. Finally, particle velocimetry is shown to be a valid diagnostics tool for CS with systems capable of measuring in-flight particle velocities along with particle sizes. This article also outlines steps necessary for conducting cold spray process diagnostics repeatably and reliably.

1. Introduction

Cold spray (CS) additive manufacturing is a line-of-sight material deposition process and has primarily been used as a coating and repair technique in automotive [1], aerospace [2,3,4], marine [5,6], and defense applications [7,8,9]. CS also has an increasing presence in 3D printing of metal and metal matrix composite structures [10,11]. The technology utilizes a converging-diverging supersonic nozzle to spray metals, metal-ceramic blends, cermet, and polymer powders onto target surfaces (substrates) at velocities that reach 1500 m/s [12]. Propulsion of particles is achieved primarily by drag forces in spray nozzles that expand compressible gases such as air, nitrogen, and helium up to Mach 3.5. Particles in the size range of 5–150 µm and the substrate deform in solid state and lead to mechanical and metallurgical bonding at particle–substrate interfaces. Layering of particles on top of each other generates thick deposits with a minimum thickness of approximately 50 µm and virtually no maximum thickness. The research activities in this field have shown that the strength of cold spray deposited materials and parts can reach near that of their wrought manufactured counterparts [13]. However, cold spray manufactured structures behave differently in comparison to traditionally manufactured parts under stress [13,14]. Therefore, understanding the advantages and the disadvantages of CS products will allow the intelligent and imperative use of the technology. The nature of the cold spray process introduces variabilities that may come from the powder feedstock, the multiphase fluid dynamics, the robotics controls, and the substrate properties. A thorough process of understanding the factors that have a significant impact on CS products is of great importance for not only predicting the final product properties, but also developing better designed equipment and procedures for achieving end-product goals.
Particle velocimetry is used increasingly as a diagnostic tool in CS processes and the method has proven useful in detecting velocity deviations from well-established CS procedures [15,16,17,18]. However, experiments show that highly turbulent spray jets, micrometer scale of particles, and the harsh conditions generated near the spray area pose difficulties in detecting the full spectrum of particle sizes in the jet stream and particle velocities at impact. The reflection of high velocity and high temperature gas jet and the rebounding of undeposited particles creates an environment that would be damaging to the measurement equipment. Therefore, currently available particle velocimetry systems are designed to capture in-flight particles without the presence of a substrate. Temperature is another important particle property that cannot be measured through currently available instruments. Particle sizes and speeds limit the ability of infrared cameras to capture thermal signatures from both in-flight and near impact particles. Although recent developments in high-speed infrared cameras were demonstrated, the technology is still at the research stage and is not yet proven valid for industrial use [19,20].
In the industrial use of CS, to increase reliability and repeatability, standard operating procedures are often developed by conducting parametric experiments to select and design optimal spray nozzles and operating conditions (e.g., gas pressure and temperature) [21]. Particle velocity measurements are increasingly being used as a quantitative metric during experiments in the procedure development phase [15,18,21]. Velocimetry is also used to ensure that spray systems and nozzles perform as expected and the originally developed process design conditions are maintained in daily manufacturing and repair operations. Mean particle velocity and velocity standard deviation are the simplest parameters to use in validating cold spray system performance and are commonly used for reporting cold spray system performance. However, particle velocity is strongly dependent on particle size. Measurements also typically show high levels of variability in particle velocity on the order of hundreds of meters per second since powders used in additive manufacturing have wide ranges of particle size distributions. Thus, a reliable methodology is needed to use velocity and size measurements in conjunction for using particle velocimetry as a design and rapid diagnostic tool.
In academia, researchers rely on predictive models to estimate the missing information in the experimental data (e.g., velocity and temperature) by resolving the entire particle size spectrum in-flight and at impact [22,23,24,25]. The ability to accurately predict particle–substrate and particle–particle interactions allow for further research into understanding material properties. Single particle impact experiments are extremely useful in correlating velocity to the nature of material adhesion [26,27,28,29,30,31]. Similarly, accurately predicting the particle flow and impact in the entire flow stream in a transient manner is paramount for understanding the physics of material adhesion, material buildup, and resultant material properties [32]. Moreover, closely correlating the nature of particle impact to deposited material properties will allow for the development of superior cold spray equipment, material properties, material building strategies, and advanced applications. High fidelity 3D-CFD models prove effective in conducting parametric studies to identify: optimal nozzle/equipment designs and process parameters [33,34,35,36,37]; studying the nozzle–particle interactions to reduce nozzle wear and clogging [23,38,39]; and understanding the physics of gas–substrate interactions [32,34,37,40,41,42]. However, a comparison of commonly used predictive models [22,23,24,25,43] and particle velocimetry experiments show discrepancies. Since particle velocimetry does not capture the entire particle stream and the impact conditions, a level of uncertainty is expected in relying on models or velocimeters to provide absolute particle impact conditions. This uncertainty limits their usability only to comparative parametric studies. Thus, a need arises to bring confidence in the use of both experimental and modeling tools by developing a complete understanding of the physics that dictate the particle velocimetry data and are needed for building reliable computational tools.
In line with addressing some of these needs, this study was conducted to combine experimental and modeling methods to: (i) determine the parameters that govern the velocity and the velocity variability of particles in CS; (ii) present reliable CFD modeling techniques to accurately predict particle flight conditions important for CS that cannot be measured by available experimental tools; and (iii) evaluate the capabilities of particle velocimetry systems and present a method for reliably using particle velocimetry as a diagnostic tool for measuring CS process consistency and quality. As a result of the study, the variability of particle sphericity in metal powders is shown to have a big effect on particle velocity and the variability in particle velocity. Furthermore, the finalized 3D-CFD models are shown to perform well in predicting gas dynamics and particle velocity as compared with schlieren imaging experiments and in-flight particle velocity measurements, respectively. Finally, velocimetry systems, that are capable of measuring particle size along with particle velocity, are evaluated to be effective tools for conducting parametric studies for the design and testing of cold spray equipment and procedures as well as carrying out rapid diagnostic measurements.

2. Materials and Methods

2.1. Materials

Gas atomized aluminum alloy 6061 and commercially pure copper powder particles were used during the cold spray experiments. Aluminum alloy 6061 powder used in this study was supplied by Valimet Inc. (Stockton, CA, USA) classified per military specification MIL-DTL-32495A [44]. The commercially pure copper powder (Praxair Cu-159-03) was procured from Praxair Surface Technologies (Indianapolis, IN, USA).

2.2. Experimental Methods

2.2.1. Powder Characterization

Powder samples were taken from the Al6061 and Cu batches intended for use in particle velocimetry measurements. Powder characterization was conducted via optical microscopy in the transmitting light mode. Particles were spread on a glass slide and separated by agitation. Fifteen microscope images were taken with a high-resolution Zeiss Axioscope 7 optical microscope (Oberkochen, Germany). Images of particles on glass slides were binarized and analyzed through an algorithm written in MATLAB (MathWorks, Natick, MA, USA). In Figure 1, a sample raw microscope image can be seen along with a processed image.
Particle sphericity ( ψ ), further discussed in Section 2.3, is the ratio of the surface area of a perfectly spherical particle of the same volume to the actual surface area of the subject particle. However, in many instances this measurement can simply be calculated as the ratio of the nominal particle diameter to the major axis (largest dimension) of a particle or as the ratio of the minor axis (smallest dimension) to the major axis of a particle. The nominal diameter ( d n ) of a particle is calculated from the shadow area of a particle ( A p ) (encompassed in red in Figure 1b) measured from microscope images assuming an equivalent spherical particle.
d n = ( 4 A p ) / π
Particle morphology was further investigated by an FEI Scios Dual Beam (Hillsboro, OR, USA) scanning electron microscope (SEM).

2.2.2. Particle Image Velocimetry Experiments

Velocimetry Experiments used for CFD Model Validation

An Oseir HiWatch HR1 (Tampere, Finland) laser illuminated particle shadow image velocimetry system was used for diagnosing size dependent particle flight velocities for three separate cold spray process scenarios. A VRC Metal Systems Gen III (Rapid City, SD, USA) cold spray system was used for spraying the Al6061 powder with helium and nitrogen gases in two separate experiments. The commercially pure copper powder was sprayed using high pressure air with a SPEE3D LightSPEE3D CS system (Dandenong, VIC, Australia). HiWatch HR1 system measures a window of 13.4 wide and 8.9 mm high. The measurement field of view is 0.4 mm. Particle velocimetry measurements were taken from 25 mm downstream of the nozzle exit plane in both cases of VRC system measurements and 24 mm downstream of the nozzle exit plane in the case of SPEE3D system measurements. The image plane (width × height) was aligned to be parallel with the axis of the flow and centrally at the standoff locations as further discussed in the following sections. The experimental conditions can be seen in Table 1. Case identifications Al6061-N2, Al6061-He, and Cu-Air are used throughout the Results and Discussion and the Conclusions sections to refer to the experimental conditions listed in Table 1.

Evaluation of Particle Velocimetry as a Diagnostic Tool

Particle velocimetry was evaluated as a rapid diagnostic tool using Oseir HiWatch HR1. Four experiments were conducted at various gas pressures and temperatures using the VRC Metal Systems Gen III cold spray system (Table 2).
Four tests, designated as Cu-N2-1 through Cu-N2-4 were conducted by using N2 carrier gas to observe: the sensitivity of the cold spray process to changes in the gas supply pressure and temperature; and the ability of the HiWatch particle velocimetry system to detect the associated changes. Such parametric experiments are also often conducted to test the performance of new nozzles and to develop new cold spray procedures.
Particle velocimetry is also used to ensure that spray systems and nozzles perform as expected and the original process design conditions are maintained in daily manufacturing and repair operations. Thus, particle velocimetry systems need to be reliable in providing consistent results for spray operations conducted at identical conditions. To evaluate the consistency and reliability of the Oseir HiWatch HR1 particle velocimeter system, experiment Cu-N2-3 was repeated six times (Cu-N2-3-1 to Cu-N2-3-6) on six different occasions. Particle size and velocity are used in conjunction to analyze and compare the results. Case identifications given in Table 2 are used in the Results and Discussion and the Conclusions.

2.2.3. Schlieren Imaging Setup

Schlieren imaging is a technique widely used to visualize flow fields of transparent fluids with considerable density gradients. Thus, flows with shock waves or strong density gradients are appropriate for visualization with this method [45,46]. The setup used in this work is created using two convex lenses (Effective Focal Length = 400 mm), a pinhole light source, a razor blade, and a Nikon DSLR camera (Nikon, Tokyo, Japan).
In this setup, light from the pinhole is collimated by the first lens. The supersonic jet exiting the spray nozzle is located between the two lenses in the test section. Light is refracted due to the density gradients in the jet and is refocused down to a point by the second lens. A razor blade used as cut-off blocks some of the refracted light, and the remaining light is imaged by the camera. A monochromatic image appears in the camera with bright and dark regions, which correspond to lower and higher density gradients, respectively. An illustration of a similar setup is given in Figure 2.
Schlieren imaging experiments were conducted for the Al6061-N2 and Al6061-He cases with the VRC cold spray system, which is available on-site at Northeastern University. The imaging setup was effective in visualizing the density variations with the supersonic jets of nitrogen, in which oblique shock and expansion wave formations were clearly visible. However, the optical leverage in the initial setup was not high enough to pick up the light gas density variations within the helium supersonic jet. Therefore, only the Al6061-N2 case was compared with schlieren imaging experiments to validate the numerical methods used to resolve the supersonic flow regime.

2.3. Computational Methods

2.3.1. 3D-CFD Simulations

Three-dimensional computer models of the spray gun-nozzle assembly for both VRC and SPEE3D systems were sketched according to manufacturers’ drawings to represent the fluid domain accurately for CFD simulations. A representative sketch of the computational domain can be seen in Figure 3.
The air flow through the computational domain is realized by solving Navier–Stoke’s equations of conservation of mass, momentum, and energy using the commercially available CFD package Star CCM+ (Siemens, Munich, Germany) using a second order finite volume discretization method [47,48]. The steady state solutions in all cases were resolved by the realizable k-ω Shear Stress Transport (SST) turbulence model [49]. A transient solution proceeded with a k-ω SST model as well as a higher fidelity Large Eddy Simulation (LES) turbulence model to observe differences.
Hot and cold inlet boundaries were defined as mass flow boundaries to increase the stability of the solution. The boundary conditions listed in Table 3, replicate the conditions measured during the experiments Al6061-N2, Al6061-He, and Cu-Air.
Particles were tracked through the continuous phase (fluid) in the Eulerian domain transiently using a Lagrangian method. Gas and particle forces were two-way coupled, allowing the particles to influence the gas flow and vice versa. The drag force, F d , is given as a function of drag coefficient ( C D ), gas density ( ρ g ), gas velocity ( V g ), particle velocity ( V p ), and the projected particle area ( A p r o j ), as given in (2).
F D = C D ( ρ g 2 ) ( V g V p ) | V g V p | A p r o j
Two different semi-empirical drag coefficients were considered in this work depending on the shape of the particle. Schiller–Neumann drag coefficient [50], given in Equation (3), was used for spherical particles.
C d = { 24 R e p ( 1 + 0.15   R e p 0.687 ) ; 0 < R e p 1000 0.44 ; R e p > 1000
However, throughout the study, particle sphericity was found to play a major role in the acceleration of particles. Therefore, the widely accepted semi-empirical drag coefficient, (4), developed by Haider and Levenspiel [51] was applied to compensate for particle sphericity ( ψ ) when calculating the particle drag coefficient.
C d = ( 24 R e p ) [ 1 + exp ( 2.3288 6.4582 ψ + 2.4486 ψ 2 ) · R e p 0.0964 + 0.5565 ψ ] + exp ( 4.905 13.8944 ψ + 18.4222 ψ 2 10.2599 ψ 3 ) · R e p exp ( 1.4681 + 12.2584 ψ 20.7322 ψ 2 + 15.8855 ψ 3 ) + R e p
Later studies (e.g., [52]) confirmed the validity of this correlation.
Particle Reynolds number ( R e p ) is a function of the difference between the local gas velocity ( V g ) and the local particle velocity ( V p ), as well as the particle size ( d p ), the local gas density ( ρ g ) and gas viscosity ( μ g ) (Equation (5)).
R e p = ρ g | V g V p | d p μ g
Particle sphericity ( ψ ) given in Equation (4) is defined in [51] as:
ψ = S u r f a c e   A r e a   o f   a   S p h e r i c a l   P a r t i c l e   o f   E q u i v a l e n t   V o l u m e S u r f a c e   A r e a   o f   t h e   P a r t i c l e   U n d e r   I n v e s t i g a t i o n
If the particle is perfectly spherical, the particle sphericity is equal to unity ( ψ = 1 ). However, if the particle has features and is non-spherical, the sphericity parameter is less than unity ( ψ < 1 ). This measurement, which requires computed tomography (CT) scanning and analysis of hundreds of particles, is quite difficult and not practical for powders with particles of random sizes and sphericities. Therefore, simplified versions of this parameter are commonly used [53,54]. The simplest measure is the ratio of the nominal diameter ( d n ) to the major axis dimension ( d a ) of the particle as measured from optical microscope images, as detailed earlier in this article [54]. In this study, the particle sphericity measurement is assumed to be d n / d a .
To observe the effects of particle sphericity, CFD simulations were conducted by injecting particles by assuming: (i) perfectly spherical particles ( ψ 1 = 1 ); (ii) assuming particles with log-normally distributed sphericities independent of size ( ψ 2 = ln ( ψ ) ~ N ( μ , σ 2 ) ); and (iii) using the size and sphericity measured from microscope images directly as injection parameters ( ψ 3 ). The notations ψ 1 ,   ψ 2 , and ψ 3 are used throughout the article to refer to these sphericity definitions for conciseness. The simulations were first conducted by using the particle size distributions taken from the particle velocimeter assuming spherical particles ( ψ 1 ). This was carried out to ensure identical particle size distribution between simulations and the velocimeter for a direct comparison. The results later showed that spherical particle assumption does not hold. Therefore, secondly, shape distribution measurements taken from microscope images ( ψ 2 ) were applied to the particle size distributions taken from velocimeter measurements to still have the same size distribution between 3D-CFD and measurements. However, the results of these second set of CFD simulations showed that particle shape is dependent on size and the size–shape relationship cannot be ignored. For the third set of simulations, particle size and shape data taken from the microscope measurements ( ψ 3 ) were directly applied to 3D-CFD simulations to capture the effects of particle size distributions, shape distributions, and their dependence on each other much more accurately. In the third set of 3D-CFD simulations the particle size distribution does not match those measured by the particle velocimeter due to a discrepancy between the size measurements taken from microscope images and those measured by the velocimeter. This is further discussed in the following sections.
Heat transfer between the particles and the gas is also two-way coupled. The main form of thermal energy exchange between the gas and the particles is convective and it is based on the Nusselt number, N u , a nondimensional semi-empirical heat transfer coefficient. In this case, particles are assumed to be spherical for heat transfer calculation purposes, and this assumption allows us to use the Nusselt number defined by Ranz and Marshall [55,56].
N u = 2 + 0.6 R e p 0.5   ( P r ) 1 / 3
where the Prandtl number, P r , is defined as a function of the local isobaric heat capacity ( C p ), dynamic viscosity ( μ g ), and thermal conductivity ( k g ).
P r = C p μ g k g
In Equation (7), C p is assumed to be constant for air, nitrogen, and helium. C p remains between 1000 and 1100 J/kg∙K for air and nitrogen in the −150 to 500 °C temperature range [57]. Helium is an ideal gas and its isobaric heat capacity is 5195 J/kg∙K [58]. Dynamic viscosity and thermal conductivity are interpolated from experimental data given in [57] for air and nitrogen and in [58] for helium depending on the local temperature.

2.3.2. 3D-CFD Mesh Independence Examination

A polyhedral unstructured mesh was adopted in all three cases. A mesh refinement study was conducted to verify that the final solutions in all three cases were independent of the mesh size and that the solution did not change significantly with further refinement.

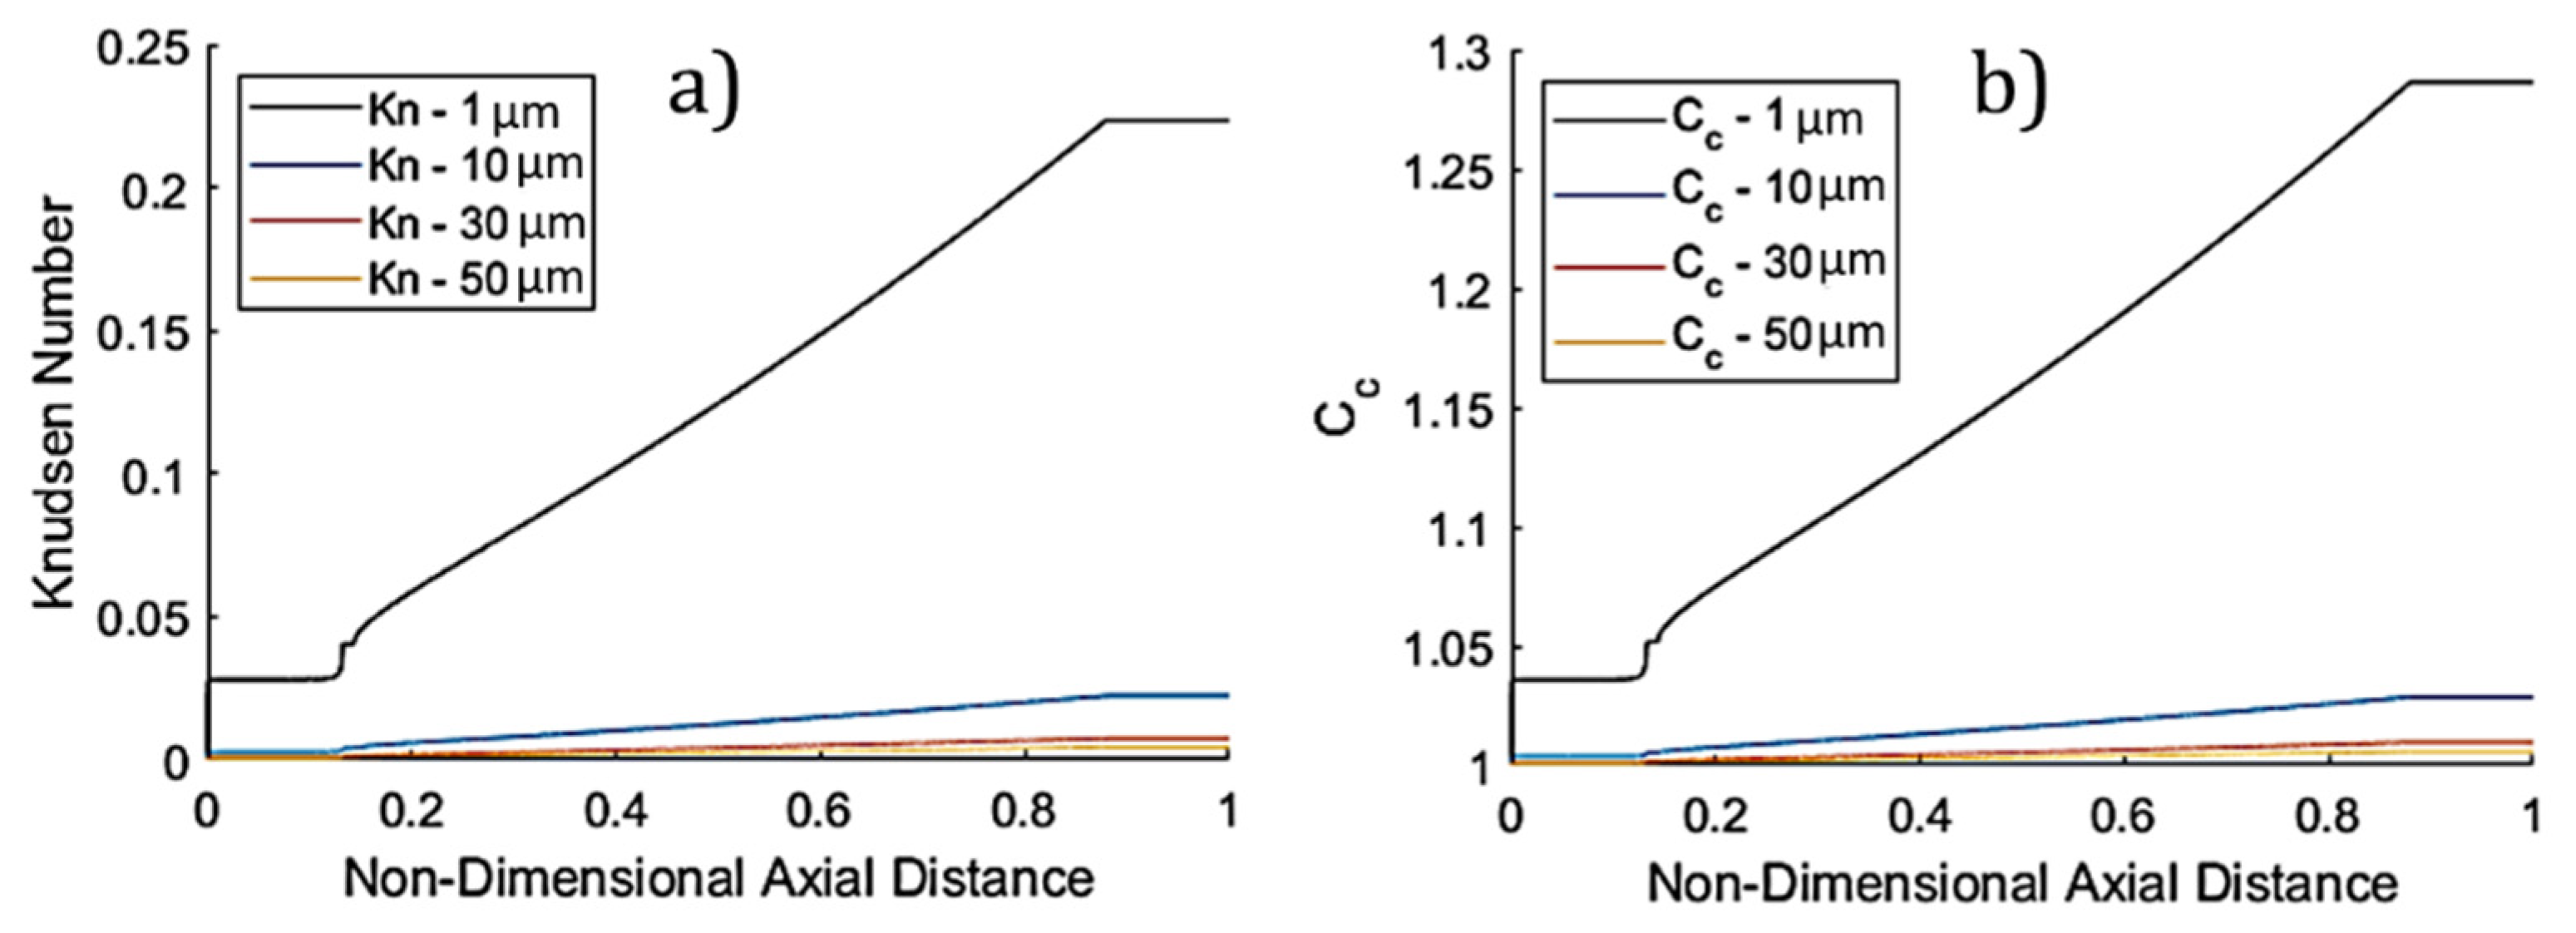
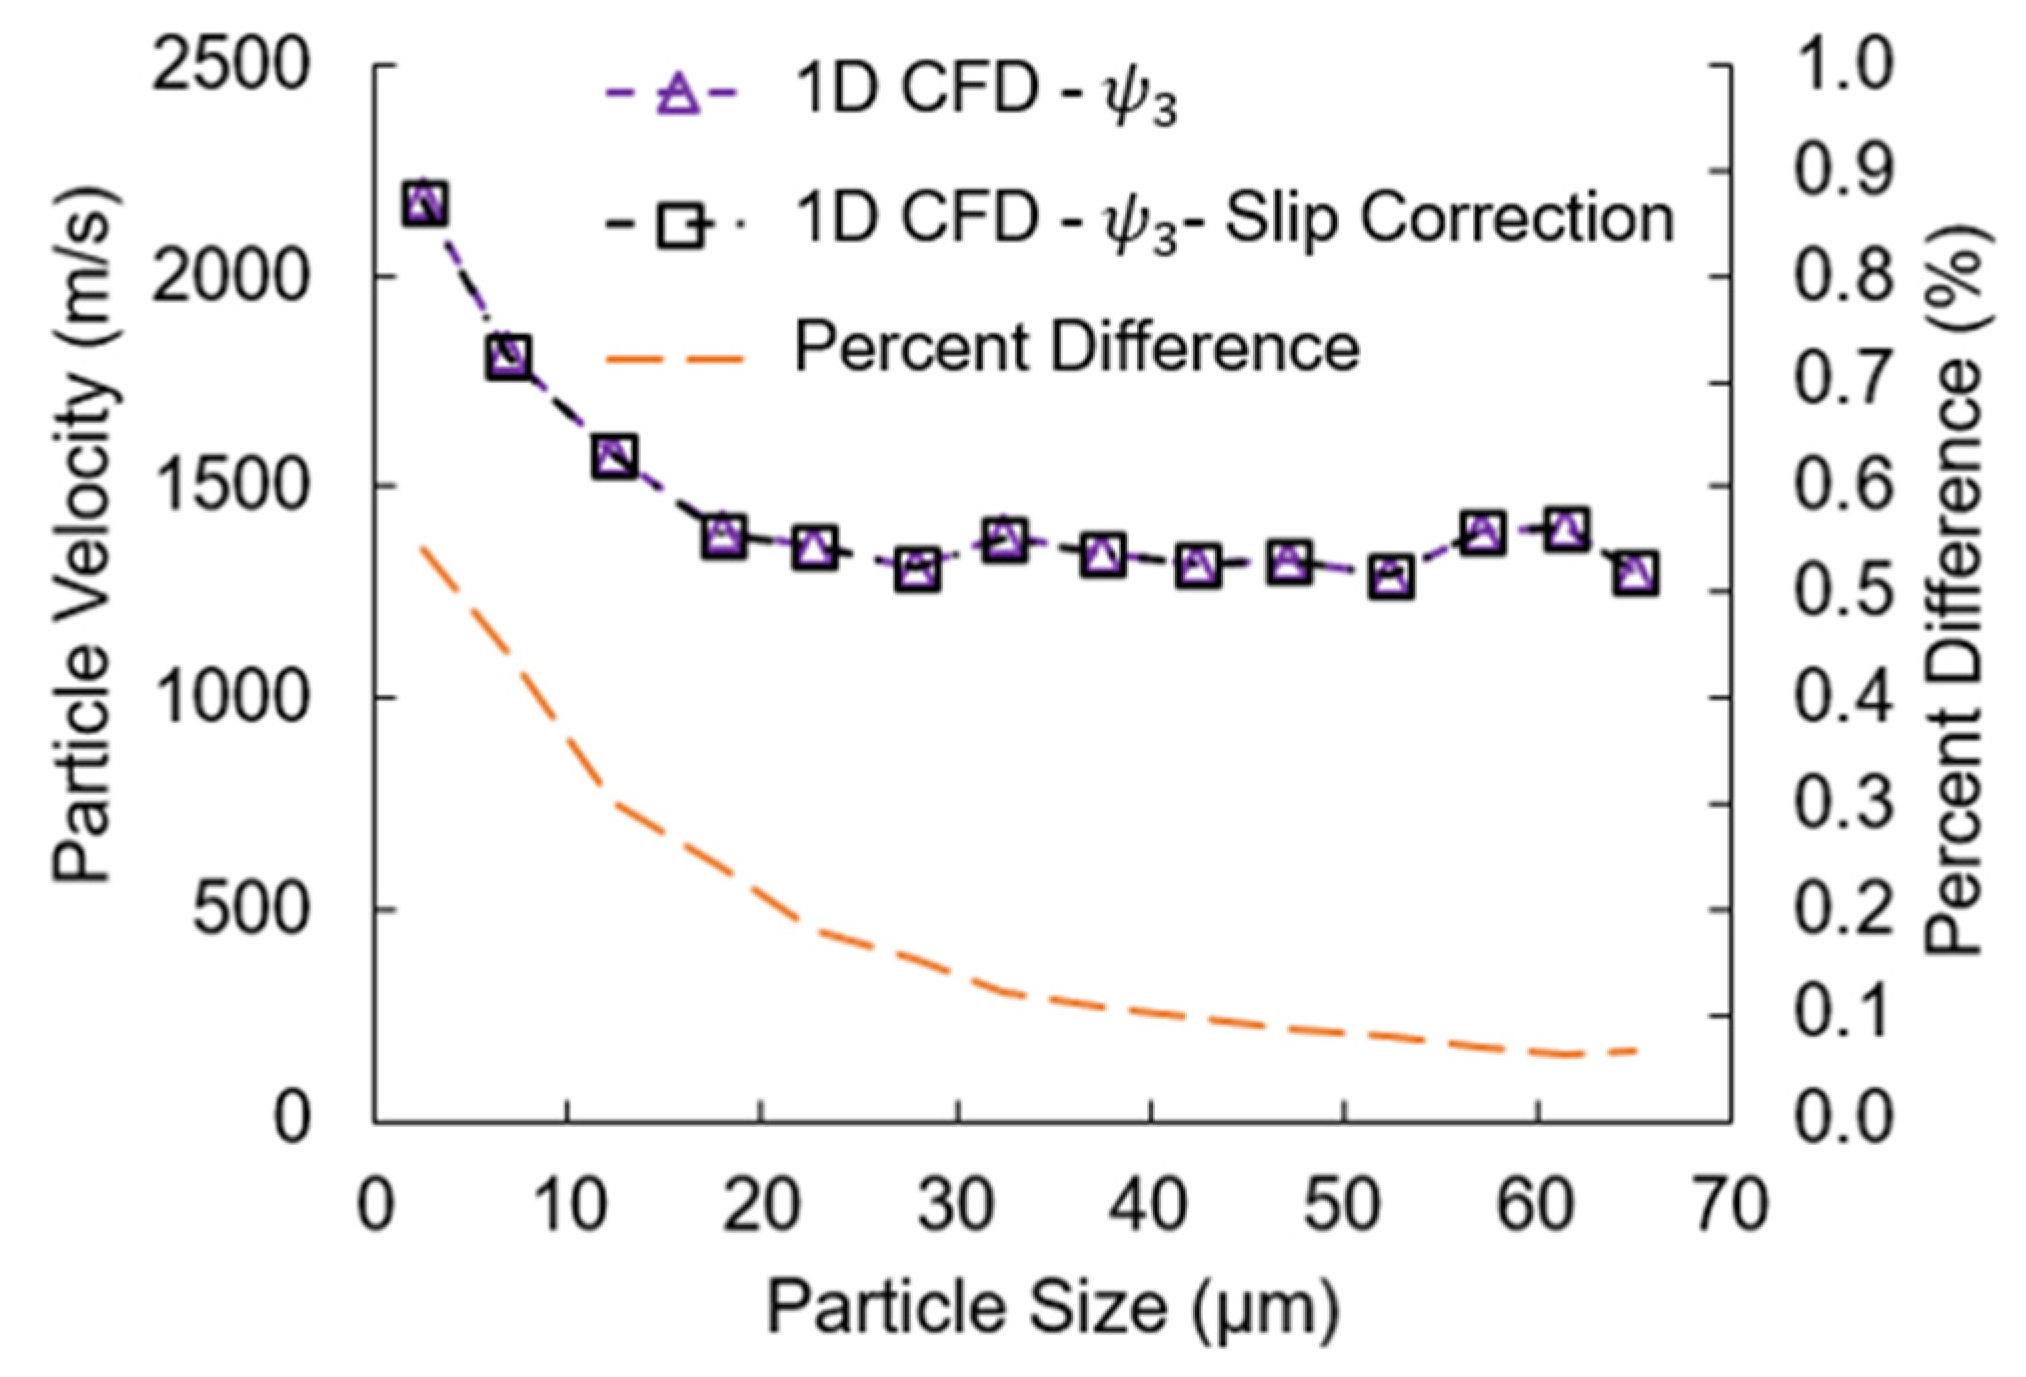
2.3.3. 1D-CFD Simulations

One-dimensional CFD simulations were used for quickly observing the effects of particle sphericity by taking advantage of the fast nature of these simulations. 1D-CFD models track the particle flight along the axis of the flow from injection to impact or the velocity measurement region. Computational methods described in the work of Ozdemir et al. [16] are used here by replacing the drag coefficient given in the article with Equation (4), which accounts for particle sphericity effects.
Furthermore, one-dimensional CFD simulations were used for computing the gas molecule mean free path, Knudsen number, and Cunningham correction factor for Al6061-He to understand the effects of potential molecular slip that may hinder drag forces. The mean free path ( λ ) between the gas molecules was calculated using the kinetic theory [59].
λ = μ g κ ρ g v g
Local dynamic viscosity ( μ g ) and density ( ρ g ) of the gas were calculated along the axis of the nozzle [16] and κ is a model constant commonly accepted as 0.491 [59]. The mean velocity of gas molecules was estimated by:
v g = 8 k B T π m m o l
where T is the gas temperature, k B is the Stefan Boltzmann constant ( 1.38066 × 10 23 J/K), and m m o l is the molecular mass.
In particle-laden multiphase flows, Knudsen number ( K n ) is the ratio of the mean free path to the nominal diameter ( d n ) of a particle. In highly rarified flows, the gas molecules in the continuous phase can be rarified enough to cause molecular slip around particles and reduce particle drag. K n helps determine whether the gas–particle interactions remain in the continuum flow regime ( K n < 0.01 ), enter into the slip flow ( 0.01 < K n < 0.1 ) , or reach the transitional flow ( 0.1 < K n < 10 ) regimes. For K n > 10 , gas molecules flow freely around objects without any considerable drag forces [59]. If the nature of the flow is in the slip and transitional flow regimes, the drag forces can be corrected by applying the Cunningham correction factor ( C c ) [59,60].
C c = 1 + A · K n
A = α + β exp ( γ / K n )  
where, α , β , and γ are curve fit parameters that best represent the experimental data. For helium, α , β , and γ were identified as 1.277, 0.370, and 1, respectively [60]. Allen and Raabe [61] and Rader [60] note that increased surface roughness is expected to result in a lower α value.

3. Results and Discussion

3.1. Particle Size and Shape Characteristics

Particle size distributions for Al6061 and Cu powders, measured and evaluated as described above, are reported in Figure 4. Probability and cumulative size distributions are classified for both powders by population and by volume. Population based size distributions measured by the Oseir HiWatch HR1 particle velocimeter during cold spray experiments are also plotted alongside the microscope measurements to observe what size particles are sampled by the velocimeter.
Arithmetic and volumetric mean particle size from microscope measurements for the Al6061 powder are 21.3 and 29.2 µm, respectively. Arithmetic and volumetric mean particle size measured by optical microscopy for the Praxair Cu-159-03 powder are 18.5 and 22.4 µm, respectively. Population based distributions measured from velocimetry experiments are significantly different than the population-based distributions measured from microscope images (Figure 4b). The Oseir HiWatch particle velocimeter has a lower limit of 5 µm and Figure 4 shows that few particles with sizes less than 15 µm are measured. This is an indication that the particle velocimeter does not capture the entire particle stream. The velocimetry measurements are closer to the volumetric probability distributions measured from the microscope. It is apparent in Figure 4a that the population-based distribution measurements from the velocimeter appear to change for the same powder depending on the spray procedure.
High resolution microscope images were further processed to assess the particle sphericity for both powders. In Figure 5, probability and cumulative densities of particle sphericity are plotted for aluminum and copper powders. The bar chart given in Figure 5 was populated by classifying particles based on their shape and independent of their size. Particle images were additionally classified to observe their size dependency. In Figure 6, particle sphericity data are plotted against particle size along with the mean and standard deviation values calculated at 5 µm particle size intervals.
Figure 6 shows the dependency of particle sphericity on particle size with larger particles possessing shapes more spherical than smaller particles. This observation is validated by qualitative SEM analysis of powders. Scanning electron microscope images of powder particles taken at 1000× magnification can be seen in Figure 7 for aluminum and copper particles.
SEM images (Figure 7) show that both powders include particles of spherical and off-spherical nature. Aluminum powder particles appear to include few satellite particles whereas most copper particles have satellites with many appearing to be well adhered. Larger particles in both batches are observed to be more elongated than smaller particles. Furthermore, copper powder (Figure 7) is mainly made up of agglomerated particles with many surface features that increase the surface area of particles.

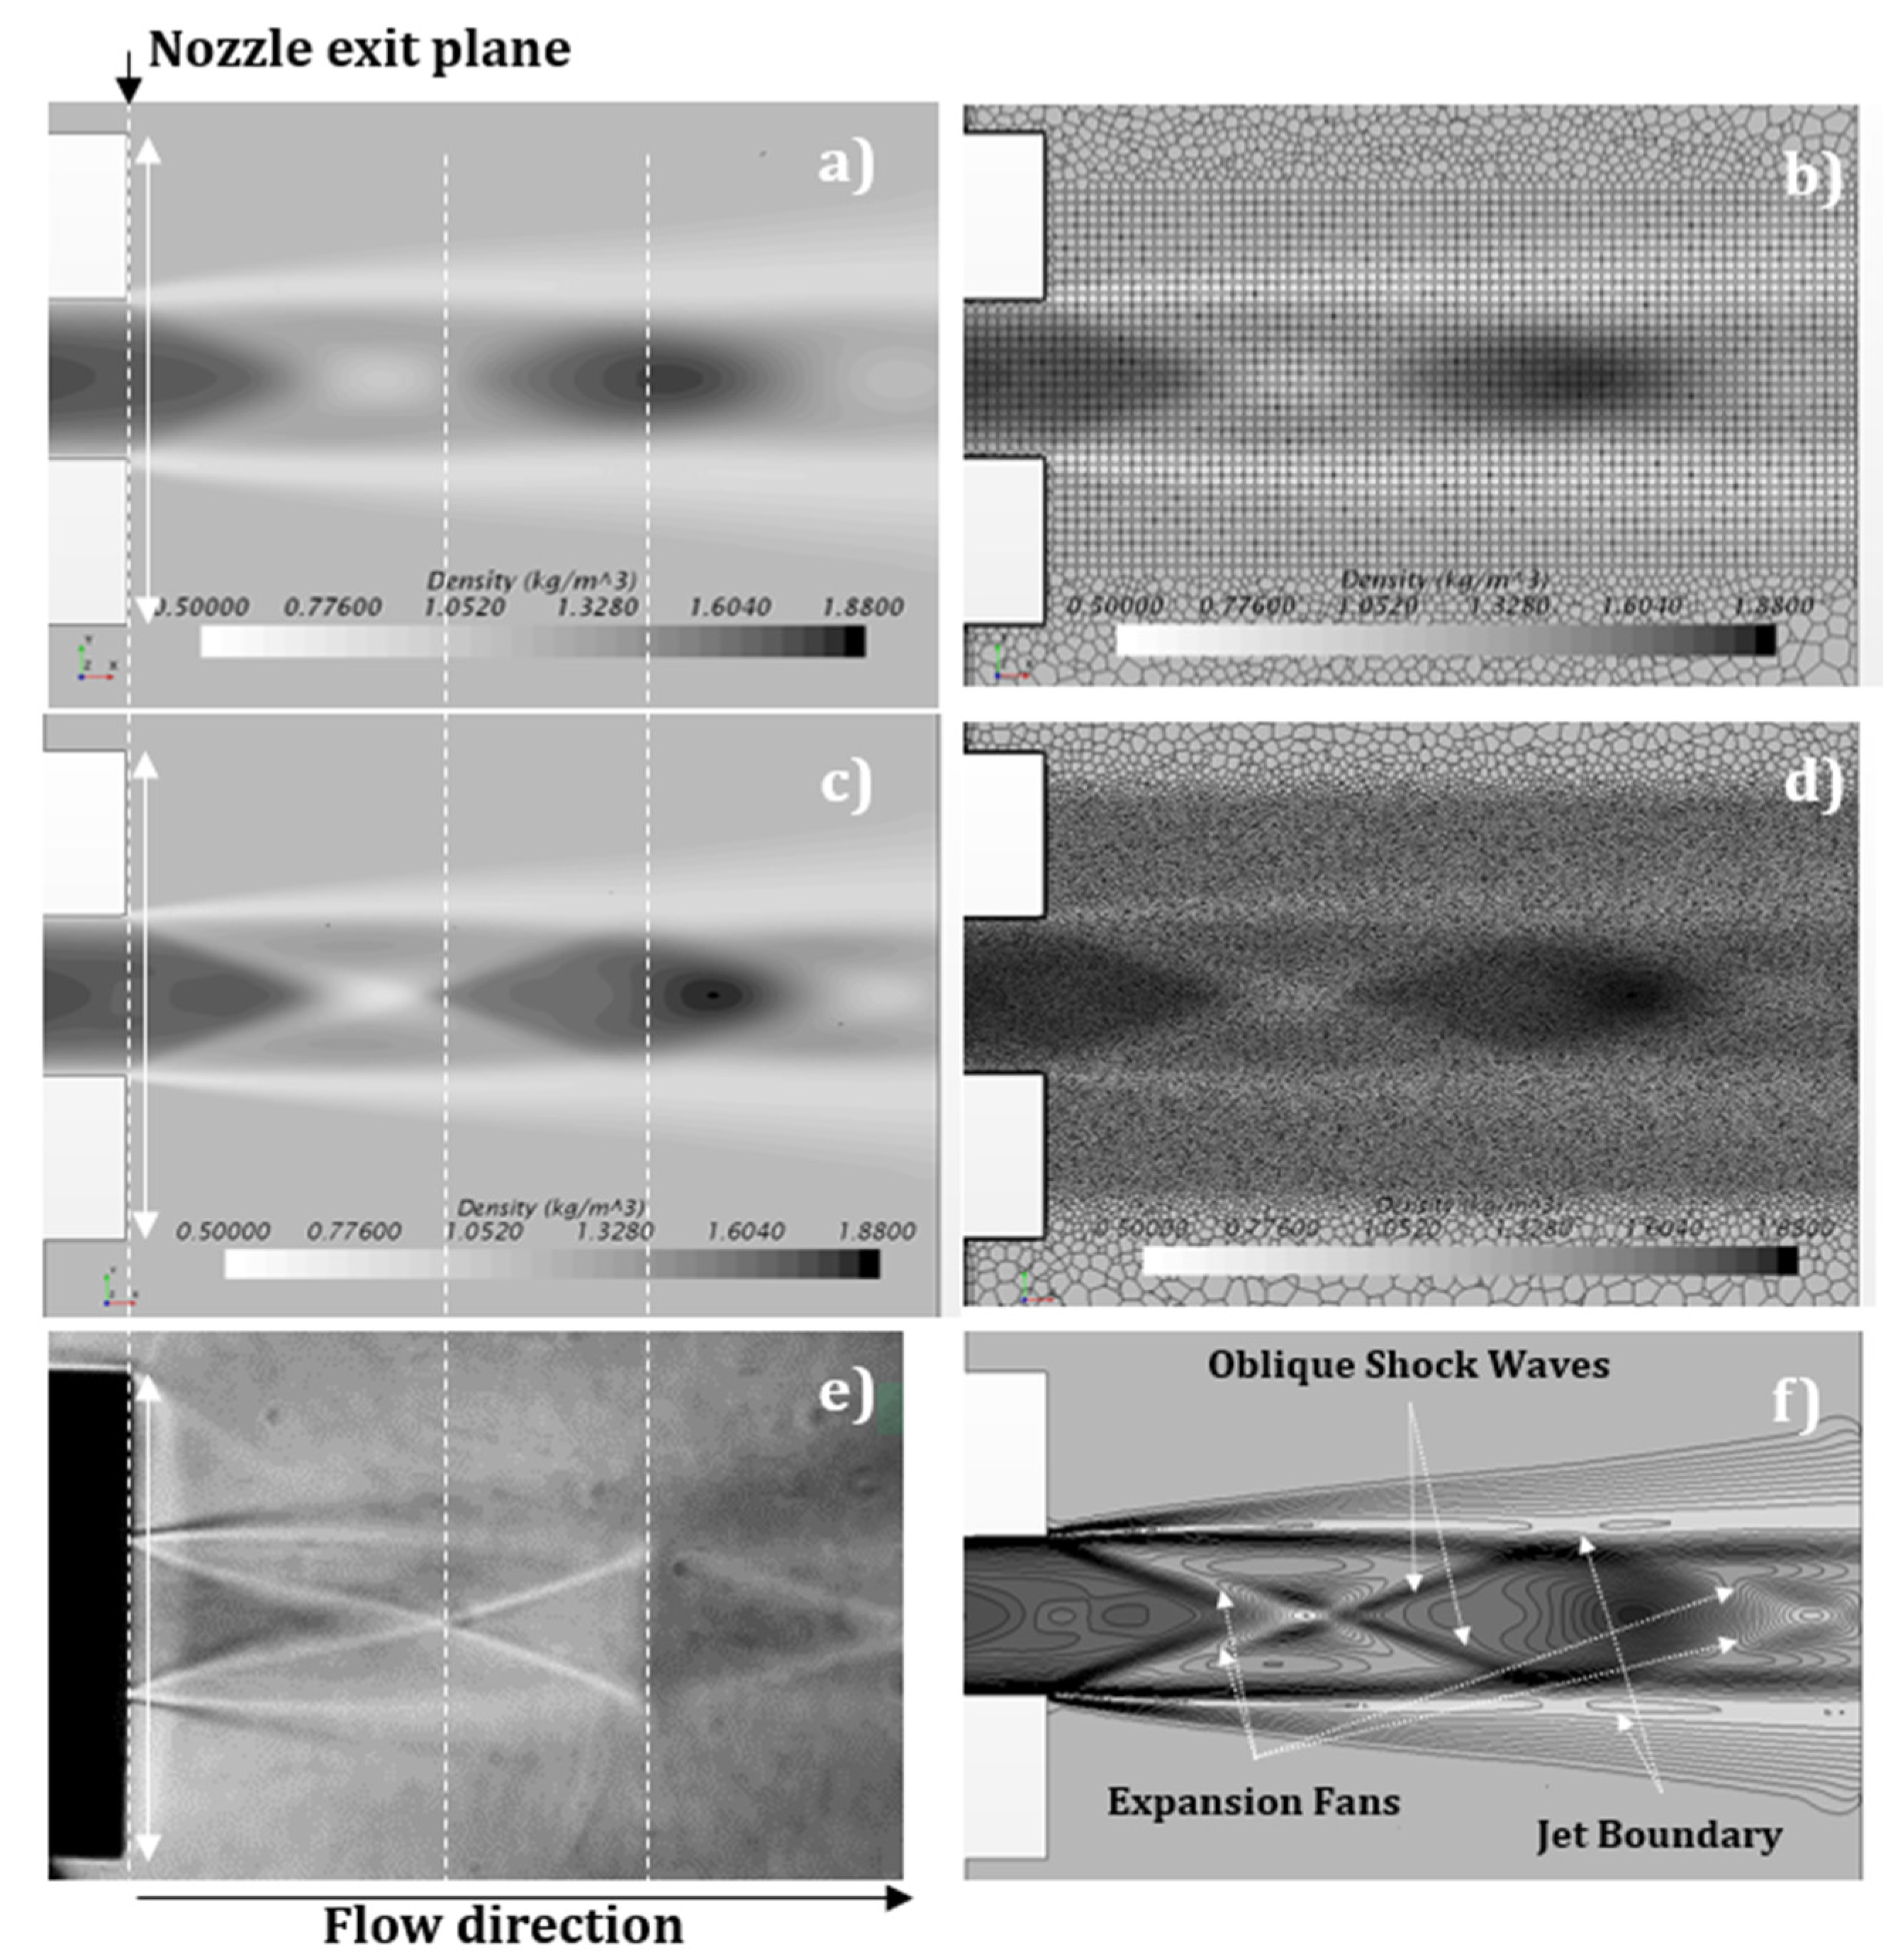
3.2. Comparison of CFD and Schlieren Visualization of Supersonic Jet Characteristics

The validity of gas dynamics calculations was experimentally tested by performing schlieren imaging of the supersonic jet exiting the nozzle for the Al6061-N2 case (Table 1 and Table 3) and comparing the images with gas density contour plots taken from the simulations. Gas density gradients in both schlieren images and CFD simulations highlight the location of supersonic jet characteristics such as the location of expansion fans and oblique shocks that can be used to validate the accuracy of the turbulence models and solvers. Furthermore, the gas density scales from the CFD simulations with the mesh properties selected for this study (~1.9 million finite volume cells) are verified with a CFD simulation with a highly resolved mesh (~4.6 million cells). Contour plots from CFD simulations and the schlieren visualization of the supersonic jet are presented and compared in Figure 8.
Computational fluid dynamics simulations very closely predict the formation of expansion fans and oblique-shock waves captured on schlieren images taken from the underexpanded supersonic jet exiting a VRC nozzle NZZL0071 during experiments for the Al6061-N2 case. Expansion and shock wave formations are caused by the pressure difference between the supersonic jet and the atmosphere. The supersonic jet characteristics are a direct result of the upstream flow conditions in the nozzle. Therefore, the good match between the CFD gas density contour plots in Figure 8a–c also indicate a valid model use for the prediction of the fluid dynamics within the nozzle and the boundary layer development in the diverging section of the nozzle.
Furthermore, coarse and refined mesh density simulations provided similar results as evidenced from the density contour plots (Figure 8a–d). The model that was refined in the supersonic jet region provided a better resolution of the expansion and shockwaves as expected. However, no significant difference was found in the continuous phase flow properties upstream of the nozzle exit plane. This is evidenced by plotting the Mach number along the axis of the computational models (Figure 9).
The computational cost of the refined mesh is significantly higher with approximately 2.4 times the finite volume cell size and does not improve the continuum phase calculations significantly. Therefore, the coarser mesh with approximately ~1.9 million cells was selected for simulating these models. A similar mesh density was adopted for Al6061-He and Cu-Air cases as well.

3.3. Measurement and Prediction of Size Dependent Particle Velocity

Particle size dependent raw data from HiWatch particle velocimetry measurements are plotted for all three experimental cases along with 3D-CFD simulations in Figure 10. Note that the 3D-CFD simulation in Figure 10 simulations assume perfectly spherical particles ( ψ 1 ) and use the k-ω SST turbulence model. Size distributions of particles injected into the models were assumed to be identical to those measured by the HiWatch velocimeter for a direct comparison (Figure 5). Predictions of the 1D-CFD simulations are also plotted in (Figure 10). These simulations adopt particle sphericities in the range of 0.6–1, with increments of 0.1.
The 3D-CFD simulations with the perfectly spherical particle assumptions underestimate the particle flight velocity. One possibility for such a big difference was suspected to be the effect of particle sphericity. To quickly test this thought, the results of the 1D-CFD simulations were used to observe the effect of sphericity on the particle velocity. Results from the 1D models in Figure 10 prove that particle sphericity has a big impact on the acceleration of particles in the flow regimes experienced in cold spray for particle sizes larger than 3 μm. A decrease in particle sphericity leads to a significant increase in particle velocity. Particle sphericity measurements conducted by optical microscopy (Figure 6) and SEM analyses (Figure 7) also show that particle sphericities much lower than unity ( ψ < 1 ) are common and further validate these findings.
The 3D-CFD simulations were conducted to observe the effects of particle sphericity on the particle flight velocities. Particle sphericity values were assigned to particles by replicating the probability density distributions shown in Figure 5. Note that the distributions presented in this figure for aluminum and copper powders are independent of the particle size. The 3D-CFD simulations were carried out by both assuming realizable k-ω SST and LES turbulence models to also observe any turbulence model effects on the particle velocity estimations. Boundary layer formation on the nozzle internal walls leads to a radial velocity variation within the nozzle. Particle velocity predictions are expected to suffer errors if the particle dispersion within the gas stream is not predicted accurately. In Figure 11, probability density (%) of particle flux (particles/s) is plotted with respect to the z-axis (distance from the center of the jet as given in Figure 3) to observe the performance of realizable k-ω SST and LES turbulence models. Particle size distributions in 3D-CFD model data were taken from velocimetry experiments. This allows a direct comparison of particle flux between the simulations and the experimental data. Particle data taken at the outlet boundary of the CFD simulations were spatially filtered to −0.2 mm < y < 0.2 mm to represent the measurement area of the Oseir HiWatch HR1 particle velocimeter system. The measurement area is sketched with respect to the model domain and can be seen in Figure 3.
In the Al6061-He case (Figure 11a), the particle distribution within the jet stream is well predicted by both k-ω and LES turbulence models. Dispersion of particles in the Al6061-N2 and Al6061-He cases, however, do not match as well with the particle velocimetry data when the k-ω model is implemented in 3D-CFD simulations (Figure 11b,c). Particle dispersion is better represented by 3D-CFD simulations that incorporate the LES turbulence model. Reynolds Averaged Navier-Stokes (RANS) turbulence models (e.g., realizable k- ω SST) approximate both small scale and large-scale turbulent disturbances. LES models resolve large scale eddies while averaging small scale disturbances [49,62]. Using the LES model brings an increased level of accuracy in simulating large scale turbulent fluctuations at an increased computational cost. Simulation results seen in Figure 11 show that the increased accuracy is needed in 3D-CFD models for better simulating particle dispersion.
Particle velocity and error bars representing one standard deviation are plotted with respect to particle size in 5 µm intervals (Figure 12). Predictions of particle velocity from CFD models that assume log normal probability distributions of particle sphericity ( ψ 2 ) are compared with experimental data and predictions from CFD models that assume perfectly spherical particles ( ψ 1 ). Performance of k-ω and LES models are also compared in Figure 12.
Size dependent velocity predictions of simulations with k-ω and LES turbulence models overlap each other without any major difference in all three cases. Figure 12 shows that in Al6061-N2 and Cu-Air cases, the model predictions are improved. Size dependent model prediction in the Al6061-N2 case fits the particle velocimetry data quite well as evident with the majority of particle sizes (>20 µm) having less than 10% maximum error, as shown in Figure 12e. However, particle velocity is overestimated by models for the Al6061-He case and underestimated by models in the case of Cu-Air. Error between size dependent velocity measurements and model predictions (Figure 12d,e) also show a size dependence. This is attributed to the dependence of particle sphericity distribution on the particle size as shown in Figure 6. To test this hypothesis, particle injection in 3D-CFD simulations were modified to take particle data directly from microscope measurements of particle size and sphericity given in Figure 6. The LES turbulence model is incorporated into 3D-CFD simulations for further investigation into the discrepancies between experiments and simulations.
Data from particle velocimetry measurements, 3D-CFD simulations with spherical particle assumption ( ψ 1 ), and 3D-CFD simulations with data driven particle injection properties ( ψ 3 ) are plotted in Figure 13. Moving average and standard deviation is plotted for velocimetry measurements and 3D-CFD simulations at 5 µm intervals. Error in particle velocity estimation of CFD simulations with respect to velocimetry measurements are also plotted at 5 µm.
Particle velocity predictions overall were improved in all three cases by incorporating microscope data informed particle size and shape properties in 3D-CFD simulations. In Al6061-N2 and Cu-Air cases, error in velocity predictions dropped to 10% and lower for particle size intervals where high number of data points are present from both the CFD simulations and the velocimetry measurements between 15 and 50 µm. The size and sphericity data are taken for every single particle from the microscope measurements for the CFD-LES- ψ 3 simulations. Therefore, the particle size probability density in the updated simulations are identical to the population-based probability distribution from microscope measurements, which is different than the population-based particle size distributions measured by particle velocimetry (Figure 4). Therefore, experiments and simulations have different data concentrations with respect to particle size. Experiment and simulation results compare well for the 15–50 µm particle size range for CFD-LES- ψ 3 models of Al6061-N2 and Cu-Air. On the other hand, velocity is overpredicted by the CFD-LES- ψ 3 model for the Al6061-He case by approximately 10% for particles with sizes less than 50 µm and the error increases for particle sizes larger than 50 µm. A similar error trend is observed for the Al6061-N2 case for the CFD-LES- ψ 3 model even though the magnitude of the error is smaller. In Al6061-He, the error increases from ~12% at 50 µm up to ~25% for larger particles with a velocity difference of approximately 200 m/s (Figure 13). In Al6061-N2, the error increases to over 10% for particles larger than 50 µm with a maximum velocity difference of ~100 m/s (Figure 13). In the Cu-Air case, the error between particle velocity measurements and CFD-LES- ψ 3 are low, with most particle sizes showing errors of approximately 60 m/s or less (Figure 13).
A comparable picture is drawn when 1D-CFD simulations are used for predicting size dependent particle velocity. The 1D-CFD simulations were carried out by incorporating the average and positive and negative deviations of particle sphericity ( ψ 3 ) from size dependent measurements plotted in Figure 6. The results from 1D-CFD- ψ 3 are compared with velocimetry data as well as results from 1D-CFD- ψ 1 model predictions in plots Figure 14a–c for Al6061-He, Al6061-N2, and Cu-Air cases, respectively.
HiWatch particle velocimetry data and the 1D-CFD- ψ 3 predictions match quite well for Al6061-N2 and Cu-Air cases, in which velocity predictions are well within one standard deviation. When ψ 3 is incorporated for particle sphericity, both 3D and 1D-CFD simulations overestimate particle velocity for the Al6061-He case. Factors considered as potential causes for the overestimation of particle velocity in Al6061-He are: error in particle sphericity measurements; molecular slip hindering particle drag; three-dimensional effects; and particle velocity measurement errors.
Minor errors in particle sphericity measurements can lead to big differences for low density aluminum particles that are accelerated to high velocities in helium. The effect of these errors is not as significant for Al6061-N2. The influence of particle sphericity on particle velocity is clearly seen in 1D-CFD predictions in Figure 10. The change of particle sphericity from 1 (spherical) to 0.6 (off-spherical) for a 30 µm particle leads to a 500 m/s increase in particle flight velocity in Al6061-He. The same change in sphericity leads only to a 100 m/s difference for a 30 µm particle in Al6061-N2. This shows that small measurement errors in sphericity of aluminum particles sprayed in helium can lead to big differences in impact velocity. The results in this study show that a more involved particle sphericity measurement method may be necessary for better predicting the particle drag. However, as mentioned before, the surface area measurements of non-uniform particles, such as those used in this study (Figure 7), require very time consuming and costly micro-computed-tomography scans. Thus, it is of importance to identify alternative and practical sphericity characterization methods and it is the subject of further research for more effectively approximating drag forces for non-spherical particles in flow regimes seen in cold spray.
Molecular slip is another factor that needs to be considered. In highly rarified flows, increase in the mean free path between gas molecules can hinder particle drag. The non-slip condition at gas–particle boundaries (continuum flow criterion) may no longer hold considering the micron scale particle size ranges involved in cold spray. Kinetic theory of gases is used to calculate the Knudsen number ( K n ) to measure whether the non-slip boundary condition holds [59,60]. K n of particles with 1, 10, 30, and 50 µm are plotted against the axis of the flow in Figure 15 for Al6061-He.
Figure 15a shows that small particles (<10 µm) enter the slip flow regime, in which effects of molecular slip must be considered. Drag for particles in the slip and transition regions can be corrected by using the Cunningham correction factor (Figure 15b). However, 1D-CFD simulations show that the particle velocity predictions given in Figure 14 for 1D-CFD- ψ 3 are not altered significantly for particles larger than 5 µm (Figure 16).
Slip correction effects appear to be negligible resulting in less than 1% difference in particle velocity (Figure 16). Overall, the influence of particle sphericity is observed to be more pronounced on the particle flight velocity than molecular slip. The low values of K n and the minimal impact of molecular slip on particle velocity shows that the continuum flow assumption is accurate for the given models. The gas pressures implemented in this study are high (>>10 bar); therefore, the K n number stays low throughout the nozzle. The effect of molecular slip is expected to be significantly higher for low pressure cold spray and particle diameters less than 5 µm.
The error sustained in the Al6061-He case (Figure 13g) can also be partially attributed to three dimensionality effects. Particle dispersion in Al6061-He is predicted accurately (Figure 11a), but stronger boundary layer effects than predicted can reduce gas velocity and the cross-sectional gas velocity profile. This can lead to further reduction in particle velocity. The three-dimensional effects are apparent when 3D-CFD (Figure 13d) and 1D-CFD (Figure 14a) results are compared. The 3D-CFD- ψ 3 prediction given in Figure 13d is closer to particle velocity measurements in comparison to the 1D-CFD- ψ 3 predictions given in Figure 14a. The overlap between the 1D-CFD- ψ 1 simulation results and the velocimetry measurements (Figure 14a) are not the result of the use of correct models but the result of the offset caused by both ignoring the boundary layer effects and the particle sphericity. In future studies, the sensitivity of the schlieren system (Section 2.2.3) will be increased to visualize the helium supersonic jet stream to increase the confidence in helium gas dynamic calculations.
Furthermore, one must also consider the potential errors in the particle velocimetry measurements. Errors in the alignment of the 0.4 mm field of view with the center of jet flow can lead to large errors in velocity in cases (e.g., Al6061-He) where boundary layer effects are strong. Repeatability of test results presented in Section 3.4 for the measurement of copper particles show that small variations are possible in experiments conducted at different times for identical spray conditions.

3.4. Velocimetry as a Rapid Diagnostic Tool

Results from in-flight particle size and velocity measurements are given in Figure 17 for Cu-N2-1 to Cu-N2-4 as given in Table 2.
Particle velocity is heavily dependent on particle size. Therefore, the sampled particles among a set of experiments must have the same size for directly comparing their in-flight velocities. In Figure 17a, the average size of particles in all four experiments is approximately 30 µm. One-way analysis of variance shows that the means and the variability of the particle size distribution are similar even though small differences can be seen in the cumulative distribution plots (Figure 17b). This analysis allows for a direct comparison of particle velocity for diagnostic purposes as given in Figure 17c, in which a clear trend of particle velocity increase is observed with the increase in gas pressure and temperature (Table 2). This is very encouraging in relying on particle velocimetry systems for diagnostic analyses.
To check the repeatability of velocimetry measurements, in-flight velocities of copper particles were recorded in six separate experiments for the Cu-N2-3 case. Results from in-flight particle size and velocity measurements are given in Figure 18. A one-way analysis of variance study indicates that the particle size means and variabilities in Cu-N2-3-3 and Cu-N2-3-4 are different than the rest of the tests (Figure 18a,c). The average particle size in Cu-N2-3-3 and Cu-N2-3-4 is reported to be ~2 µm higher than the rest of the tests (Figure 18a) and this reflects as 15–20 m/s lower particle velocities (Figure 18c), which is tested by a one-way analysis of variance. Therefore, in Cu-N2-3-3 and Cu-N2-3-4, the particle sample pool consists of larger particles resulting in lower velocities, which may not be representative of the actual particle stream. To confirm that the particle velocity in Cu-N2-3-3 and Cu-N2-3-4 are in fact different than the rest of the measurements, size dependent particle velocities must be compared. Plots in Figure 18d validate the process change resulting in lower particle velocities in Cu-N2-3-3 and Cu-N2-3-4 and the velocity difference appears to increase as the particle size increases. This thorough analysis provides a higher level of confidence in confirming that experiments Cu-N2-3-3 and Cu-N2-3-4 produced lower particle velocities than the rest of the experiments, which resulted in similar average size, average velocity, and size dependent velocity.
The example given here shows that the use of particle velocimetry systems that are capable of accurately measuring both particle size and velocity (e.g., Oseir HiWatch HR), is a viable method for both designing cold spray procedures and equipment and for daily system operations. Moreover, this study also shows that in-flight particle size measurements are an important component of spray diagnostics and bring confidence to particle velocity measurements. Arithmetic and volumetric mean particle size measured by optical microscopy for the Praxair Cu-159-03 powder were 18.5 and 22.4 µm, respectively, whereas the velocimetry measurements yield a mean size of approximately 30 µm, which means smaller particles are harder to realize. Therefore, the average velocity measurements given in Figure 17 and Figure 18 are not necessarily representative of the entire particle stream. Considering the size dependency of particle velocity (Figure 17d and Figure 18d), actual arithmetic and volumetric mean particle velocities are expected to be higher than those reported by the particle velocimeter measurements (Figure 17c and Figure 18c). This study also shows that to gain a deeper understanding of the entire particle stream, validated computational fluid dynamics simulations are needed.

4. Conclusions

In this study, particle sphericity is identified to have a very strong influence on both particle velocity and is identified as the major factor in the large velocity variability observed in particle velocimetry data. Furthermore, particle sphericity distribution is also shown to be dependent on particle size in gas atomized powders. The effects of particle sphericity on the final deposition efficiency and deposition properties are anecdotally known. However, the magnitude of its effect on the final particle velocity is not well understood. Therefore, for modeling purposes, particles are generally assumed to be spherical especially for mostly spherical gas atomized particles [22]. In industrial applications, particle size distribution is often used for quality control procedures and strictly regulated in many applications [44], while particle sphericity and its distribution are neglected. This study shows that particle sphericity cannot be ignored neither in modeling the cold spray process nor in quality control procedures. Validation of particle sphericity in cold spray will allow for the cold spray process to become more consistent and predictable. This is particularly important for load bearing applications such as structural component repairs [63,64,65] and additively manufacturing standalone structures [14,66,67]. The study also shows that, for particles larger than 10 µm, molecular slip is not a significant factor and most particles remain in the continuum flow regime ( K n < 0.01 ). Particles smaller than 10 µm, however, can experience slip and reduction in their velocity. This effect is not magnified in high pressure cold spray, though it is expected to have implications for low pressure cold spray and vacuum cold spray applications.
The 3D-CFD simulations were shown to be extremely useful for gaining a complete understanding of the entire particle stream by making sense of the velocimetry data and filling in the gaps in the particle velocimetry data. Validated models, such as those presented in this study, can be used to capture the flow behavior of the entire particle flow stream including smaller particles. These validated models can then be used for more accurately predicting the particle impact conditions and the material deposition footprint, which opens the gateway for further analysis into the ultimate mechanical properties of cold spray deposits by informing solid mechanics simulations [32,68].
Evaluation of the Oseir HiWatch HR1 particle velocimeter proves the importance of accurately measuring particle size along with particle velocity. Size distributions measured in Al6061-He, Al6061-N2, and Cu are shown to be different than the actual particle size distributions of the powders measured by optical microscopy. This shows that the entire particle stream may not be captured during in-flight measurements and the portion of the measured stream may change depending on the gas dynamic disturbances created due to spray conditions. However, the ability to generate accurate size versus velocity plots enable the comparison of model results to experiments. Moreover, the use of both in-flight particle size and velocity measurements allow for a simple but an effective way of conducting parametric studies for designing and testing cold spray equipment and procedures as well as carrying out rapid diagnostic measurements.

Author Contributions

Data curation, O.Ç.Ö.; Formal analysis, O.Ç.Ö.; Funding acquisition, O.Ç.Ö. and S.M.; Investigation, O.Ç.Ö.; Methodology, O.Ç.Ö.; Project administration, O.Ç.Ö. and S.M.; Validation, O.Ç.Ö.; Visualization, O.Ç.Ö. and J.M.C.; Writing—original draft, O.Ç.Ö.; Writing—review & editing, O.Ç.Ö., J.M.C. and S.M. All authors have read and agreed to the published version of the manuscript.

Funding

This work was funded in part by the U.S. Army Research Laboratory, Aberdeen, MD under the grant number W911NF-15-2-0026 and W911NF-20-2-0024. Any opinions, findings and conclusions or recommendations expressed in this material are those of the author(s) and do not necessarily reflect the views of the U.S. Government. This work was in part funded in part by Herrick Foundation, Detroit, MI, USA.

Acknowledgments

Authors would like to thank Kent Herrick in his support during the experiments conducted with the Spee3D cold spray system. Authors would also like to thank Samuel Boese (Northeastern University, Boston, MA, USA), Jay Sanchez (Northeastern University, Boston, MA, USA), and Robert Allegretto (VRC Metal Systems, Rapid City, SD, USA) in their support during the experiments conducted with the VRC cold spray system.

Conflicts of Interest

The authors declare no conflict of interest.

References

  1. Shaikh, F.Z.; Blair, H.D.; Tabaczynski, R.J.; Pan, T.Y. Gas-Dynamic Cold Spraying Lining for Aluminum Engine Block Cylinders. U.S. Patent Application No. US20020073982 A1, 20 June 2002. [Google Scholar]
  2. Britton, O.A. Repair of External Aircraft Panels and Surface Characterization of Cold Spray Depositions for Cold Spray/Epoxy Adhesion. Ph.D. Thesis, South Dakota School of Mines and Technology, Rapid City, SD, USA, 2013. [Google Scholar]
  3. Champagne, V. The repair of magnesium rotorcraft components by cold spray. J. Fail. Anal. Prev. 2008, 8, 164–175. [Google Scholar] [CrossRef]
  4. Faccoli, M.; Cornacchia, G.; Maestrini, D.; Marconi, G.P.; Roberti, R. Cold Spray Repair of Martensitic Stainless Steel Components. J. Therm. Spray Technol. 2014, 23, 1270–1280. [Google Scholar] [CrossRef]
  5. Ngai, S.; Ngai, T.; Vogel, F.; Story, W.; Thompson, G.B.; Brewer, L.N. Saltwater Corrosion Behavior of Cold Sprayed AA7075 Aluminum Alloy Coatings. Corros. Sci. 2018, 130, 231–240. [Google Scholar] [CrossRef]
  6. Widener, C.A.; Carter, M.J.; Ozdemir, O.C. Application of High-Pressure Cold Spray for an Internal Bore Repair of a Navy Valve Actuator. J. Therm. Spray Technol. 2016, 25, 193–201. [Google Scholar] [CrossRef]
  7. Champagne, V. (Ed.) The Cold Spray Materials Deposition Process: Fundamentals and Applications; Woodhead Publishing Limited: Cambridge, UK, 2007; pp. 1–362. [Google Scholar]
  8. Papyrin, A.; Kosarev, V.; Klinkov, S.; Alkhimov, A.; Fomin, V. (Eds.) Cold Spray Technology; Elsevier Limited: Oxford, UK, 2007; pp. 1–328. [Google Scholar]
  9. Villafuerte, J. (Ed.) Modern Cold Spray: Materials, Process, and Applications; Springer International Publishing AG: Cham, Switzerland, 2015. [Google Scholar]
  10. Kingsbury, A. Cheaper powders, faster build speeds, and no themal stresses? How AM is going supersonic at SPEE3D. Met. Addit. Manuf. 2020, 6, 111–120. [Google Scholar]
  11. Vo, P.; Martin, M. Build strategies for additive manufacturing by cold spray. In Cold Spray Action Team Meeting; Boston, MA, USA, 2017. [Google Scholar]
  12. Assadi, H.; Kreye, H.; Gartner, F.; Klassen, T. Cold Spraying-A Materials Perspective. Acta Mater. 2016, 116, 382–407. [Google Scholar] [CrossRef] [Green Version]
  13. Rokni, M.R.; Widener, C.A.; Ozdemir, O.C.; Crawford, G.A. Microstructure and mechanical properties of cold sprayed 6061 Al in As-sprayed and heat treated condition. Surf. Coat. Technol. 2017, 309, 641–650. [Google Scholar] [CrossRef]
  14. Sinclair-Adamson, R.; Luzin, V.; Duguid, A.; Kannorpatti, K.; Murray, R. Residual stress distributions in cold-Spray 3D-Printed parts. J. Therm. Spray Technol. 2020. [Google Scholar] [CrossRef]
  15. Koivuluoto, H.; Matikainen, V.; Larjo, J.; Vuoristo, P. Novel online diagnostic analysis for in-flight particle properties in cold spraying. J. Therm. Spray Technol. 2018, 27, 423–432. [Google Scholar] [CrossRef]
  16. Ozdemir, O.C.; Widener, C.A.; Carter, M.J.; Johnson, K.W. Predicting the effects of powder feeding rates on particle impact conditions and cold spray deposited coatings. J. Therm. Spray Technol. 2017, 26, 1598–1615. [Google Scholar] [CrossRef]
  17. Ozdemir, O.C.; Widener, C.A.; Helfritch, D.; Delfanian, F. Estimating the effect of helium and nitrogen mixing on deposition efficiency in cold spray. J. Therm. Spray Technol. 2016, 25, 660–671. [Google Scholar] [CrossRef]
  18. Koivuluoto, H.; Larjo, J.; Marini, D.; Pulci, G.; Marra, F. Cold-Sprayed Al6061 Coatings: Online spray monitoring and influence of process parameters on coating properties. Coatings 2020, 10, 348. [Google Scholar] [CrossRef] [Green Version]
  19. Nastic, A.; Jodoin, B. Evaluation of heat transfer transport coefficient for cold spray through computational fluid dynamics and particle in-flight temperature measurement using a high-speed IR camera. J. Therm. Spray Technol. 2018, 27, 1491–1517. [Google Scholar] [CrossRef]
  20. Suate, B.; Turgeon, S. In-Flight Velocity and Temperature Measurement of Cold Spray Particle Using High-Speed IR Camera. Available online: https://www.telops.com/ (accessed on 5 December 2019).
  21. USDOD. Materials deposition, cold spray. In Manufacturing Process Standard; U.S. DOD, U.S. Army Research Laboratory: Aberdeen Proving Ground, MD, USA, 2015. [Google Scholar]
  22. Assadi, H. On Parameter Selection in Cold Spraying. J. Therm. Spray Technol. 2011, 20, 1161–1176. [Google Scholar] [CrossRef]
  23. Schmidt, T. From Particle Acceleration to Impact and Bonding in Cold Spraying. J. Therm. Spray Technol. 2009, 18, 794–808. [Google Scholar] [CrossRef] [Green Version]
  24. Schmidt, T.; Gartner, F.; Assadi, H.; Kreye, H. Development of a generalized parameter window for cold spray deposition. Acta Mater. 2006, 54, 729–742. [Google Scholar] [CrossRef]
  25. Helfritch, D.; Champagne, V. A Model Study of Powder Particle Size Effects in Cold Spray Deposition; Army Research Lab: Aberdeen Proving Ground, MD, USA, 2008. [Google Scholar]
  26. Hassani-Gangaraj, M.; Veysset, D.; Champagne, V.K.; Nelson, K.A.; Schuh, C.A. Adiabatic shear instability is not necessary for adhesion in cold spray. Acta Mater. 2018, 158, 430–439. [Google Scholar] [CrossRef]
  27. Hassani-Gangaraj, M.; Veysset, D.; Nelson, K.A.; Schuh, C.A. In-situ observations of single micro-particle impact bonding. Scr. Mater. 2018, 145, 9–13. [Google Scholar] [CrossRef]
  28. Chen, Q.; Alizadeh, A.; Xie, W. High-strain-rate material behavior and adiabatic material instability in impact of micron scale Al-6061 particles. J. Therm. Spray Technol. 2018, 27, 641–653. [Google Scholar] [CrossRef]
  29. Lee, J.-H.; Loya, P.E.; Lou, J.; Thomas, E.L. Dynamic mechanical behavior of multilayer graphene via supersonic projectile penetration. Science 2014, 346, 1092–1096. [Google Scholar] [CrossRef]
  30. Lee, J.H.; Veysset, D.; Singer, J.P. High strain rate deformation of layered nanocomposites. Nat. Commun. 2012, 3, 1–9. [Google Scholar] [CrossRef] [Green Version]
  31. Xie, W.; Alizadeh-Dehkharghani, A.; Chen, Q. Dynamics and extreme plasticity of metallic microparticles in supersonic collisions. Sci. Rep. 2017, 7, 1–9. [Google Scholar] [CrossRef] [PubMed]
  32. Lin, E.; Chen, Q.; Ozdemir, O.C. Effects of interface bonding on the residual stresses in cold-sprayed Al-6061: A numerical investigation (Report). J. Therm. Spray Technol. 2019, 28, 472–483. [Google Scholar] [CrossRef]
  33. Yin, S.; Meyer, M.; Li, W.; Liao, H.; Lupoi, R. Gas flow, particle acceleration, and heat transfer in cold Spray: A review. J. Therm. Spray Technol. 2016, 25, 874–896. [Google Scholar] [CrossRef]
  34. Bouthier, L.-V.; Hachem, E. Analysis and comparisons of various models in cold spray simulations: Towards high fidelity simulations. arXiv 2020, arXiv:2008.07835. [Google Scholar]
  35. Alhulaifi, A. Numerical and Experimental Characterization of the Cold Spray Process. For Spraying Nano Particle Powders; South Dakota School of Mines and Technology: Rapid City, SD, USA, 2011; p. 187. [Google Scholar]
  36. Faizan-Ur-Rab, M.; Zahiri, S.; Masood, S.H.; Jahedi, M.; Nagarajah, R. Development of 3D multicomponent model for cold spray process using nitrogen and air. Coatings 2015, 5, 688–708. [Google Scholar]
  37. Samareh, B.; Dolatabadi, A. A three-dimensional analysis of the cold spray process: The effects of substrate location and shape. J. Therm. Spray Technol. 2007, 16, 634–642. [Google Scholar] [CrossRef]
  38. Ozdemir, O.C.; Widener, C.A. Influence of Powder Injection Parameters in High-Pressure Cold Spray. J. Therm. Spray Technol. 2017, 26, 1411–1422. [Google Scholar] [CrossRef]
  39. Liebersbach, P.; Foelsche, A.; Champagne, V.K.; Siopis, M.; Nardi, A.; Schmidt, D.P. CFD simulations of feeder tube pressure oscillations and prediction of clogging in cold spray nozzles. J. Therm. Spray Technol. 2020, 29, 400–412. [Google Scholar] [CrossRef]
  40. Pattison, J.; Celotto, S.; Khan, A.; O’Neill, W. Standoff distance and bow shock phenomena in the cold spray process. Surf. Coat. Technol. 2007, 202, 1443–1454. [Google Scholar] [CrossRef]
  41. Kiselev, S.; Kiselev, V.; Zaikovskii, V. Effect of gas flow swirling on coating deposition by the cold gas-dynamic spray method. J. Appl. Mech. Tech. Phys. 2012, 53, 207–217. [Google Scholar] [CrossRef]
  42. Ozdemir, O.; Chen, Q.; Muftu, S.; Champagne, V.J. Modeling the continuous heat generation in the cold spray coating process. J. Therm. Spray Technol. 2018, 28, 108–123. [Google Scholar] [CrossRef]
  43. Ozdemir, O.C. On the optimization and design of high pressure cold spray. In Mechanical Engineering Department; South Dakota School of Mines and Technology: Rapid City, SD, USA, 2017; p. 276. [Google Scholar]
  44. USDOD. Powders for Cold Spray Deposition. In Materials Deposition, Cold Spray; U.S. DOD, U.S. Army Research Laboratory: Aberdeen Proving Ground, MD, USA, 2018. [Google Scholar]
  45. Settles, G.S. Schlieren and Shadowgraph Techniques: Visualizing Phenomena in Transparent Media; Springer-Verlag Berlin Heidelberg: New York, NY, USA, 2001. [Google Scholar]
  46. Kaiser, S.; Salazar, V.; Hoops, A. Schlieren measurements in the round cylinder of an optically accessible internal combustion engine. Appl. Opt. 2013, 52, 10. [Google Scholar] [CrossRef]
  47. Bird, R.B.; Stewart, W.E.; Lightfoot, E.N. Transport. Phenomena, 2nd ed.; John Wiley and Sons, Inc.: New York, NY, USA, 2002. [Google Scholar]
  48. Anderson, J.D.J. Computational FLUID DYNAMICS: The Basics with Applications; McGraw-Hill Inc.: New York, NY, USA, 1995. [Google Scholar]
  49. Spotlight on Turbulence: STAR-CCM+ v11.06. 2016. Available online: https://steve.cd-adapco.com/articles/en_US/FAQ/Spotlight-on-Turbulence (accessed on 4 July 2017).
  50. Schiller, L.; Naumann, A. Uber die grundlegenden Berechnungen bei der Schwerkraftaufbereitung. Vdi Zeits 1933, 77, 318–320. [Google Scholar]
  51. Haider, A.; Levenspiel, O. Drag coefficient and terminal velocity of spherical and nonspherical particles. Powder Technol. 1989, 58, 63–70. [Google Scholar] [CrossRef]
  52. Tran-Cong, S.; Gay, M.; Michaelides, E.E. Drag coefficients of irregularly shaped particles. Powder Technol. 2004, 139, 21–32. [Google Scholar] [CrossRef]
  53. Blay Esteban, L. Dynamics of non-Spherical Particles in Turbulence; Springer: Berlin/Heidelberg, Germany, 2020. [Google Scholar]
  54. Cruz-Matiaz, I.; Ayala, D. Orientation, Sphericity and Roundness Evaluation of Particles Using Alternative 3D Representations; Universitat Politecnica de Catalunya: Barcelona, Spain, 2013. [Google Scholar]
  55. Ranz, W.E.; Marshall, W.R.J. Evaporation from Drops. Chem. Eng. Prog. 1952, 48, 141–146. [Google Scholar]
  56. Ranz, W.E.; Marshall, W.R.J. Evaporation from Drops: Part 2. Chem. Eng. Prog. 1952, 48, 173–180. [Google Scholar]
  57. Cengel, Y.A.; Cimbala, J.M. Fluid Mechanics: Fundamentals and Applications; McGraw Hill: New York, NY, USA, 2014. [Google Scholar]
  58. Peterson, H. The Properties of Helium: Density, Specific Heats, Viscosity, and Thermal Conductivity at Pressures from 1 to 100 bar and from Room Temperature to about 1800 K; Riso, D.A.E., Ed.; Danish Atomic Energy Commission: Copenhagen, Denmark, 1970; pp. 1–42.
  59. Martin, S.; Williams, J.R. Multiphase Flow Research; Nova Science Publishers, Inc.: Hauppauge, NY, USA, 2009. [Google Scholar]
  60. Rader, D. Momentum slip correction factor for small particles in nine common gases. J. Aerosol Sci. 1989, 21, 161–168. [Google Scholar] [CrossRef]
  61. Allen, M.D.; Raabe, O.G. Slip correction measurements of spherical solid aerosol particles in an improved millikan apparatus. Aerosol Sci. Technol. 1985, 4, 269–286. [Google Scholar] [CrossRef]
  62. STAR-CCM+ Release Notes v11.06. 2016. Available online: https://steve.cd-adapco.com/ (accessed on 4 July 2017).
  63. Birt, A.M.; Champagne, V.K., Jr.; Sisson, R.D., Jr.; Apelian, D. Microstructural analysis of Ti-6Al-4V powder for cold gas dynamic spray applications. Adv. Powder Technol. 2015, 26, 1335–1347. [Google Scholar] [CrossRef]
  64. Champagne, V., Jr.; Kaplowitz, D.; Champagne, V.K., III. Dissimilar metal joining and structural repair of ZE41A-T5 cast magnesium by the cold spray (CS) process. Mater. Manuf. Process. 2018, 33, 130–139. [Google Scholar] [CrossRef]
  65. Champagne, V.; Helfritch, D. Critical Assessment 11: Structural repairs by cold spray. Mater. Sci. Technol. 2015, 31, 627–634. [Google Scholar] [CrossRef]
  66. Bagherifard, S.; Monti, S.; Zuccoli, M.V.; Riccio, M.; Kondas, J.; Guagliano, M. Cold Spray deposition for additive manufacturing of freeform structural components compared to selective laser melting. Mater. Sci. Eng. A 2018, 721, 339–350. [Google Scholar] [CrossRef]
  67. Duguid, A. Materials & properties for additive cold spray. In Proceedings of the Cold Spray Action Team Meeting, Worcester, MA, USA, 25 June 2019. [Google Scholar]
  68. Lin, E.; Nault, I.; Champagne, V.K.; Nardi, A.; Müftü, S. Analysis of interface fracture of cold-sprayed coatings due to thermal cycling. J. Therm. Spray Technol. 2019, 29. [Google Scholar] [CrossRef]
Figure 1. (a) A sample optical microscope image of Praxair Cu-159-03 copper particles taken by a Zeiss Axioscope 7 optical microscope. (b) Binary plot of the same microscope image processed by a MATLAB code. Measured particles are circled in red. Particles at the outer edges of the microscope image are ignored.
Coatings 10 01254 g001
Figure 2. Operating principle of Schlieren imaging.
Coatings 10 01254 g002
Figure 3. A simplified representative sketch of the computational domain. Model regions are highlighted along with model boundaries and the adopted coordinate system. Velocimetry measurement field of view is also highlighted.
Coatings 10 01254 g003
Figure 4. Population and volume-based probability density (PD) and cumulative density (CD) are plotted for powder particles measured by high resolution optical microscopy (a) for Al6061 and (b) for Cu. The population based and volumetric distributions are compared with the population-based size distributions measured by the Oseir HiWatch particle velocimeter during cold spray experiments.
Coatings 10 01254 g004
Figure 5. Probability and cumulative distributions of particle sphericity as measured by high resolution optical microscopy are plotted with representative particle images for (a) aluminum and (b) copper powders independent of particle size.
Coatings 10 01254 g005
Figure 6. Size dependent particle sphericity measurements are plotted for (a) aluminum and (b) copper powders. Variability of particle sphericity depending on the particle size are plotted in 5 μm intervals with error bars representing plus or minus one standard deviations.
Coatings 10 01254 g006
Figure 7. Scanning electron microscope images of (a) Al6061 and (b) CP-Cu.
Coatings 10 01254 g007
Figure 8. Monochromatic contour plots of gas density fields taken at the center plane of the jet flow that intersects the jet axis from 3D-computational fluid dynamic (CFD) simulations with (a) a coarse mesh and (c) a mesh refined in the jet region for the Al6061-N2 case. Images (b,d) show the corresponding mesh density for the coarse and the refined mesh simulations with 1.9 and 4.6 million cells, respectively. The simulation outputs are compared with a schlieren image, (e), of the supersonic jet exiting a VRC NZZL0071 nozzle during experiments replicating the Al6061-N2 case. Lines with two arrowheads drawn on images (a,c,e) are of the same size and represent the nozzle outer diameter, which is used for scaling the images for a direct comparison. Dashed lines on images (a,d,e) represent the distinct location of the nozzle exit plane, transition of the expansion fans to oblique shock waves, and the transition of the oblique shock waves back to expansion waves from left to right, respectively. In image (f), gas density gradients from the high-resolution simulation, (c), are plotted with contour lines and the underexpanded jet characteristics that match the features captured in Schlieren images are labeled as informed from changes in the gas density. Gas density decreases across expansion waves and increases across oblique shock waves. Low density fields correlate with high Mach number flow regions.
Coatings 10 01254 g008
Figure 9. Plot of Mach number along the axis of the coarse and refined computational models for case Al6061-N2. Nondimensional axial distance is the ratio of the axial distance to the overall axial length of the model.
Coatings 10 01254 g009
Figure 10. Size dependent particle velocity as measured by the HiWatch particle velocimeter and predicted by CFD for (a) Al6061-He, (b) Al6061-N2, and (c) Cu-Air cases. Outputs from 3D-CFD simulations with perfectly spherical particle ( ψ = 1 ) assumption are provided in these plots. Velocity plots are from 1D-CFD simulations that were carried out by assuming particle sphericities of 0.6, 0.7, 0.8, 0.9, and 1.0 for all three cases.
Coatings 10 01254 g010
Figure 11. Probability distribution of particle flux given with respect to distance from the axis of the jet (z-direction as given in Figure 3) as measured from the HiWatch particle velocimeter, predicted using 3D-CFD with k-ω SST turbulence model, and predicted using 3D-CFD with the Large Eddy Simulation (LES) turbulence model. The data are plotted for (a) Al6061-He, (b) Al6061-N2, and (c) Cu-Air. 3D-CFD data are filtered to only include data for particles crossing the outlet boundary in the range of −0.2 mm < y < 0.2 mm.
Coatings 10 01254 g011
Figure 12. Size dependent average particle velocity and standard deviations are plotted using 5 µm intervals as measured/predicted from: HiWatch particle velocimeter; 3D-CFD simulations with realizable k-ω SST turbulence model and perfectly spherical particle assumption (CFD-k ω - ψ 1 ); 3D-CFD simulations with LES turbulence model and perfectly spherical particle assumption (CFD-LES- ψ 1 ); 3D-CFD simulations with realizable k-ω SST turbulence model and randomized particle sphericity assumption (CFD-k ω - ψ 2 ); and 3D-CFD simulations with realizable k-ω SST turbulence model and randomized particle sphericity assumption (CFD-LES- ψ 2 ). Figure 12ac are given for Al6061-He, Al6061-N2, and Cu-Air cases, respectively. Error in the model predictions with respect to the particle velocimetry measurements are plotted in (df) for Al6061-He, Al6061-N2, and Cu-Air cases, respectively. Outputs of simulations are filtered to −0.2 mm < y < 0.2 mm to correspond with the actual velocity measurement region Figure 3.
Coatings 10 01254 g012
Figure 13. Size dependent particle velocity data from a HiWatch particle velocimeter compared with 3D-CFD simulations with the perfectly spherical particle assumption ( ψ 1 ) and the data driven particle sphericity definition ( ψ 3 ). Data from the measurement plane corresponding to the velocimeter measurement region (Figure 3) is plotted in (ac) for Al6061-He, Al6061-N2, and Cu-Air cases, respectively. Moving average and standard deviation of velocity given in (ac) are plotted at 5 μm intervals in (df), respectively. The error in CFD predictions with respect to the velocimeter data shown in (df) are plotted in (gi), respectively.
Coatings 10 01254 g013
Figure 14. Raw particle velocimetry data are plotted along with its moving average and standard deviations at 5 µm particle size intervals in (ac) for Al6061-He, Al6061-N2, and Cu-Air cases, respectively. Predictions from 1D-CFD models with spherical particle assumption ( ψ 1 ) and data driven particle sphericities ( ψ 3 ) are plotted in Figure 6. Velocity error bars for 1D-CFD- ψ 3 are calculated by predicting the velocity of particles with sphericities given by standard deviations plotted in Figure 6.
Coatings 10 01254 g014
Figure 15. (a) Knudsen numbers and (b) Cunningham correction factors are plotted for 1, 10, 30, and 50 µm particles traveling along the axis of the flow from particle injection to the measurement plane for Al6061-He.
Coatings 10 01254 g015
Figure 16. Particle velocity predictions are plotted for the Al6061-He case from simulations that use the size dependent particle velocity data ( ψ 3 ) at 25 mm downstream of the VRC nozzle NZZL0071. Two simulations that exclude and include the Cunningham correction factor are compared. The percent difference between the two velocity curves is also plotted.
Coatings 10 01254 g016
Figure 17. Results from in-flight particle velocimetry measurements for Cu-N2-1, Cu-N2-2, Cu-N2-3, and Cu-N2-4. Average particle size and cumulative particle size distributions are plotted in (a) and (b), respectively. Average particle velocity measurements are plotted in (c) with error bars representing one standard deviation. In-flight measurements of particle size and velocity were averaged in 5 µm particle size intervals and are plotted in (d).
Coatings 10 01254 g017
Figure 18. Results from in-flight particle velocimetry measurements for Cu-N2-3-1 to Cu-N2-3-6. Average particle size and cumulative particle size distributions are plotted in (a,b), respectively. Average particle velocity measurements are plotted in (c) with error bars representing one standard deviation. In-flight measurements of particle size and velocity were averaged in 5 µm particle size intervals and are plotted in (d) for all six cases.
Coatings 10 01254 g018
Table 1. Experimental conditions during particle velocimetry measurements.
Case IdentificationAl6061-N2Al6061-HeCu-Air
Cold Spray SystemVRC Metal Systems
Gen III
VRC Metal Systems
Gen III
SPEE3D LightSPEE3D
NozzleNZZL 0071NZZL 0071Standard
PowderValimet AM6061 Powder Modified per MIL-DTL-32495A [44]Valimet AM6061 Powder Modified per MIL-DTL-32495A [44]Praxair
Cu-159-3
Gas Pressure (bar)653530
Gas Temperature (°C)425400500
Standoff Distance (mm)252524
Powder Feed Rate (g/min)4.14.120 g/min
Table 2. Experimental conditions for evaluation of particle velocimetry as a diagnostic tool.
Case IdentificationCold Spray SystemNozzlePowderGas Pressure (bar)Gas Temperature (°C)Powder Feed Rate (g/min)
Cu-N2-1VRC Gen IIINZZL 0058Praxair Cu-159-34025210.7
Cu-N2-2VRC Gen IIINZZL 0058Praxair Cu-159-35036810.7
Cu-N2-3VRC Gen IIINZZL 0058Praxair Cu-159-36048410.7
Cu-N2-4VRC Gen IIINZZL 0058Praxair Cu-159-36560010.7
Cu-N2-3-1:6VRC Gen IIINZZL 0058Praxair Cu-159-36048410.7
Table 3. Hot and cold inlet continuous (Fluid) phase boundary conditions.
Case IdentificationAl6061-N2Al6061-HeCu-Air
Hot Inlet Pressure (bar)653530
Hot Inlet Temperature (K)688673773
Hot Inlet Mass Flow Rate (kg/s)2.19 × 10−2 4.91 × 10⁻³ 1.37 × 10⁻²
Cold Inlet Pressure (bar)653530
Cold Inlet Temperature (K)300300300
Cold Inlet Mass Flow Rate (kg/s)2.35 × 10−34.00 × 10−47.06 × 10⁻⁴
Powder Feed Rate (g/min)4.14.120
Publisher’s Note: MDPI stays neutral with regard to jurisdictional claims in published maps and institutional affiliations.

