Effect of Rb+ Doping on Tunable Luminescence in Yb3+/Er3+–Y2O3 Film

 ,
,
Abstract
:
1. Introduction
2. Experimental Details
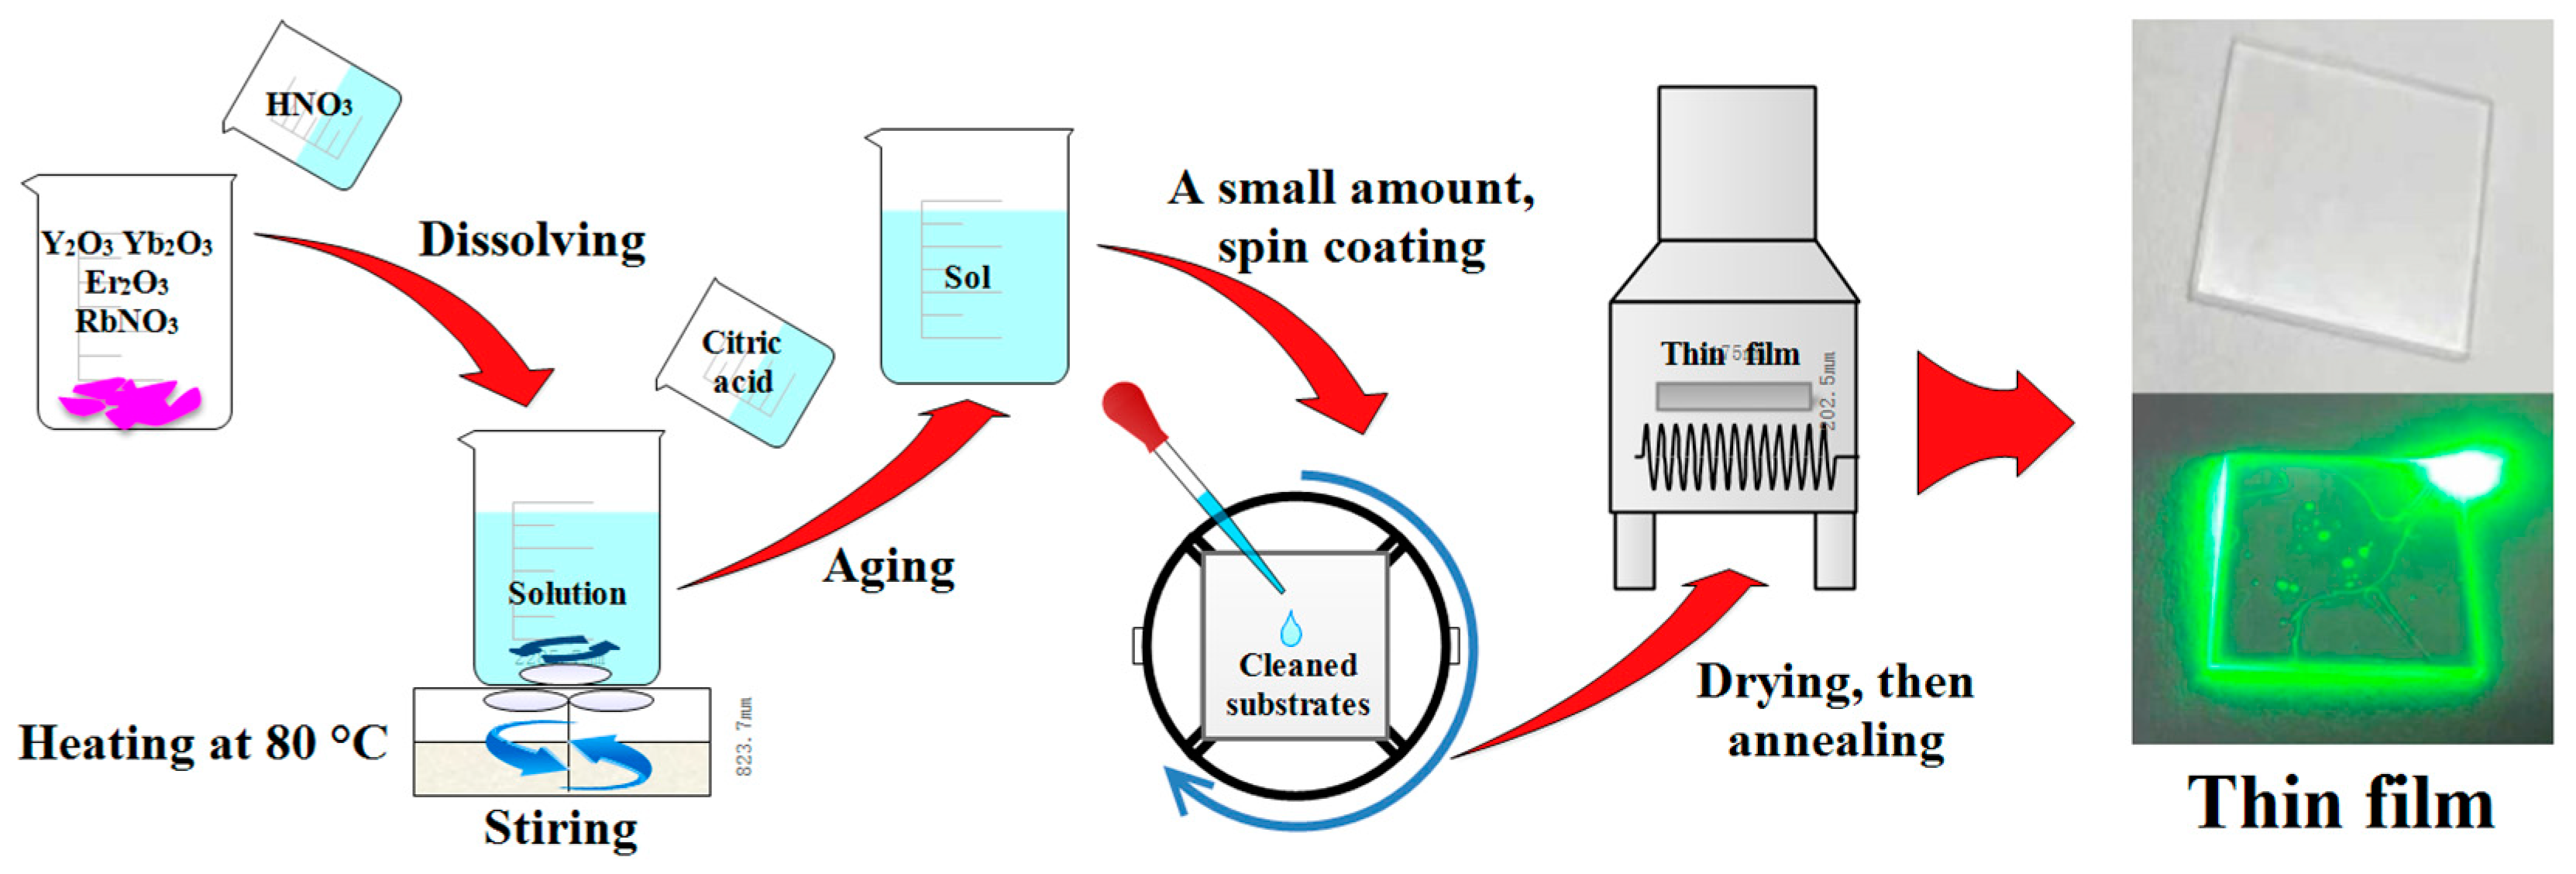
2.1. Preparation
2.2. Characterization
3. Results and Discussion
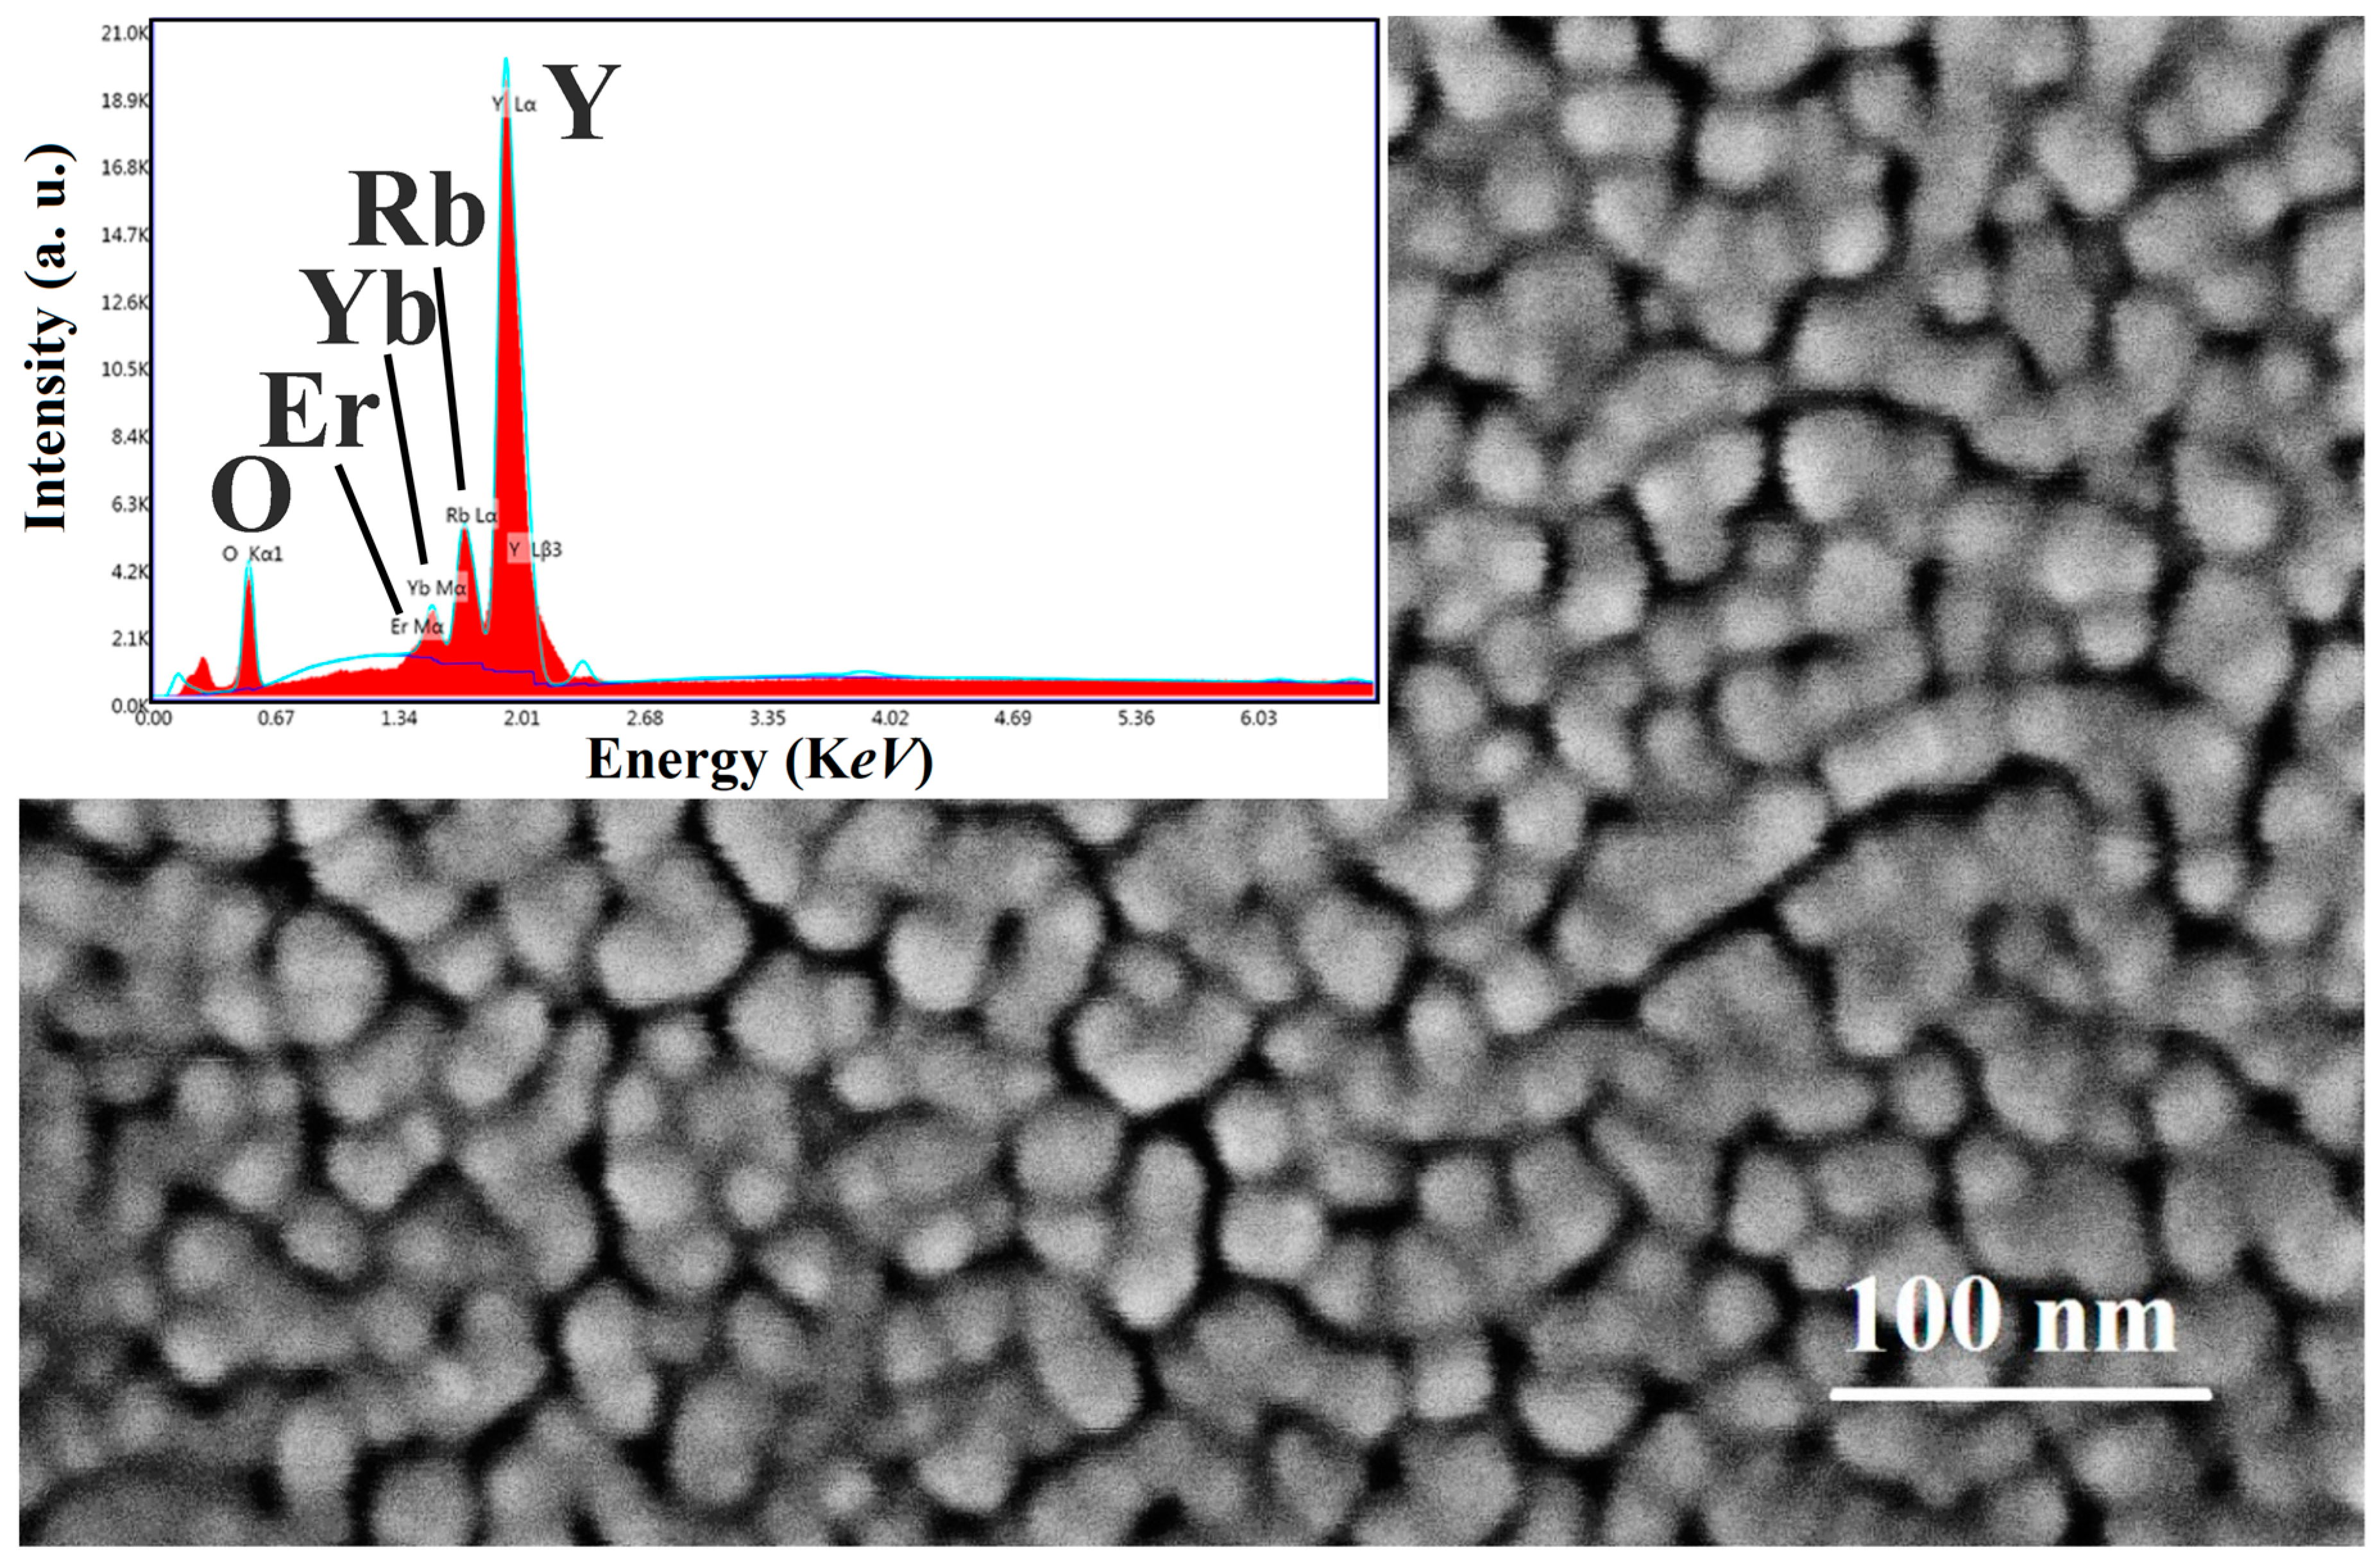
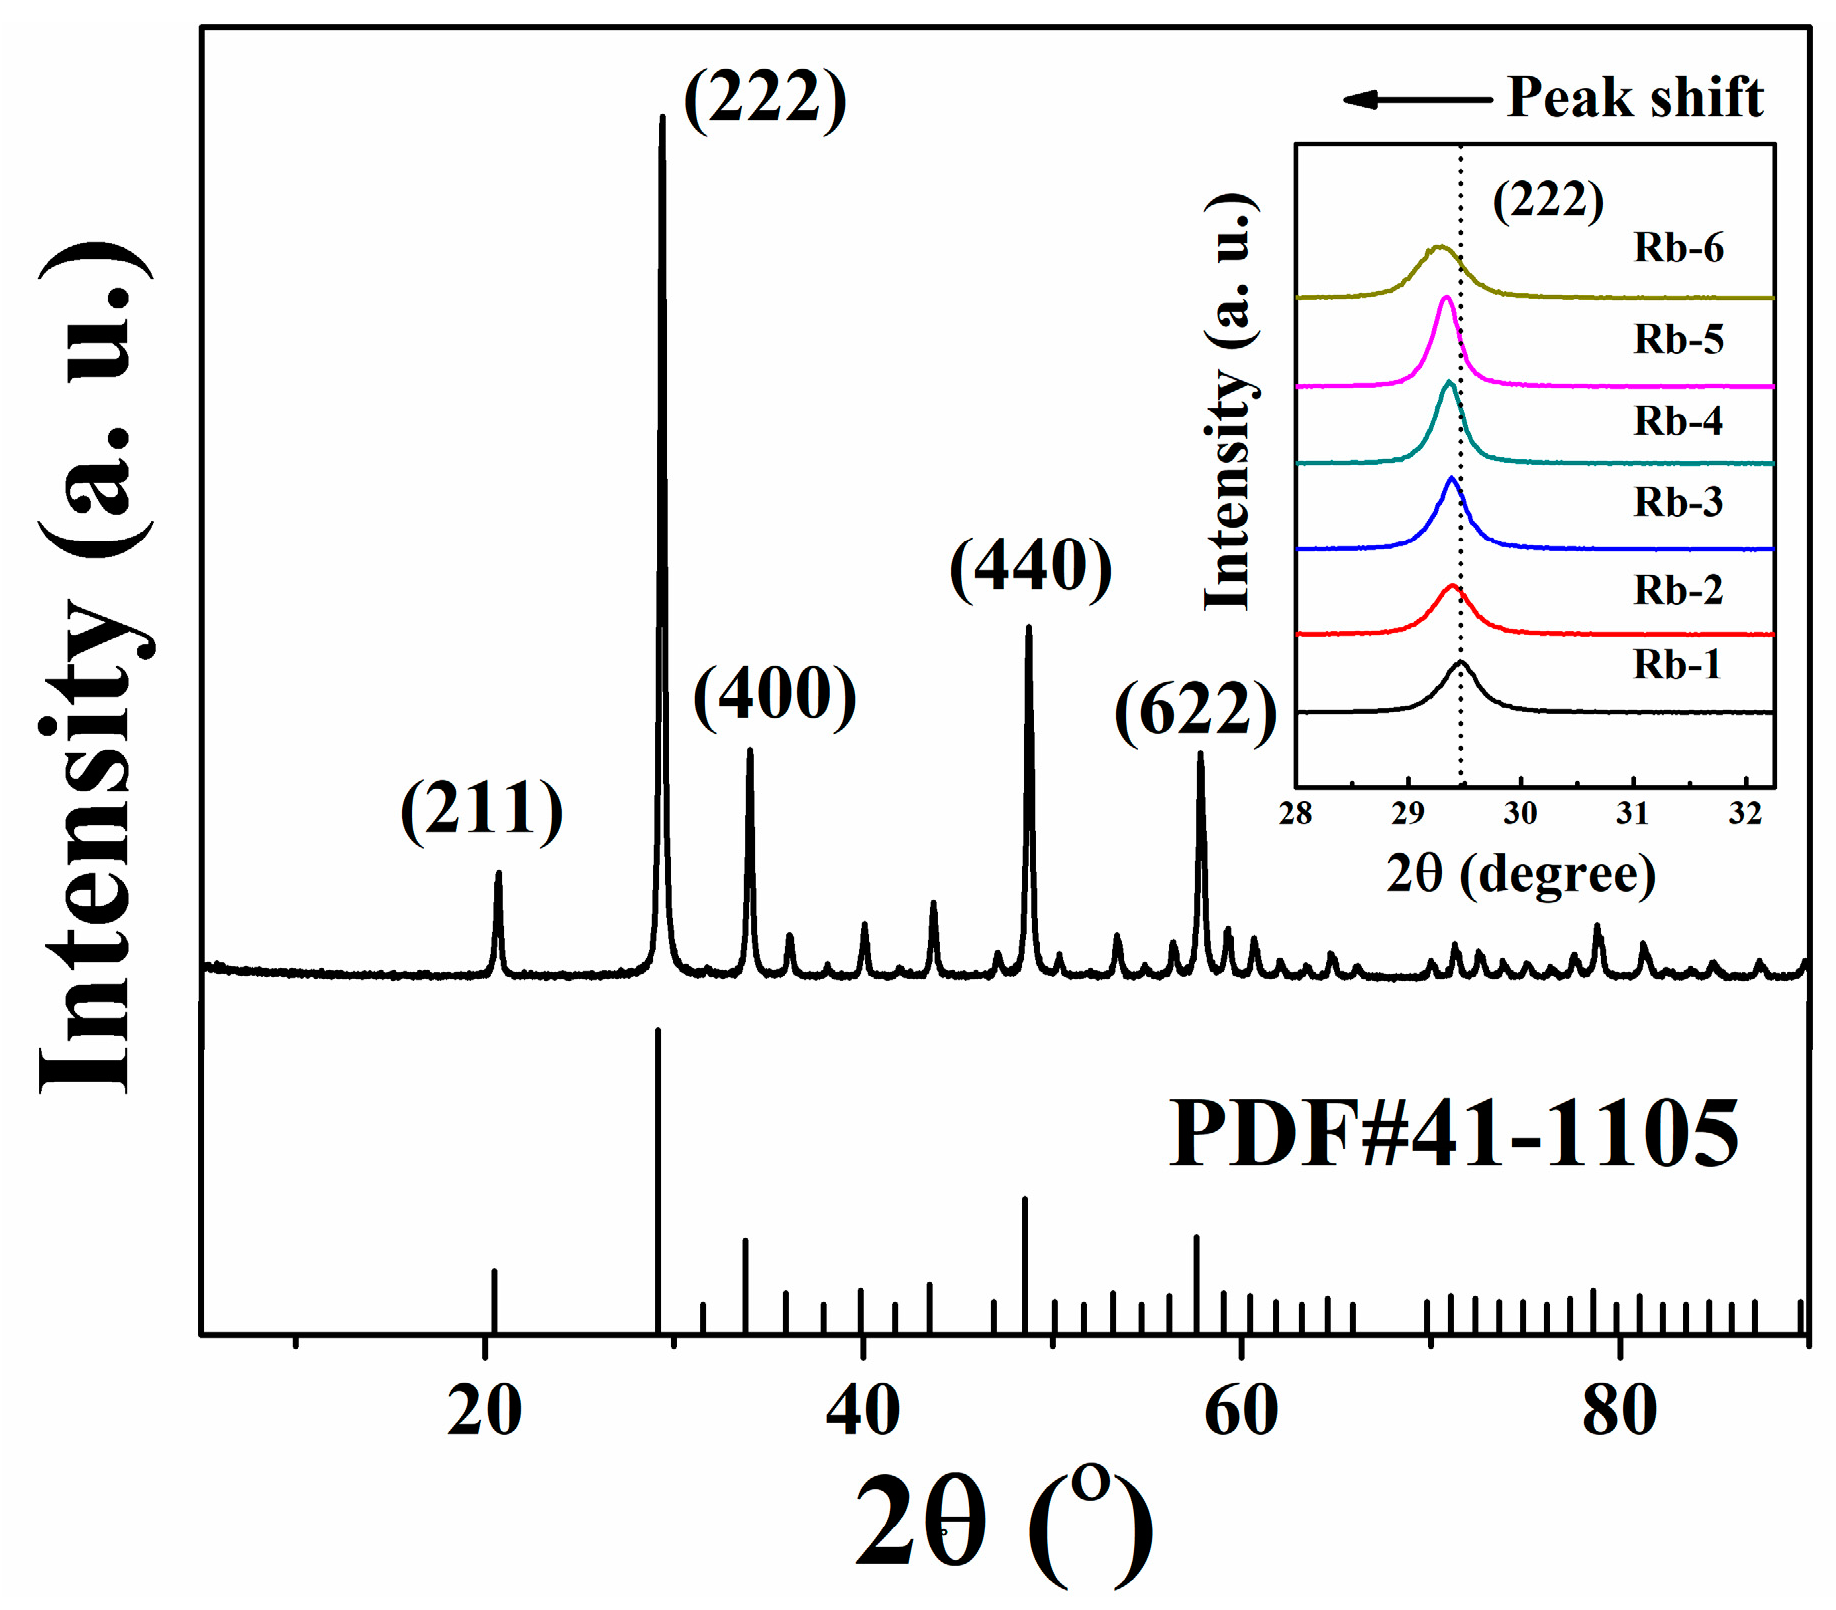
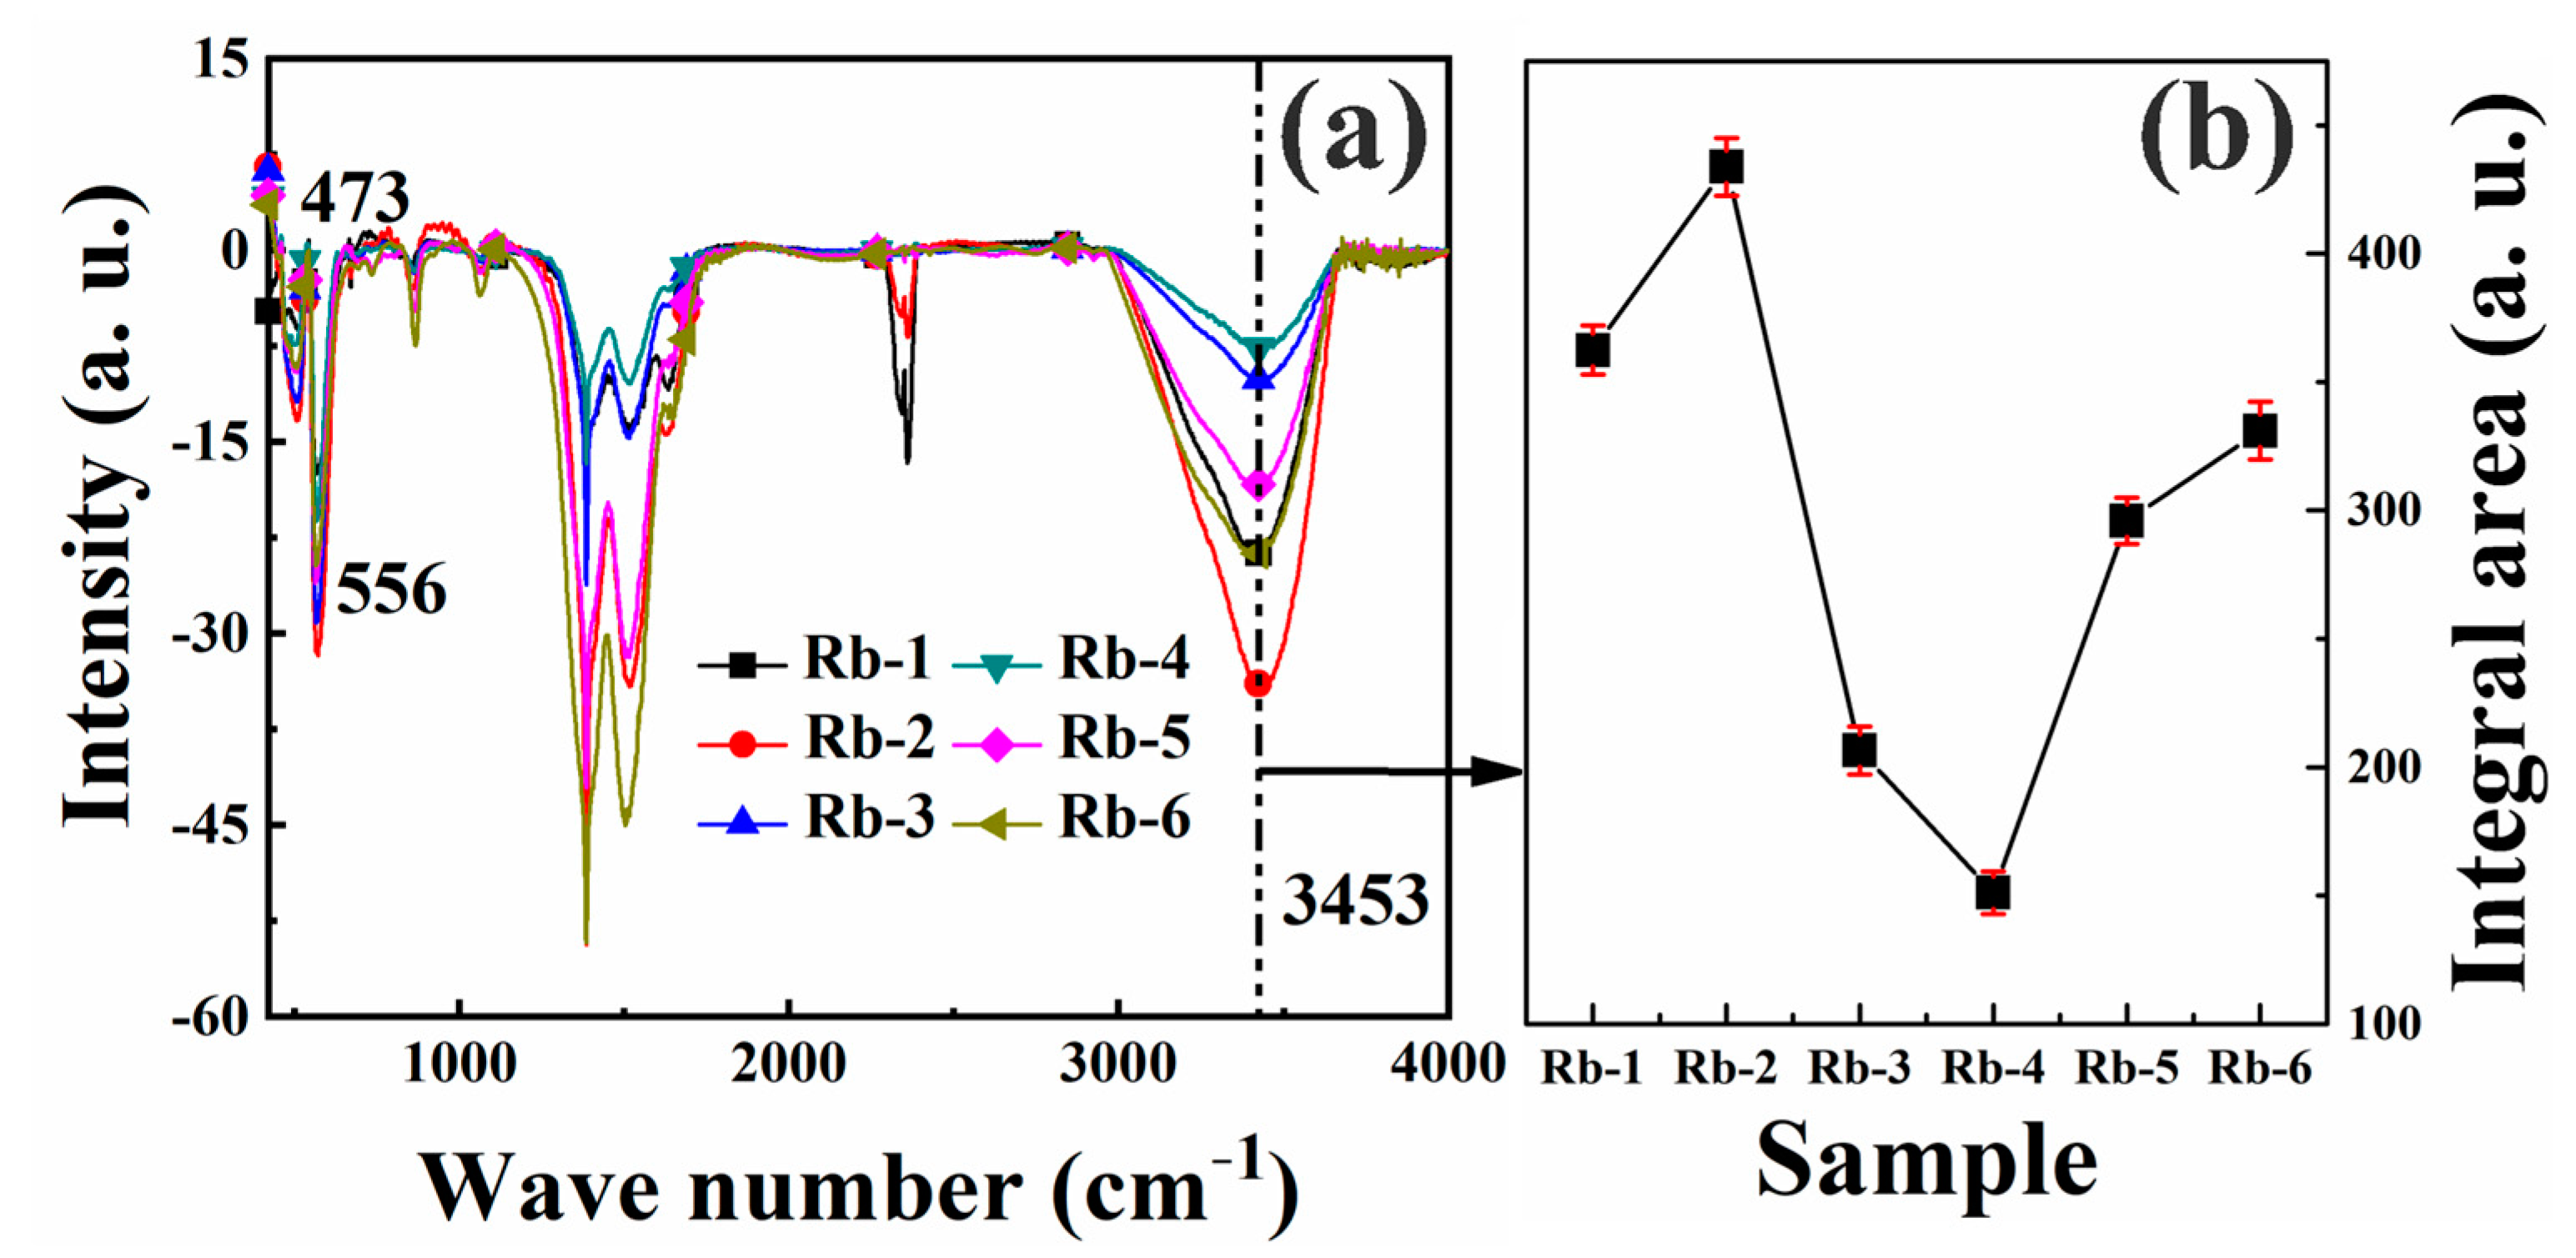
3.1. Phase Components and Structure
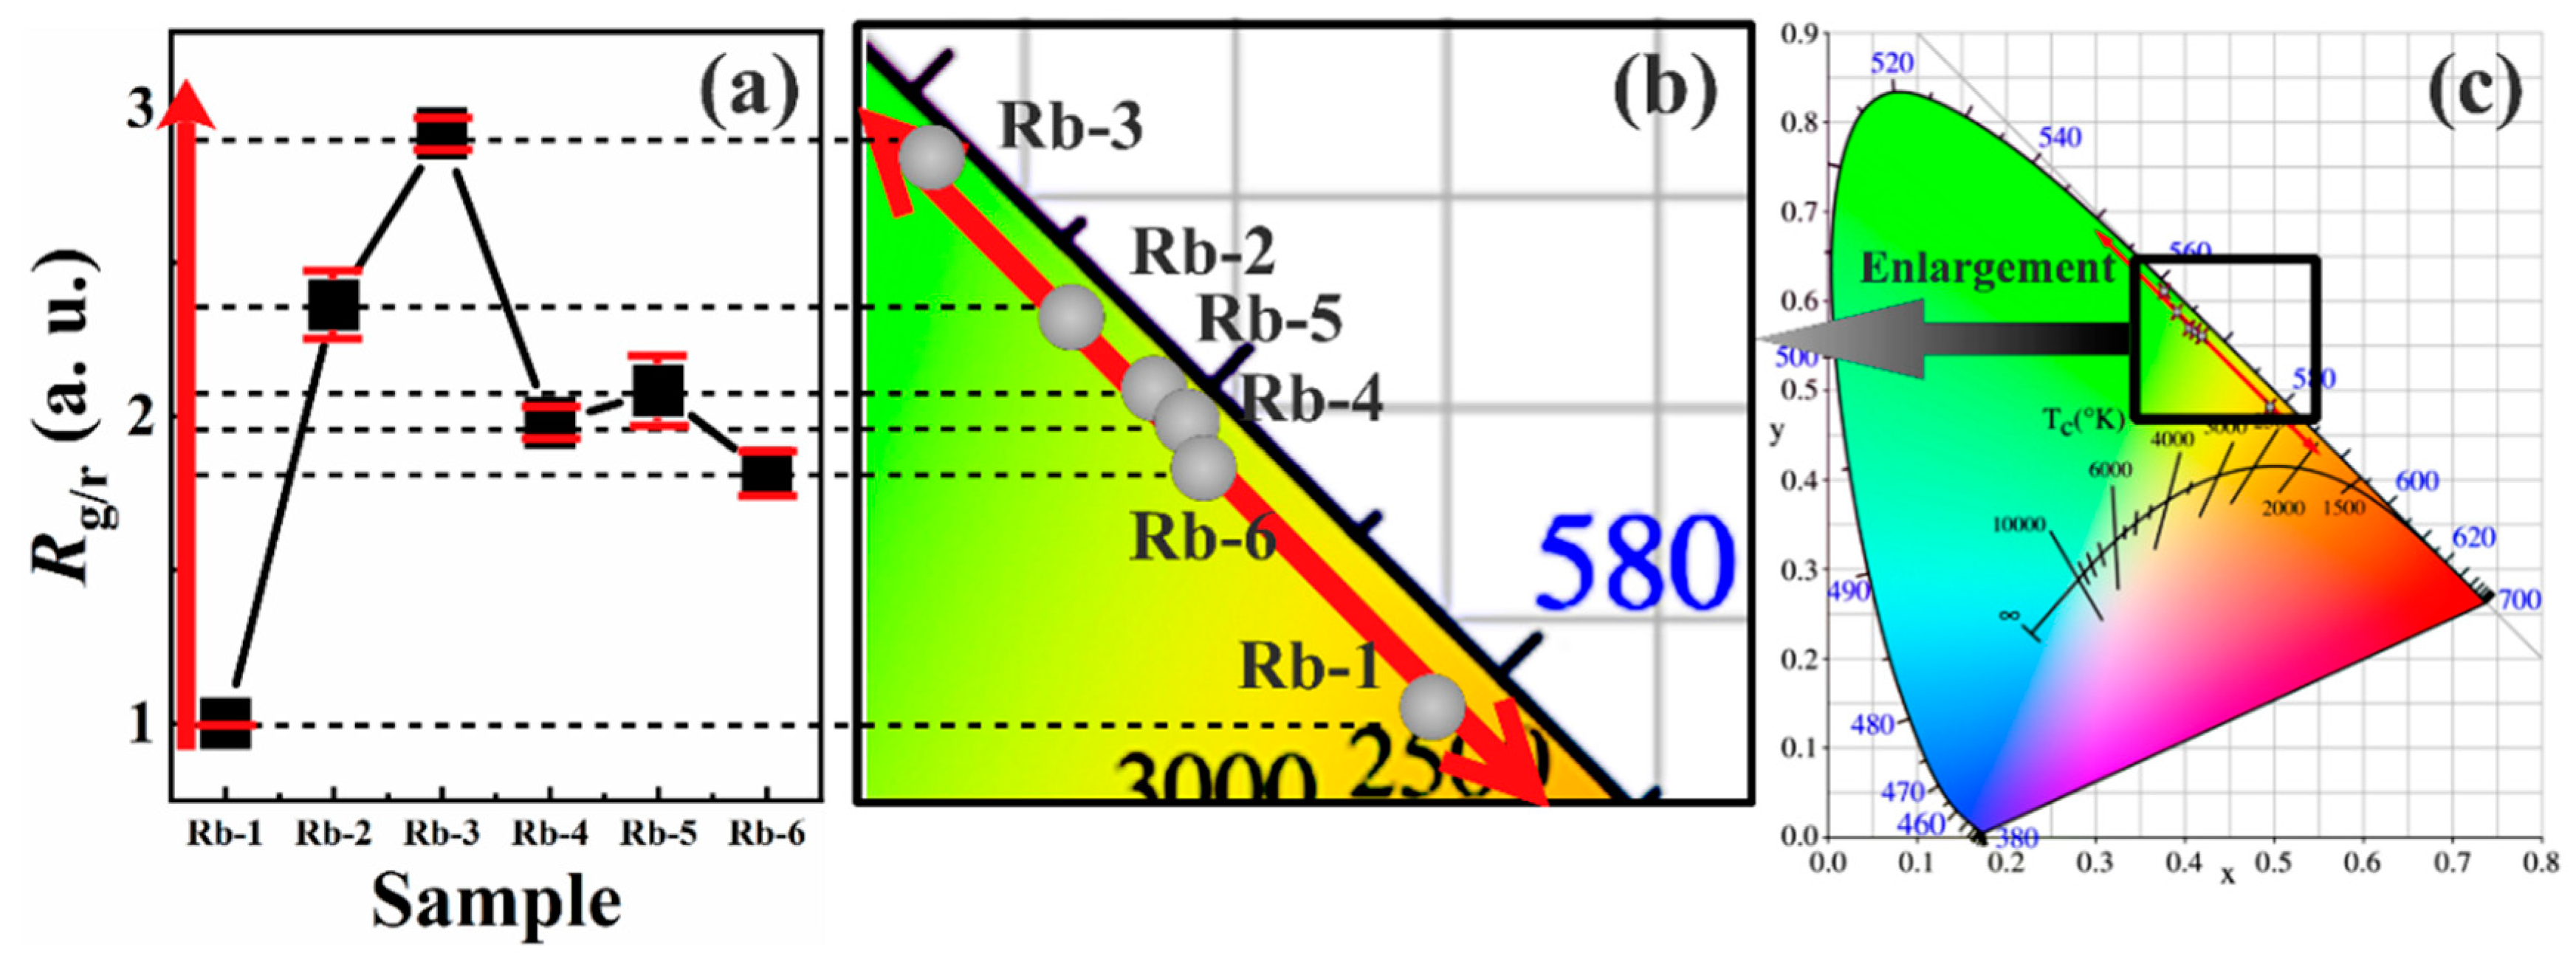
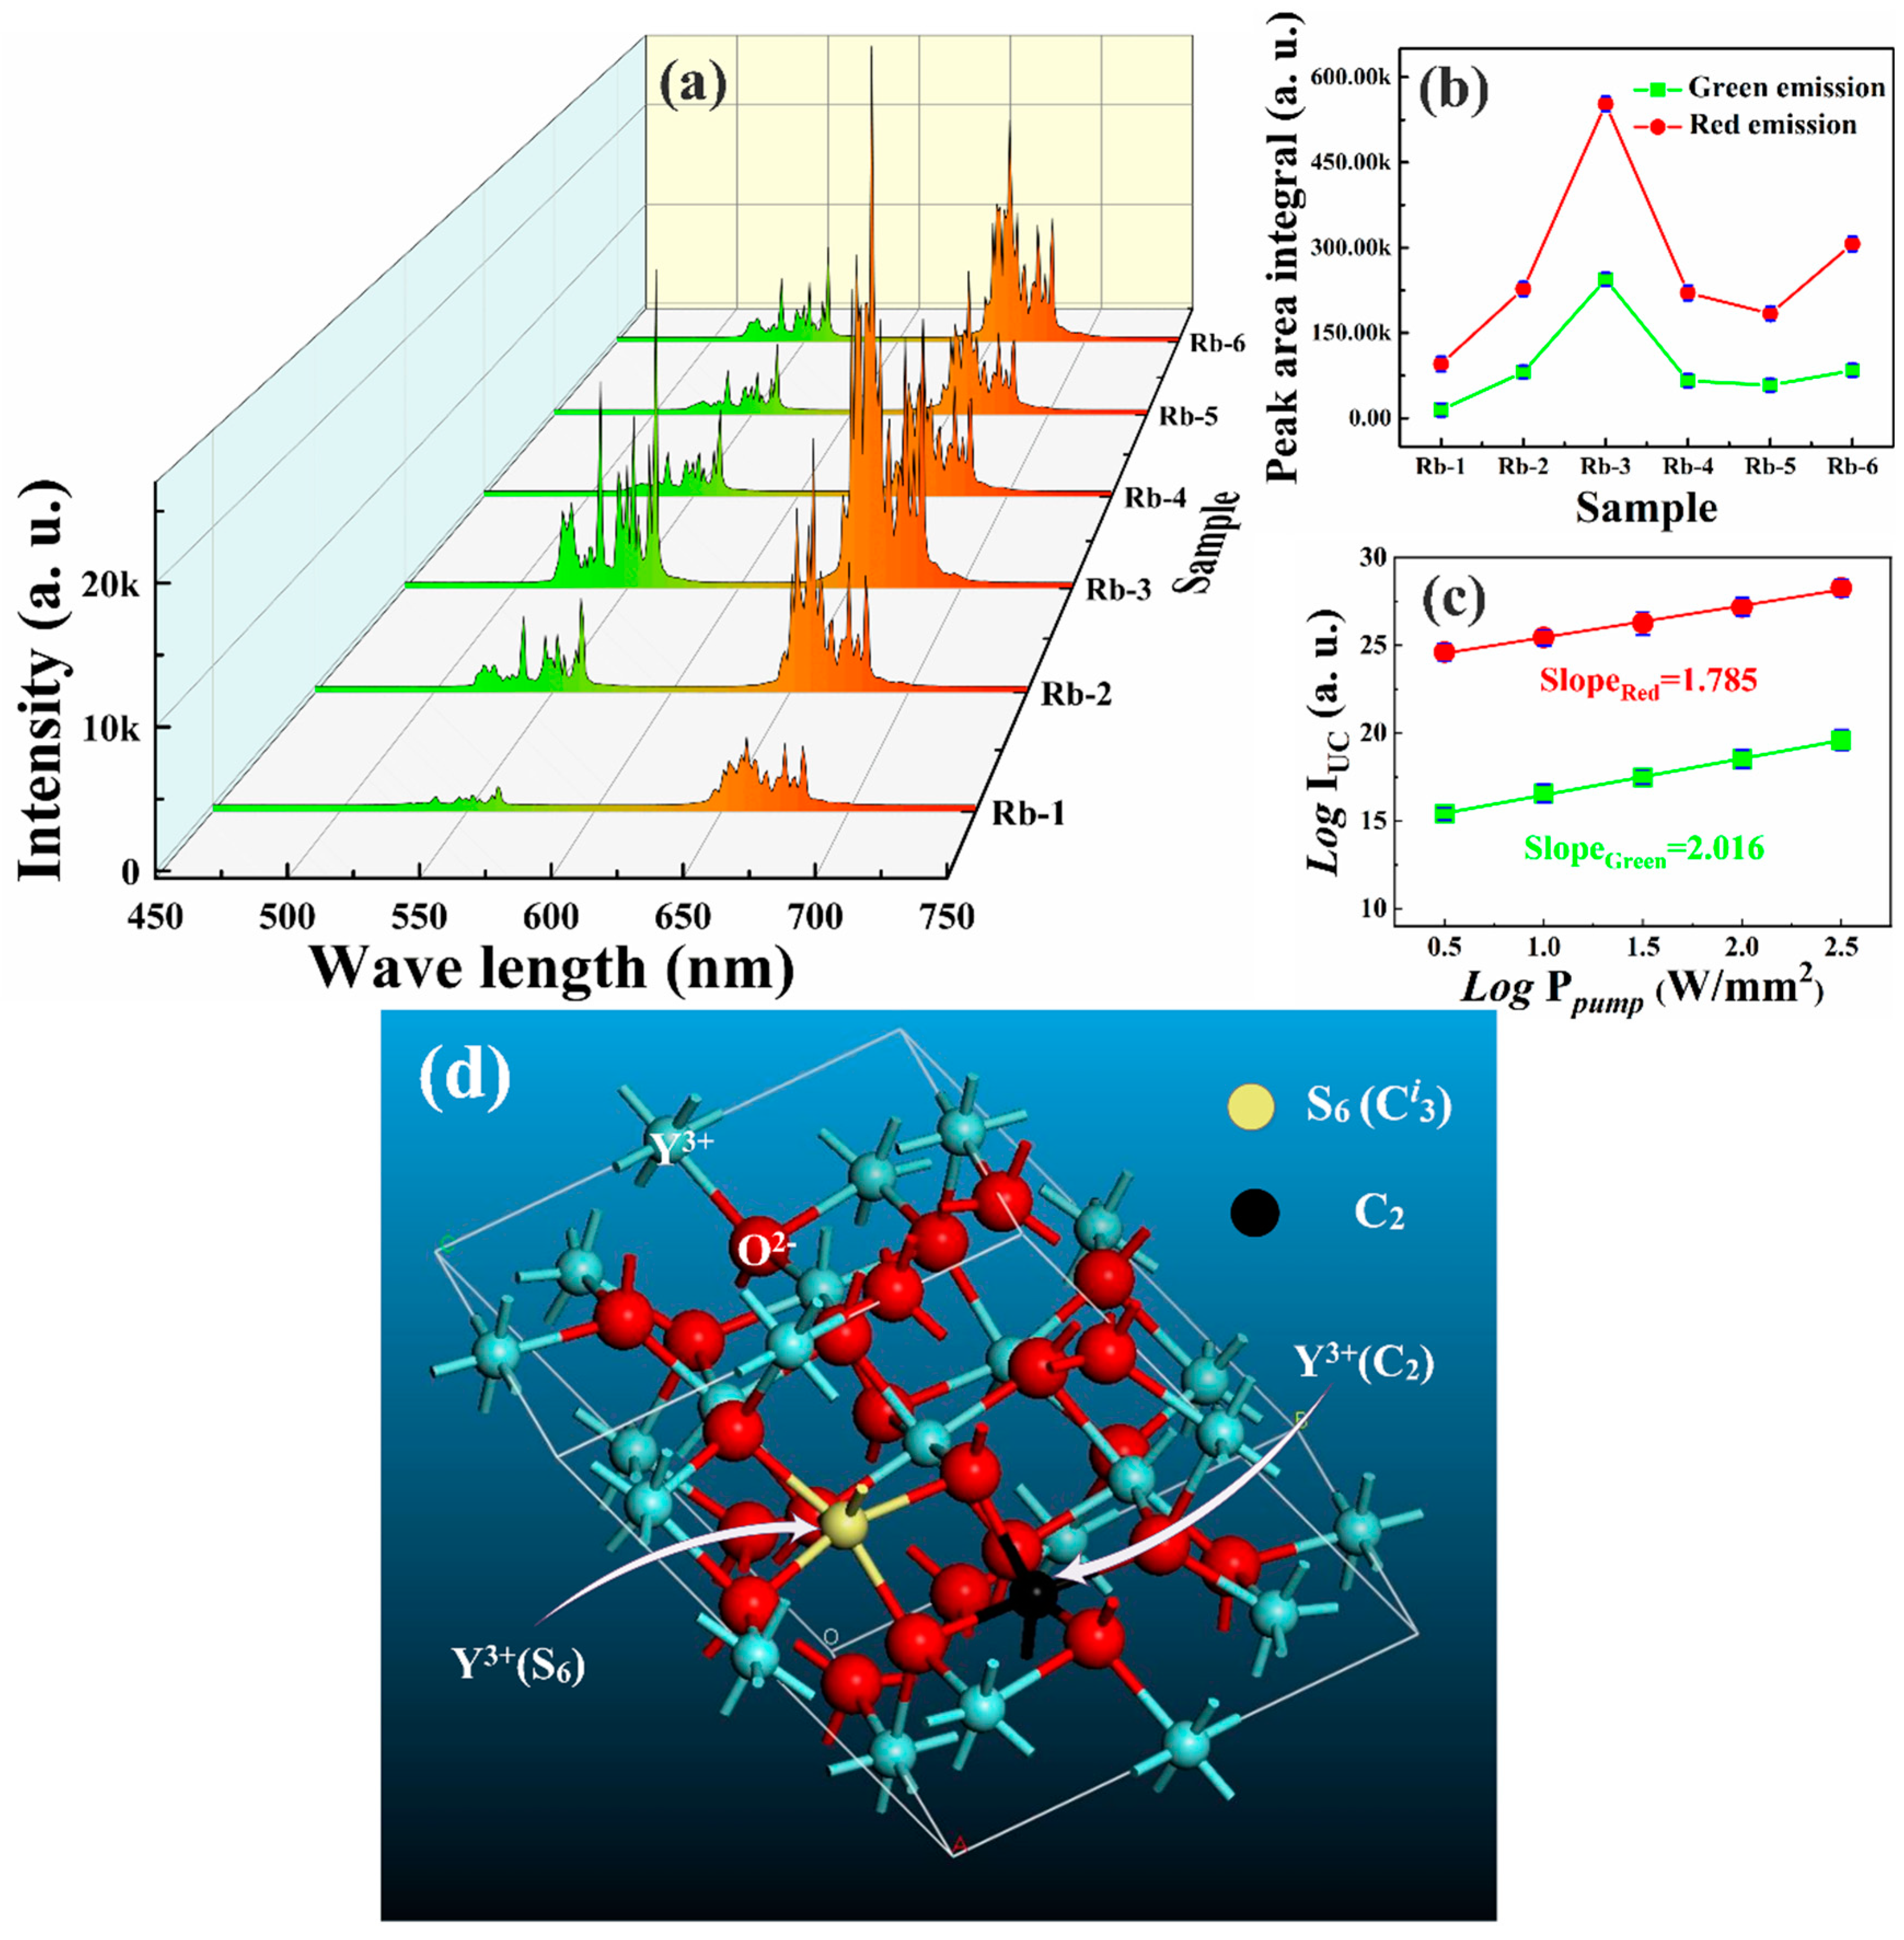
3.2. PL Luminescence
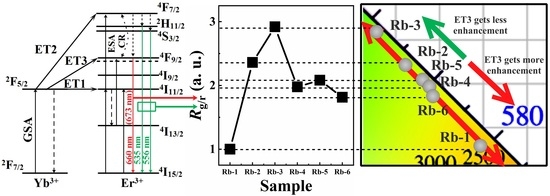
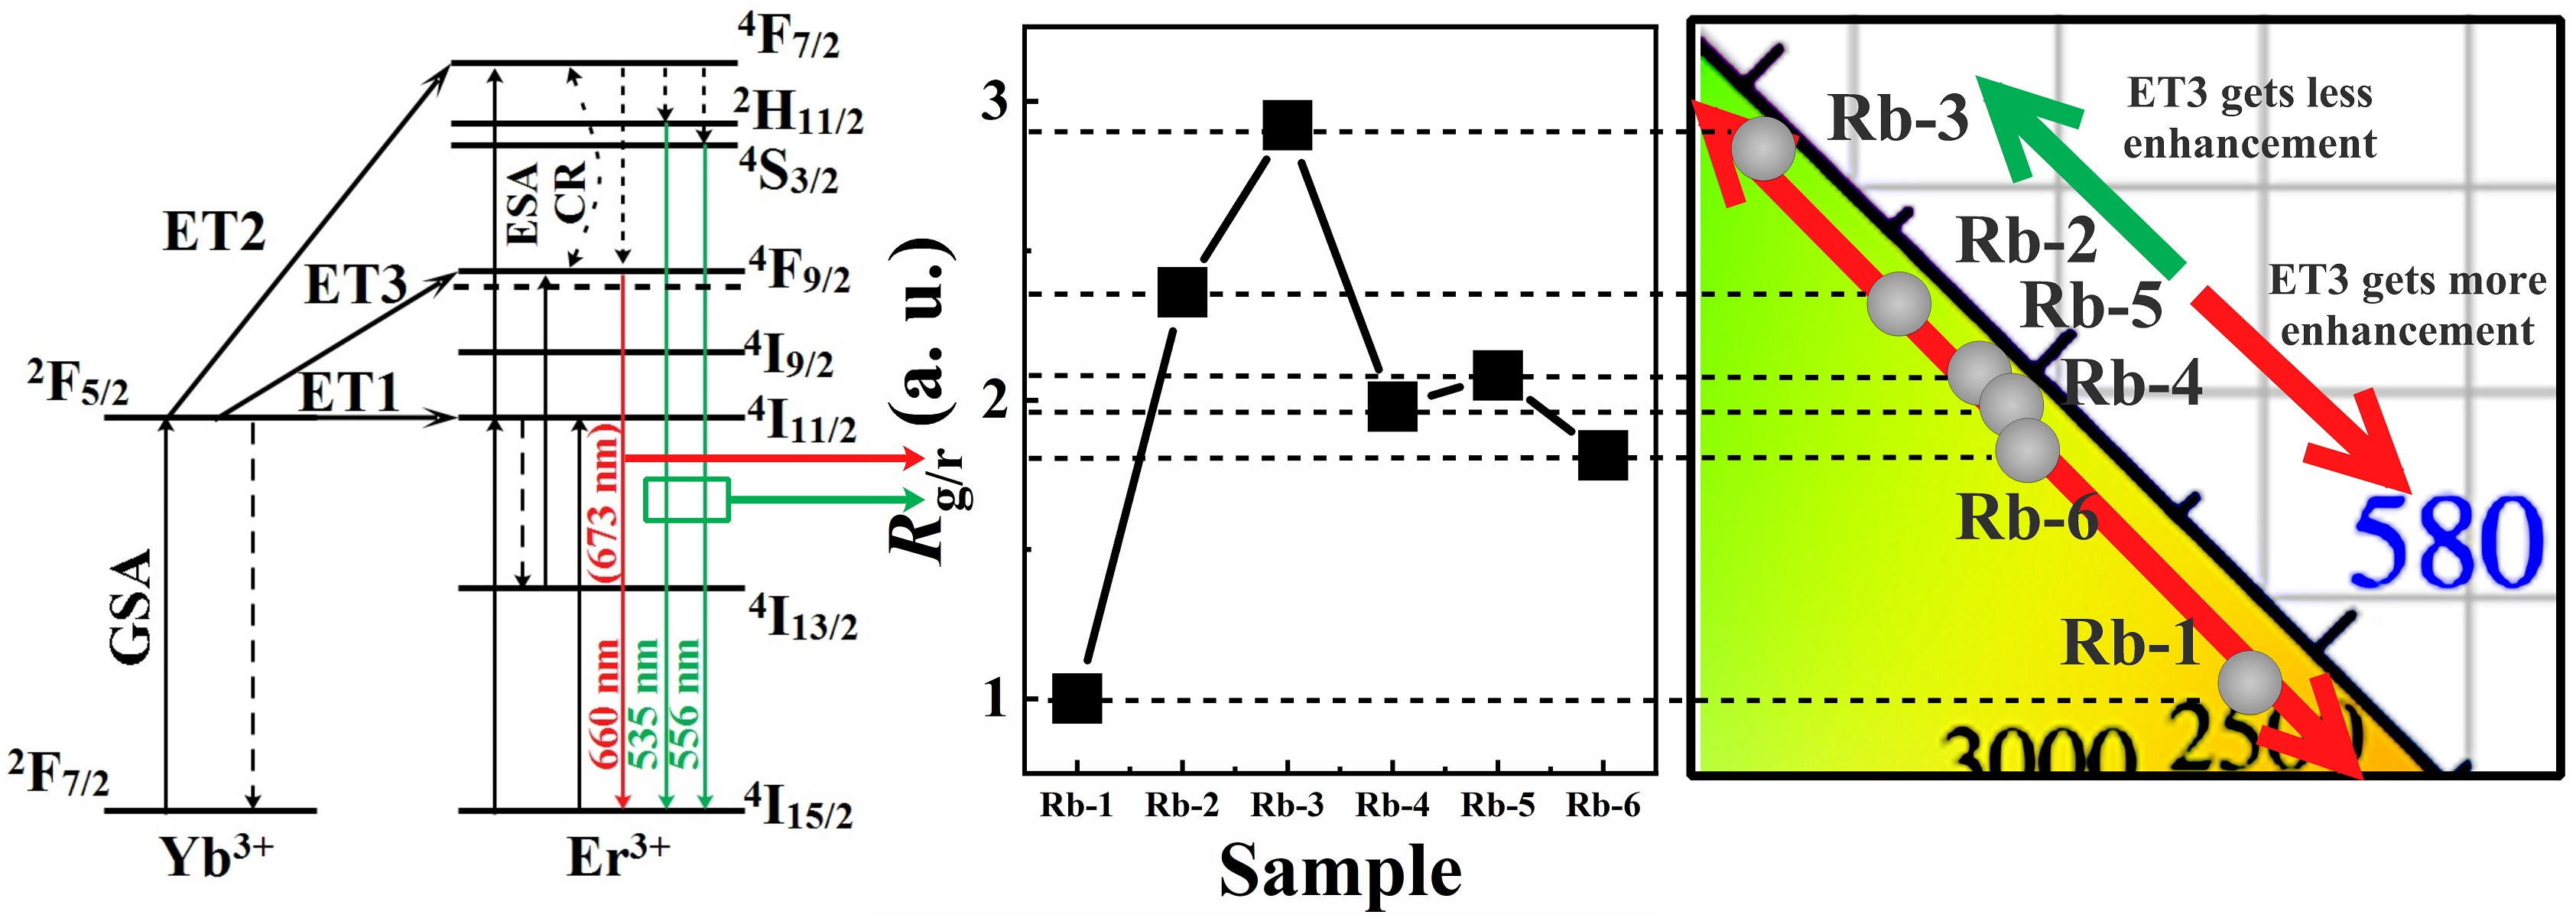
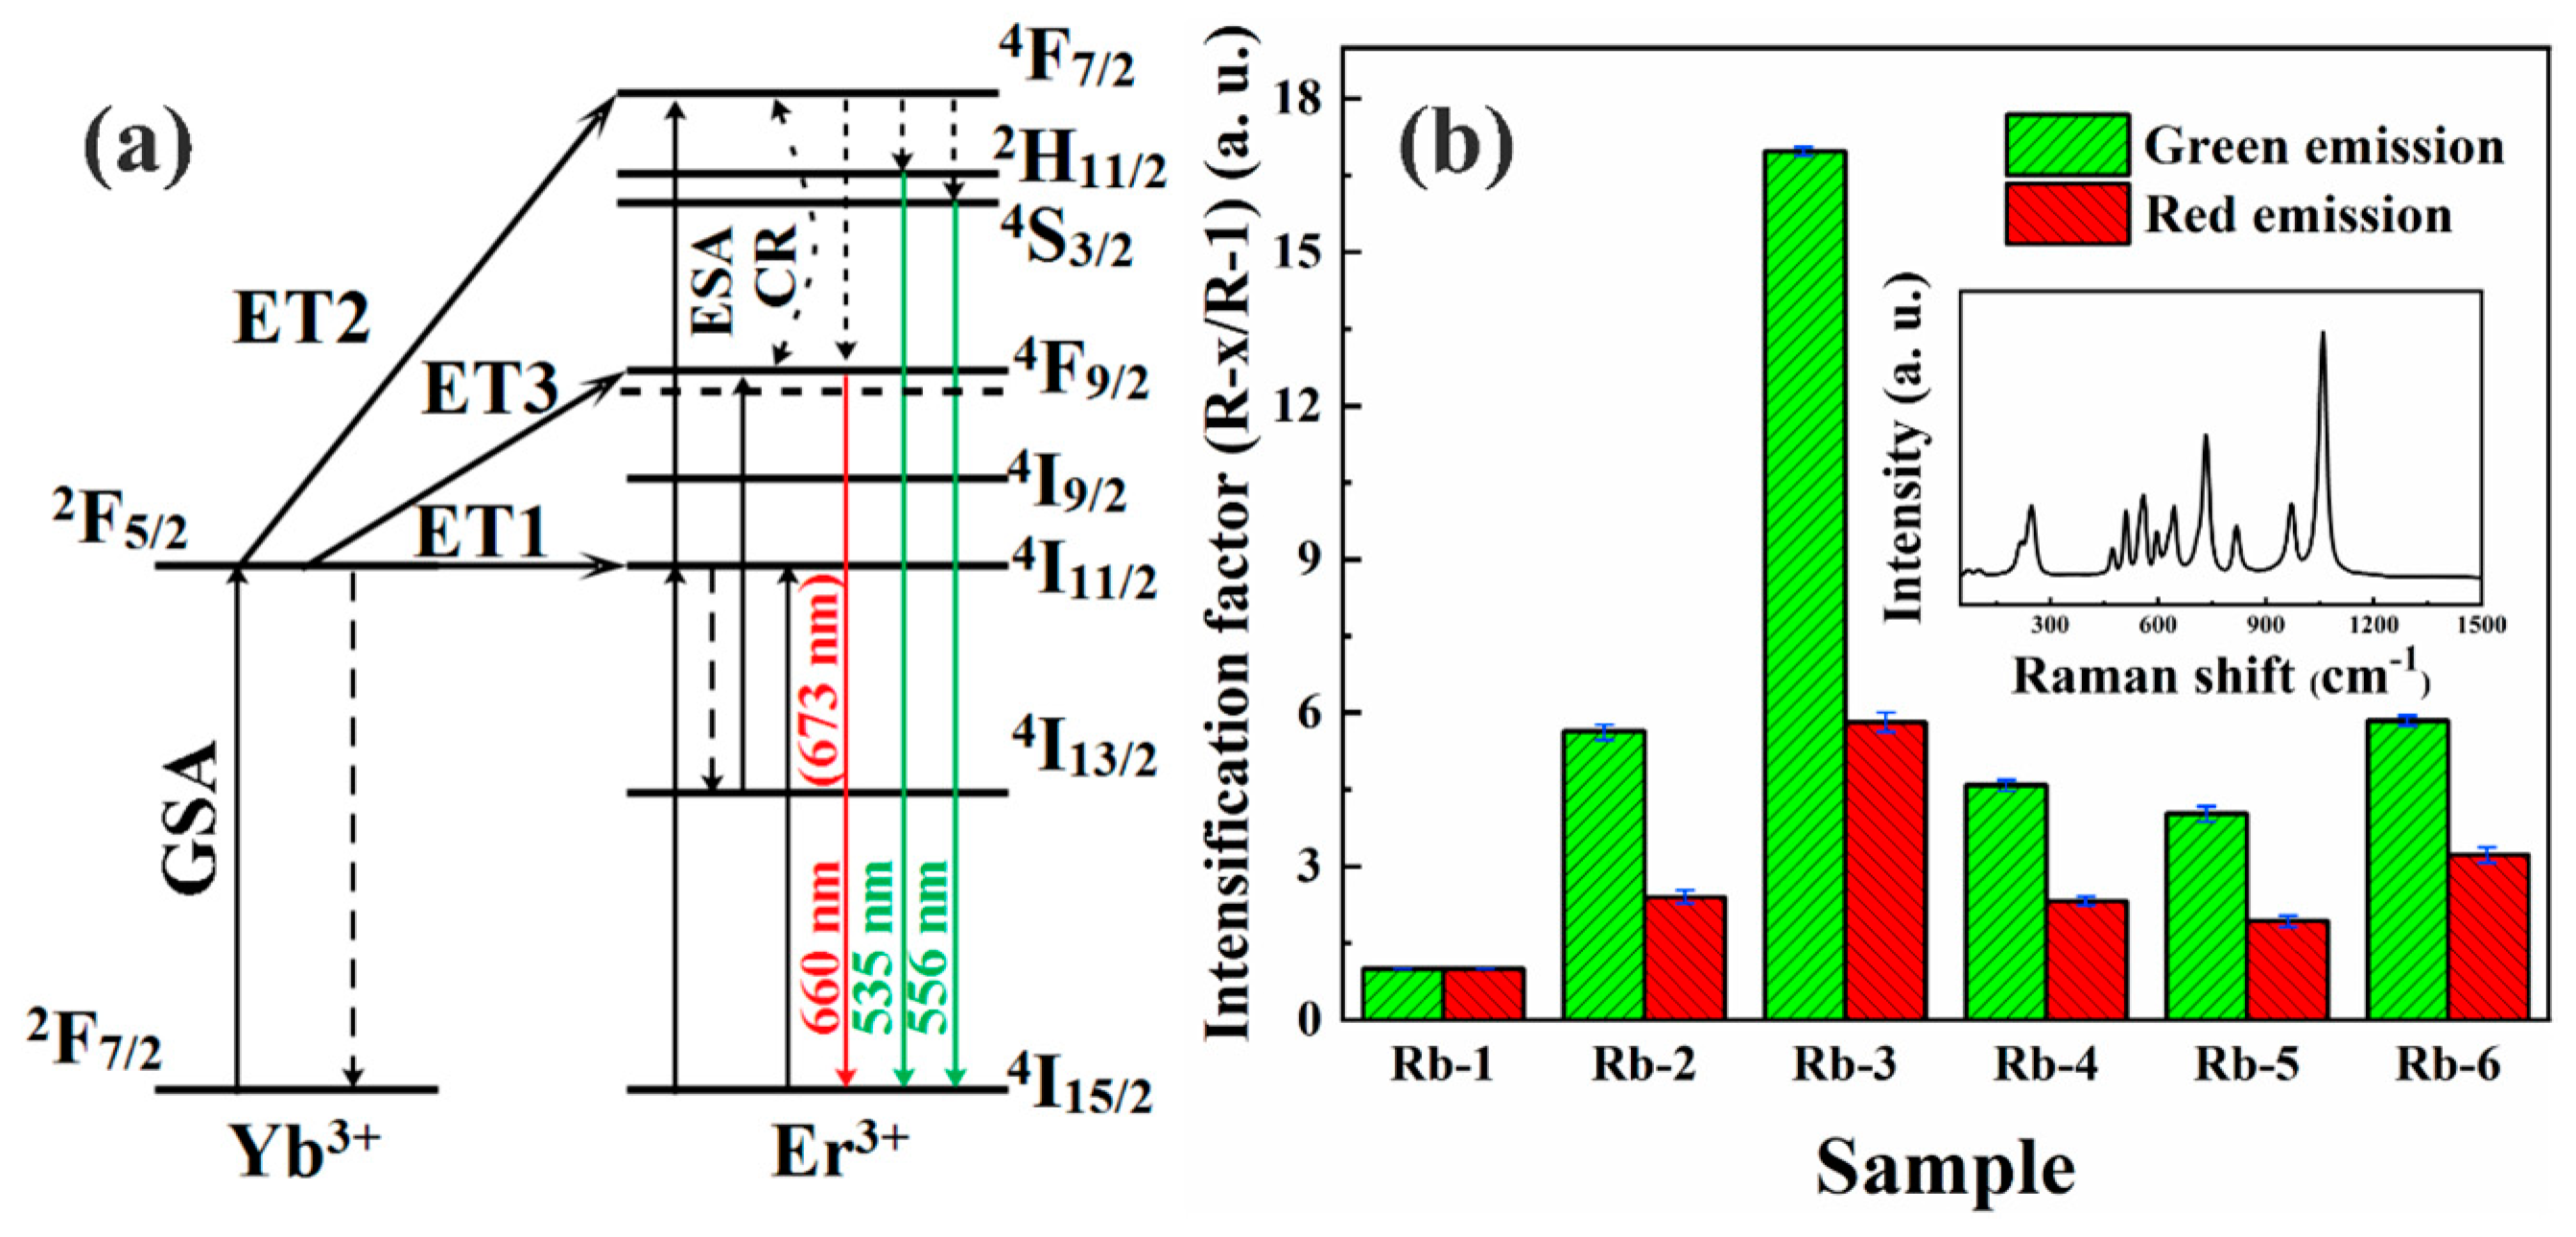
3.3. The Mechanisms of Energy Transfer and Emissions
4. Conclusions
Author Contributions
Funding
Conflicts of Interest
References
- Labrador-Páez, L.; Pedroni, M.; Haro-González, P.; Camarillo, E.; Bettinelli, M.; Jaque, D.; García-Solé, J. Eu3+ luminescent ions detect water density anomaly. J. Lumin. 2020, 223, 117263. [Google Scholar]
- Ding, B.; Zhou, X.; Zhang, J.; Xia, H.; Song, H.; Chen, B. Ho3+ doped Na5Y9F32 single crystals doubly sensitized by Er3+ and Yb3+ for efficient 2.0 μm emission. J. Lumin. 2020, 223, 117254. [Google Scholar]
- Kaur, H.; Jayasimhadri, M. Optimization of structural and luminescent properties with intense red emitting thermally stable Sm3+ doped CaBiVO5 phosphors for w-LED applications. Opt. Mater. 2020, 107, 110119. [Google Scholar]
- Kibrisli, O.; Vahedigharehchopogh, N.; Ersundu, A.E.; Ersundu, M.C. Instantaneous color tuning of up-conversion emission in a novel lanthanide doped monolithic glass via excitation modulation. J. Phys. Chem. C 2020, 124, 10687–10695. [Google Scholar]
- Bi, W.; Wu, Y.; Chen, C.; Zhou, D.; Song, Z.; Li, D.; Chen, G.; Dai, Q.; Zhu, Y.; Song, H. Dye sensitization and local surface plasmon resonance enhanced upconversion luminescence for efficient perovskite solar cells. ACS Appl. Mater. Interfaces 2020, 12, 24737–24746. [Google Scholar] [PubMed]
- Zhou, J.; Shirahata, N.; Sun, H.T.; Ghosh, B.; Ogawara, M.; Teng, Y.; Zhou, S.; Sa Chu, R.G.; Fujii, M.; Qiu, J. Efficient dual-modal NIR-to-NIR emission of rare earth ions co-doped nanocrystals for biological fluorescence imaging. J. Phys. Chem. Lett. 2013, 4, 402–408. [Google Scholar] [PubMed]
- Prasad, M.; Rai, V.K. Influence of transition metal ions: Broad band upconversion emission in thermally stable phosphors. J. Alloy. Compd. 2020, 837, 155289. [Google Scholar]
- Anjana, R.; Krishnapriya, T.K.; Jayaraj, M.K. Clean synthesis of Er, Yb doped fluorapatite upconversion luminescent nanoparticles through liquid phase pulsed laser ablation. Opt. Laser Technol. 2020, 131, 106452. [Google Scholar]
- Ma, L.; Slattery, O.; Tang, X. Detection and spectral measurement of single photons in communication bands using up-conversion technology. Laser Phys. 2010, 20, 1244–1250. [Google Scholar]
- Wang, L.; Shang, Z.; Shi, M.; Cao, P.; Yang, B.; Zou, J. Preparing and testing the reliability of long-afterglow SrAl2O4: Eu2+, Dy3+ phosphor flexible films for temperature sensing. RSC Adv. 2020, 10, 11418–11425. [Google Scholar]
- Jiang, L.; Zhang, H.; Xiao, S.; Yang, X.; Ding, J. Influence of Yb3+ co-doping on Er3+ up-conversion emission in NaYF4: Er3+ phosphor under 808 nm excitation. Optoelectron. Adv. Mater. Rapid Commun. 2012, 6, 547–550. [Google Scholar]
- Yu, C.; Chen, B.; Zhang, X.; Li, X.; Xia, H.P. Influence of Er3+ concentration and Ln3+ on the Judd-Ofelt parameters in LnOCl (Ln = Y, La, Gd) phosphors. Phys. Chem. Chem. Phys. 2020, 22, 7844–7852. [Google Scholar] [PubMed]
- Song, Y.; Gong, G.; Du, J.; Xie, S.; Ouyang, M.; Feng, Y.; Xu, J.; Xu, L. Synthesis and inkjet printing of NaYF4:Ln3+@NaYF4 core–shell nanoparticles with enhanced upconversion fluorescence for anti-counterfeiting applications. J. Nanosci. Nanotechnol. 2020, 20, 1511–1519. [Google Scholar] [PubMed]
- Weber, M.J. Probabilities for radiative and nonradiative decay of Er3+ in LaF3. Phys. Rev. 1967, 157, 262–272. [Google Scholar]
- Kim, J.H.; Choi, H.; Kim, E.O.; Noh, H.M.; Jeong, J.H. Li doping effects on the upconversion luminescence of Yb3+/Er3+-doped ABO4 (A = Ca, Sr; B = W, Mo) phosphors. J. Opt. Mater. 2014, 38, 113–118. [Google Scholar]
- Vu, H.H.T.; Atabaev, T.S.; Nguyen, N.D.; Hwang, Y.H.; Kim, H.K. Luminescent core-shell Fe3O4@Gd2O3:Er3+, Li+ composite particles with enhanced optical properties. J. Sol Gel Sci. Technol. 2014, 71, 391–395. [Google Scholar]
- Dexter, D.L.J. A theory of sensitized luminescence in solids. J. Chem. Phys. 1953, 21, 836–850. [Google Scholar]
- Zhang, J.; Wang, Y.; Guo, L.; Zhang, F.; Wen, Y.; Liu, B.; Huang, Y. Vacuum ultraviolet and near-infrared excited luminescence properties of Ca3(PO4)2:RE3+, Na+ (RE = Tb, Yb, Er, Tm, and Ho). J. Solid State Chem. 2011, 184, 2178–2183. [Google Scholar]
- Tang, J.; Lei, L.; Feng, H.; Zhang, H.; Han, Y. Preparation of K+-doped core-shell NaYF4: Yb, Er upconversion nanoparticles and its application for fluorescence Immunochromatographic assay of human procalcitonin. J. Fluoresc. 2016, 26, 2237–2246. [Google Scholar]
- Lakshminarayana, G.; Wagh, A.; Lira, A.; Kityk, I.V.; Park, T. Dy3+: B2O3–Al2O3–ZnO–Bi2O3–BaO–M2O (M = Li; Na; and K) glasses: Judd-Ofelt analysis and photoluminescence investigation for WLED applications. J. Mater. Sci. Mater. Electron. 2020, 31, 2481–2496. [Google Scholar]
- Patterson, A.L. The Scherrer formula for X-ray particle size determination. Phys. Rev. 1939, 56, 978–982. [Google Scholar]
- Doutt, D.; Mosbacker, H.L.; Cantwell, G.; Zhang, J.; Song, J.J.; Brillson, L.J. Impact of near-surface defects and morphology on ZnO luminescence. Appl. Phys. Lett. 2009, 94, 42111. [Google Scholar]
- Qi, Z.; Li, J.; Li, X.; Sun, X. Morphology-dependent crystallization and luminescence behavior of (Y, Eu)2O3 red phosphors. Acta Mater. 2009, 57, 5975–5985. [Google Scholar]
- Stavola, M.; Dexter, D.L. Energy transfer and two-center optical transitions involving rare-earth and OH− impurities in condensed matter. Chem. Phys. Lett. 1979, 20, 172–176. [Google Scholar]
- Nettel, S.J.; Lempicki, A.J.O.C. Resonant energy transfer in stoichiometric rare earth compounds. Opt. Commun. 1979, 30, 387–390. [Google Scholar]
- Gajda, G.; Morawski, A.; Diduszko, R.; Cetner, T.; Hossain, M.S.A.; Gruszka, K.; Gajda, D.; Przyslupski, P. Role of double doping with C and RE2O3 oxides on the critical temperature and critical current of MgBs phase. J. Alloy. Compd. 2017, 709, 473–480. [Google Scholar]
- Yang, S.H.; Hong, B.C.; Huang, S.F. Luminescence enhancement and emission color adjustment of white organic light-emitting diodes with quantum-well-like structures. J. Appl. Phys. 2009, 105, 113105. [Google Scholar]
- Schaack, G.; Koningstein, J.A. Phonon and electronic raman spectra of cubic rare-earth oxides and isomorphous yttrium oxide. J. Opt. Soc. Am. 1970, 60, 1110–1115. [Google Scholar]


| Sample Name | Y3+ | Er3+ | Yb3+ | RE3+ (Er3+ + Yb3+): Rb+ |
|---|---|---|---|---|
| Rb-1 | 100 | 2 | 5 | 1:0 |
| Rb-2 | 100 | 2 | 5 | 1:1 |
| Rb-3 | 100 | 2 | 5 | 1:1.5 |
| Rb-4 | 100 | 2 | 5 | 1:2 |
| Rb-5 | 100 | 2 | 5 | 1:2.5 |
| Rb-6 | 100 | 2 | 5 | 1:3 |
| Sample | Peak Position (222) | Crystal Constant (Å) | Average Grain Sizes (nm) |
|---|---|---|---|
| Rb-1 | 29.461° | 10.511 | 24.1 |
| Rb-2 | 29.403° | 10.532 | 38.0 |
| Rb-3 | 29.379° | 10.533 | 29.5 |
| Rb-4 | 29.361° | 10.543 | 36.6 |
| Rb-5 | 29.337° | 10.550 | 19.0 |
| Rb-6 | 29.263° | 10.568 | 23.0 |
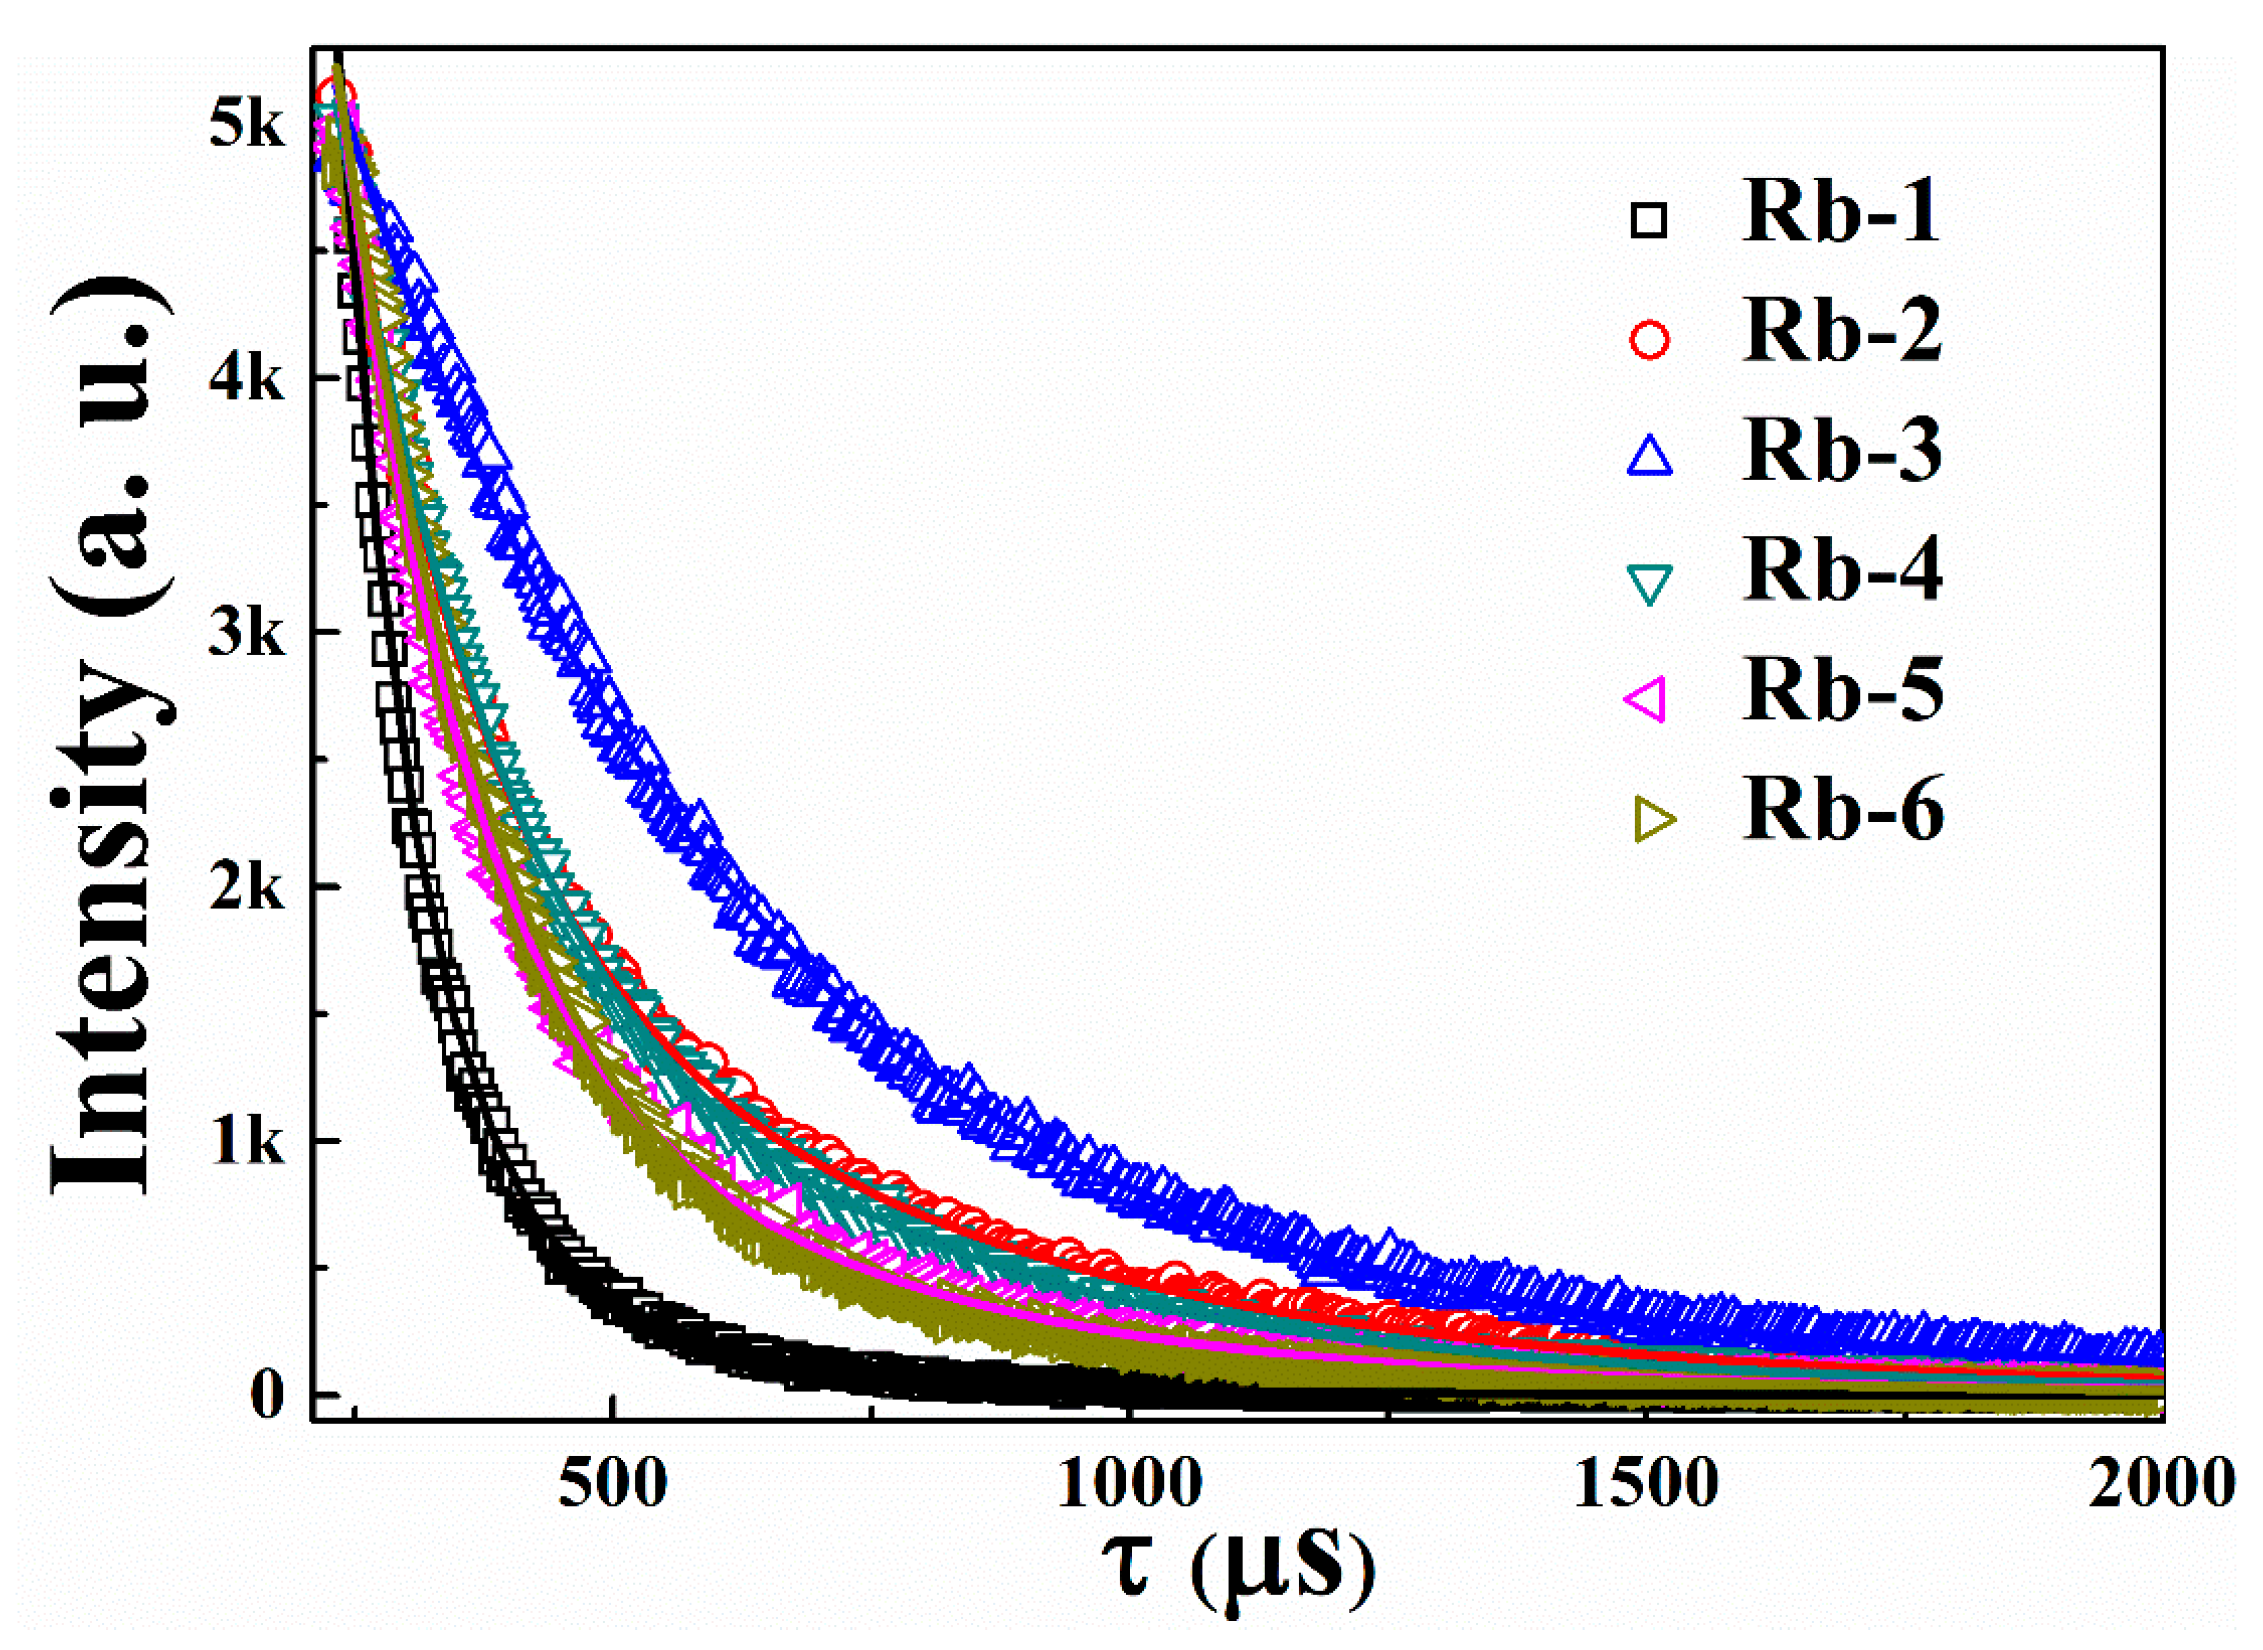
| Sample | Green Emission (λem = 556 nm) | Red Emission (λem = 660 nm) | ||||
|---|---|---|---|---|---|---|
| τ (μs) (Rel %) | τ (μs) (Rel %) | Avg. Decay Time μs | τ (μs) (Rel%) | τ (μs) (Rel %) | Avg. Decay Time μs | |
| Rb-1 | 60.65 (68.85%) | 141.20 (31.15%) | 86.45 | 74.36 (63.72%) | 215.22 (36.28%) | 130.02 |
| Rb-2 | 117.99 (29.64%) | 388.41 (70.36%) | 318.23 | 158.74 (37.73%) | 550.48 (62.27%) | 413.22 |
| Rb-3 | 165.33 (36.85%) | 411.40 (63.15%) | 340.95 | 333.70 (62.81%) | 790.78 (37.19%) | 514.71 |
| Rb-4 | 126.42 (40.28%) | 350.29 (59.72%) | 275.33 | 172.56 (46.08%) | 511.33 (53.92%) | 365.96 |
| Rb-5 | 91.44 (41.65%) | 293.31 (58.35%) | 221.31 | 135.89 (48.66%) | 445.21 (51.34%) | 302.84 |
| Rb-6 | 82.65 (46.03%) | 257.01 (53.97%) | 181.84 | 146.71 (58.73%) | 426.44 (41.27%) | 217.18 |
Publisher’s Note: MDPI stays neutral with regard to jurisdictional claims in published maps and institutional affiliations. |
© 2020 by the authors. Licensee MDPI, Basel, Switzerland. This article is an open access article distributed under the terms and conditions of the Creative Commons Attribution (CC BY) license (http://creativecommons.org/licenses/by/4.0/).
Share and Cite
Xu, B.; Song, C.; Song, J.; Huang, R.; Liu, J.; Lin, Z.; Zhang, Y.; Song, J.; Li, H. Effect of Rb+ Doping on Tunable Luminescence in Yb3+/Er3+–Y2O3 Film. Coatings 2020, 10, 1137. https://doi.org/10.3390/coatings10111137
Xu B, Song C, Song J, Huang R, Liu J, Lin Z, Zhang Y, Song J, Li H. Effect of Rb+ Doping on Tunable Luminescence in Yb3+/Er3+–Y2O3 Film. Coatings. 2020; 10(11):1137. https://doi.org/10.3390/coatings10111137
Chicago/Turabian StyleXu, Boxu, Chao Song, Jun Song, Rui Huang, Juncheng Liu, Zhenxu Lin, Yi Zhang, Jie Song, and Hongliang Li. 2020. "Effect of Rb+ Doping on Tunable Luminescence in Yb3+/Er3+–Y2O3 Film" Coatings 10, no. 11: 1137. https://doi.org/10.3390/coatings10111137
APA StyleXu, B., Song, C., Song, J., Huang, R., Liu, J., Lin, Z., Zhang, Y., Song, J., & Li, H. (2020). Effect of Rb+ Doping on Tunable Luminescence in Yb3+/Er3+–Y2O3 Film. Coatings, 10(11), 1137. https://doi.org/10.3390/coatings10111137