Article

Inter-Relationship between Coating Micro/Nanostructure and the Tribological Performance of Zr–C Gradient Coatings

Faculty of Mechanical Engineering, Koszalin University of Technology (KUT), Śniadeckich 2, 75-453 Koszalin, Poland
*
Author to whom correspondence should be addressed.
Coatings 2020, 10(11), 1121; https://doi.org/10.3390/coatings10111121
Submission received: 23 October 2020 / Revised: 16 November 2020 / Accepted: 17 November 2020 / Published: 20 November 2020
(This article belongs to the Special Issue Coatings Deposited by Cathodic Arc and Magnetron Sputtering Process)

Abstract

:
The research presented in this article concerns Zr–C gradient coatings that were deposited on HS6-5-2 steel by reactive magnetron sputtering from the Zr target in appropriately programmed C2H2 mass flow rate, resulting in various profiles of atomic carbon concentrations in the coating and consequently in spatial change of the properties (H, E, …) and behavior (H/E, H3/E2, We). In particular, the characteristic changes in hardness and Young’s modulus in the Zr–C coatings represented approximately by the bell curve, which has a maximum at the content of about 50 at.% C, were an inspiration to study the behavior of gradient coatings with carbon content in the range of 0–50 and 50–85 at.% with the same hardness change profile. The obtained results indicate that, firstly, the gradient of spatial changes in the coating composition increases their resistance to cohesive damage in comparison to non-gradient coatings, and, secondly, the results show that high hardness is a desired property but not sufficient to ensure adequate coating performance. Independently, an appropriate nano/microstructural structure is necessary, which determines their tribological behavior. In particular, in the case of the tested Zr–C coatings, the obtained results indicate that gradient coatings with a carbon content in the range of 50–85 at.% have better properties, characterized by the critical force Lc2, wear, coefficient of friction, H/E and H3/E2 ratios.

1. Introduction

Transition metal carbide coatings, including zirconium carbide coatings, have a wide range of interesting physicochemical properties, which make them attractive for a variety of applications. The strong covalent bond between Zr and C results, inter alia, in a high melting point above 3500 °C, which, combined with relatively high hardness and excellent mechanical stability, enables their use in various extreme conditions [1]. For example, Zr–C-based coatings can be used for aerospace applications and for fuel particles in nuclear reactions [2]. In addition, because of its high wear resistance, it can also be used as a protective coating for cutting tools [3]. Zr–C coatings are also considered for biomedical applications to improve the corrosion resistance and hemocompatibility of implant materials [4] or NiTi shape memory alloys [5,6,7].
The presented examples of applications of Zr–C-based coatings and the prospects for new applications of these coatings, resulting from the high potential of shaping their properties, inspire research work aimed at establishing the correlation between the nano/micro structure and properties of coatings [8,9,10,11,12,13,14]. Among other things, in this field, one of the research topics is the analysis of changes in the properties of the coatings along with the increase in the total carbon content in the coating resulting from the formation of carbon in amorphous form, surrounding nanocrystalline carbide grains [15,16,17]. The formation of the amorphous phase causes, on the one hand, the formation of coatings characterized by lower hardness, but on the other hand, it allows the production of coatings with a low coefficient of friction. Hence, by the appropriate selection of the phase composition of these coatings, they can be good candidates for cutting tools, and it is also beneficial to deposit coatings on parts working in tribological contacts, using the favorable properties of carbon to create graphite structures.
The structural and phase evolution, and consequently the evolution of the mechanical properties of Zr–C coatings, became an incentive to analyze the possibility of increasing the anti-wear properties of Zr–C coatings by creating a spatial composition change in the coatings, implying spatial changes in properties. The values of hardness and Young’s modulus of Zr–C coatings, the changes of which are approximately represented by a bell curve, having a maximum content of about 50 at.% C, were an inspiration to compare the properties of gradient coatings produced with a carbon content in the range of 0–50 at.% and 50–85 at.% with the same hardness gradient but a radically different nano/microstructure. The challenge in these studies was to take another step in understanding the relationship between changes in mechanical properties (hardness H, Young’s modulus E, etc.) and behavior (H/E, H3/E2, elastic recovery We) and the nano/microstructural evolution of Zr–C coatings to design gradient coatings with the desired properties.
In choosing the spatial profile of the coating composition change, the so-called rule of mixtures [18,19,20,21] was used and the change in the carbon content in accordance with the parabolic and square root profile was adopted. It was assumed that by choosing a profile from the range between the parabolic and square root, it would be possible to design coatings with specific properties from among possible effective changes in the properties of these coatings.
In sum, the aim for the present study is to investigate the possibility of using changes in the mechanical properties of Zr–C coatings, depending on the carbon content, to produce gradient coatings characterized by increased anti-wear properties. Independently, the aim of the research was to answer the question of what influence differences in the nano/microstructure of Zr–C coatings have on their performance properties, regardless of whether the necessary condition has been met, i.e., obtaining an appropriate hardness change.

2. Materials and Methods

2.1. Coating Deposition

The coatings Zr–C were deposited on disc-shaped samples using pulsed reactive magnetron sputtering. The samples were made of HS6-5-2 high speed steel.
Sputtering was performed from a metallic Zr target of 100 mm diameter and a purity of 99.2% of metal basis excluding Hf in a mixed Ar and C2H2 atmosphere. The change in the carbon content in the coatings was possible due to the change in the acetylene mass flow rate in the working chamber during deposition in the range of 0–6.5 sccm. For comparison purposes, monolayer coatings with a determined and selected carbon content in the range of 20–85 at.% were produced. The details related to the preparation of samples prior to the deposition of the coatings and the functioning of the deposition test stand are described in [15].
The subject of this article is a coating with a gradient change in carbon content from the substrate to the coating surface. The gradient of the carbon content in the coating was obtained with an appropriately programmed C2H2 mass flow rate in the working chamber during target spraying. Four types of gradient coatings were deposited with square root and parabolic profile of carbon concentration in the ranges of 0–50 and 50–85 at.%. A detailed description of the profiles obtained can be found in Section 3.3.
In each case, the deposition of the coating was preceded by the deposition of a zirconium sublayer with a thickness of 0.2–0.3 μm to improve the adhesion of the coating to the substrate.

2.2. Microstructure, Composition and Morphology

The microstructure of Zr–C coatings was analyzed by means of X-ray diffraction (XRD) using grazing incidence diffraction geometry with an X’Pert Panalytical powder diffractometer (Cu-Kα radiation beam incidence angle of 3 degrees) (Malvern Panalytical, Malvern, United Kingdom) as well as by transmission microscopy using a high resolution electron microscope (HRTEM) Tecnai G2 F20 (FEI, Hillsboro, OR, USA).
The concentration of the individual elements in the deposited coatings was determined by means of wavelength-dispersive X-ray spectroscopy (WDX) using a Thermo Scientific Magnaray system with an X-ray microprobe working in a wave mode Noran IBEX (Noran Instruments, Middleton, WI, USA).
An assessment of the coating morphology and of the cross-sections of the coatings was performed using a scanning electron microscope (JEOL SEM LV 5500). (Jeol Ltd., Tokyo, Japan).

2.3. Mechanical Evaluation

Hardness measurements were performed by means of nanoindentation using a Fisherscope HM2000 (Fischer, Sindelfingen, Germany) nanoindenter equipped with a diamond Berkovich indenter. The load–depth indentation curves were obtained in the mode of the linear load increase up to fixed indentation depths of 0.15, 0.3 and 0.5 μm. The values of the hardness and the Young’s modulus were determined based on the indentation curves using the Oliver–Pharr model [22].

2.4. Tribological Tests

By means of tribological tests, the friction coefficient and the wear rate were determined. The tests were carried out using the ball on disc method by means of a T-10 tribotester with a normal load of 5 N at a linear sliding speed of 0.2 m/s. A ceramic alumina ball of 10 mm diameter was used as the counter-specimen. Based on the cross-section profile of the wear track obtained by means of a Hommelwerke T2000 profilometer (Hommelwerke GmbH, Villingen-Schwenningen, Germany), the values were determined of the volumetric wear rate of the coating. The tests were performed in an ordinary laboratory environment at a humidity of about 50% and a temperature of ~21 °C.

2.5. Fracture Toughness and Adhesion

The assessment of fracture toughness and coating adhesion was carried out using the scratch test method by means of a CSM Revetest scratch tester (CSM Instruments SA, Needham, MA, USA). The tester was equipped with a diamond conical indenter with a spherical tip of 200 μm radius. The indenter was moved over the surface of the coating at a speed of 10 mm/min over a distance of 5 mm, while the force loading the indenter increased linearly from a preload of 90 mN to 50 N at a speed of 100 N/min. The critical load Lc1 specifying coating resistance to cracking was determined on the basis of changes in acoustic emissions recorded during the test. The change of the indenter’s friction force and the observation of the resulting cracks enabled the determination of the critical load Lc2 under which the coating was completely delaminated.
To assess the adhesion and crack resistance of the coatings, a Rockwell C test was also used. This test uses a standard hardness tester equipped with a Rockwell C type indenter. Indentation of the substrate/coating system under a load of 1471 N causes a strong plastic deformation of the substrate and cracks in those layers that are adjacent to the imprint boundaries.

3. Results and Discussion

3.1. Chemical Composition of Coatings

According to the methodology adopted (Section 2), an appropriate profile of the carbon content in the coatings was obtained by means of a programmed algorithm of changes in the flow rate of acetylene through the working chamber of the coating deposition test stand. For this purpose, it was necessary to determine the relation between the mass flow rate of acetylene and the chemical composition of the coating obtained, which was determined by means of wave dispersion X-ray spectroscopy (WDX).
The results obtained, which formed the basis for the production of single-layer coatings and the development of a specific algorithm for acetylene flow rate variations, which enabled gradient coatings to be obtained, are presented in Table 1.

3.2. Characteristics of Zr–C Coatings

Two Zr–C coatings differing in their nano/microstructural composition were considered, i.e., coatings with carbon content in the range of 0–50 at.% of C and a coating with carbon content in the range of 50–85 at.%.
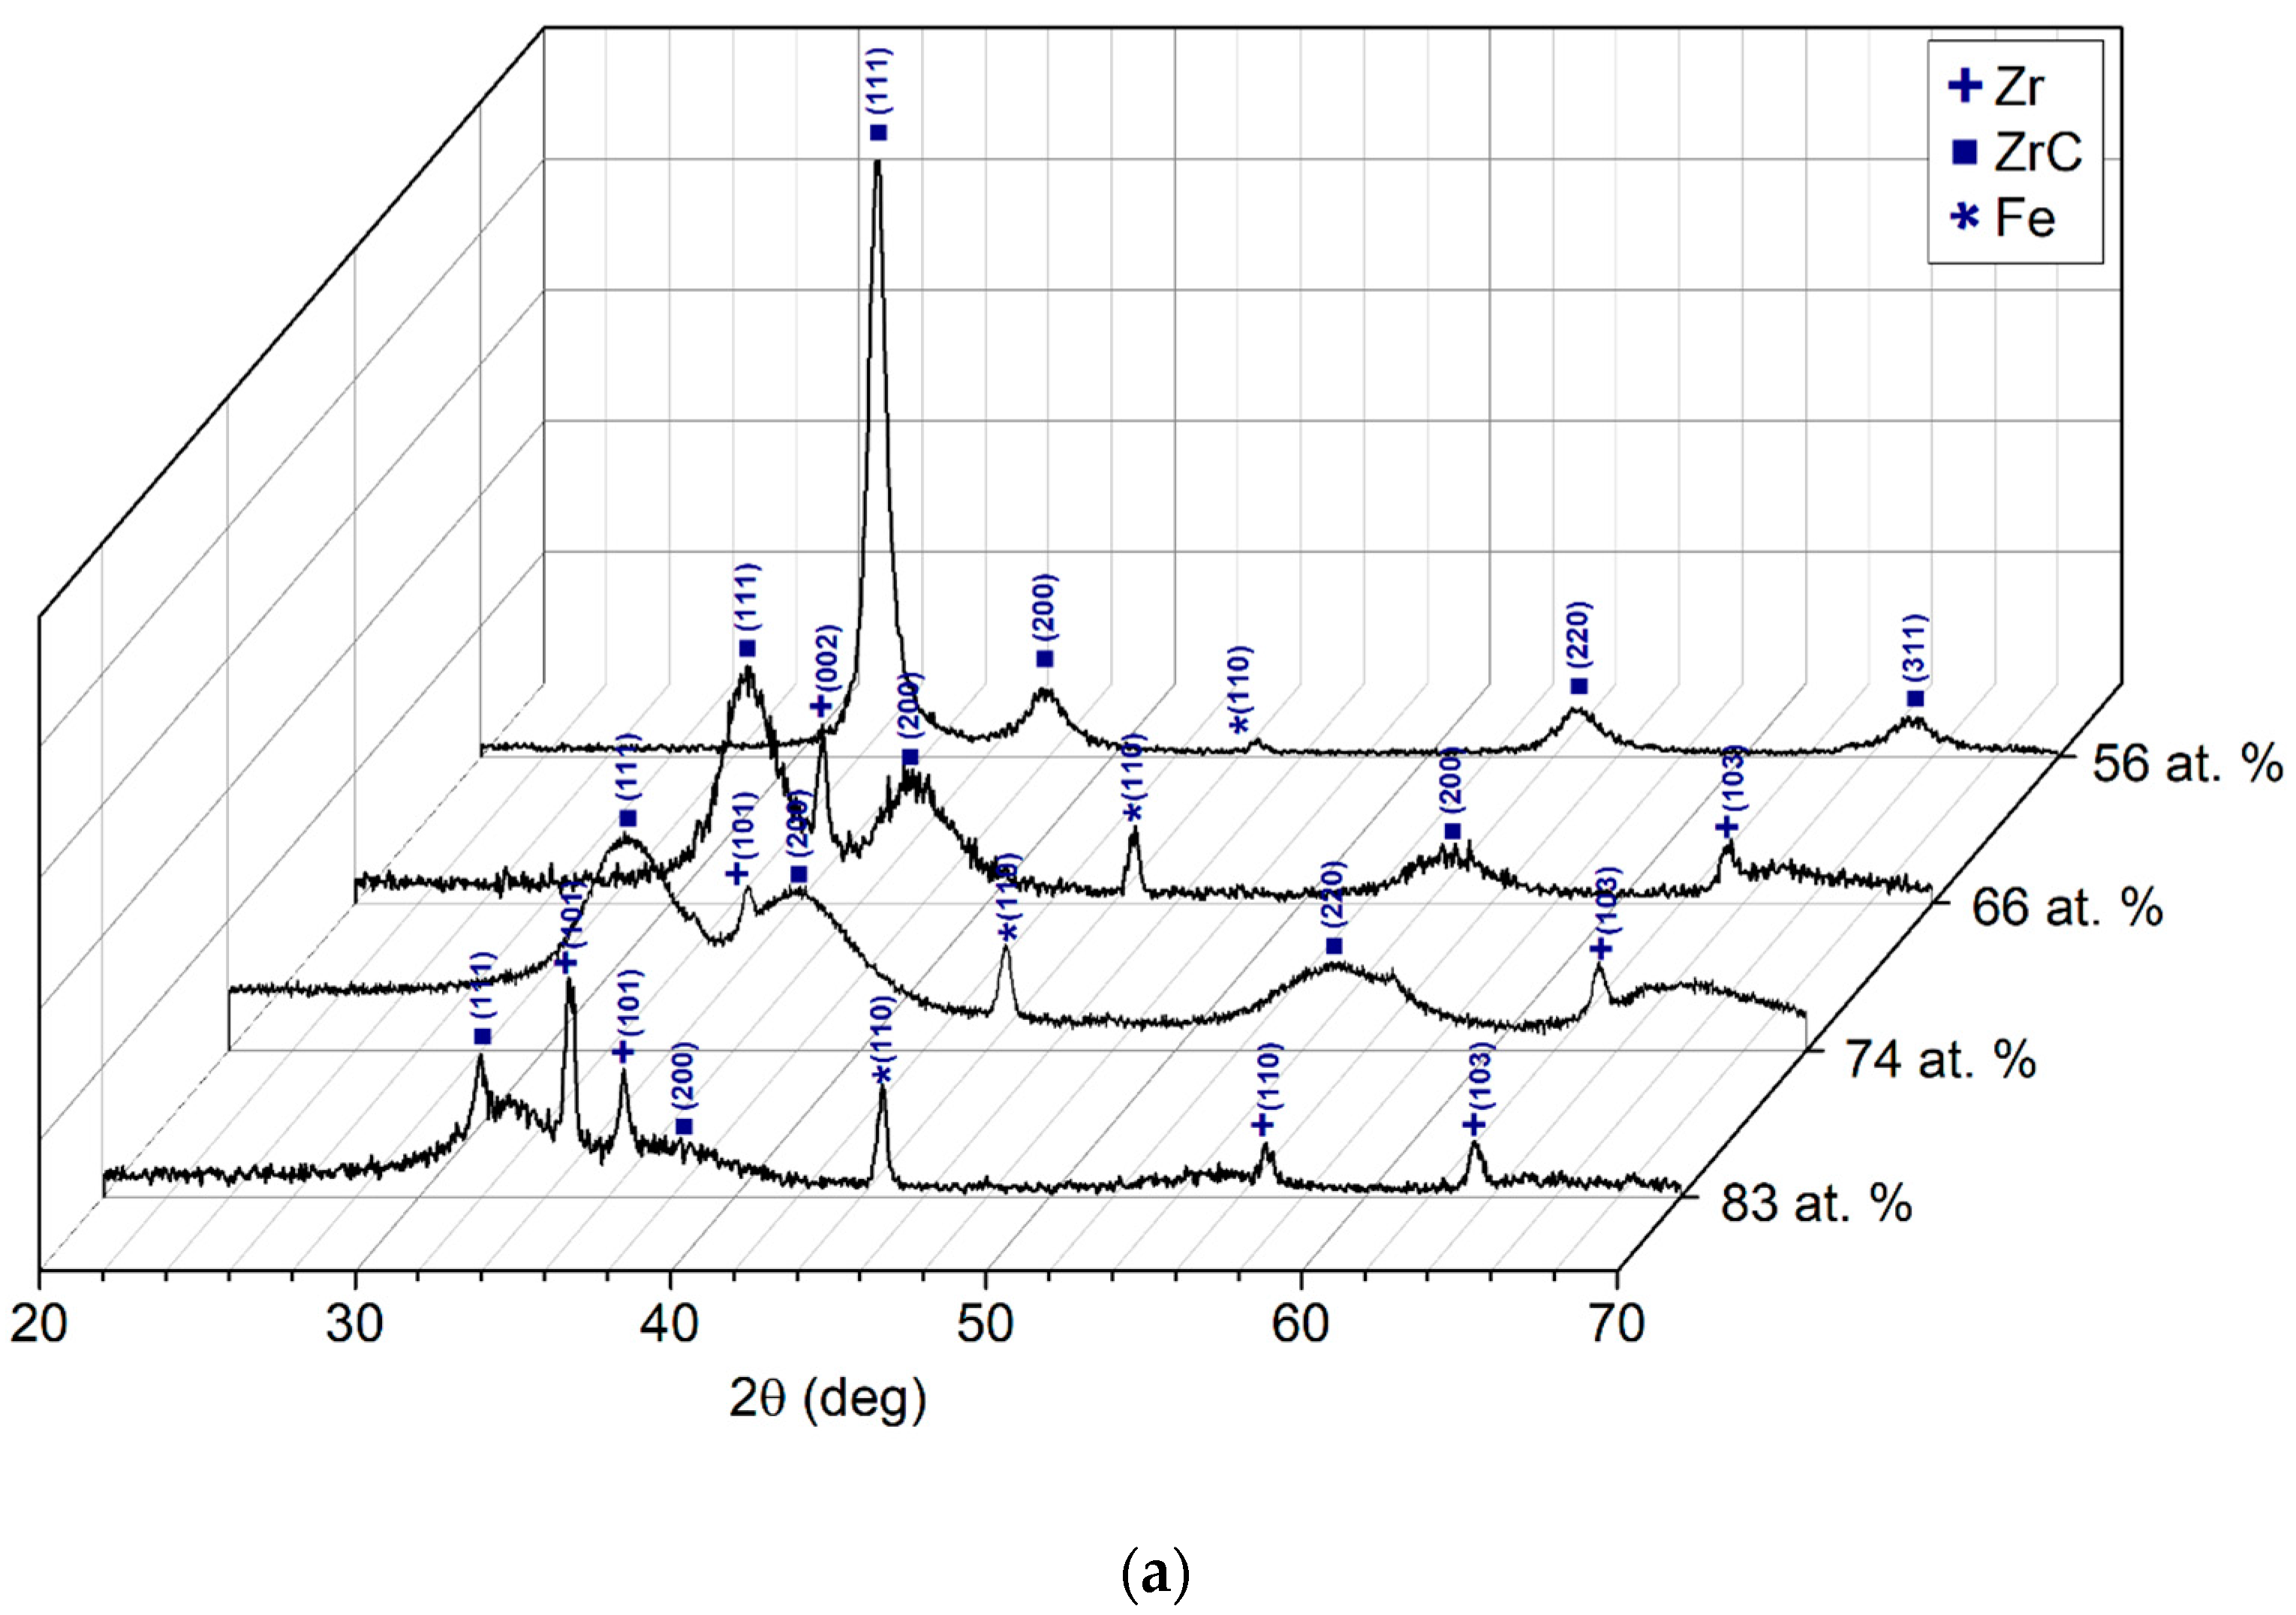
An analysis of XRD diffractograms demonstrated (Figure 1a) that in the range of carbon content of up to 50 at.%, there was an evolution of the Zr crystalline structure into a Zr–C crystalline lattice. The evolution took place through intermediate phases, and even with the lowest carbon content in the coating, no lines from Zr in the coating were observed in the diffractograms (Figure 1a).
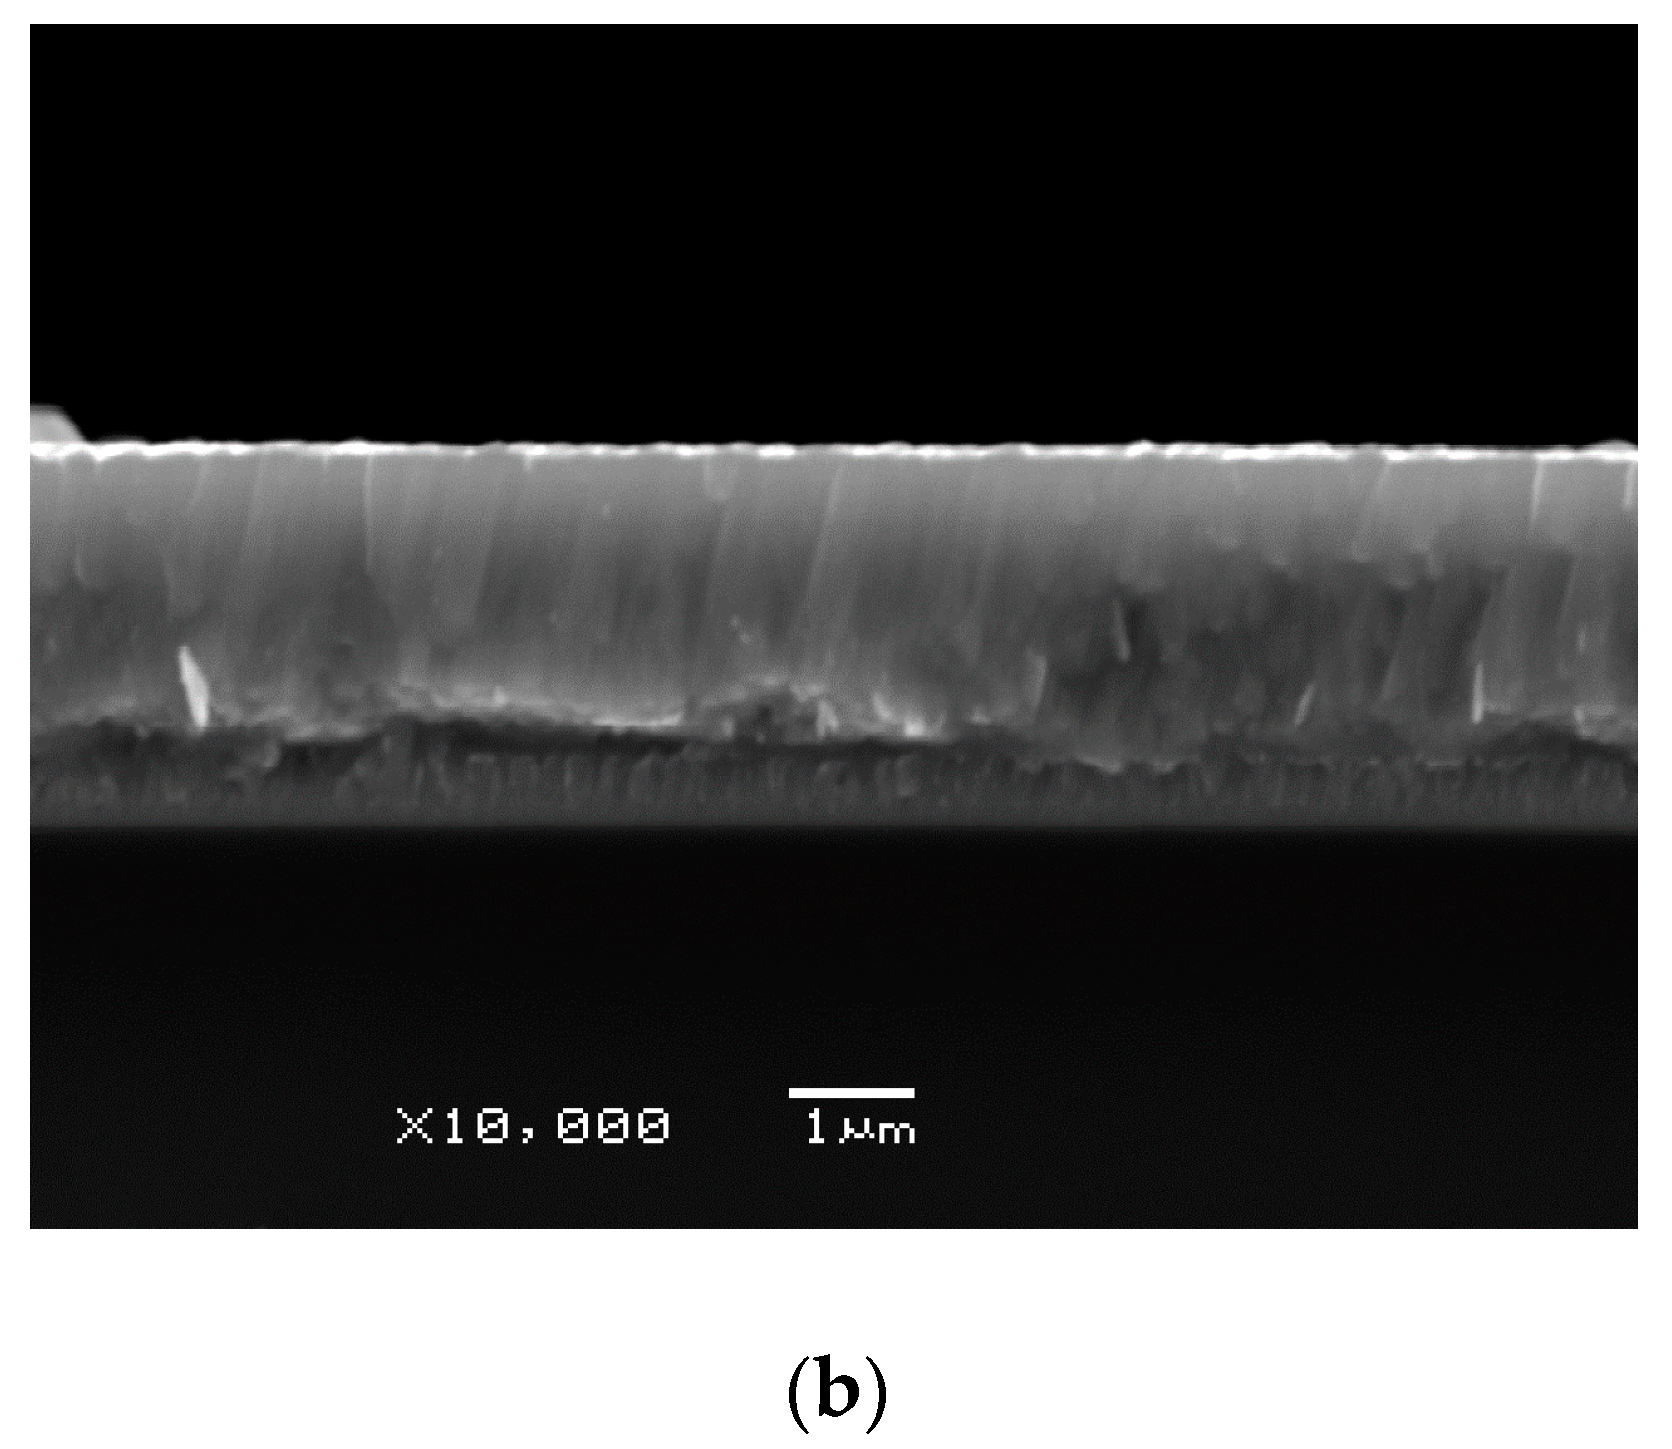
The common feature for coatings deposited from the gaseous phase was that the coating was created in the form of quite tightly packed columns that ran perpendicularly to the base. This column microstructure was also formed for Zr–C coatings with carbon content less than 50 at.% (Figure 1b). The research presented in [8,9,10,11,12] demonstrated that every column consisted of a large number of nanocrystalline carbide grains.
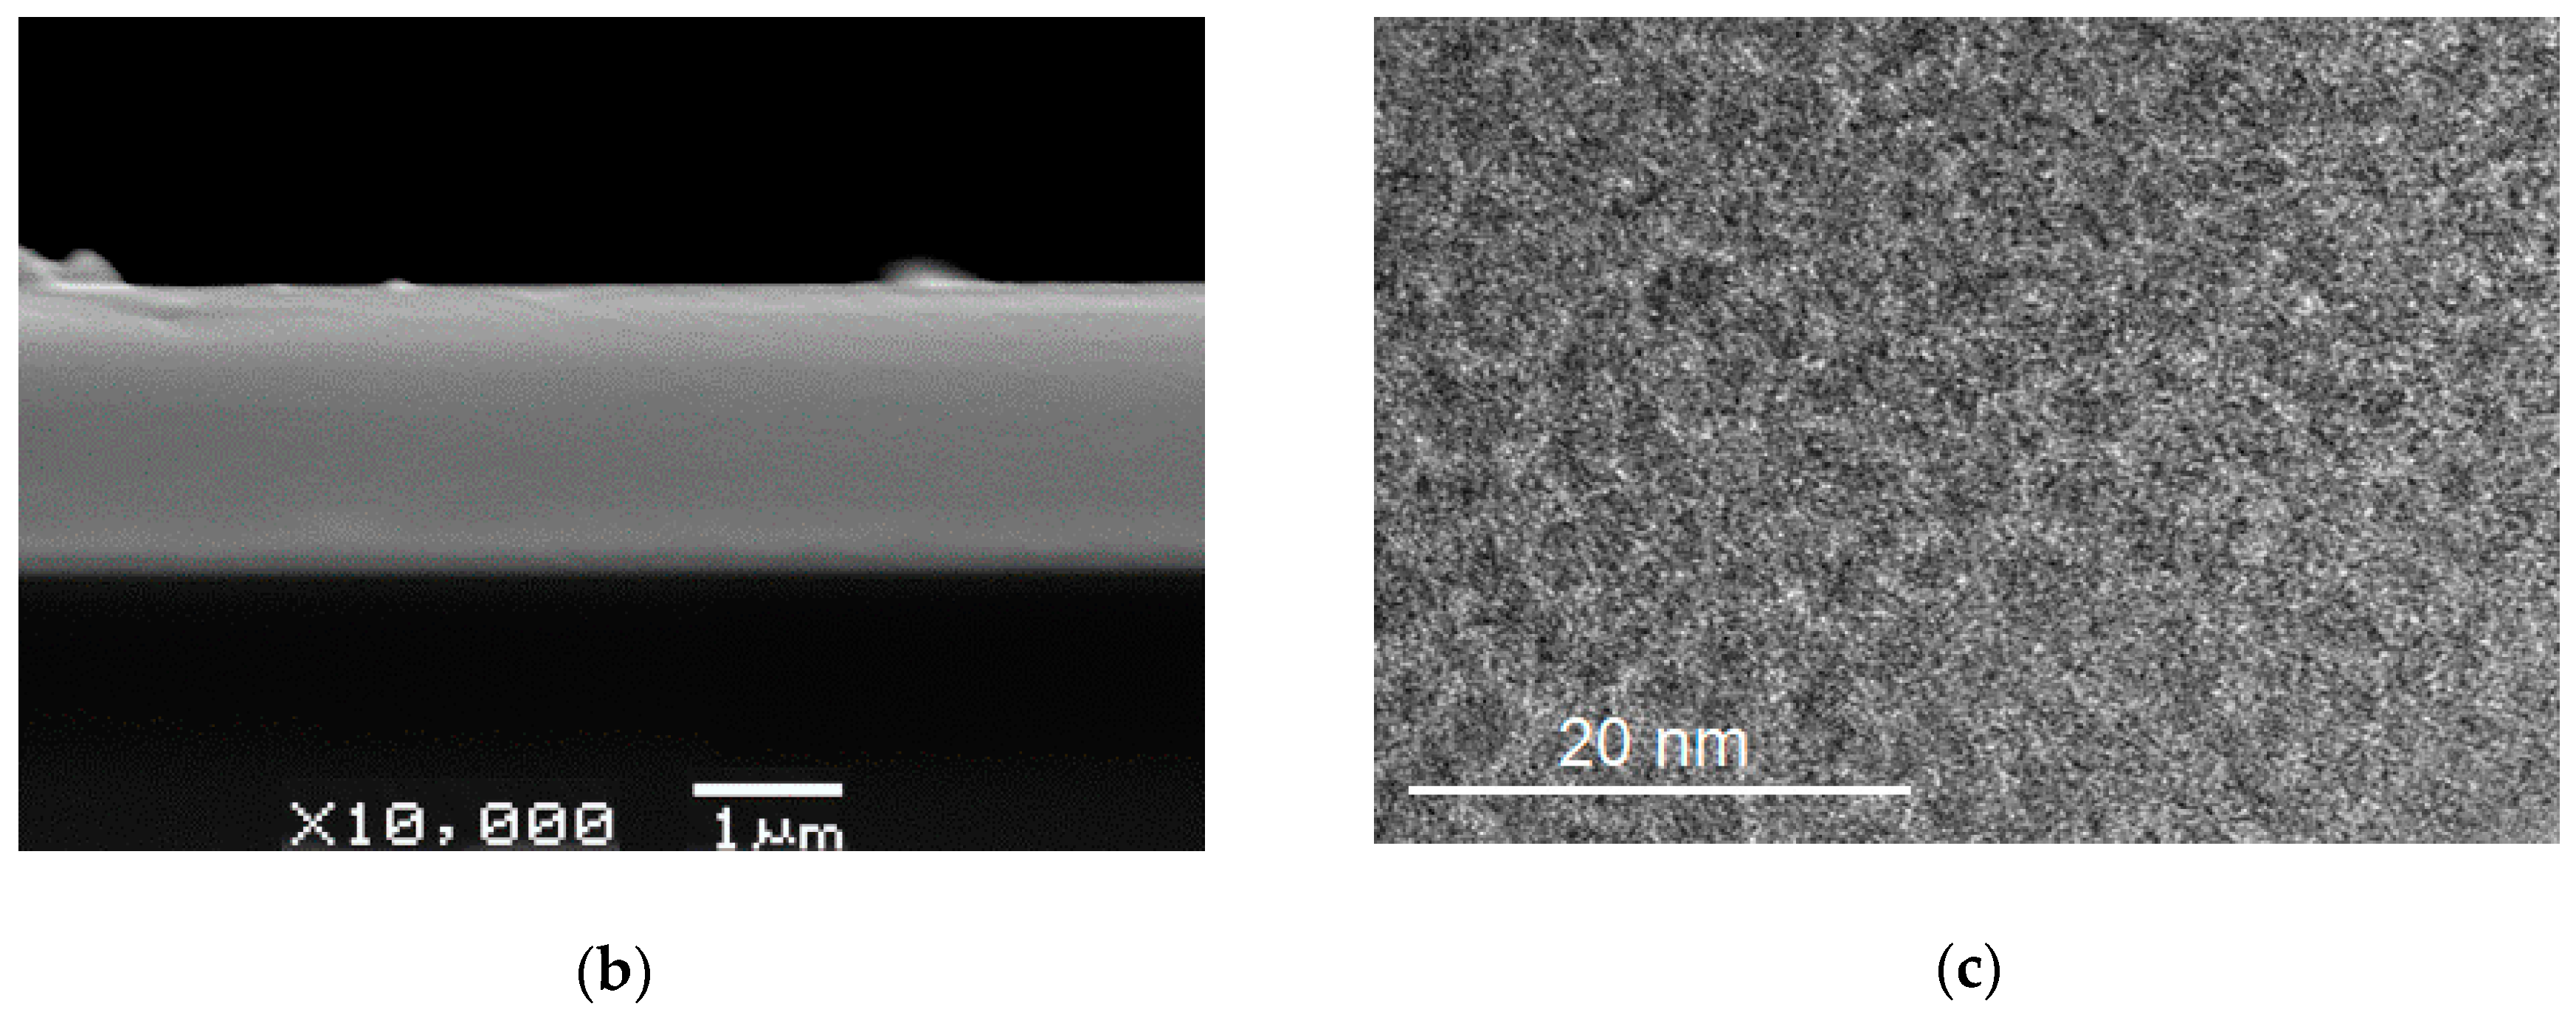
In the concentration range of 50–85 at.% of C, no columns were observed in photograph taken by SEM (Figure 2b); the coating became smooth. In X-ray diffractograms, a clear decrease in the intensity of the main diffraction line from Zr–C (111) was observed in parallel with its widening, which indicated that the share of this phase in the coating decreased with a reduction of Zr–C crystallite dimensions (Figure 2a). Based on the Scherrer Equation [23], the estimated average dimensions of carbide crystallites are approximately 20 nm in coatings with carbon contents below 50 at.%, and these decrease rapidly to several nanometers in the carbon concentration range above 50 at.%. Example tests of a coating with 63 at.% carbon content carried out with HRTEM served to confirm the XRD results, i.e., the coating consisted of regularly shaped crystallites with diameters of approximately 5 nm (Figure 2c). The figure also shows that the Zr–C crystallites were surrounded by an amorphous (carbon) phase.
The disappearance of the columnar microstructure and smoothening of the coating, documented among others in Meng et al. [16], was associated with an increase in the share of the amorphous carbon phase in the coating. With low carbon concentrations (0–50 at.%), the resulting amorphous carbon phase accumulated by the borders of the columns, while with higher concentrations, the sizes of carbide grains decreased, and the grains were surrounded by an amorphous carbon matrix.

3.3. Selection of C Content Profile in FGM Coating

Models for the determination of specific thermo-physical properties of heterogeneous materials are based, among other things, on the microstructure-dependent “mixtures rule” [18,19,20,21]. This rule is very useful in designing the properties of heterogeneous materials, including FGM (Functional Gradient Material), although this only gives approximate numerical values.
In the case of the Zr–C coatings analyzed, the objective was to select a spatial composition change profile depending on the carbon content profile, which provided an appropriate hardness profile.
In the carbon concentration range of 0–50 at.%, according to the “mixtures rule”, the hardness of the coating is expressed by means of the following formula:
H I = f Zr · H Zr + f ZrC · H ZrC ,
and in the range of the concentrations of 50–85 at.%:
H II = f ZrC · H ZrC + f aC · H aC ,
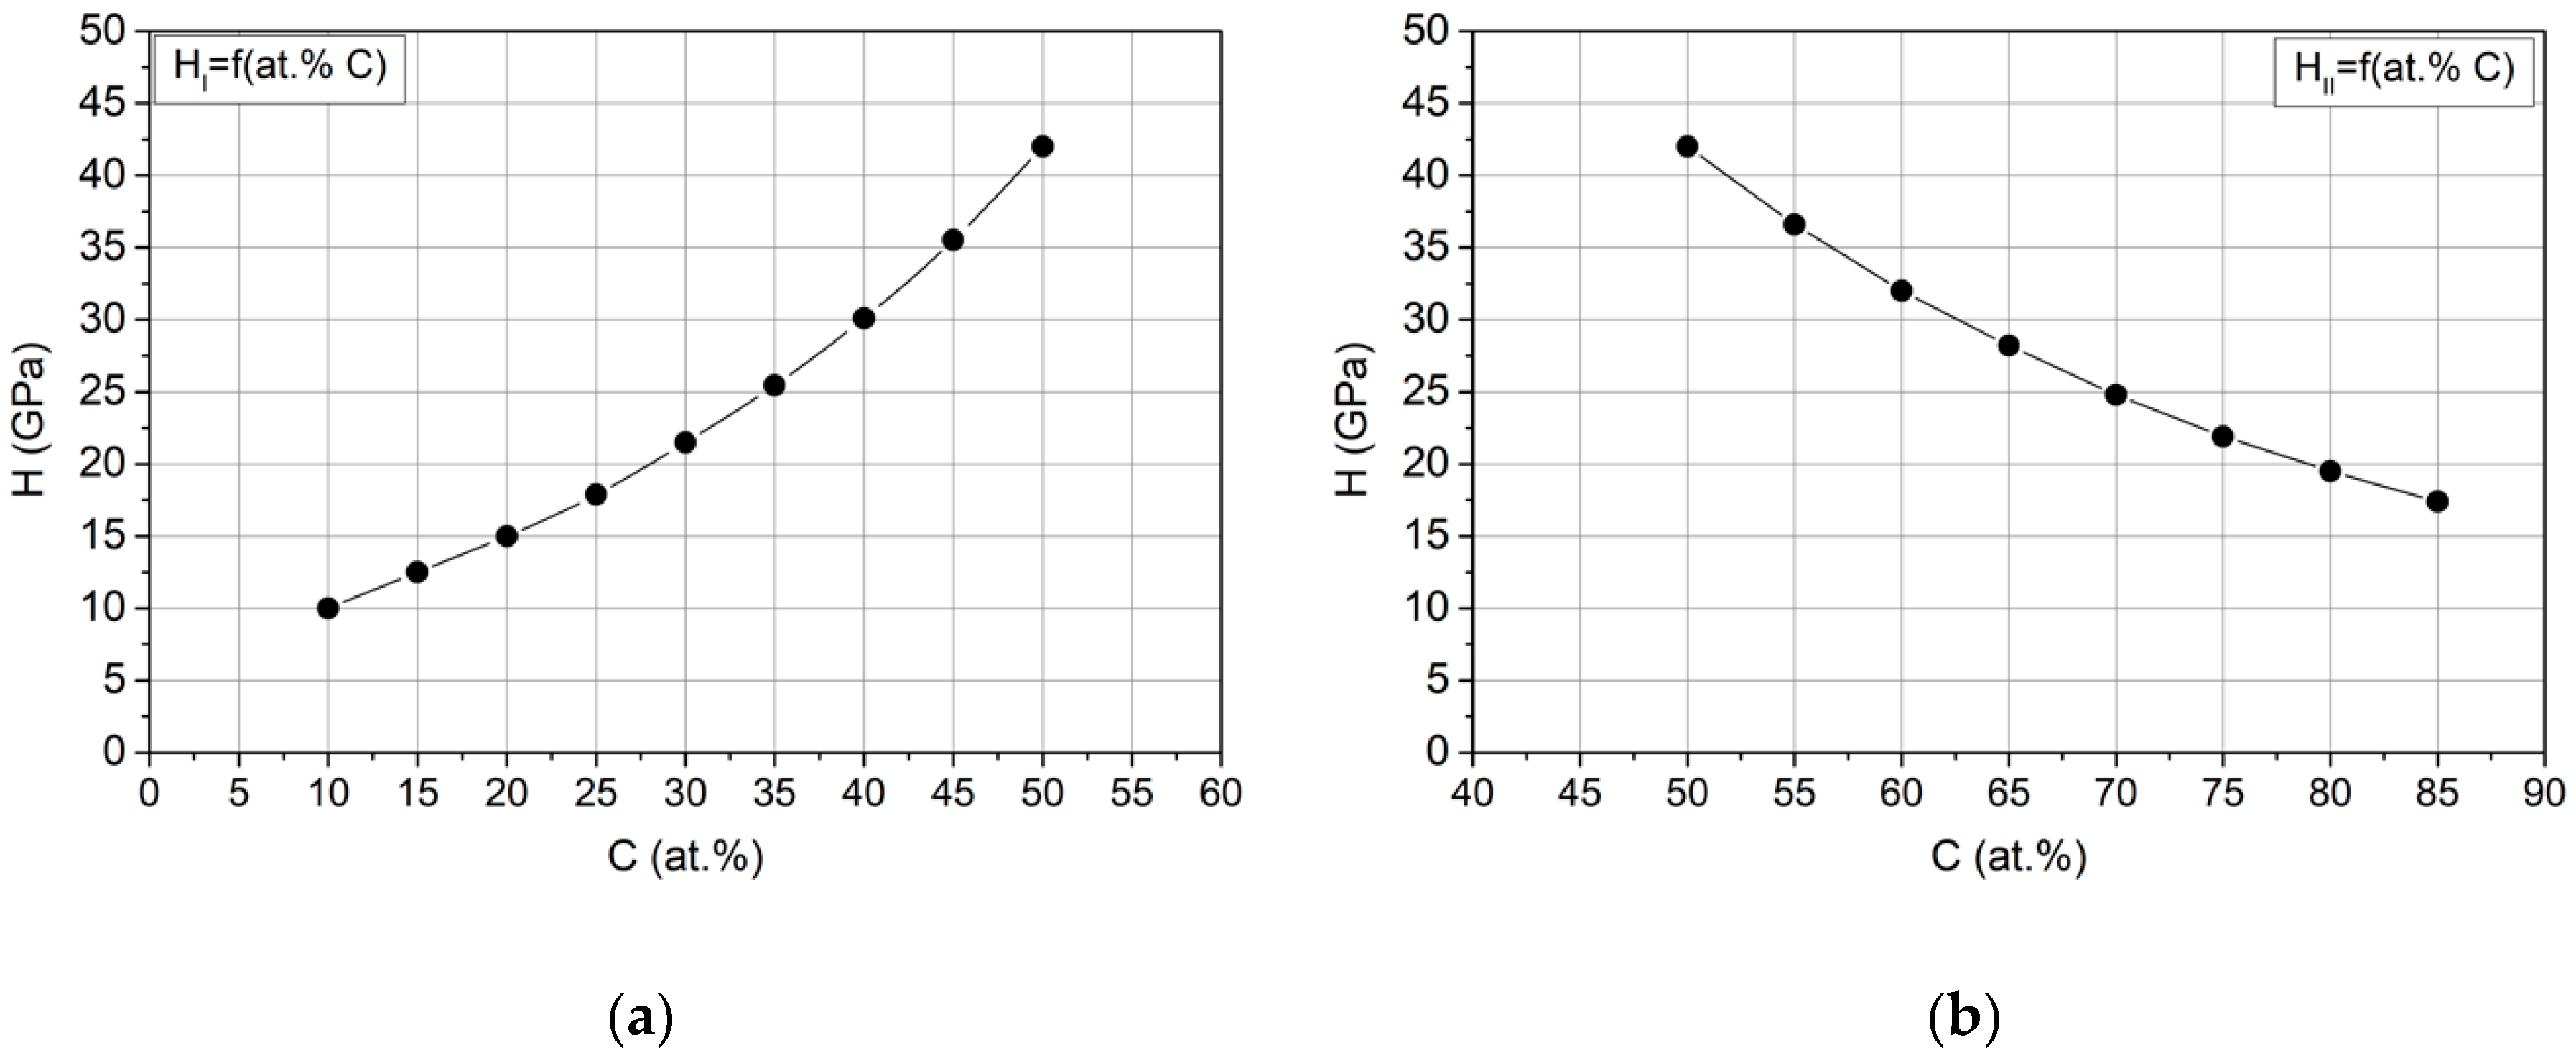
The volume fractions of Zr and Zr–C components and of the amorphous carbon phase are labelled as fZr, fZrC and faC, respectively, while accepting that fZr = 1 − fZrC and faC = 1 − fZrC are the hardness values of pure Zr and Zr–C carbide coating and of an amorphous carbon coating, respectively. The changes in the hardness of the coatings in the carbon concentration ranges analyzed, calculated according to Formulas (1) and (2), are illustrated in Figure 3. The hardness values of HZr, HZrC and HaC were accepted according to [15], i.e., HZr = 6, HZrC = 42 and HaC = 12 GPa.
In order to use the data as illustrated in Figure 3, single-dimensional geometry was accepted in the x-direction, which is the direction of the microstructural gradient, in order to design the FGM coating. The change in the share of the fZr, fZrC and faC components that determined the hardness of coatings in the FGM coating was determined by means of the function used, among others, by I. Dahan [24], i.e.,
C ( x ) = C 0 + ( C 1 C 0 ) · ( x D ) k ,
where C(x) is the carbon content at distance x from the substrate; D is the FGM coating thickness; C0 is the carbon content by the boundary with the substrate, x = 0; and C1 is the carbon content at distance D from the substrate, x = D.
This simple function offers considerable flexibility of selection regarding the form of the function and thus in the formation of FGM properties. In the studies presented, the following values were accepted: k = 2 and 0.5, i.e., change in carbon content according to parabolic and square root profiles. It was assumed that these are changes in carbon content profiles that determine the boundary and effective changes of mechanical properties in the gradient coatings analyzed. In other words, by selecting k from the range of 0.5 < k < 2, we may design a coating with specific properties out of the possible effective changes in the properties of these coatings. In all the cases examined, it was assumed that the hardness of coatings changed from the value of 17 GPa at the boundary with the substrate to the value of 42 GPa on the top of the coating, using the data contained in [15].

3.3.1. Parabolic Profiles

Carbon content range of 0–50 at.%.
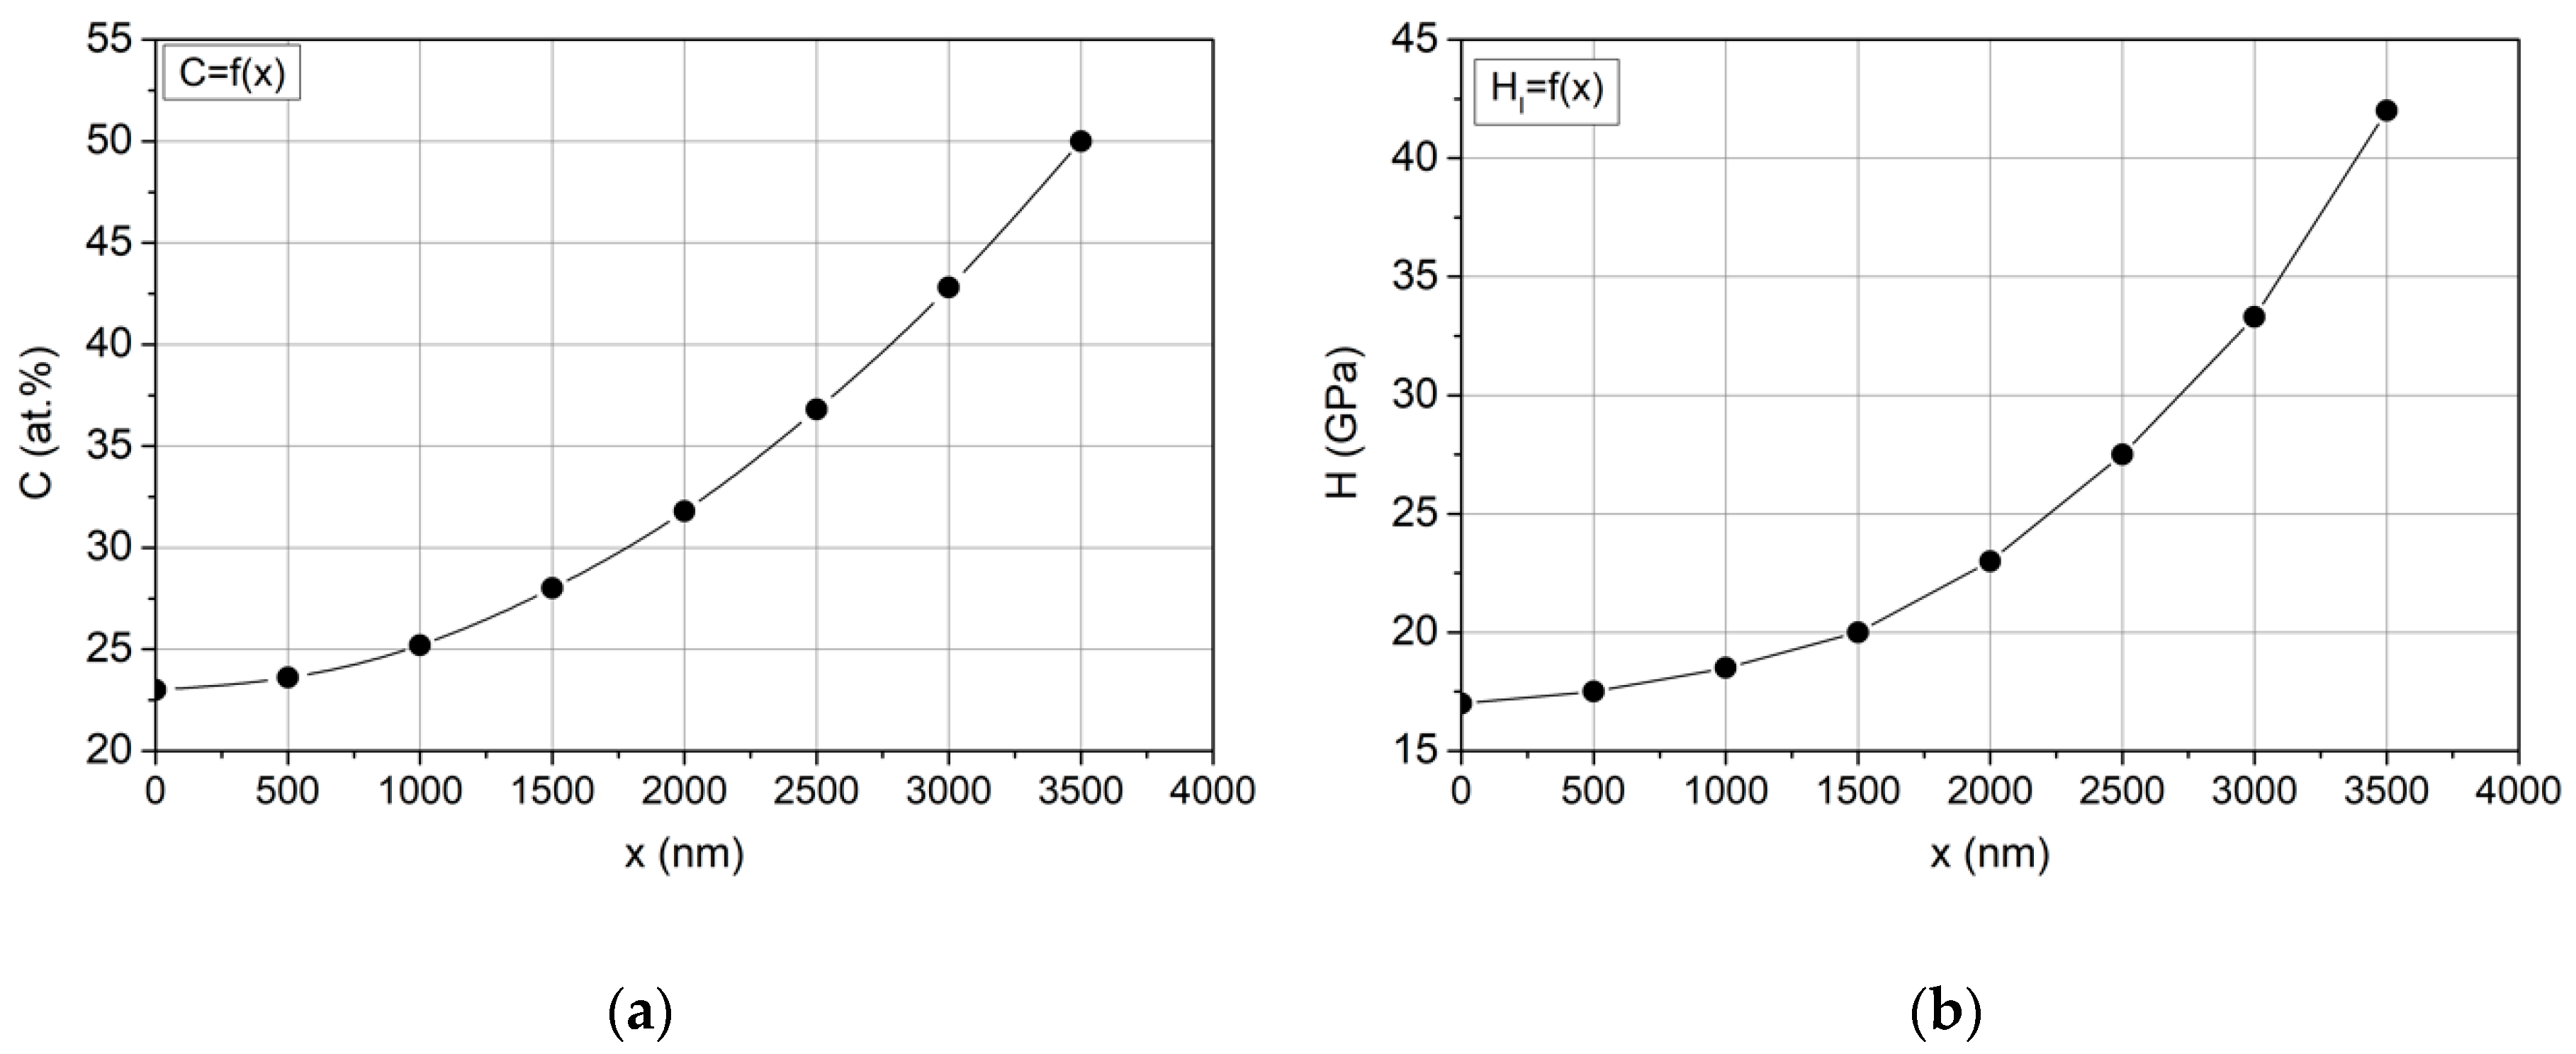
For this range, the carbon content in the coating in Formula (2) was accepted to be C0 = 23 and C1 = 50 at.%. The coating thickness D = 3500 nm was accepted.
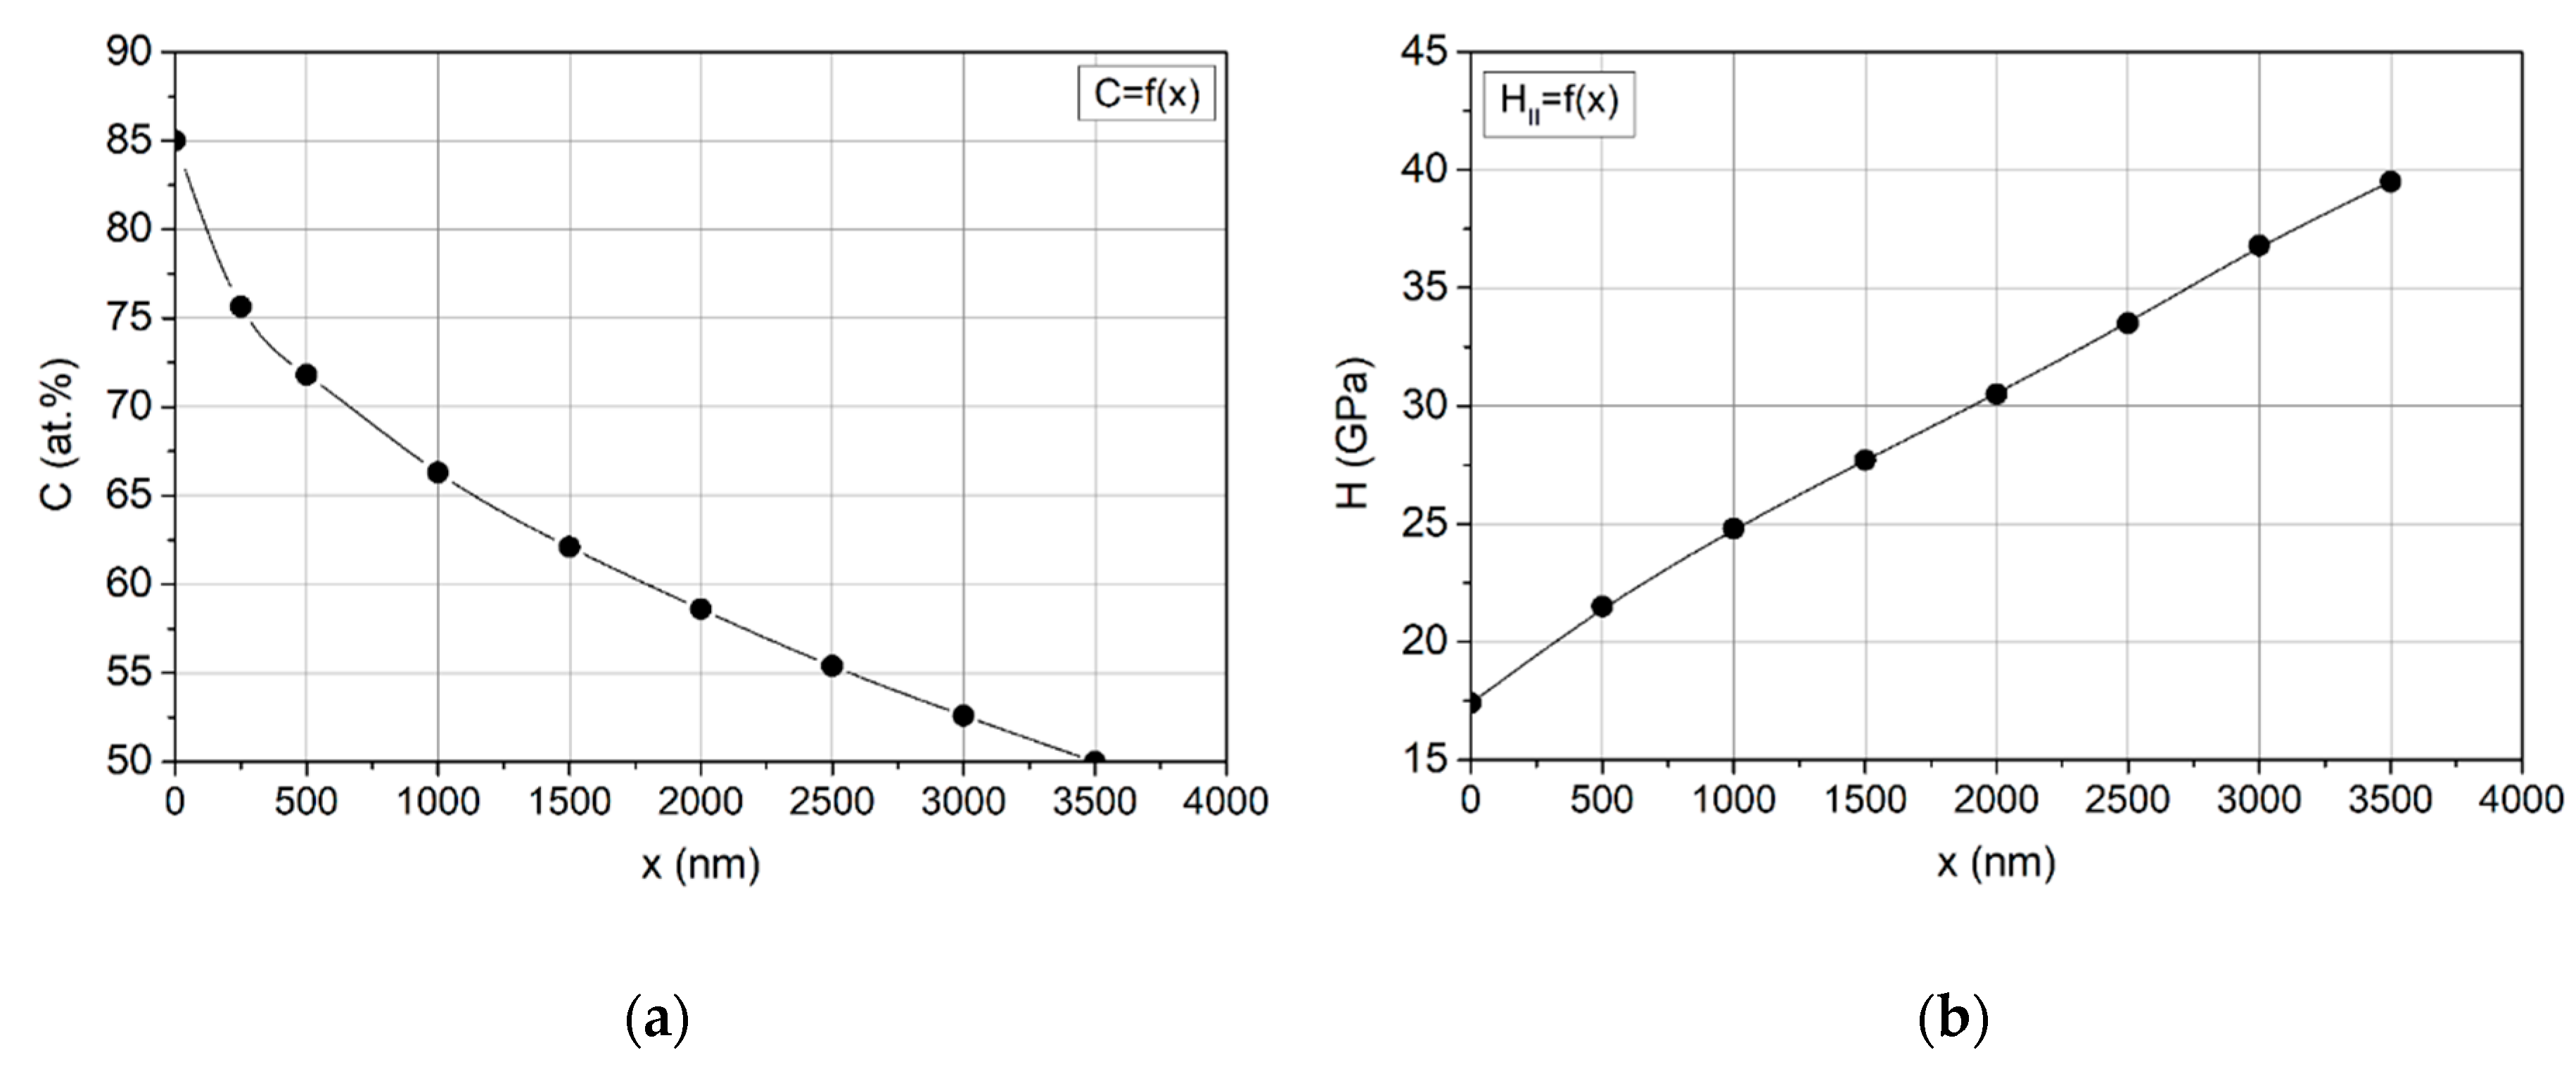
According to the carbon content profile (Figure 4a), using changes in hardness depending on carbon content (Figure 3a), the change of hardness was determined along the cross-section of the coating (Figure 4b).
Carbon content range of 50–85 at.%.
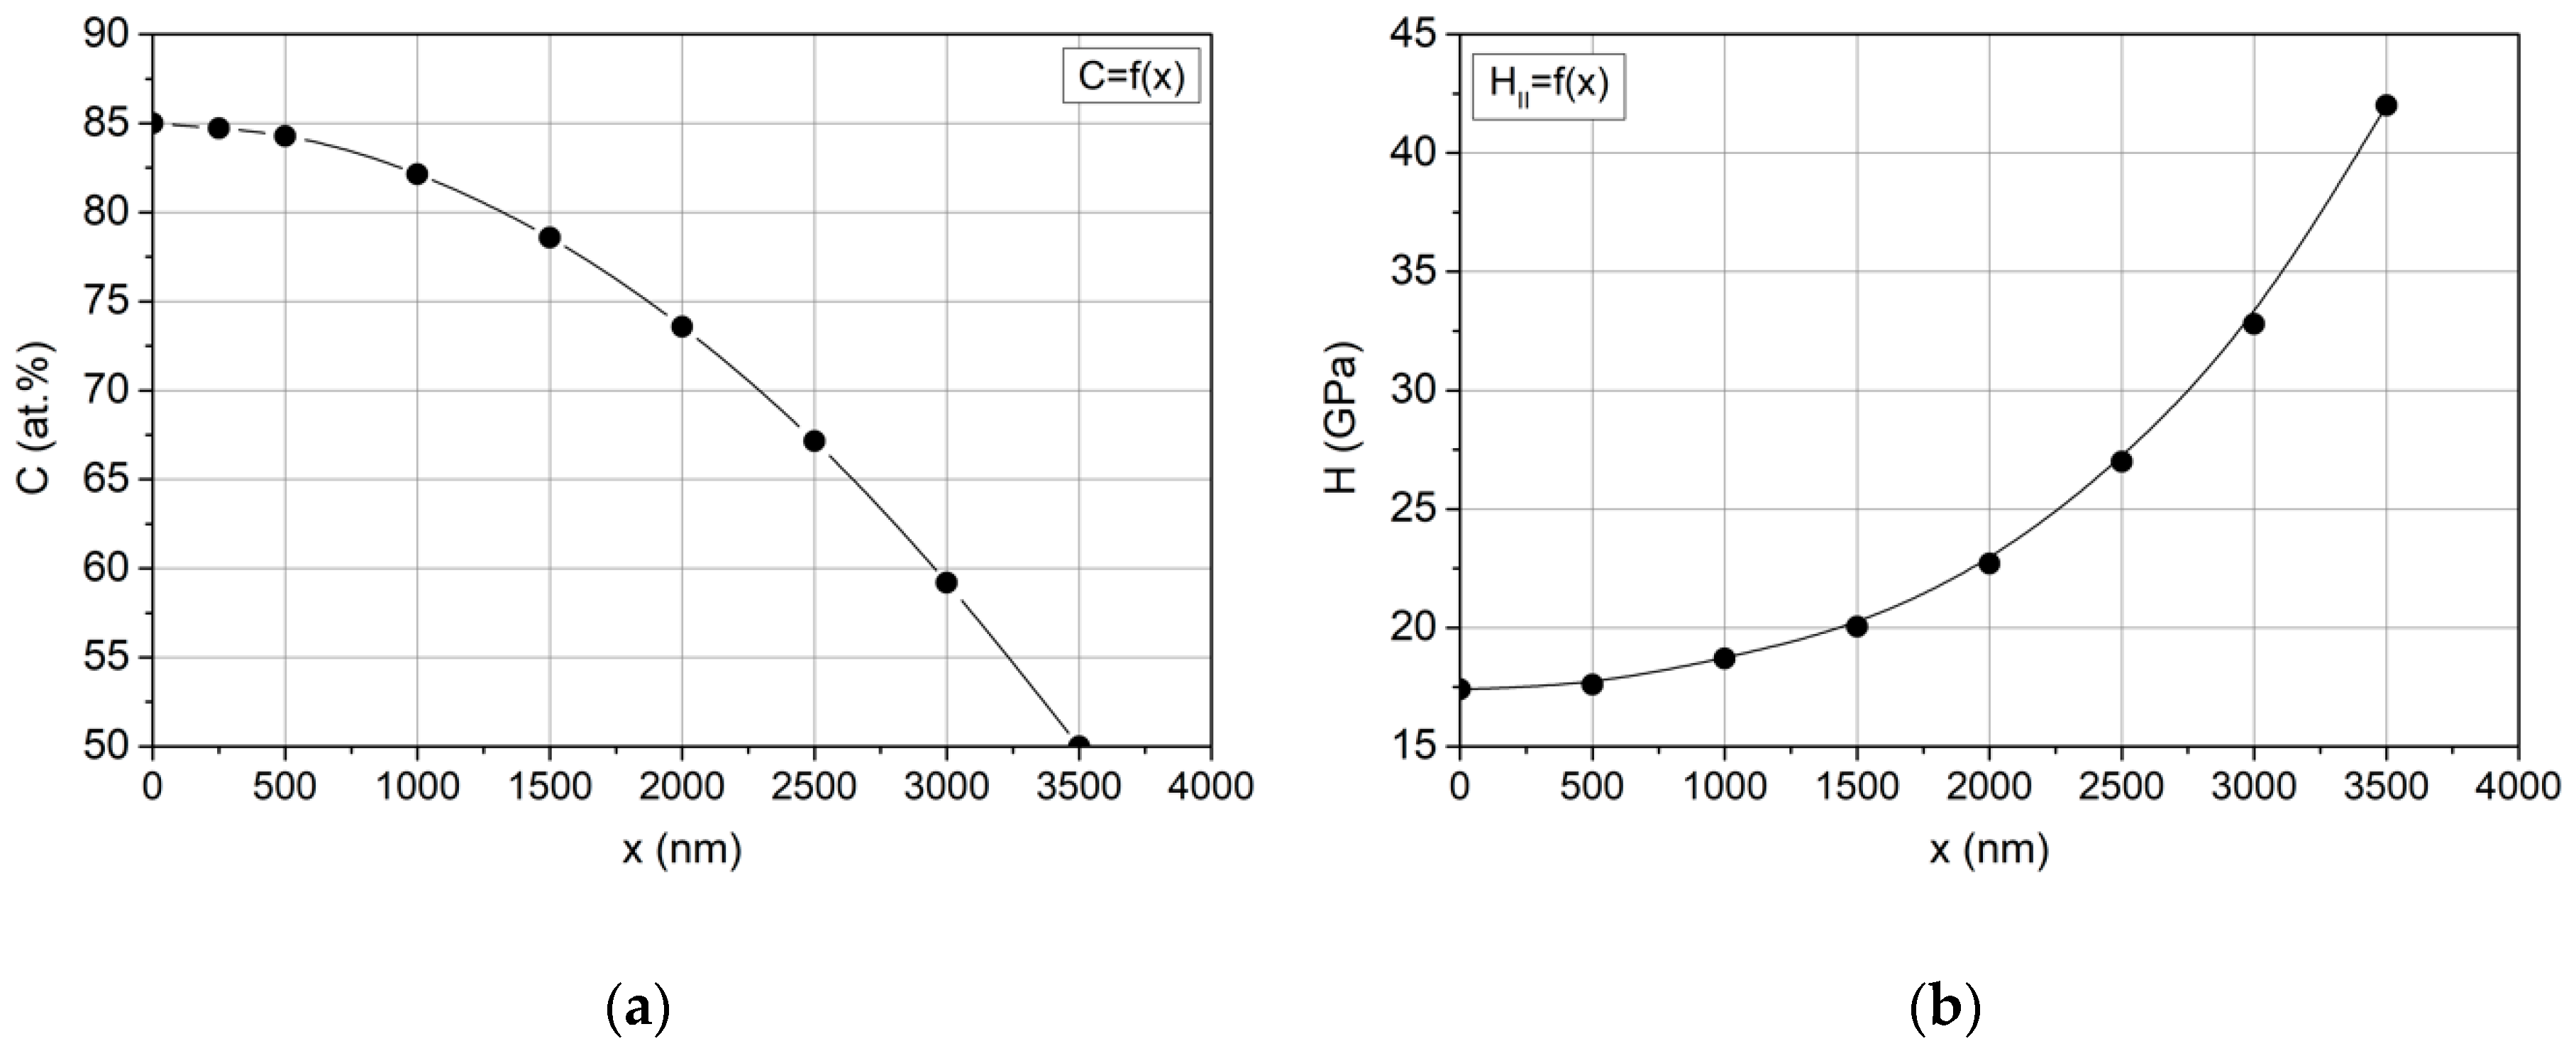
In this case, the carbon content change profile determined according to Formula (2) is shown in Figure 5a, and the hardness change profile is presented in Figure 5b. The following was accepted: C0 = 85 at.% of C, C1 = 50 at.%.
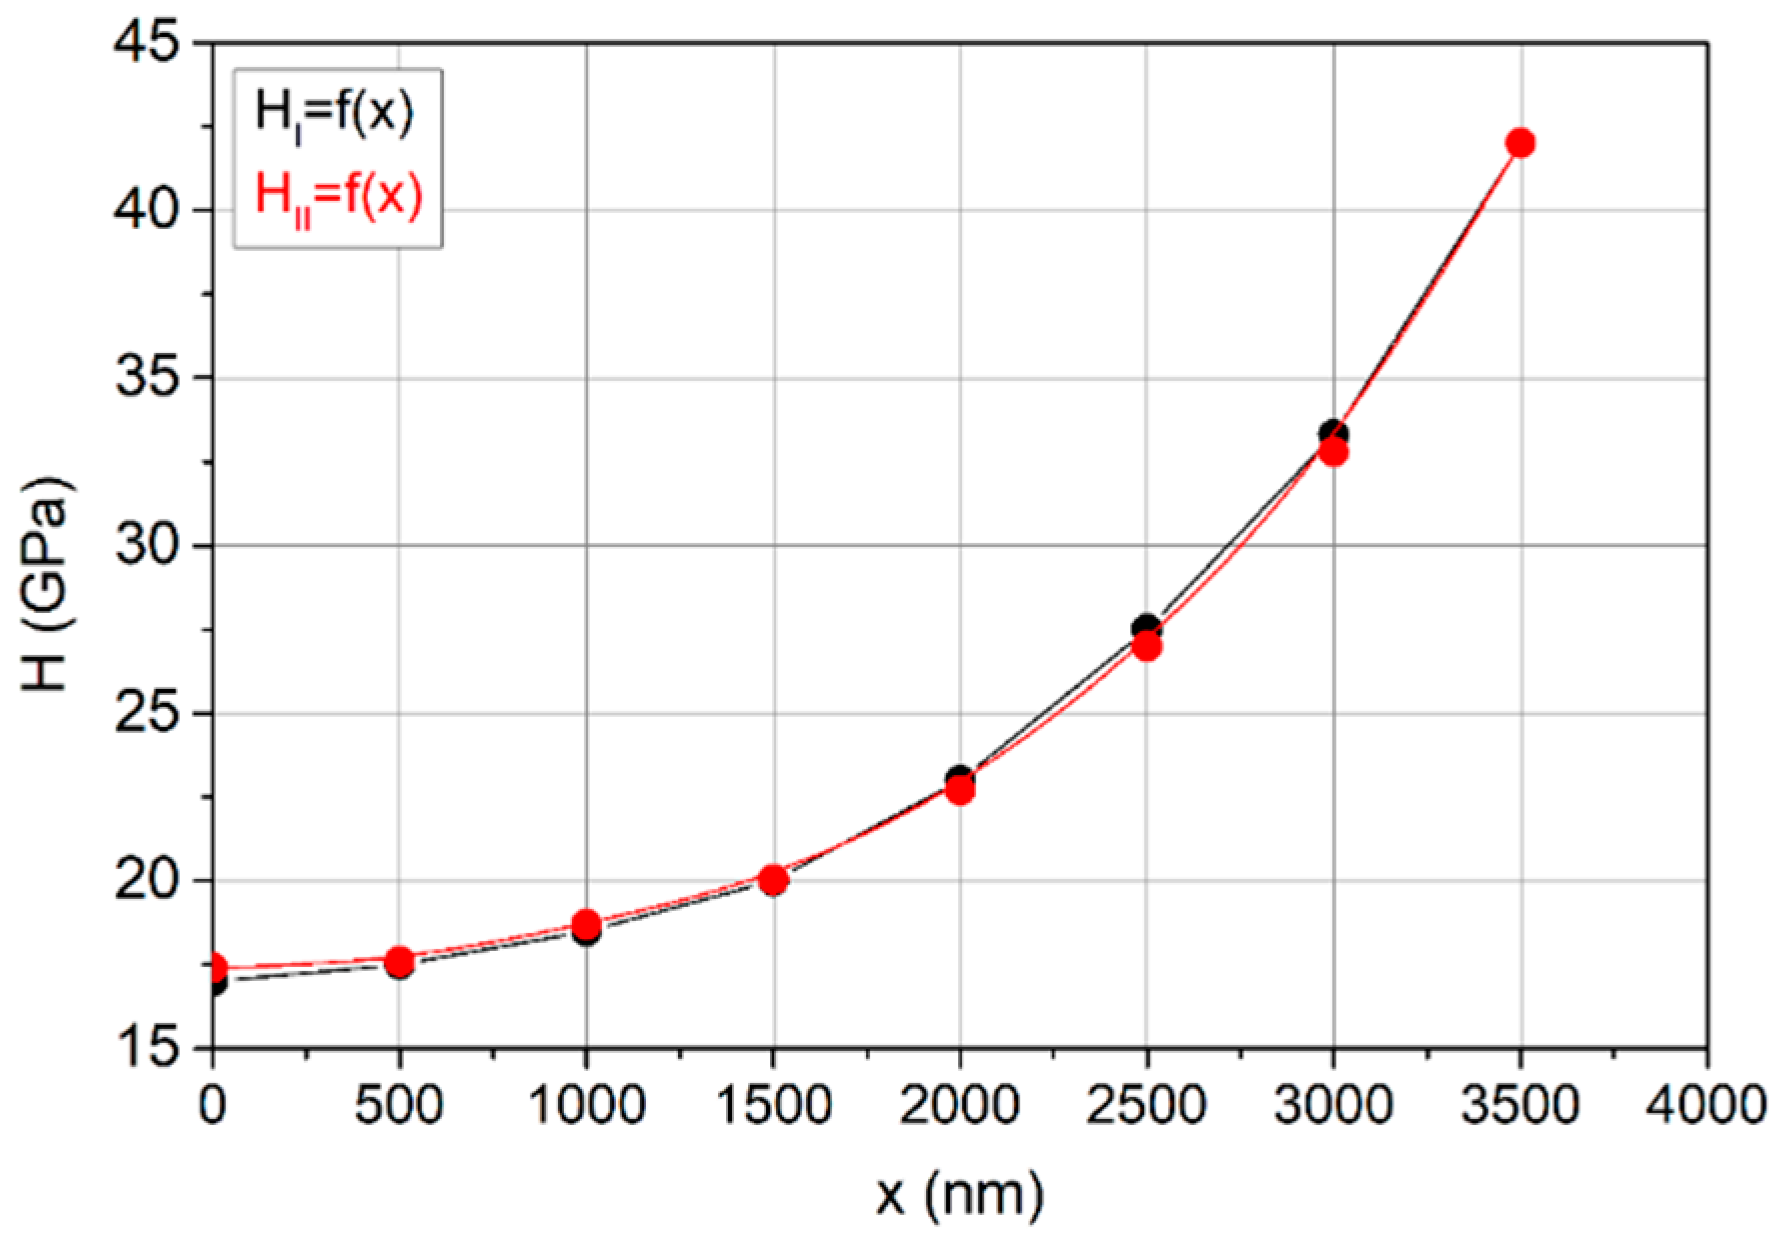
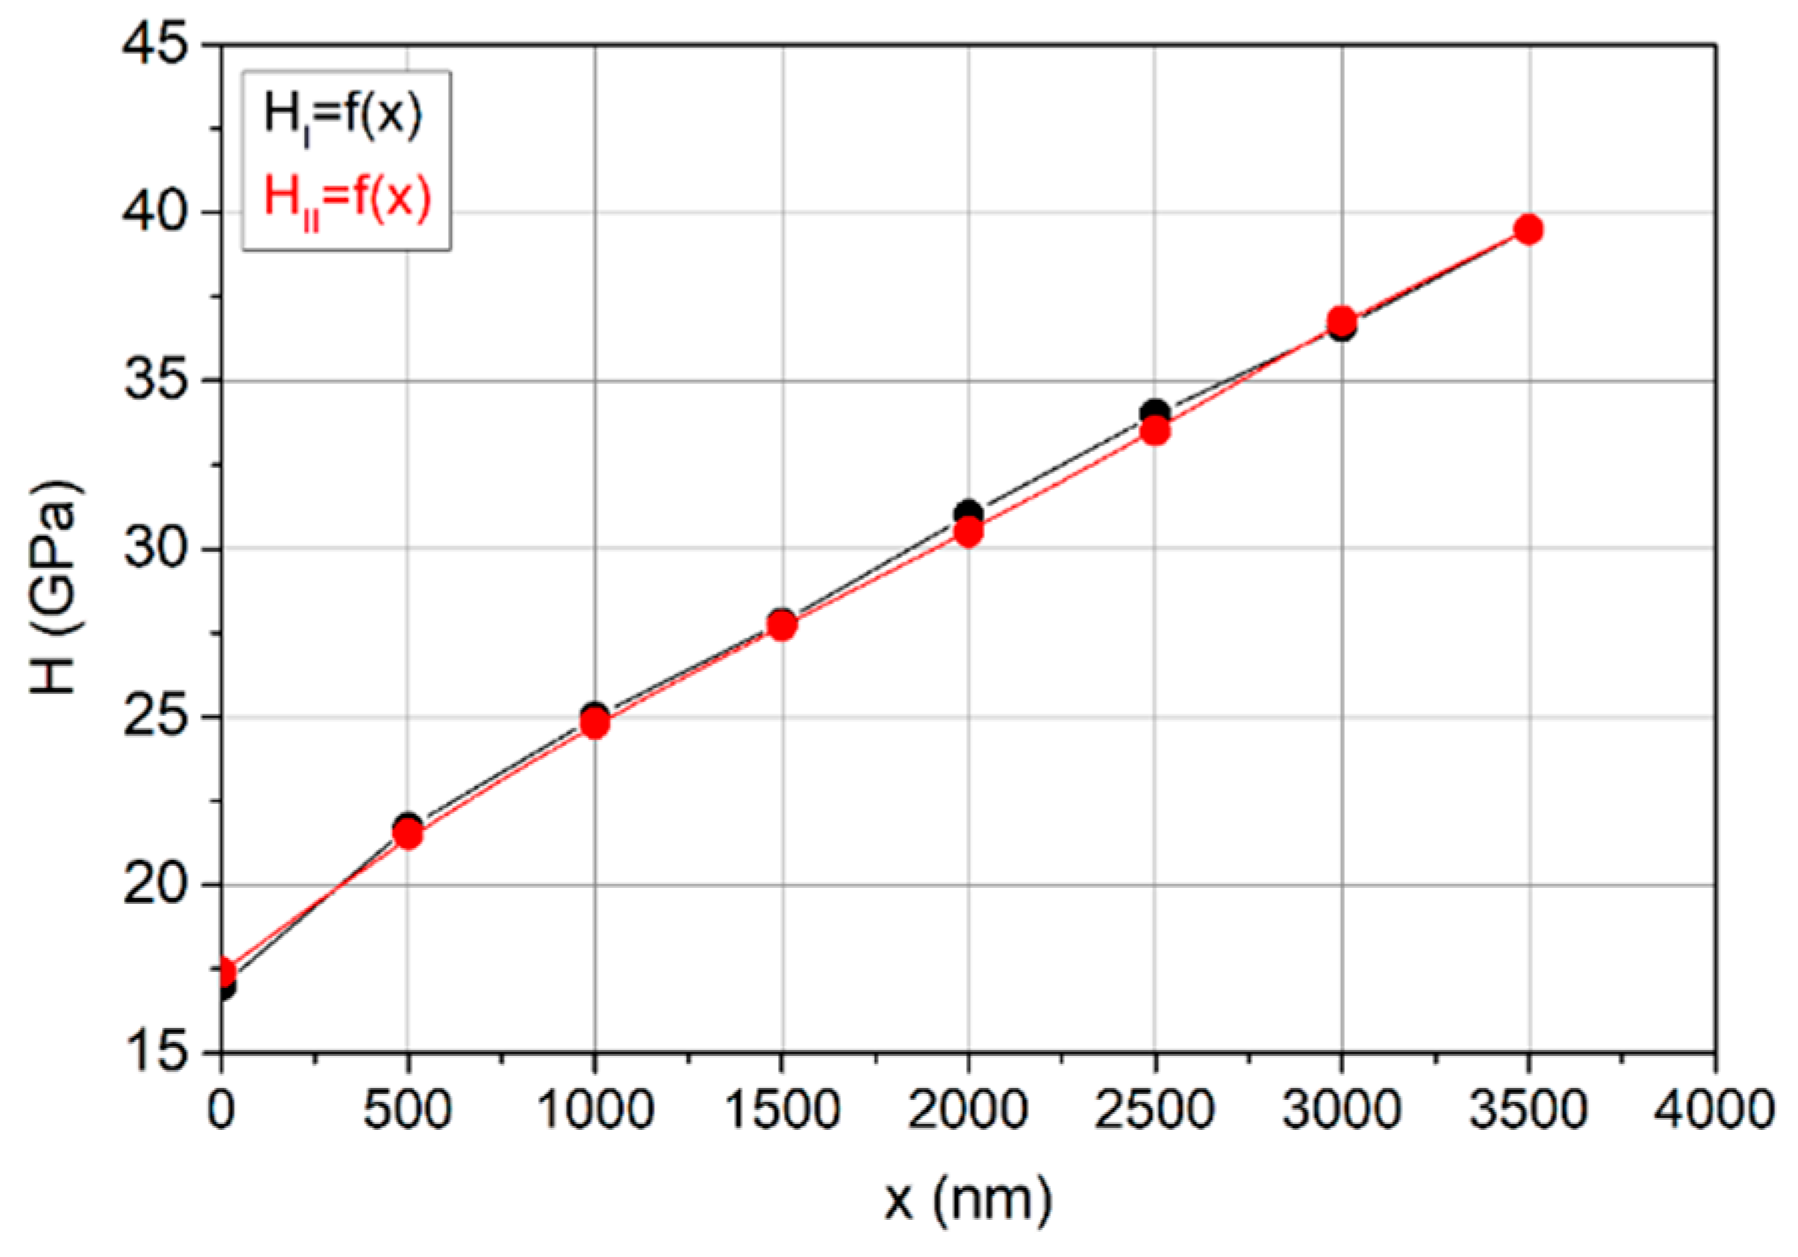
Figure 6 shows a comparison of the profiles of hardness changes in the coatings in the concentration range of 0–50 at.% and 50–85 at.% of C. As is evident, the objective was achieved, i.e., the same change in hardness along the cross-section of the coatings in the concentration range of 0–50 and 50–85 at.% was obtained.

3.3.2. Square Root Profiles

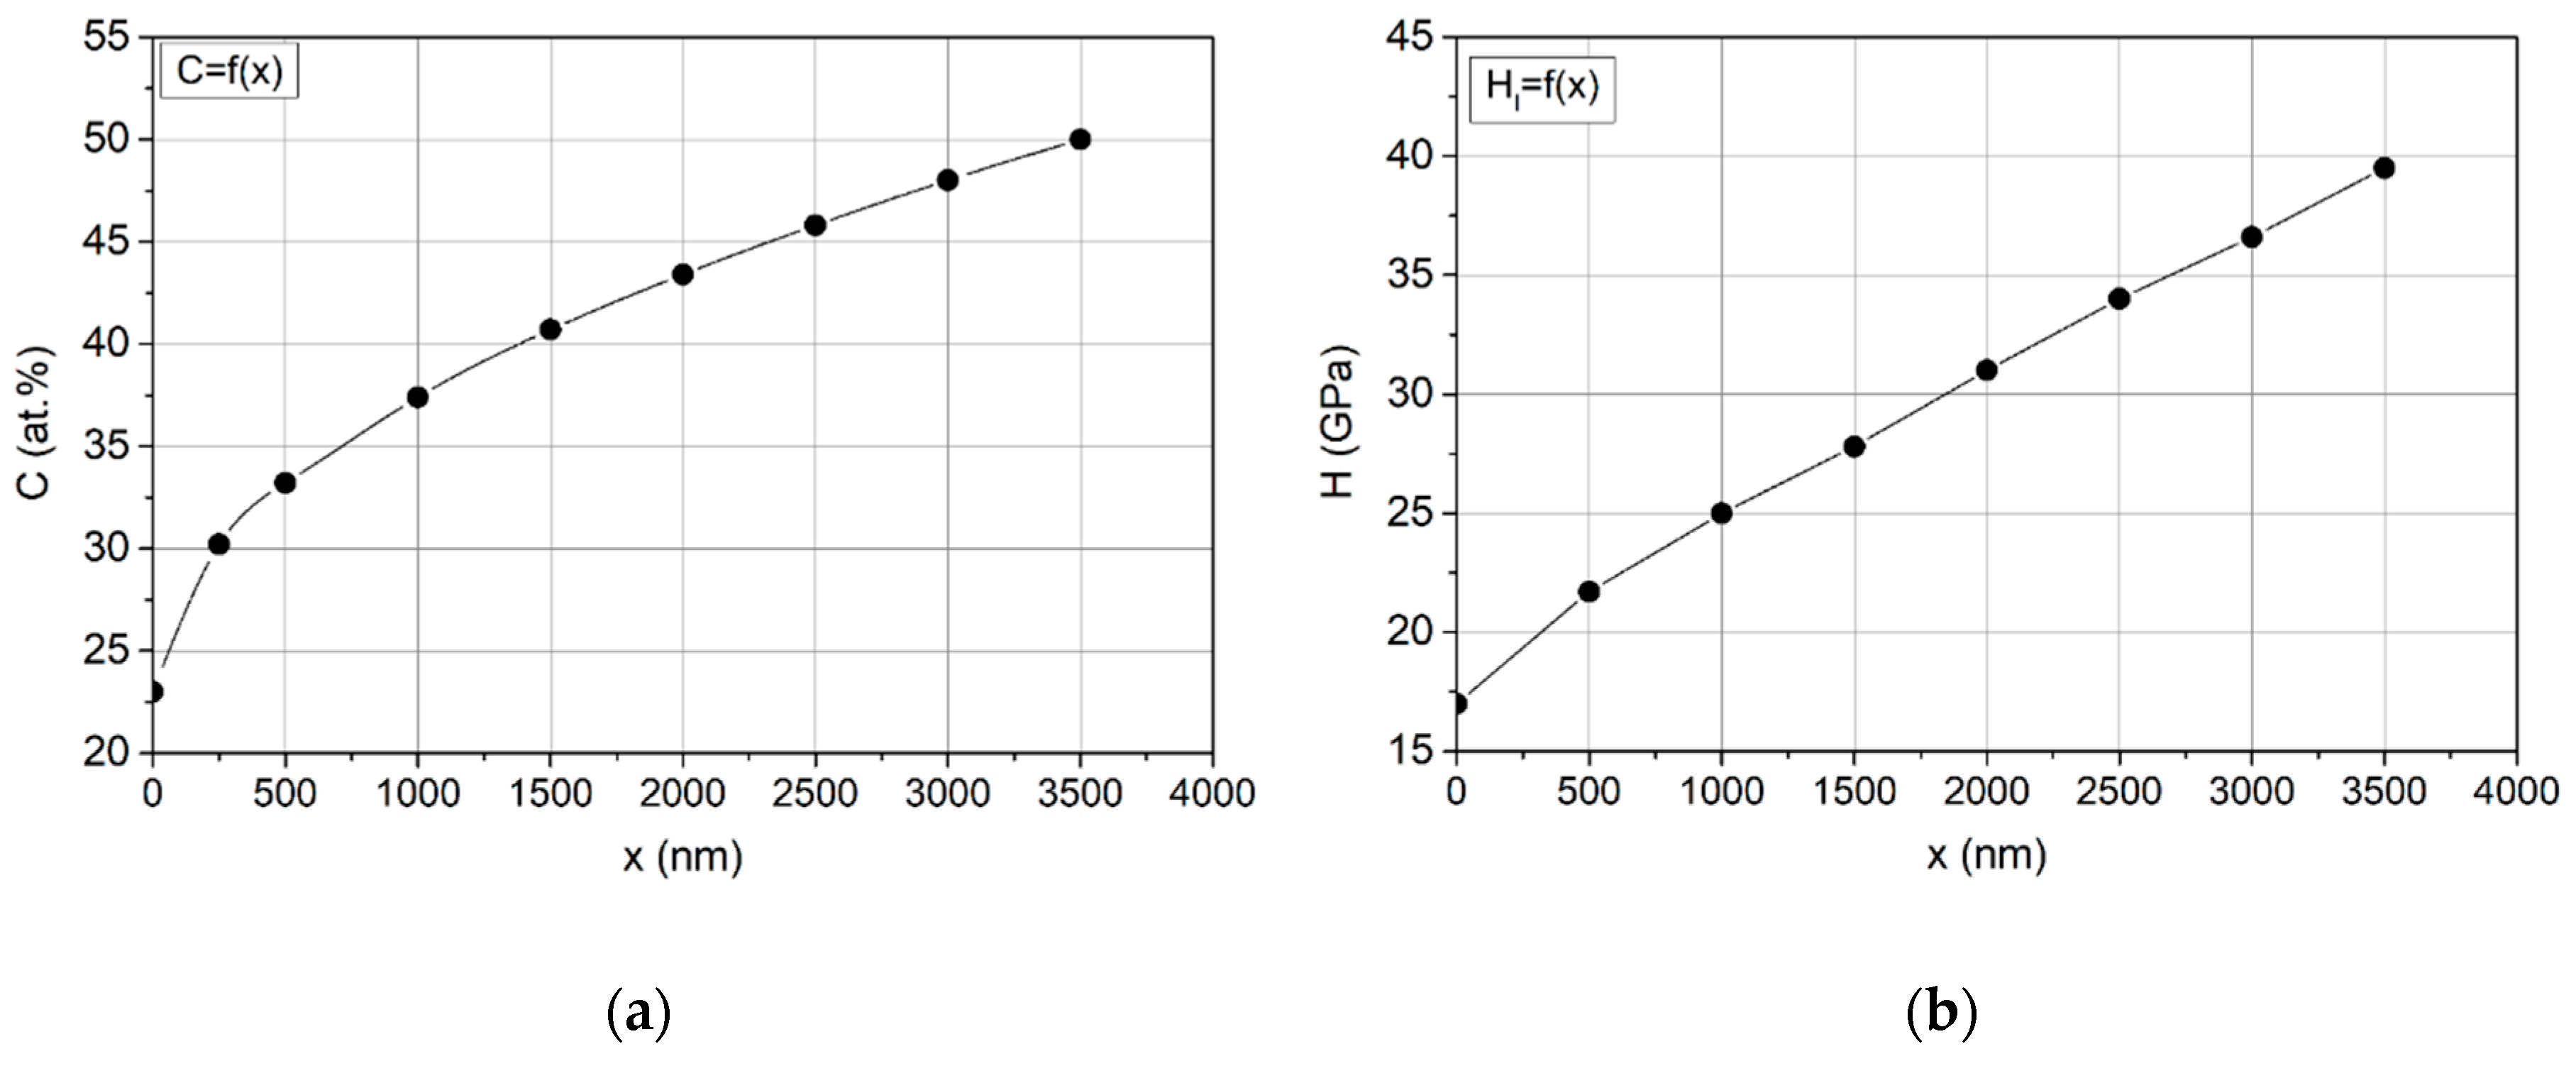
The same procedure was used for the accepted square root profiles of carbon concentration changes (Formula (3) for k = 0.5, Figure 7, Figure 8 and Figure 9).
Additionally, in this case (Figure 9), i.e., in the concentration range of 0–50 and 50–85 at.% of C, an analogous change in hardness along the cross-section was obtained.

3.4. Results of Investigations in Relation to Coating Properties

3.4.1. Thickness of Coatings

In order to validate the thickness of the coatings produced, the so-called Calotest [25,26] was performed in accordance with the PN-EN ISO 26423:2016-05 Standard [27]. The results obtained (Table 2) indicated that the thicknesses of all the coatings were in the range of 3.2–3.8 μm.

3.4.2. Hardness of Coatings

In order to qualitatively verify the profiles of hardness changes in the coatings, surface hardness was measured with three different maximum loads, resulting in indentation depths of 0.15, 0.3 and 0.5 μm. The average values determined from five measurements are presented in Figure 10. As it can be seen, the values obtained represent the intended change in hardness values and, within the limits of the experimental error, both the parabolic and square root profiles of hardness changes coincided for coatings in the ranges of 0–50 and 50–85 at.% of C. However, it must be taken into account that there were diametrically different changes in the nano/microstructure in those coatings that were responsible for the increase in hardness from the substrate to the top layer in the carbon concentration range under consideration. The same hardness value was the result of other interactions between crystallites that followed from their different nanometric sizes, their orientations and the separation of crystallites through the amorphous phase.

3.4.3. Evaluation of Coating Adhesion Using the Scratch Test

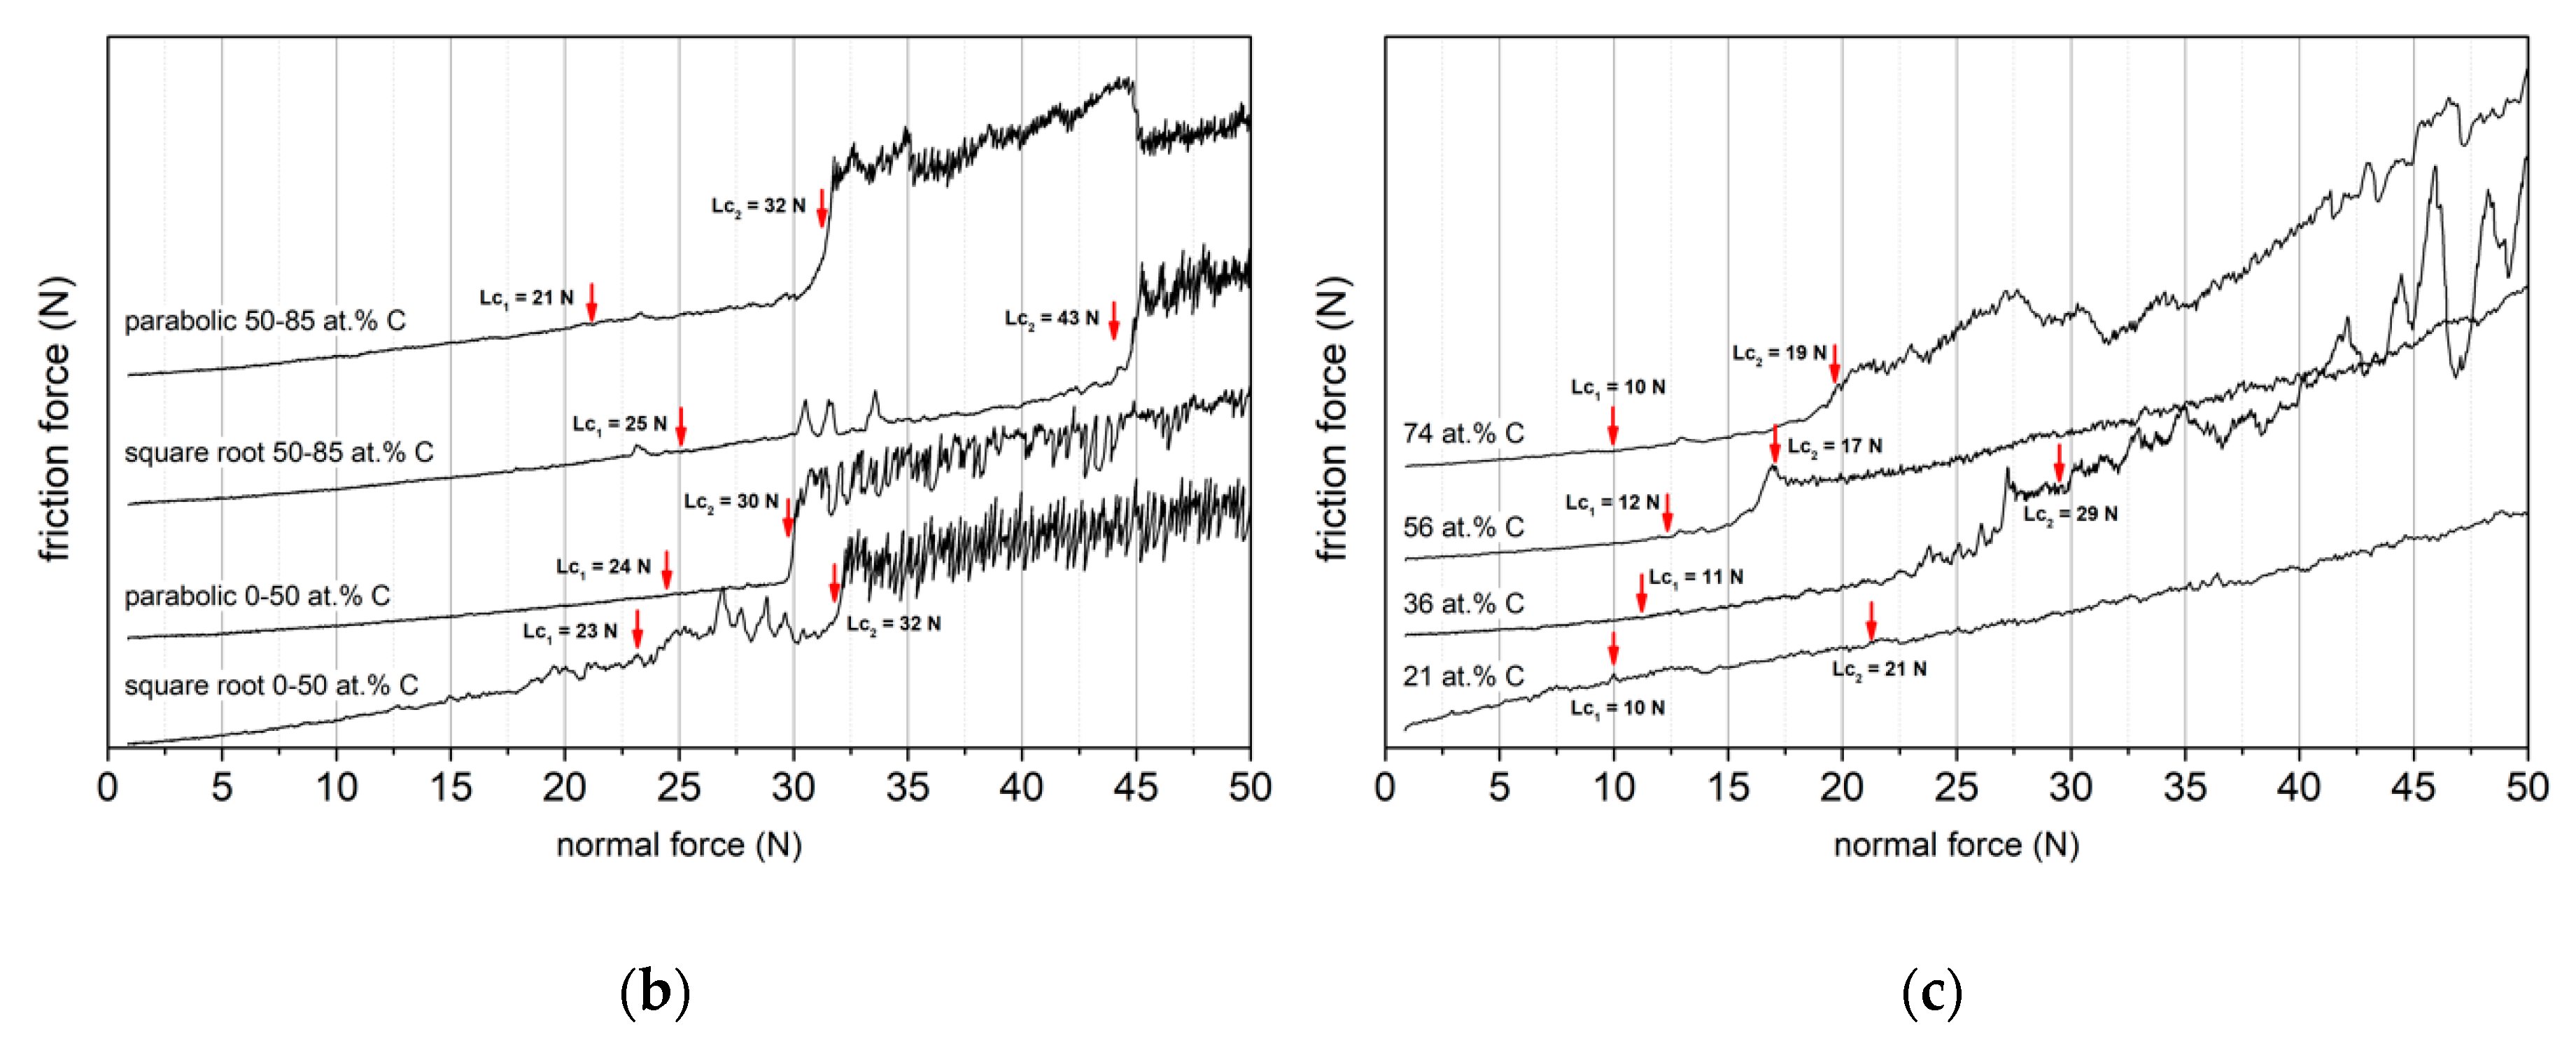
In accordance with the methodology presented in Section 2.5, the so-called scratch test was carried out on all of the gradient coatings produced and, for the purpose of comparison, on coatings with a determined and fixed carbon concentration. The determined values of critical loads Lc1 and Lc2 are presented in Figure 11a, and the dependence of friction force from normal force is presented in Figure 11b (for gradient coatings) and in Figure 11c (for selected single-layer coatings with fixed carbon content). The results obtained demonstrated that the values of critical forces Lc1 of all of the gradient coatings tested, which proved the occurrence of cohesion damage, were more than twice as high as the values of these forces for single-layer coatings. The tests presented also demonstrated that the coating with the square root profile (k = 0.5), in the concentration range of 50–85 at.%, is characterized by the highest adhesion, determined on the basis of critical load LC2.
The comparison of the values of the Lc2 critical forces for coatings in the range of 0–50 and 50–85 at.% of C with the square root hardness profile showed that, regardless of the hardness, the nano/microstructure had a significant impact on the adhesion of the coatings, as also demonstrated by other authors [28,29,30,31,32,33]. On the other hand, the reason for the higher value of the critical force Lc2 for a coating with an square root hardness profile compared to a coating with a parabolic profile, in the case of coatings in the range 50–85 at.% of C, may be higher changes in hardness in the area adjacent to the substrate/coating interface for the first of the mentioned coatings (Figure 11).

3.4.4. Evaluation of Coatings Using Rockwell C Method

A qualitative assessment of the mechanical properties of the coatings was also performed on the basis of observations of the indentation created in the Rockwell C test. As is well-known, this destructive test can clearly distinguish two properties of substrate/coating systems, i.e., interfacial adhesion as well as cohesion and brittleness of the coating [34,35]. A high load combined with the contact geometry induces shear stress by the interfacial surface. Well-adhering coatings are resistant to these shear stresses, and they do not delaminate around the indentation imprint. Normal stresses being greater than critical stresses, i.e., greater than the strength of the coating, they cause interfacial bond release or chipping. The release of the interphase bond is correlated with the stress tensor component, i.e., shear stress, which causes micro- and macro-delamination.
An analysis of the indentation imprint (Figure 12) demonstrated that only small areas of delamination were observed in coatings, with carbon contents in the range of 50–85 at.%. Considering the nature of these damages, these coatings could be assigned, according to the classification provided in [36], as HF2–3.
In all of the coatings, there were radial cracks of varying intensity, which pointed to the brittleness of the coatings. Among the coatings tested, by far the smallest number of cracks and practically no delamination was observed for the coating with a parabolic carbon content profile in the 0–50 at.% range. This result is somewhat of a contradiction in relation to the scratch test of adhesion, as a result of which the lowest value of the Lc2 index was noted for this coating (Figure 11a). A similar discrepancy in the results of the scratch test and Rockwell C test was noted in [36], where the same CrN coating was deposited on different substrates. In all of the coatings analyzed, around the indentations, extensive peripheral cracks were observed. The formation of these cracks was associated with the occurrence of a plastic deformation area of the substrate around the indentation.

3.4.5. H/E and H3/E2

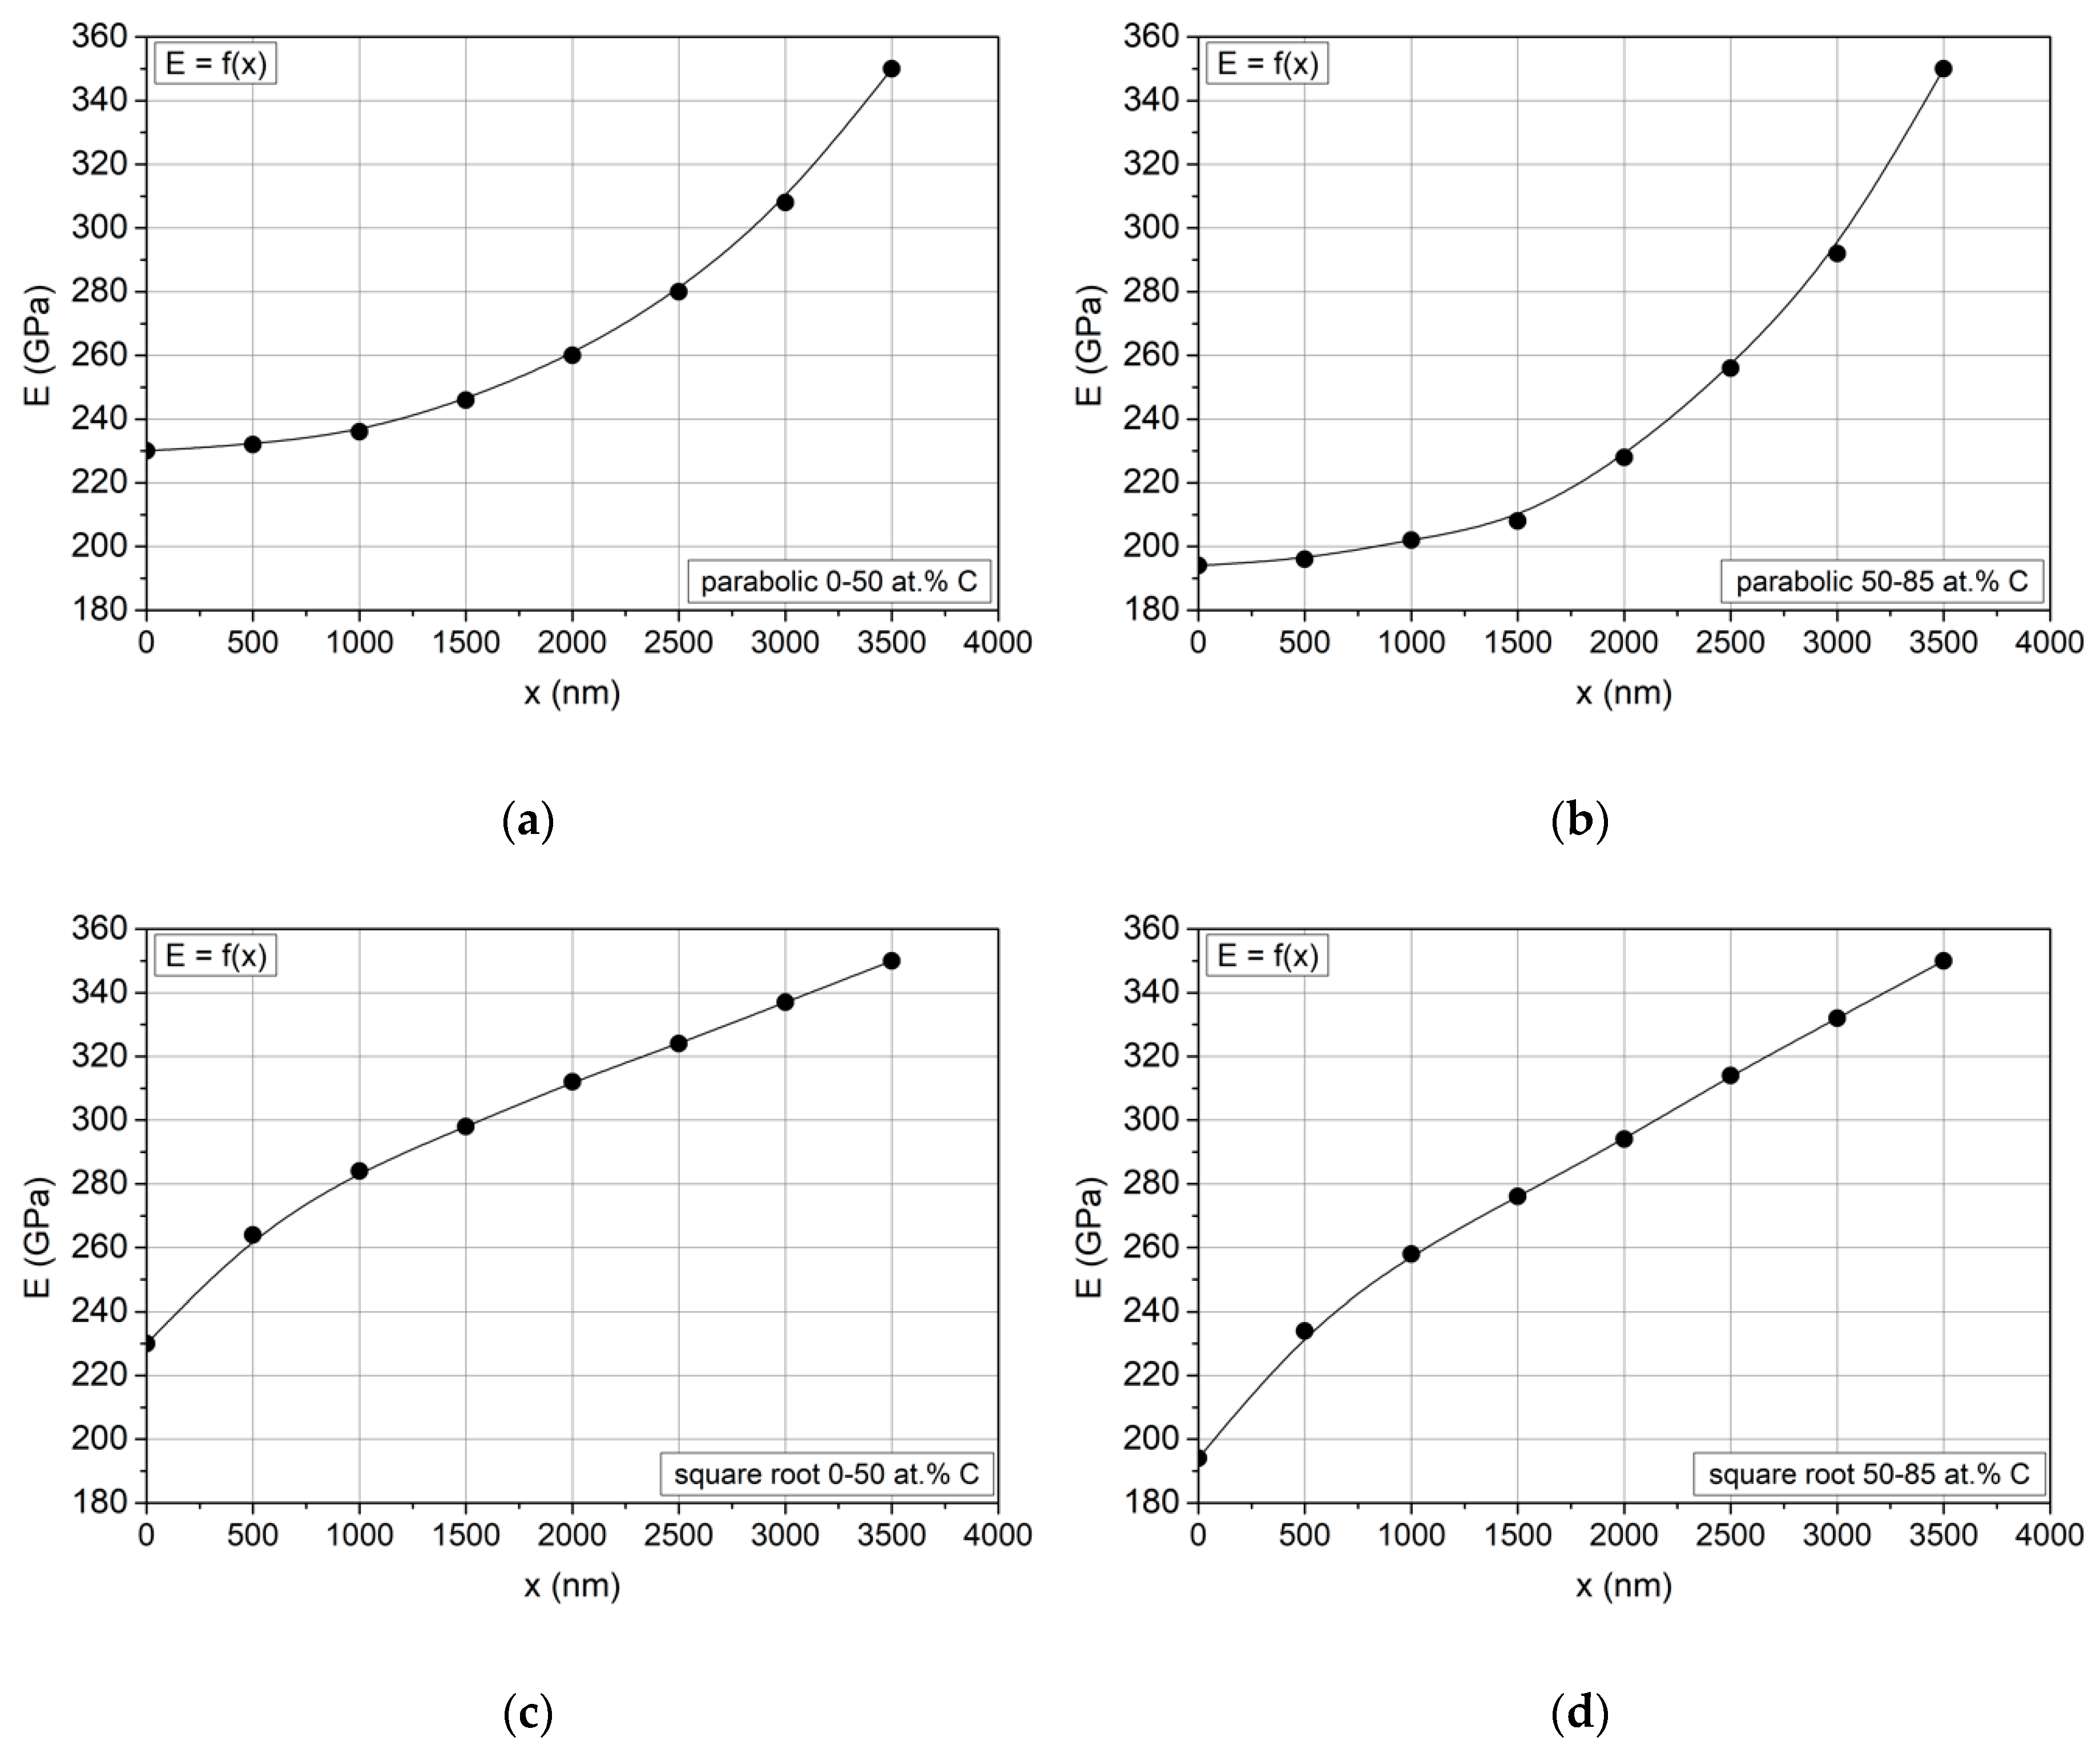
In accordance with the procedure for the determination of the profile of hardness change in coatings with varying carbon contents in accordance with square root and parabolic profiles (Section 3.3), analogous profiles were determined concerning changes in Young’s modulus values (Figure 13).
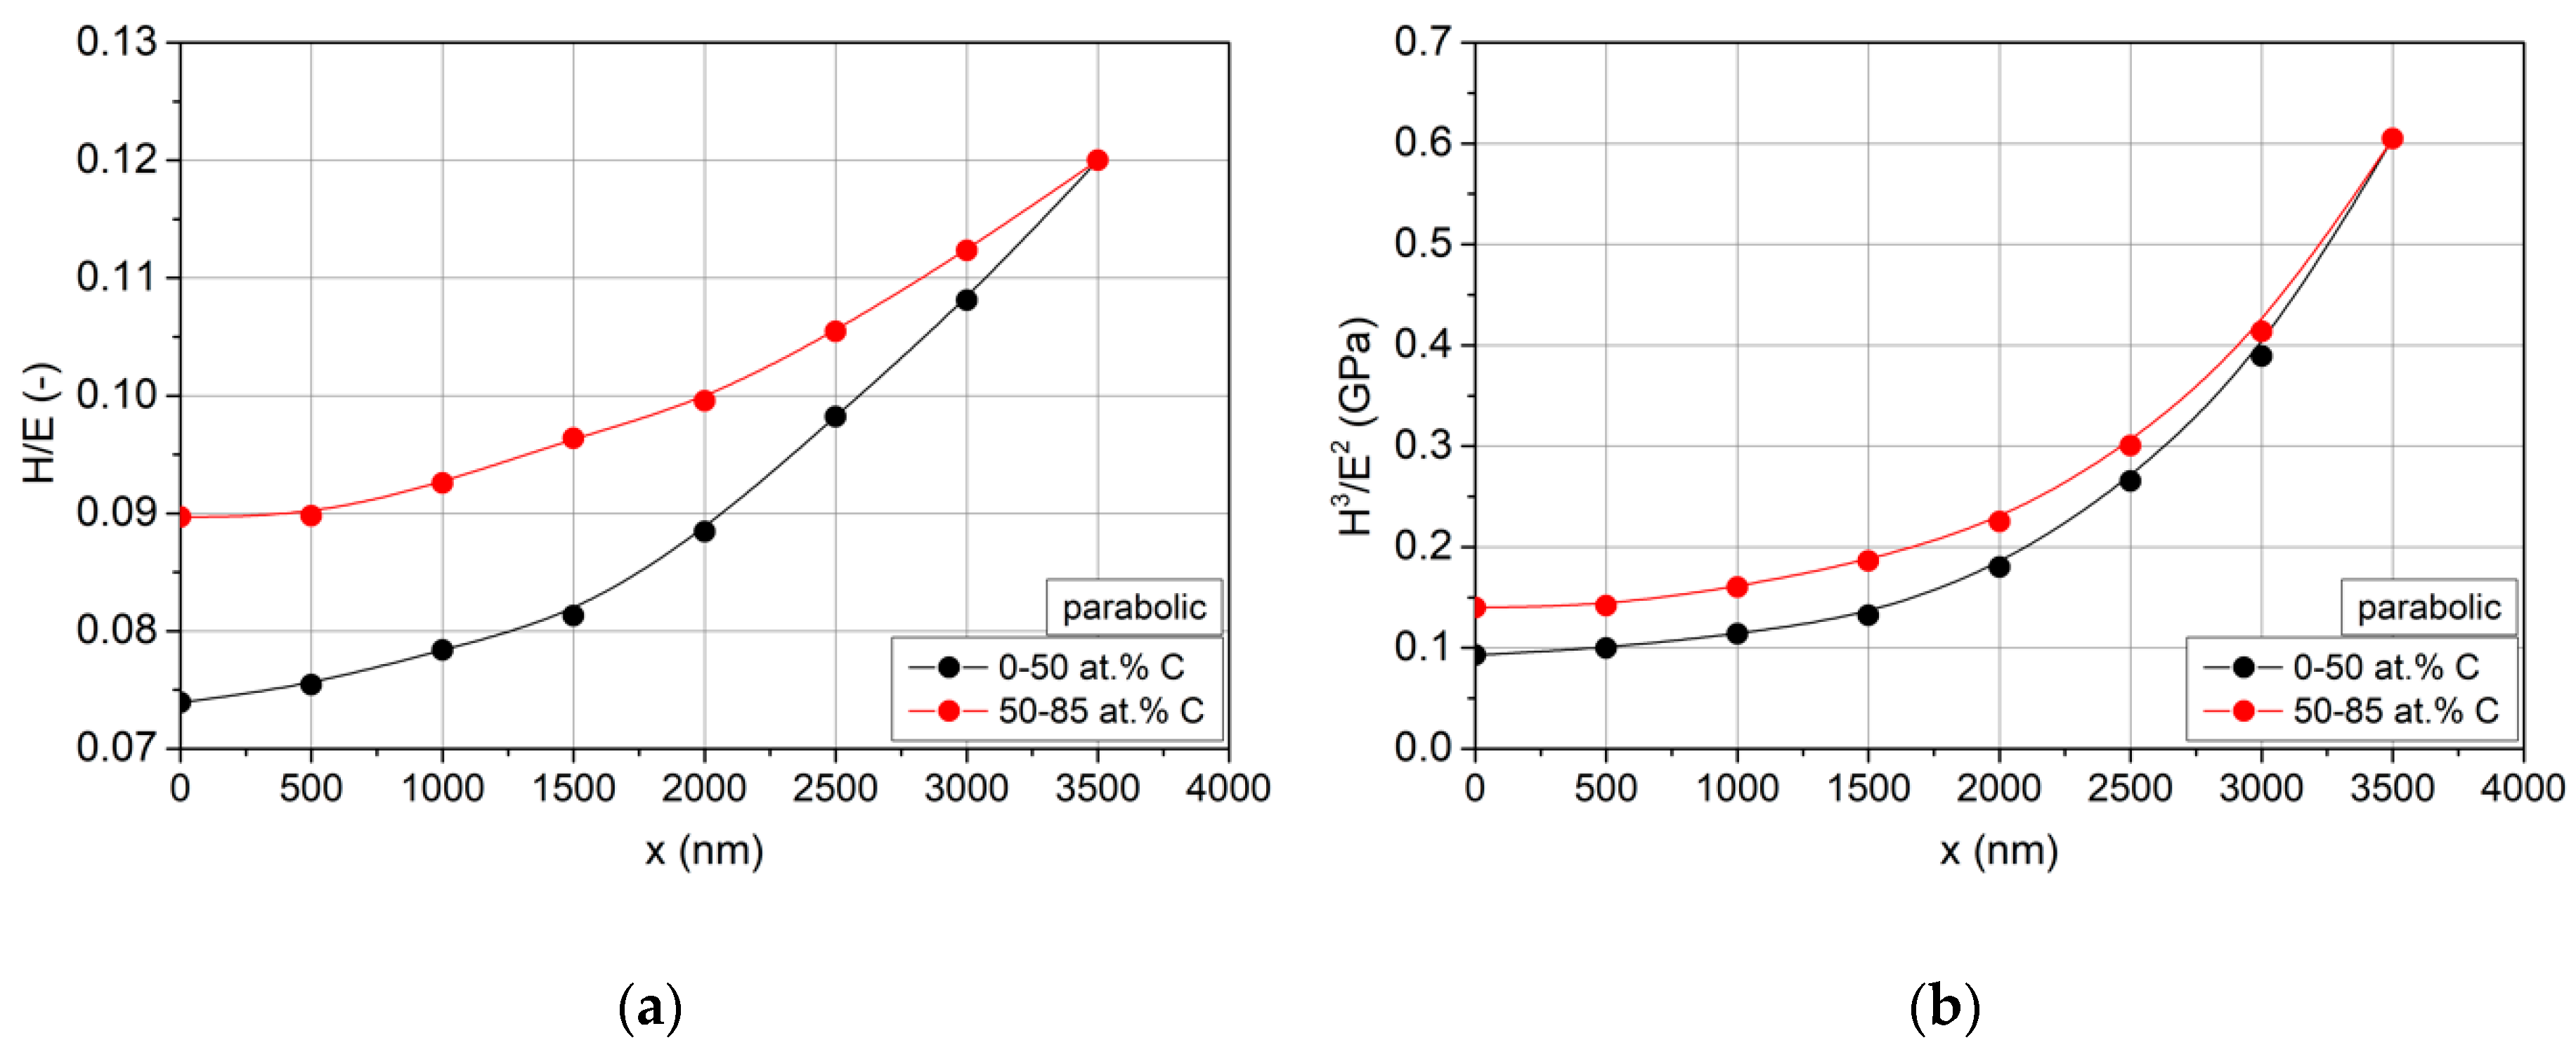
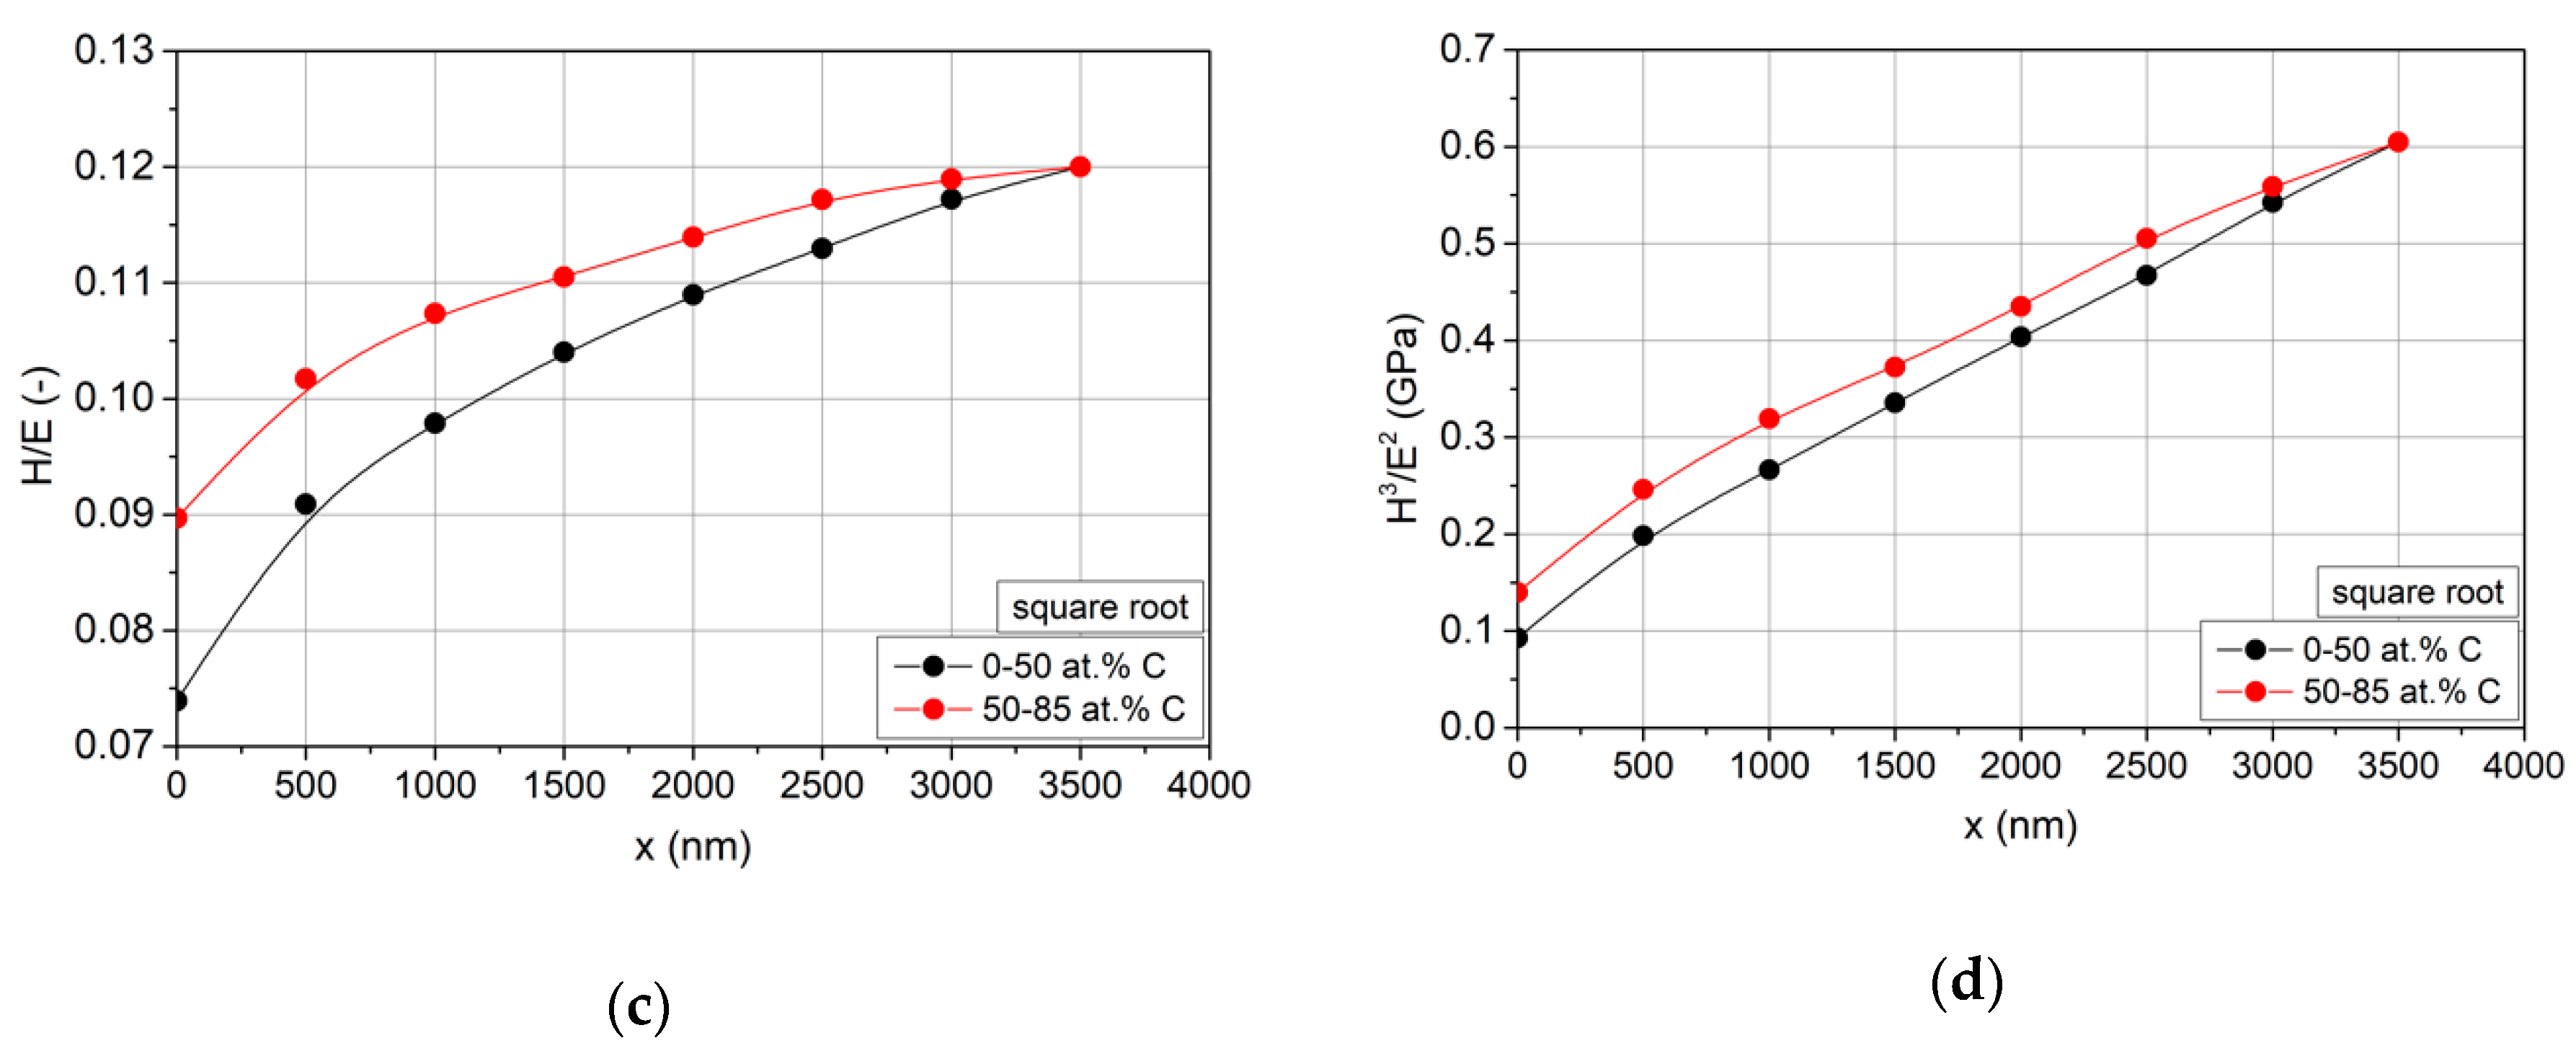
Taking into account the obtained profiles and hardness change profiles (Figure 3), changes in H/E and H3/E2 ratios were determined. The former ones, according to [36,37,38,39,40,41,42,43], were related to resistance to elastic stress, and the latter ones were related to resistance to plastic deformation. Ratios for coatings in the ranges of 0–50 and 50–85 at.% of C are shown in Figure 14.
The profiles obtained of changes in H/E and H3/E2 ratios corresponded to the values of critical forces determined in the scratch test. Higher values of these ratios and higher values of critical force Lc2 are characteristic for coatings with carbon contents in the range of 50–85 at.%. This is particularly true for the elastic strain resistance, i.e., H/E (Figure 14a,c). In the case of resistance to plastic deformation, there were no longer such significant differences in the values of H3/E2 ratios for coatings in the carbon concentration ranges analyzed (Figure 14b,d). This was caused by a relatively high hardness of the coatings tested that changed in the range of 17–42 GPa [42].

3.4.6. Friction and Wear

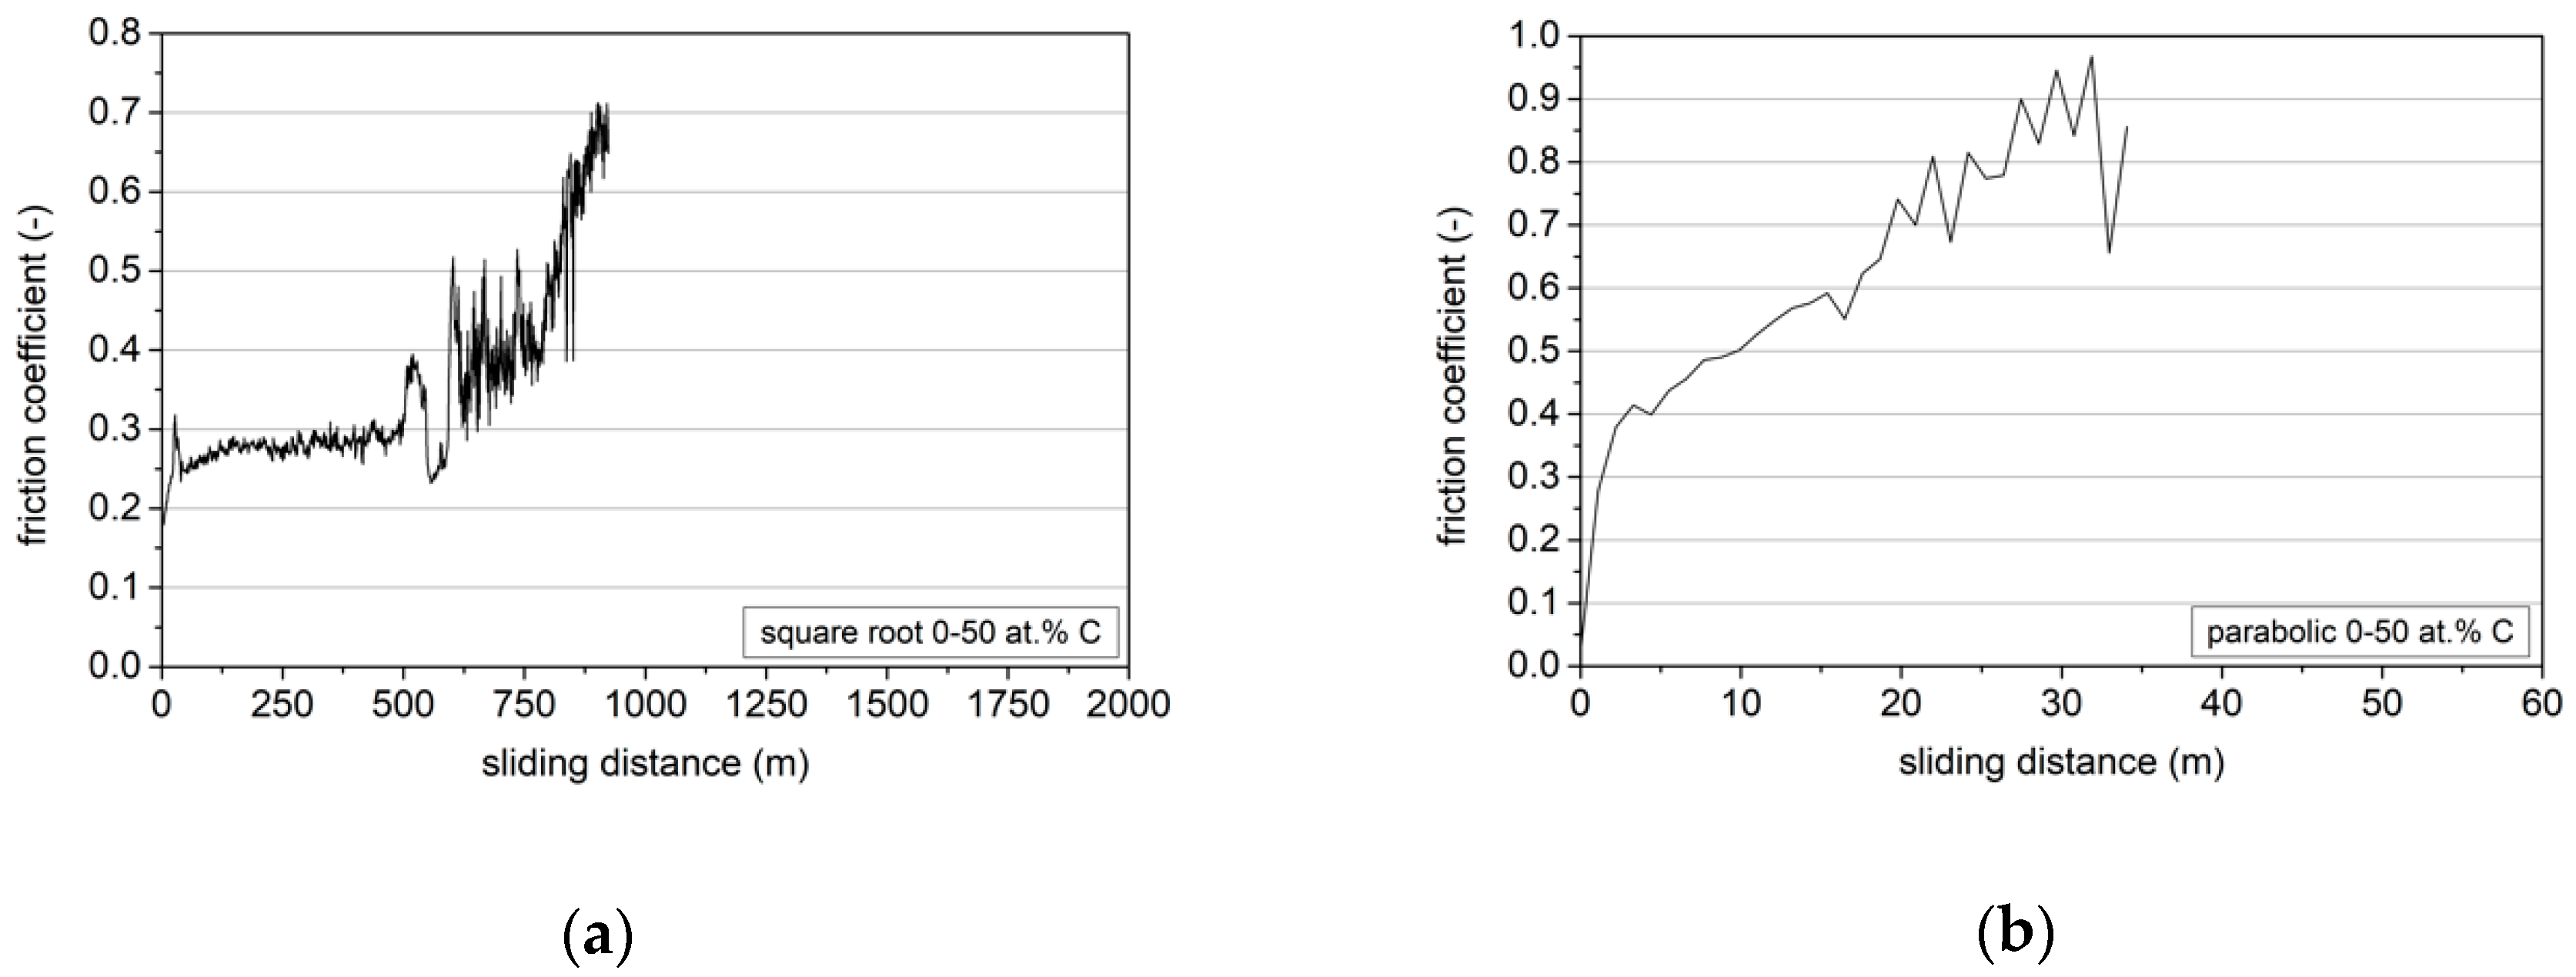
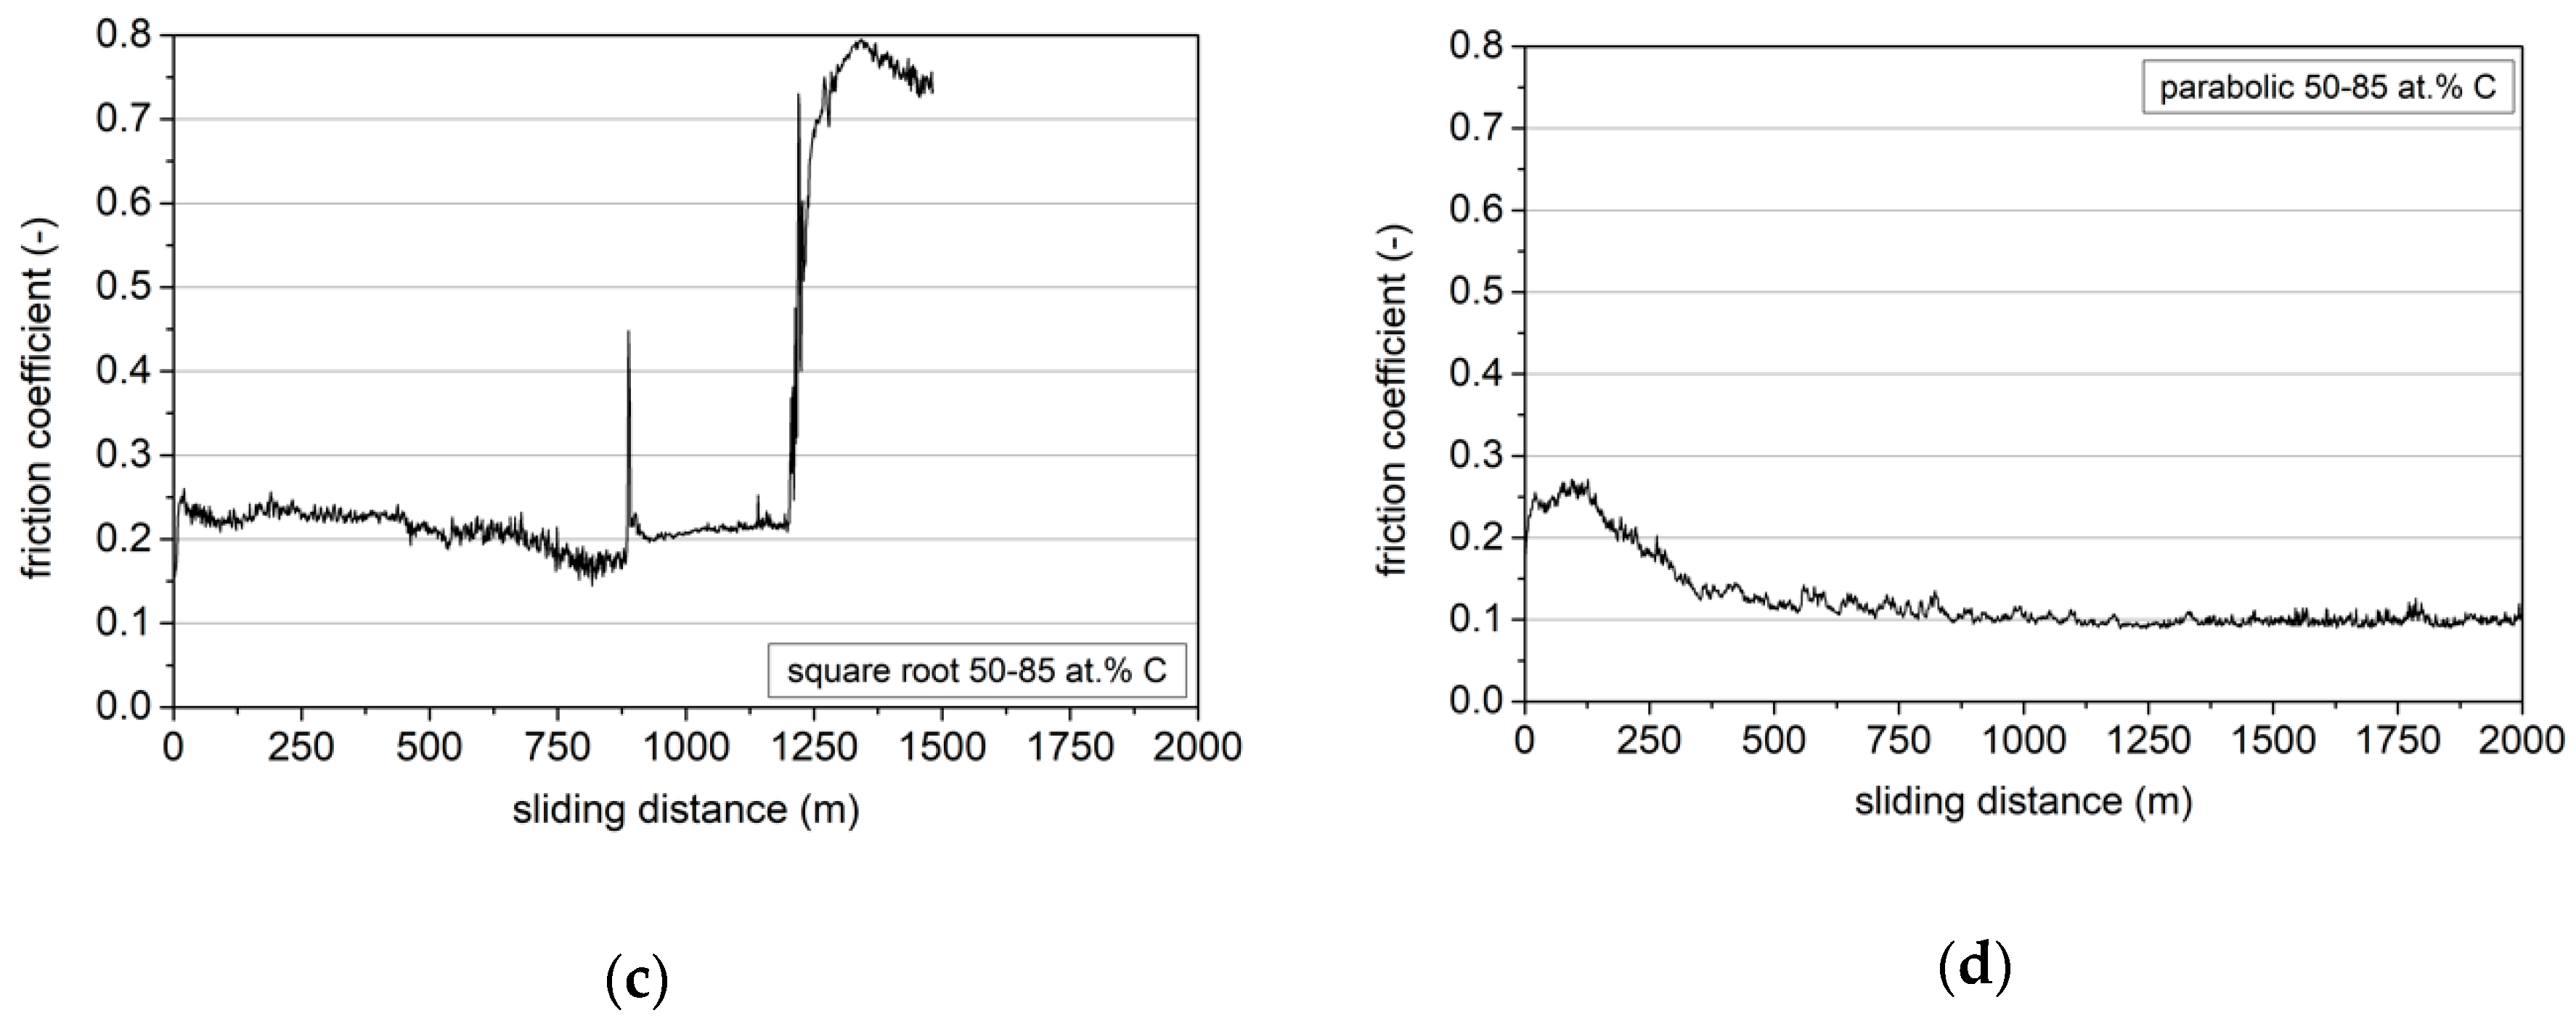
Figure 15 shows the change in the friction coefficient value as a function of sliding distance during the ball on disc test. The lowest coefficient of friction (COF = 0.1) was characteristic for the coating with a parabolic profile in the carbon concentration range of 50–85 at.% (Figure 15d). For the coating with an square root profile from this carbon concentration range of COF = 0.2, see Figure 15c. The friction coefficient for coatings with carbon contents in the range of 0–50 at.% was significantly higher. For the coating with an square root carbon change profile, this was 0.27 (Figure 15a), and for the coating with a parabolic profile, it increased over a distance of 60 m from 0.36 to 0.6 (Figure 15b). When analyzing the results obtained, it must be taken into account that the assumption is that the surface concentration of carbon is the same and it is 50 at.%. However, in the gradient coatings tested, the carbon content changed from the substrate to the top layer in two different carbon concentration ranges and according to two different profiles. These changes were determined by the different nano/microstructures of these coatings represented in surface morphology and, consequently, in the value of the friction coefficient.
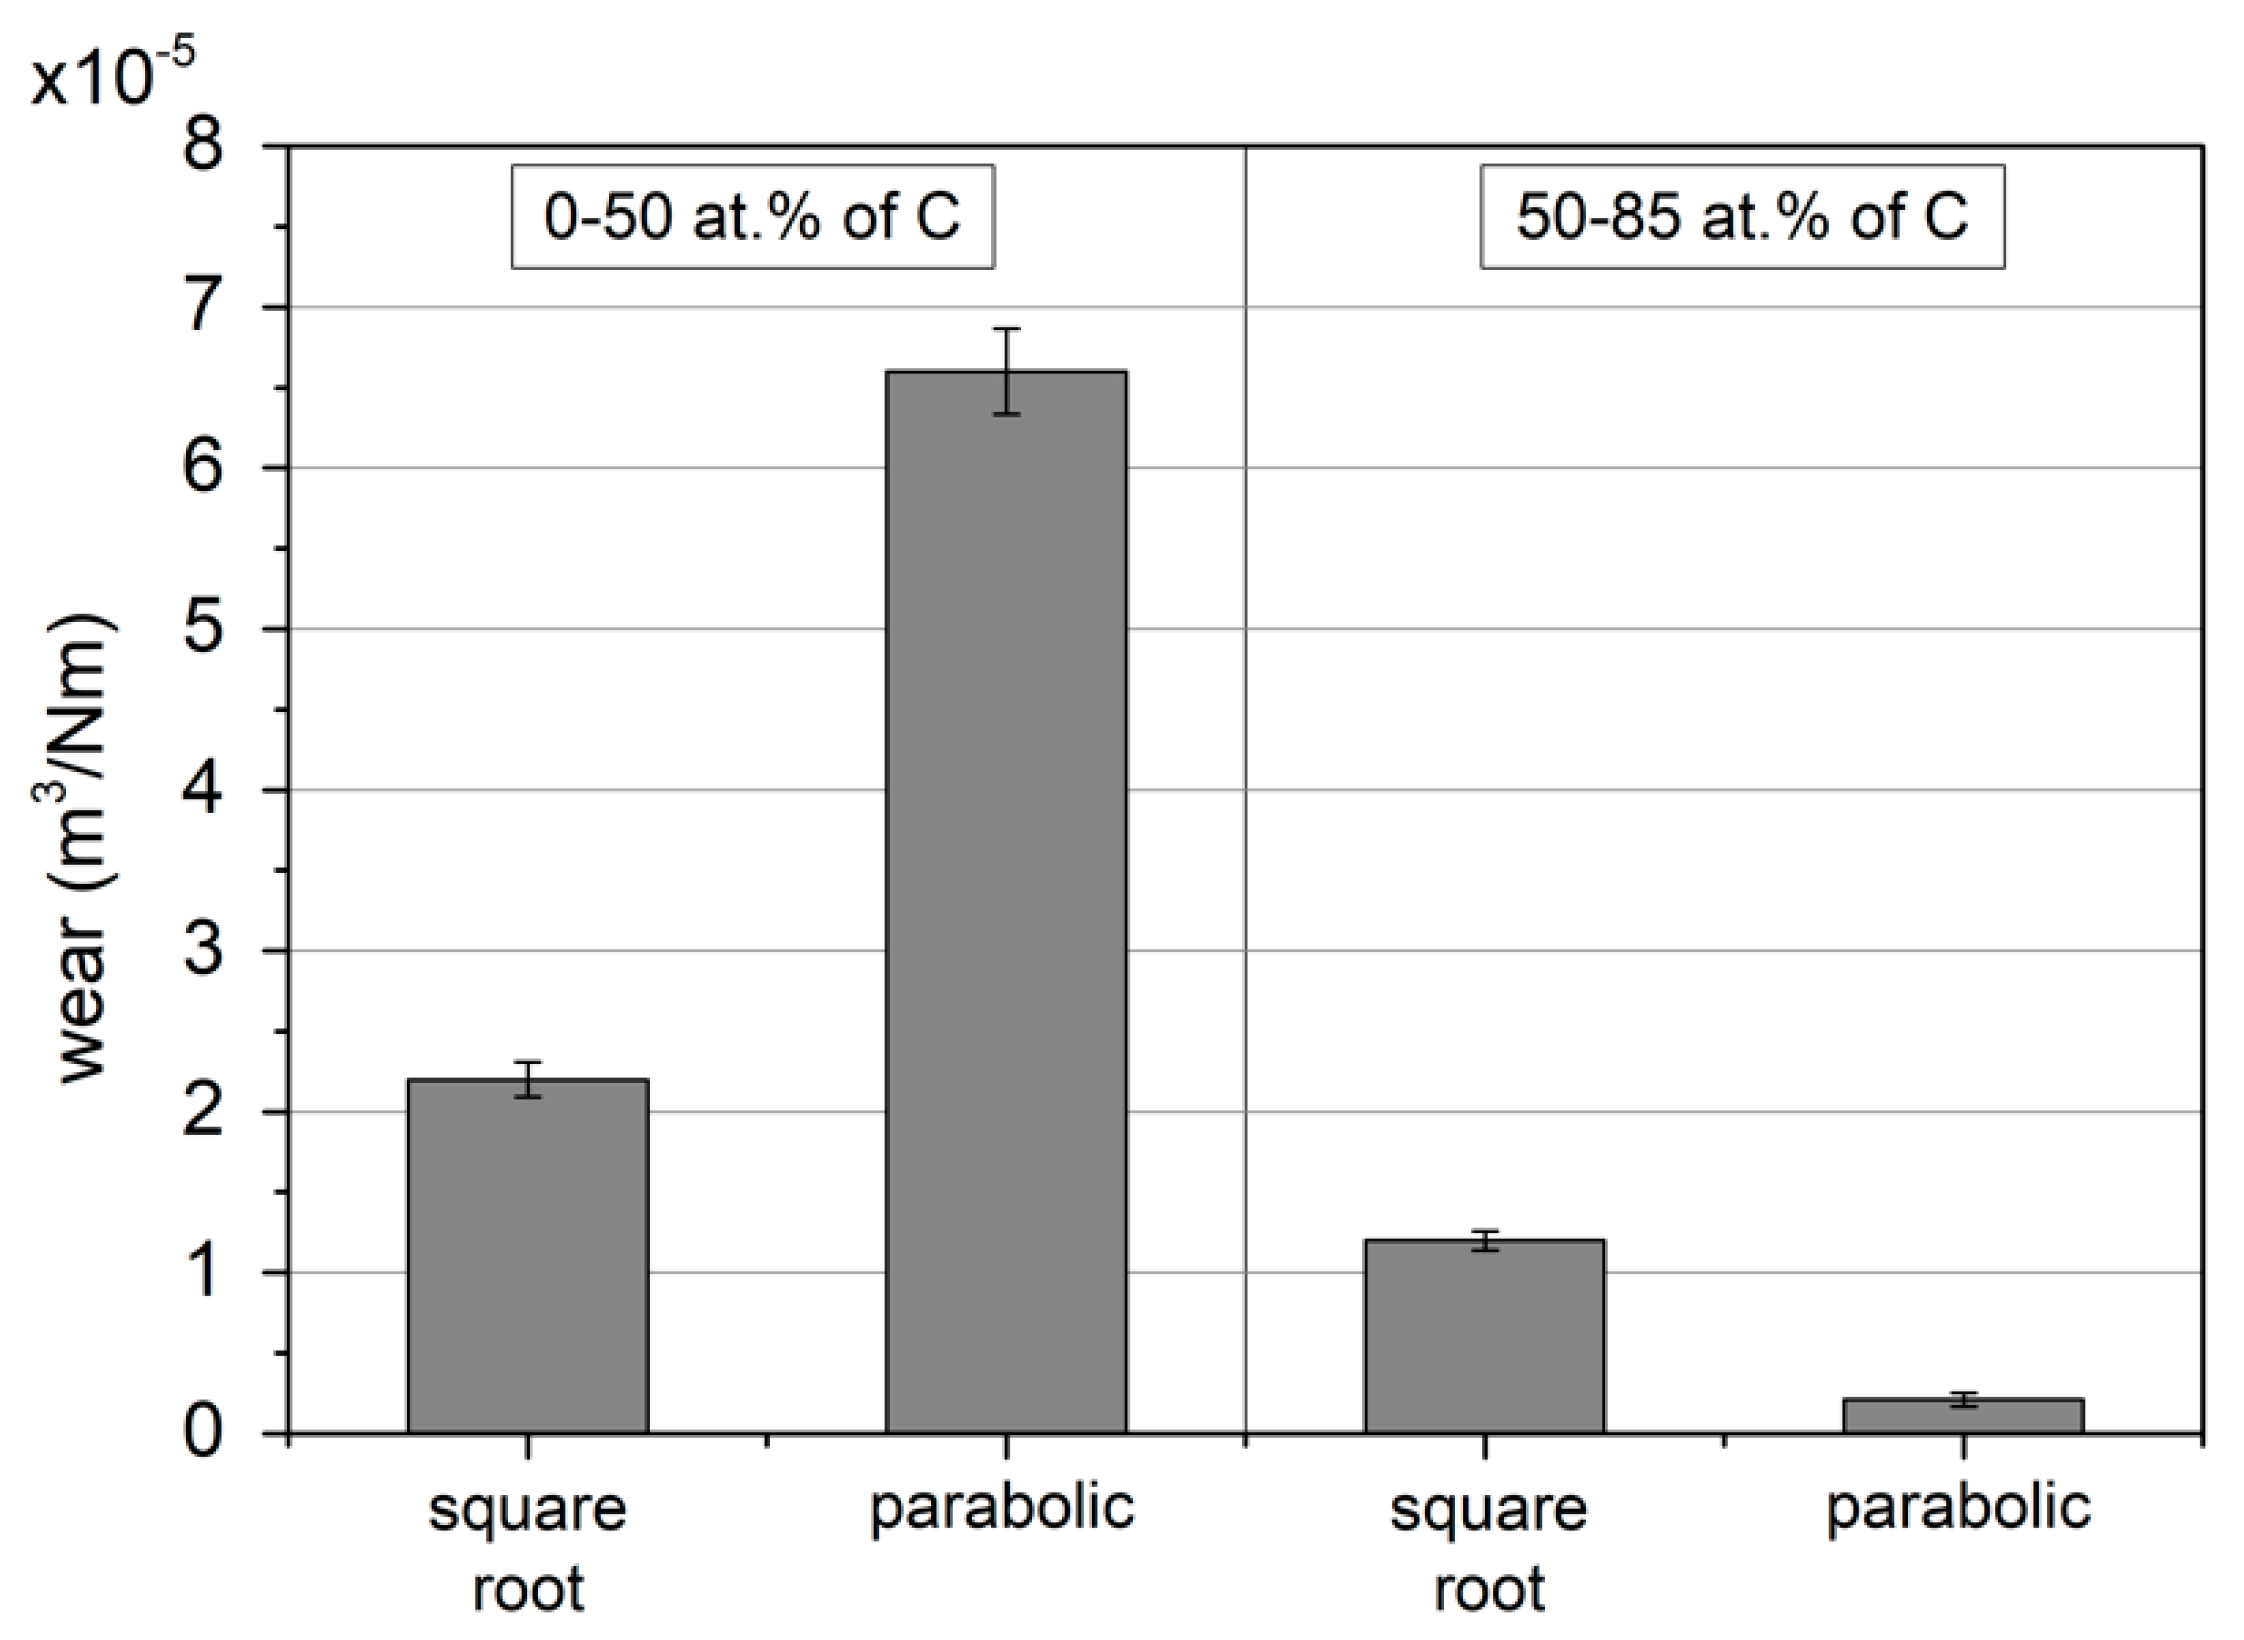
On the basis of the profiles of the wear track following the ball-disk test, volumetric indicators of wear of the coatings tested were calculated (Figure 16).
The analysis of the test results presented demonstrated that coatings with carbon contents in the range of 50–85 at.% were characterized by significantly lower wear, with the lowest wear coefficient value being obtained for the coatings with the parabolic profile. These results corresponded to the friction coefficient values obtained. There was also a correlation between the wear values, ratios of H/E and H3/E2 and critical force values. All the results showed that coatings with carbon contents in the range of 50–85 at.% possessed better properties characterized by critical force Lc2, wear, coefficient of friction and H/E and H3/E2 ratios.

4. Conclusions

The intent of the research presented in the article was, firstly, to verify the possibility to increase the performance of Zr–C coatings by creating the hardness gradient according to the square root and parabolic profile, from the interphase boundary of the substrate/coating to the top layer and, secondly, to verify what effect differences have in spatial nano/microstructural changes in coatings in the range of 0–50 and 50–85 at.% of C with the same hardness changes on the performance of Zr–C coatings, mainly on their tribological behavior. In other words, the objective of the study was to answer the question as to whether the differences in the nano/microstructure of Zr–C coatings, regardless of the production of an appropriate change in hardness as a basic condition, affect the performance of these coatings. When selecting the square root and parabolic profile, it was assumed that it is changes in carbon content profiles that determine boundary and effective changes in mechanical properties of the gradient coatings under analysis.
Based on the presented research, it appears that high hardness is a desirable property but is not sufficient to ensure proper performance of coatings. Depending on the application, an adequate nano/microstructure is necessary, which determines their tribological behavior.
Hardness is directly related to the nanostructure of coatings and, in particular, to the size of crystallites, their orientation and the distribution of crystallites through the amorphous phase. In turn, the tribological performance of the coating is the result of complex interactions of various parameters, among which, for Zr–C coatings, the amount of amorphous phase plays an important role.
The analysis of the presented results show that gradient coatings with carbon content in the range of 50–85 at.% have better properties, characterized by critical force Lc2, wear, friction coefficient and H/E and H3/E2 ratios. The results of the Rockwell C adhesion test provide information about the relatively good adhesion of gradient coatings to the substrate; however, the conclusions of the analysis of the indentation observations in this test for individual coatings contradict the results of other tests.
  • Production of coatings characterized by a gradient of hardness changes according to the square root and parabolic profile, from the substrate/coating phase boundary to the top layer, increases their resistance to cohesion damage characterized by critical force values Lc1.
  • The research shows that regardless of the hardness as the key parameter characterizing wear-resistant coatings, other properties (Young’s modulus E, coefficient of friction) and behavior (H/E, H3/E2) also have significant impacts on the performance of Zr–C coatings.
  • Among the studied gradient coatings, which differ in the range of changes in carbon content, i.e., 0–50 and 50–85 at.%, lower wear rates and higher values of changes in the H/E and H3/E2 ratios, representing the resistance to elastic and plastic deformation, respectively, characterize coatings with a higher carbon content. These results correspond to the critical forces Lc2, which are also higher for coatings in this carbon content range.
  • In the case of coatings with a carbon content in the range of 50–85 at.%, higher values of the critical forces Lc1 and Lc2 are characteristic of a coating with a square root hardness profile compared to coatings with a parabolic hardness change profile.
  • The results obtained from direct tests (critical force Lc2, friction coefficient, wear) and based on the application of the mixtures rule form the basis for the design of Zr–C gradient coatings with the desired performance.

Author Contributions

Conceptualization, J.R.; methodology, J.R., A.G., K.M. and Ł.S.; validation, J.R., A.G., Ł.S. and K.M.; formal analysis, J.R., A.G. and K.M.; investigation, A.G.; data curation, A.G., K.M. and J.R.; Resources, A.G.; writing—original draft preparation, J.R. and K.M.; writing—review and editing, K.M. and J.R.; visualization, K.M.; supervision, J.R., Ł.S. and A.G.; project administration, J.R.; funding acquisition, A.G. All authors have read and agreed to the published version of the manuscript.

Funding

This research was funded by the National Science Center, Poland (grant: Opus 11, No.2016/21/B/ST8/01738).

Acknowledgments

Authors would like to thank Yanwen Zhou from University of Science and Technology, Liaoning Anshan, China, for HRTEM experiments on produced coatings.

Conflicts of Interest

The authors declare no conflict of interest.

References

  1. Sun, W.; Xiong, X.; Huang, B.; Li, G.; Zhang, H.; Chen, Z.; Zheng, X. ZrC ablation protective coating for carbon/carbon composites. Carbon 2009, 47, 3368–3371. [Google Scholar] [CrossRef]
  2. Kim, J.; Suh, Y.J. Temperature-and pressure-dependent elastic properties, thermal expansion ratios, and minimum thermal conductivities of ZrC, ZrN, and Zr(C0.5N0.5). Ceram. Int. 2017, 43, 12968–12974. [Google Scholar] [CrossRef]
  3. Yang, J.; Wang, M.; Kang, Y.; Li, D. Influence of bilayer periods on structural and mechanical properties of ZrC/ZrB2 superlattice coatings. Appl. Surf. Sci. 2007, 253, 5302–5305. [Google Scholar] [CrossRef]
  4. Kumar, D.D.; Kaliaraj, G.S.; Kirubaharan, A.K.; Alagarsamy, K.; Vishwakarma, V.; Baskaran, R. Biocorrosion and biological properties of sputtered ceramic carbide coatings for biomedical applications. Surf. Coat. Technol. 2019, 374, 569–578. [Google Scholar] [CrossRef]
  5. Duerig, T.; Pelton, A.; Stockel, D. An overview of nitinol medical applications. Mater. Sci. Eng. A 1999, 149, 273–275. [Google Scholar] [CrossRef]
  6. Chu, C.L.; Ji, H.L.; Yin, L.H.; Pu, Y.P.; Lin, P.H.; Chu, P.K. Fabrication, properties, and cytocompatibility of ZrC film on electropolished NiTi shape memory alloy. Mater. Sci. Eng. C 2011, 31, 423–427. [Google Scholar] [CrossRef]
  7. Zheng, Y.F.; Liu, X.L.; Zhang, H.F. Properties of Zr–ZrC–ZrC/DLC gradient films on TiNi alloy by the PIIID technique combined with PECVD. Surf. Coat. Technol. 2008, 202, 3011–3016. [Google Scholar] [CrossRef]
  8. Ul-Hamid, A. Microstructure, Properties and Applications of Zr-Carbide, Zr-Nitride and Zr-Carbonitride Coatings—A Review. Mater. Adv. 2020, 1, 1012–1037. [Google Scholar] [CrossRef]
  9. Ming-Hui, D.; Hong-Sen, Z.; Chi, Z.; Xing, J. Characterization of ZrC coatings deposited on biomedical 316L stainless steel by magnetron sputtering method. Surf. Coat. Technol. 2013, 224, 34–41. [Google Scholar] [CrossRef]
  10. Long, Y.; Javed, A.; Chen, J.; Chen, Z.; Xiong, X. Phase composition, microstructure and mechanical properties of ZrC coatings produced by chemical vapor deposition. Ceram. Int. 2014, 40, 707–713. [Google Scholar] [CrossRef]
  11. Escudeiro, A.; Figueiredo, N.M.; Polcarb, T.; Cavaleiro, A. Structural and mechanical properties of nanocrystalline Zr co-sputtered a-C(:H) amorphous films. Appl. Surf. Sci. 2015, 325, 64–72. [Google Scholar] [CrossRef]
  12. Kumar, S.S.; Sharma, A.; Rao, G.M.; Suwas, S. Investigations on the effect of substrate temperature on the properties of reactively sputtered zirconium carbide thin films. J. Alloy. Compd. 2017, 695, 1020–1028. [Google Scholar] [CrossRef]
  13. Mydłowska, K.; Czerwińska, E.; Gilewicz, A.; Dobruchowska, E.; Jakubczyk, E.; Szparaga, Ł.; Ceynowa, P.; Ratajski, J. Evolution of Phase Composition and Antibacterial Activity of Zr–C Thin Films. Processes 2020, 8, 260. [Google Scholar] [CrossRef] [Green Version]
  14. Szparaga, Ł.; Bartosik, P.; Gilewicz, A.; Mydłowska, K.; Ratajski, J. Optimisation of mechanical properties of ZrC multilayer coatings. Thin Solid Films 2020, 704, 138016. [Google Scholar] [CrossRef]
  15. Gilewicz, A.; Mydłowska, K.; Ratajski, J.; Szparaga, Ł.; Bartosik, P.; Kochmański, P.; Jędrzejewski, R. Structural, mechanical and tribological properties of ZrC thin films deposited by magnetron sputtering. Vacuum 2019, 169, 108909. [Google Scholar] [CrossRef]
  16. Meng, Q.N.; Wen, M.; Mao, F.; Nedfors, N.; Jansson, U.; Zheng, W.T. Deposition and characterization of reactive magnetron sputtered zirconium carbide films. Surf. Coat. Technol. 2013, 232, 876–883. [Google Scholar] [CrossRef]
  17. Andersson, M.; Urbonaite, S.; Lewin, E.; Jansson, U. Magnetron sputtering of Zr–Si–C thin films. Thin Solid Films 2012, 520, 6375–6381. [Google Scholar] [CrossRef]
  18. Markworth, A.J.; Saunders, J.H. A model of structure optimization for a functionally graded material. Mater. Lett. 1995, 22, 103–107. [Google Scholar] [CrossRef]
  19. Markworth, A.J.; Ramesh, K.S.; Parks, W.P. Modelling studies applied to functionally graded materials. J. Mater. Sci. 1995, 30, 2183–2193. [Google Scholar] [CrossRef]
  20. Nemat-Alla, M. Reduction of thermal stresses by developing two-dimensional functionally graded materials. Int. J. Solids. Struct. 2003, 40, 7339–7356. [Google Scholar] [CrossRef]
  21. Wang, C.; Pureza, J.M.; Yang, Y.; Chung, Y.W. Investigation of hardness and fracture toughness properties of Fe/VC multilayer coatings with coherent interfaces. Surf. Coat. Technol. 2016, 288, 179–184. [Google Scholar] [CrossRef]
  22. Oliver, W.C.; Pharr, G.M. Measurement of hardness and elastic modulus by instrumented indentation: Advances in understanding and refinements to methodology. J. Mater. Res. 2004, 19, 3–20. [Google Scholar] [CrossRef]
  23. Cullity, B.D. Elements of X-ray Diffraction, 2nd ed.; Addison-Wesley Publishing Company Inc.: Reading, MA, USA, 1978; ISBN 0-201-01174-3. [Google Scholar]
  24. Dahan, I.; Admon, U.; Frage, N.; Sariel, J.; Dariel, M.P.; Moore, J.J. The development of a functionally graded TiC–Ti multilayer hard coating. Surf. Coat. Technol. 2001, 137, 111–115. [Google Scholar] [CrossRef]
  25. Ronkainen, H.; Varjus, S.; Holmberg, K.; Fancey, K.S.; Pace, A.R.; Matthews, A.; Matthes, B.; Broszeit, E. Coating evaluation methods: A round robin study. Tribol. Ser. 1990, 17, 453–463. [Google Scholar] [CrossRef]
  26. Rutherford, K.L.; Hutchings, I.M. A micro-abrasive wear test, with particular application to coated systems. Surf. Coat. Technol. 1996, 79, 231–239. [Google Scholar] [CrossRef]
  27. PN-EN ISO 26423:2016-05. Ceramika Wysokiej Jakości (Ceramika Zaawansowana, Techniczna Ceramika Zaawansowana)—Wyznaczanie Grubości Powłoki Metodą Wyszlifowywania Krateru; Polish Committee for Standardization: Warsaw, Poland, 2016. [Google Scholar]
  28. Bull, S.J.; Rickerby, D.S. The inter-relationship between coating microstructure and the tribological performance of PVD coatings. Tribol. Ser. 1990, 17, 337–349. [Google Scholar] [CrossRef]
  29. Patscheider, J.; Zehnder, T.; Diserens, M. Structure–performance relations in nanocomposite coatings. Surf. Coat. Technol. 2001, 146, 201–208. [Google Scholar] [CrossRef]
  30. Bull, S.J.; Rickerby, D.S. Compositional, microstructural and morphological effects on the mechanical and tribological properties of chromium nitrogen films. Surf. Coat. Technol. 1990, 43, 732–744. [Google Scholar] [CrossRef]
  31. Rickerby, D.S.; Bull, S.J. Engineering with surface coatings: The role of coating microstructure. Surf. Coat. Technol. 1989, 39–40, 315–328. [Google Scholar] [CrossRef]
  32. Ou, Y.X.; Lin, J.; Che, H.L.; Moore, J.J.; Sproul, W.D.; Lei, M.K. Mechanical and tribological properties of CrN/TiN superlattice coatings deposited by a combination of arc-free deep oscillation magnetron sputtering with pulsed dc magnetron sputtering. Thin Solid Films 2015, 594, 147–155. [Google Scholar] [CrossRef]
  33. Sui, X.; Liu, J.; Zhang, S.; Yang, J.; Hao, J. Microstructure, mechanical and tribological characterization of CrN/DLC/Cr-DLC multilayer coating with improved adhesive wear resistance. Appl. Surf. Sci. 2018, 439, 24–32. [Google Scholar] [CrossRef]
  34. Vidakis, N.; Antoniadis, A.; Bilalis, N. The VDI 3198 indentation test evaluation of a reliable qualitative control for layered compounds. J. Mater. Process. Technol. 2003, 143, 481–485. [Google Scholar] [CrossRef]
  35. Broitman, E.; Hultman, L. Adhesion improvement of carbon-based coatings through a high ionization deposition technique. J. Phys. Conf. Ser. 2012, 370, 012009. [Google Scholar] [CrossRef] [Green Version]
  36. Zhang, X.; Tian, X.B.; Zhao, Z.W.; Gao, J.B.; Zhou, Y.W.; Gao, P.; Guo, Y.Y.; Lv, Z. Evaluation of the adhesion and failure mechanism of the hard CrN coatings on different substrates. Surf. Coat. Technol. 2019, 364, 135–143. [Google Scholar] [CrossRef]
  37. Chen, X.; Du, Y.; Chung, Y.W. Commentary on using H/E and H3/E2 as proxies for fracture toughness of hard coatings. Thin Solid Films 2019, 688, 137265. [Google Scholar] [CrossRef]
  38. Blažek, J.; Musil, J.; Stupka, P.; Čerstvý, R.; Houška, J. Properties of nanocrystalline Al–Cu–O films reactively sputtered by DC pulse dual magnetron. Appl. Surf. Sci. 2011, 258, 1762–1767. [Google Scholar] [CrossRef]
  39. Musil, J.; Jílek, R.; Meissner, M.; Tölg, T.; Čerstvý, R. Two-phase single layer Al-O-N nanocomposite films with enhanced resistance to cracking. Surf. Coat. Technol. 2012, 206, 4230–4234. [Google Scholar] [CrossRef]
  40. Musil, J.; Sklenka, J.; Čerstvý, R.; Suzuki, T.; Mori, T.; Takahashi, M. The effect of addition of Al in ZrO2 thin film on its resistance to cracking. Surf. Coat. Technol. 2012, 207, 355–360. [Google Scholar] [CrossRef]
  41. Musil, J. Hard nanocomposite coatings: Thermal stability, oxidation resistance and toughness. Surf. Coat. Technol. 2012, 207, 50–65. [Google Scholar] [CrossRef]
  42. Leylan, A.; Matthews, A. On the significance of the H/E ratio in wear control: A nanocomposite coating approach to optimised tribological behavior. Wear 2000, 246, 1–11. [Google Scholar] [CrossRef]
  43. Masanta, M.; Shariff, S.M.; Choudhury, A.R. Evaluation of modulus of elasticity, nano-hardness and fracture toughness of TiB2–TiC–Al2O3 composite coating developed by SHS and laser cladding. Mater. Sci. Eng. A Struct. 2011, 528, 5327–5335. [Google Scholar] [CrossRef]
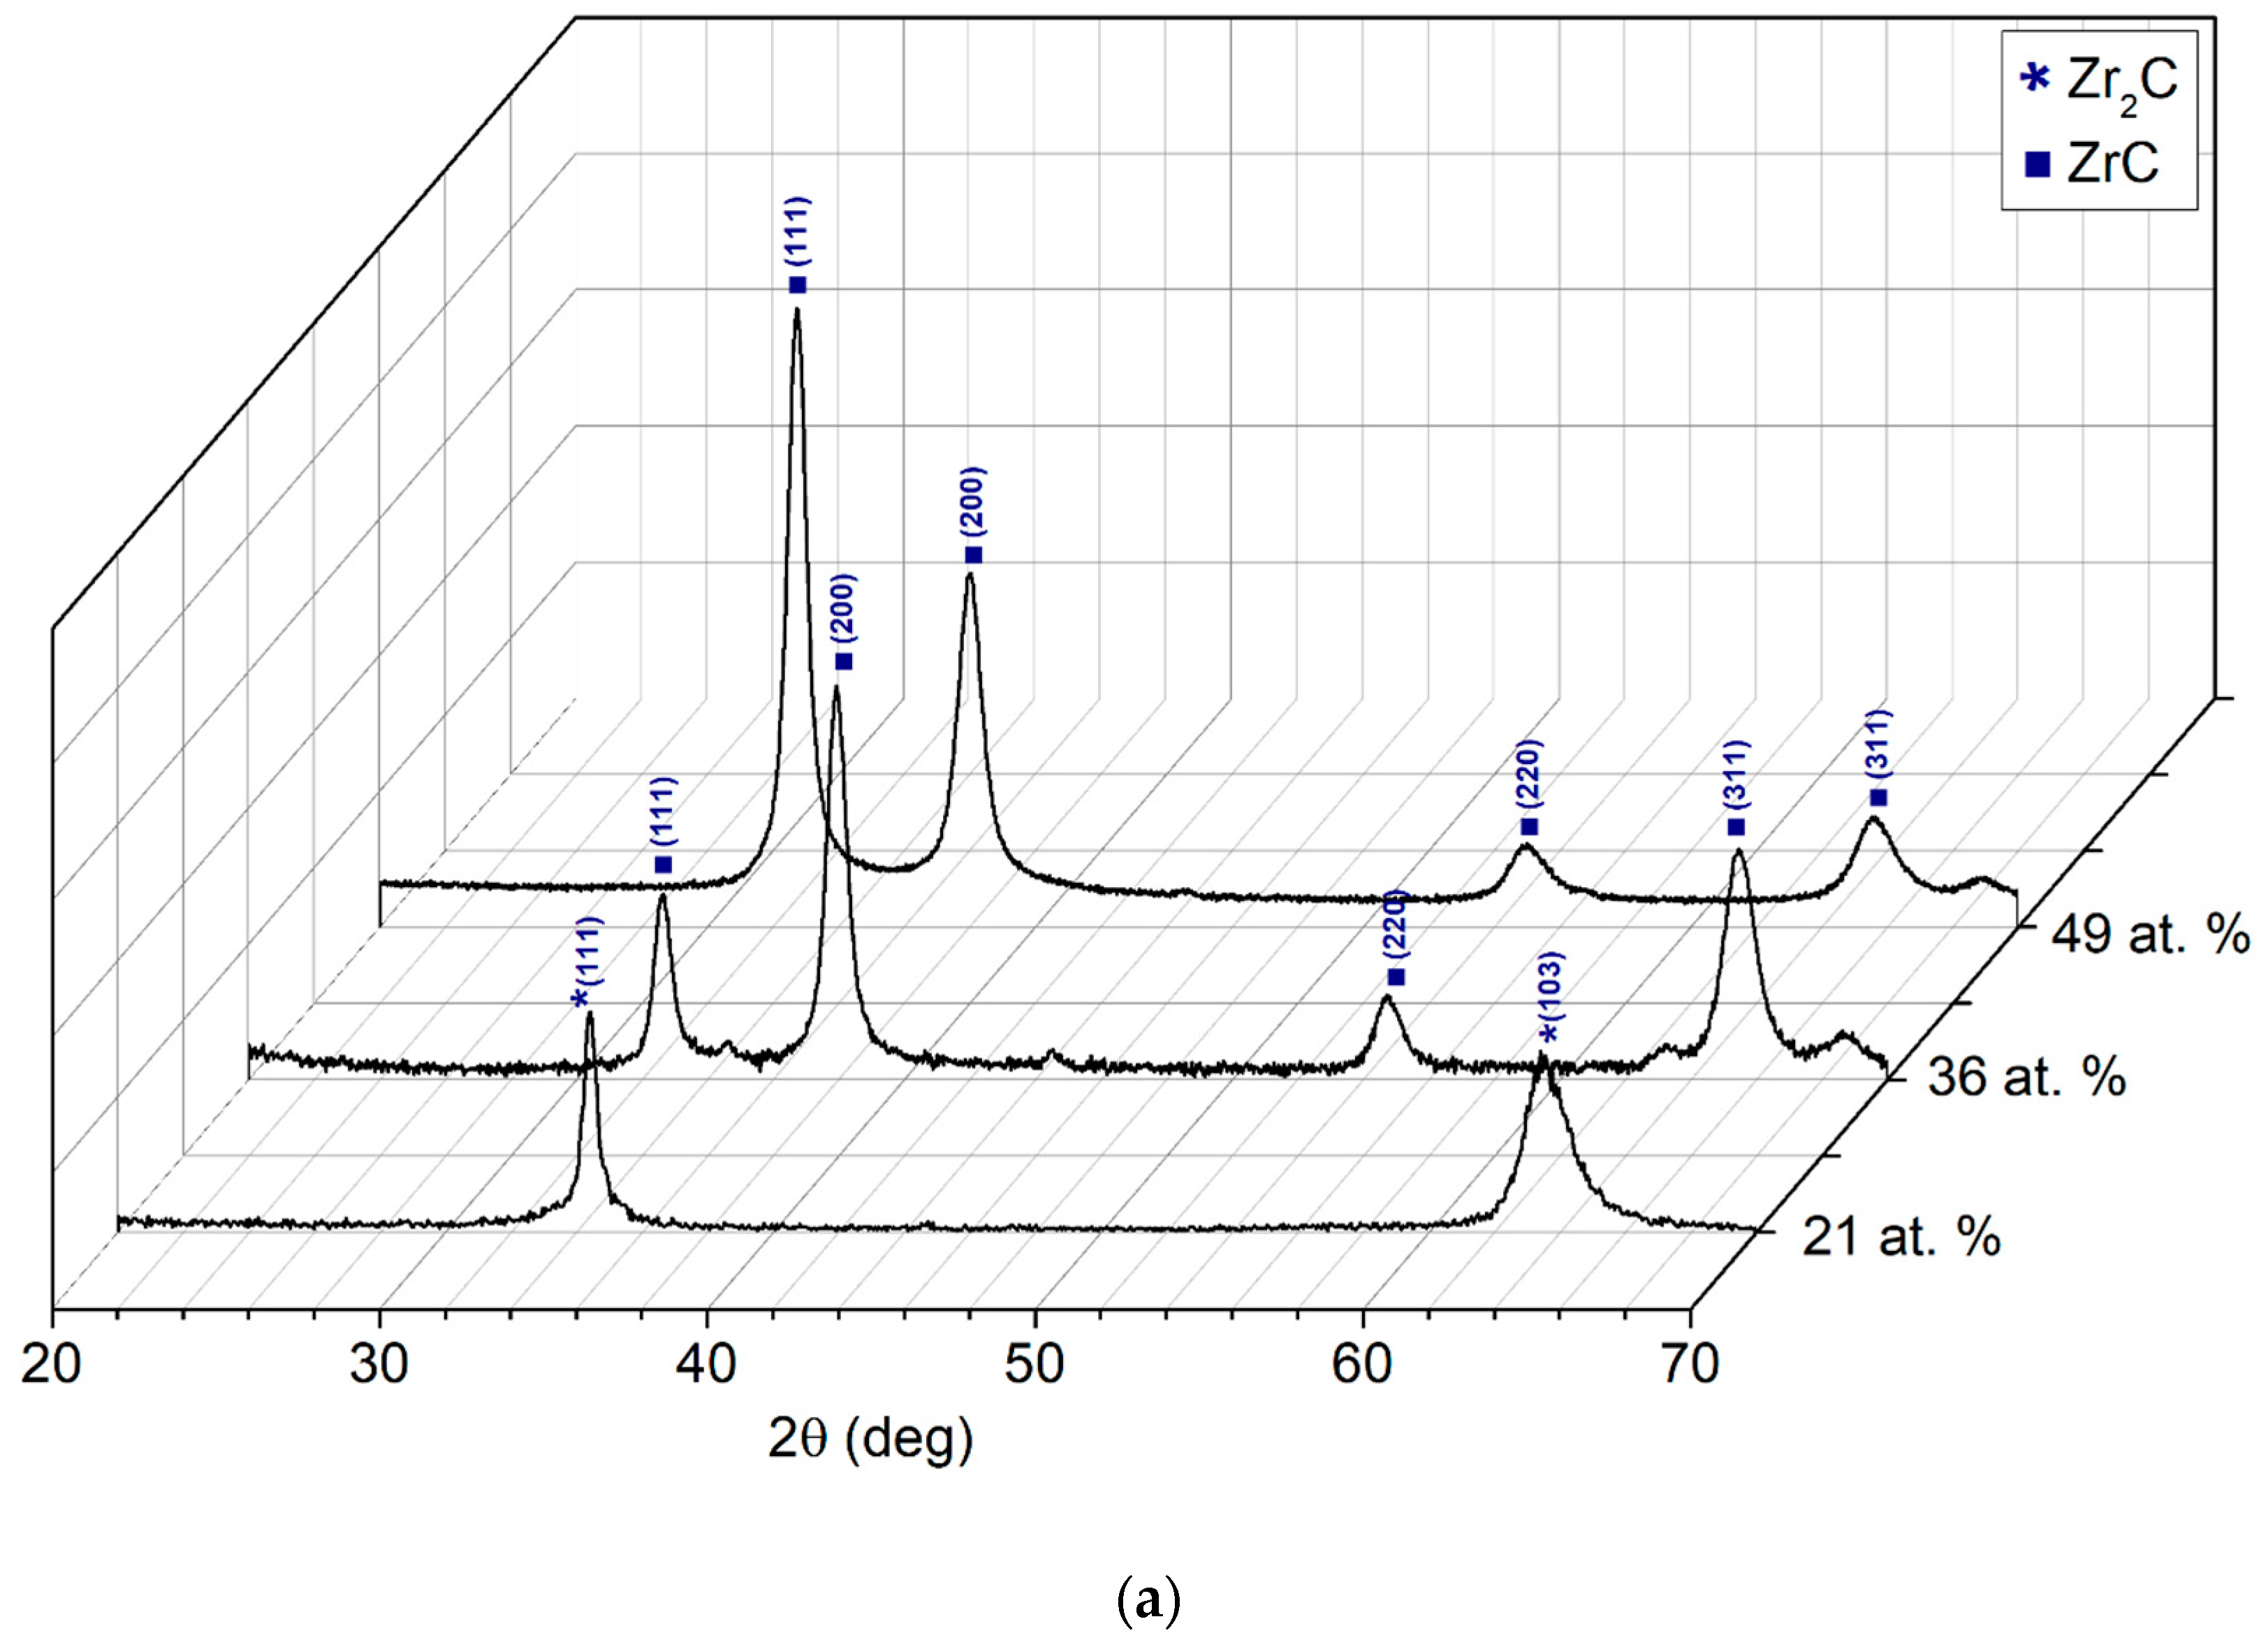
Figure 1. The structure and morphology of Zr–C coatings with carbon content in the range of 0–50 at.%: (a) X-ray diffractograms of the coatings, (b) SEM cross section image [15].
Coatings 10 01121 g001aCoatings 10 01121 g001b
Figure 2. The structure and morphology of Zr–C coatings with carbon content in the range of 50–85 at.%: (a) selected X-ray diffractograms of the coatings, (b) SEM cross section image of coating with approx. 63 at.% of C, (c) HRTEM image of coating with approx. 63 at.% of C.
Coatings 10 01121 g002aCoatings 10 01121 g002b
Figure 3. Hardness change profiles for coatings in carbon concentration ranges of 0–50 at.% (a) and 50–85 at.% (b), determined with the use of Formulas (1) and (2) on the basis of experimental data contained in [15].
Coatings 10 01121 g003
Figure 4. (a) Change in carbon content in coating according to parabolic profile in the range of 0–50 at.% determined according to Formula (3), and (b) change in coating hardness determined from accepted carbon content profile and changes in hardness calculated according to mixtures rule (Formula (1)).
Coatings 10 01121 g004
Figure 5. (a) Parabolic change in carbon content in the concentration range of 50–85 at.% determined using Formula (3) and (b) change in coating hardness determined from accepted carbon content profile and changes in hardness calculated according to mixtures rule (Formula (2)).
Coatings 10 01121 g005
Figure 6. Comparison of profiles of hardness changes in coatings determined on the basis of parabolic carbon content profiles determined in the range of 0–50 at.% and 50–85 at.%.
Coatings 10 01121 g006
Figure 7. (a) Square root change in carbon content in the concentration range of 0–50 at.% determined using Formula (3) and (b) hardness change in coating determined based on carbon content profile accepted and changes in hardness calculated according to mixtures rule (Formula (1)).
Coatings 10 01121 g007
Figure 8. (a) Square root change in carbon content in the concentration range of 50–85 at.% determined using Formula (3) and (b) hardness change in coating determined based on carbon content profile accepted and changes in hardness calculated according to mixtures rule (Formula (2)).
Coatings 10 01121 g008
Figure 9. Comparison of profiles of hardness changes in coatings determined on the basis of square root carbon content profiles determined in the range of 0–50 at.% and 50–85 at.%.
Coatings 10 01121 g009
Figure 10. Surface hardness of coatings with three different maximum loads causing indentations of 0.15, 0.30 and 0.5 μm: (a) square root carbon content variation profile in the range of 0–50 at.%, (b) square root carbon content profile in the range of 50 to 85 at.%, (c) parabolic carbon content profile in the range of 0–50 at.%, (d) parabolic carbon content profile in the range of 50 to 85 at.%.
Coatings 10 01121 g010aCoatings 10 01121 g010b
Figure 11. Scratch test results: (a) values of critical loads determined, dependence of the friction force on the normal force loading the indenter for (b) gradient coatings, and (c) single-layer coatings.
Coatings 10 01121 g011aCoatings 10 01121 g011b
Figure 12. Results of Rockwell C test: (a) square root carbon content variation profile in the range of 0–50 at.%, (b) square root carbon content profile in the range of 50 to 85 at.%, (c) parabolic carbon content profile in the range of 0–50 at.%, (d) parabolic carbon content profile in the range of 50 to 85 at.%.
Coatings 10 01121 g012
Figure 13. Profiles of changes in Young’s modulus values in Zr–C coatings, determined based on the carbon content profile and mixtures rule (Formula (2)). (a) Parabolic carbon content profile in the range of 0–50 at.%, (b) parabolic carbon content profile in the range of 50 to 85 at.%, (c) square root carbon content profile in the range of 0–50 at.%, (d) square root carbon content profile in the range of 50 to 85 at.%.
Coatings 10 01121 g013
Figure 14. Profiles of changes in the values of H/E indices: (a) parabolic profiles, (c) square root profiles and H3/E2; (b) parabolic profiles, (d) square root profiles for Zr–C coatings in carbon content ranges of 0–50 and 50–85 at.%.
Coatings 10 01121 g014aCoatings 10 01121 g014b
Figure 15. Dependence of the friction coefficient on the sliding distance during ball-on-disk test of gradient Zr–C coatings with (a) square root carbon content profile in the range of 0–50 at.%, (b) parabolic carbon content profile in the range of 0–50 at.%, (c) square root carbon content profile in the range of 50 to 85 at.%, (d) parabolic carbon content profile in the range of 50 to 85 at.%.
Coatings 10 01121 g015aCoatings 10 01121 g015b
Figure 16. Volumetric wear indicator after the ball-on-disc test of gradient Zr–C coatings with various carbon content profiles.
Coatings 10 01121 g016
Table 1. Chemical composition of the Zr–C coatings.
C2H2 Volumetric Flow Rate, sccmC, at.%Zr, at.%O, H and Others, at.%
0~0.091.88.2
1.520.771.67.7
2.035.958.45.7
2.550.844.94.3
3.552.943.73.4
4.563.333.03.7
6.579.018.92.1
Table 2. Coating thicknesses determined using the Calotest method.
Gradient TypeCoating Thickness, μm
square root, 0–50 at.% of C3.6
square root, 50–85 at.% of C3.2
parabolic, 0–50 at.% of C3.8
parabolic, 50–85 at.% of C3.3
Publisher’s Note: MDPI stays neutral with regard to jurisdictional claims in published maps and institutional affiliations.