Article

Influence of the Active Screen Plasma Power during Afterglow Nitrocarburizing on the Surface Modification of AISI 316L

1
Institute of Materials Engineering, Technische Universität Bergakademie Freiberg, Gustav-Zeuner-Straße 5, 09599 Freiberg, Germany
2
Leibniz Institute for Plasma Science and Technology (INP), Felix-Hausdorff-Straße 2, 17489 Greifswald, Germany
*
Author to whom correspondence should be addressed.
Coatings 2020, 10(11), 1112; https://doi.org/10.3390/coatings10111112
Submission received: 26 October 2020 / Revised: 11 November 2020 / Accepted: 17 November 2020 / Published: 19 November 2020
(This article belongs to the Special Issue Plasma Surface Engineering)

Abstract

:
Active screen plasma nitrocarburizing (ASPNC) increases the surface hardness and lifetime of austenitic stainless steel without deteriorating its corrosion resistance. Using an active screen made of carbon opens up new technological possibilities that have not been exploited to date. In this study, the effect of screen power variation without bias application on resulting concentrations of process gas species and surface modification of AISI 316L steel was studied. The concentrations of gas species (e.g., HCN, NH3, CH4, C2H2) were measured as functions of the active screen power and the feed gas composition at constant temperature using in situ infrared laser absorption spectroscopy. At constant precursor gas composition, the decrease in active screen power led to a decrease in both the concentrations of the detected molecules and the diffusion depths of nitrogen and carbon. Depending on the gas mixture, a threshold of the active screen power was found above which no changes in the expanded austenite layer thickness were measured. The use of a heating independent of the screen power offers an additional parameter for optimizing the ASPNC process in addition to changes in the feed gas composition and the bias power. In this way, an advanced process control can be established.

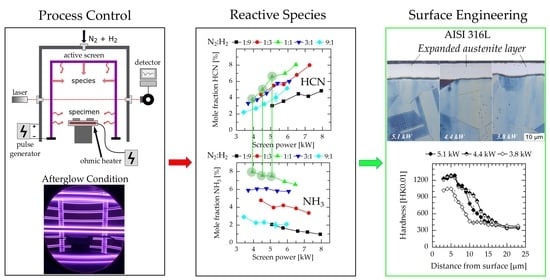
Graphical Abstract

1. Introduction

Surface engineering of austenitic stainless steels has become popular to improve the tribological behavior, in particular in corrosive environments [1,2]. Among the different technologies, thermochemical surface treatments, which enrich the surface layer with nitrogen and/or carbon leading to enhanced wear properties without deteriorating their excellent corrosion behavior, are of growing significance [3]. Due to the characteristic passive layer, which prevents the diffusion of elements like nitrogen and carbon, the activation of the self-passivating surface is of particular importance [4]. For austenitic stainless steels, plasma-assisted technologies like plasma nitriding (PN), plasma carburizing (PC), or plasma nitrocarburizing (PNC) have proven to be useful for both in situ sputtering of the passive layer and providing nitrogen and/or carbon for diffusion [5,6].
In order to avoid the formation of chromium nitride and carbide phases, which are detrimental to the corrosion resistance of the material, thermochemical treatments are typically performed as low temperature processes [2,7]. Thereby, a layer of metastable supersaturated solid solution, the expanded austenite or S-phase, with nitrogen concentrations up to approximately 30 at.% and carbon concentrations up to 8–10 at.%, is formed [7]. It is agreed today that both nitrogen and carbon occupy the lattice gaps at chromium atoms in a favorable energetic state [8]. In the case of PNC, a dual layer is formed consisting of a nitrogen expanded austenite (γN) layer at the surface and an inner carbon expanded austenite (γC) layer at a diffusion depth of some micrometers. This layer structure combines the high surface hardness resulting from the incorporation of nitrogen and the smooth hardness gradient of the layer/substrate interface due to the carbon diffusion [7].
To facilitate an active screen plasma nitrocarburizing (ASPNC) process, a pulsed dc glow discharge can be set-up between the grounded reactor wall and a cathodically charged metallic mesh, the active screen (AS), surrounding the components to be treated [9,10]. The ASPNC technology is also known as nitrocarburizing in the afterglow, as the workload is placed downstream to the primary discharge and is itself on a floating potential or on a weak cathodic bias [11,12]. This way, the flowing afterglow transports energetic molecules and ions from the active plasma zone to the diffusion interface. The afterglow gas consists mainly of neutral species [13]. In previous studies, the efficiency of the ASPNC treatment was much increased by substitution of the conventional steel AS by an AS made of carbon fiber-reinforced carbon (CFC) [14,15]. As the carbon is sputtered by the active discharge, it also serves as a chemical source for the process thus eliminating the requirement of carbon-containing gaseous admixtures.
By use of high-resolution infrared laser absorption spectroscopy (IRLAS), such as quantum cascade laser absorption spectroscopy (QCLAS), quantitative analysis of the gas composition can be conducted [16,17,18]. Previous studies by IRLAS have shown that the use of an AS made of CFC in an ASPNC reactor together with N2 and H2 as precursor gases results in a highly reactive process gas containing different saturated (CH4, C2H6,) and unsaturated hydrocarbons (C2H2, C2H4), radicals (CH3), ammonia (NH3), cyanides (HCN, C2N2), and carbon monoxide (CO) [19]. By the variation of the process parameters (e.g., flow rate, N2-to-H2 ratio in the precursor gas, and pressure), the concentrations of reactive species can be changed [20]. It is assumed that the formation of volatile hydrocarbons by chemical sputtering of the carbon cathode [21,22] is a key aspect in the production of increased concentrations of HCN and C2H2 in the afterglow, which are up to two orders of magnitude higher compared to the use of a steel screen with gaseous carbon admixture [23]. This is of particular interest, as unsaturated hydrocarbons like HCN and C2H2 are known to activate the surface of stainless steels [24,25,26]. Additionally, they provide carbon and nitrogen to build up nitride layers on ferrous materials. However, as established for steel AS, the cathodic biasing of the workload is still required to achieve a reasonable nitriding result [27,28].
Using IRLAS measurements in a model reactor for ASPNC processes, Puth et al. [19] showed that the production rate of reactive species can be controlled not only by the composition of the precursor gas but, in particular, also by the screen power. By monitoring the absolute concentrations of reactive species, they showed the dependence of the concentrations of reactive species on the screen power applied to a perforated CFC plate. It was reported that the concentrations of hydrocarbons (e.g., C2H2 and HCN) are monotonously increasing with the screen power, whereas the concentration of NH3 remains approximately constant. This resulted in HCN overtaking NH3 as the predominant species at high values of plasma power. The process gas generated by the pulsed dc discharge with a carbon cathode led to a reasonable nitrocarburizing result for austenitic stainless steels even without applying an additional bias plasma at the components [15].
In an industrial-scale reactor, the effect of the precursor gas composition at a constant bias power [29] and variations of the bias at a fixed gas composition [30] on AISI 316L steel have been investigated. It was found that the thickness ratios of γN to γC can be modified by the variation of the ratio of the N2–H2 feed gas composition. Conversely, the level of bias power does not strongly affect the layer properties when a carbon AS was used. Nevertheless, the influence of varying concentrations of reactive gas species on the steel case is insufficiently known yet.
In this work, the effect of a varying carbon AS power at different nitrogen-to-hydrogen ratios (N2:H2) on the unbiased ASPNC-treated austenitic stainless steel AISI 316L was investigated. The results of the nitrocarburizing treatments performed in the present work, such as the maximum concentrations and diffusion depths of nitrogen and carbon in the expanded austenite, the phase composition determined by XRD and Knoop hardness-depth profiles of the generated surface layers are correlated with the process plasma parameters and the resulting gas species composition measured by IRLAS.

2. Materials and Methods

A commercially available austenitic stainless steel AISI 316L (chemical composition in wt.%: C0.05, Cr16.98, Ni11.39, Mo1.92, Mn1.54, Si0.33, and Fe balance [29]) was used for the investigations. Specimens of 20 mm in diameter and 4.5 mm in thickness machined from a cylindrical bar were wet ground up to a 800 SiC paper grid. After machining, all samples were cleaned with ethanol.
The ASPNC experiments were performed in an industrial-scale ASPNC system (Figure 1) with a reactor volume of approximately 1 m3 [17]. An AS made of CFC 800 mm in diameter, 750 mm in height, and with a total surface area of 4.4 m2 was placed in the reactor surrounding the workload. The pulsed dc plasma at the AS was operated at 500 Hz and a 60% duty cycle using a power supply providing up to 15 kW.
The ASPNC was performed in a cold wall reactor in which the temperature at the thermocouples was the controlling element for the screen power. Glow discharge at the CFC AS generated the required energy by thermal radiation to obtain the desired treatment temperature at the substrate. However, under the same treatment conditions inside the reactor, the same treatment atmosphere or concentration of reactive species were created, respectively [31]. Changes were only present by varying the process parameters such as gas composition, flow rate, bias power or treatment temperature. In order to decouple heating and chemical reactions at the AS, an additional adjustable independent heating source was installed at the worktable (Figure 1). This heating device was based on the ohmic heating of coiled tungsten and was supplied with a set power. All samples, including the thermocouples, for which the process temperature was controlled, were heated by the additional heating device.
The treatment process started by evacuating the chamber down to 80 Pa. Next, the desired nitrogen–hydrogen feed gas mixture (varying between 1:9 and 9:1) was introduced at a total flow rate of 60 slh. Different power levels of the ohmic heater between 0 and 400 W were applied (Table 1).
The heating phase was conducted at a pressure of 160 Pa with an AS power of approximately 6 to 8 kW, depending on the power level of the ohmic heater, until the sample temperature reached 713 K. Subsequently, the pressure was set to 300 Pa and the flow rate of the feed gas mixture was set to 80 slh. Finally, the process temperature reached 733 K and the specimens were treated for 5 h at floating potential, i.e., without application of an additional bias voltage at the specimens. After the treatment, the ohmic heater and the plasma were turned off and the reactor cooled down to room temperature using pure hydrogen at 160 Pa and 20 slh. The electrical parameters of the resulting AS glow discharge (PScreen, UScreen, IScreen) recorded during all treatments are summarized in Table 1. The power control system was designed to industrial standards, to adapt and stabilize the electrical parameters to changing values of gas flow, pressure, and composition. Due to the intricate power regulation, the system does not permit the setting of voltage or current values to a specific value.
After the process, the weight loss Δm of the carbon screen was measured in order to determine the carbon consumption of the screen during the process. For the carbon consumption (ECC), according to Equation (1), the weight loss of the screen Δm, average screen power (Pscreen), and process time (tprocess), being the time of plasma discharge at the carbon screen (tprocess = tnitriding = 5 h), were considered. Additionally, the carbon consumption was determined spectroscopically by IRLAS (method described in Reference [20]).
E C C = Δ m P S c r e e n · t p r o c e s s
Cross-sections of all treated samples were metallographically prepared and etched with Beraha II etchant. In order to determine the thickness and homogeneity of the generated expanded austenite layer, an optical microscope Carl Zeiss Neophot 30 equipped with a JVC TK C1381 CCD (charge-coupled device) camera and the Image C/A4i-Analysis software was used. In addition, the appearance of CrN precipitates was evaluated.
Microhardness–depth profile measurements were performed with a LECO M-400G3 equipped with a Knoop micro indenter applying a load of 10 g.
Structural analysis was conducted by X-ray diffraction (XRD) with Co-Kα radiation using a SEIFERT-FPM URD6 (SEIFERT-FPM) diffractometer. A conventional θ–2θ Bragg–Brentano symmetric configuration with a scanning angle from 20 to 150° and a scanning rate of 0.01°/min was used. The high penetration depth of the Co-Kα radiation allowed the phase analysis of the entire expanded austenite layer. Furthermore, the concentration–depth profiles of nitrogen and carbon within the expanded austenite layer were analyzed using glow discharge optical emission spectroscopy (GDOES) on a LECO SDP 750 spectrometer.
In previous studies conducted at a similar setup, CH4, C2H2, HCN, and NH3 were found to be the predominant species in an ASPNC plasma [19,29]. Accordingly, the column-averaged absolute concentrations of the four species were monitored using two spectral windows of an infrared external-cavity quantum cascade laser (EC-QCL) at approximately 1356.3 and 1387.8 cm−1. The high output power of the laser sources enabled the simultaneous recording of the measurement, reference, and etalon signals using beam splitters. Further information on the interrogated spectral line positions, line intensity, and estimated limit of detection is provided in Table 2, based on the HITRAN (High Resolution Transmission) database [32]. In turn, the absolute concentrations of CH4, C2H2, HCN, and NH3 were measured as function of plasma power at the AS for different feed gas mixing ratio of N2:H2.

3. Results

3.1. Influence of an Ohmic Heater

Based on the power dependency of the species concentrations, the electrical parameters during the experiments must be considered. Averages of all electrical parameters of the experiments are given in Table 1. Under the experimental conditions given, the screen power decreased linearly by 650 ± 60 W at 100 W additional heating power of the ohmic heater. Without using the ohmic heating element, a reference value of 6.5 kW was determined for the N2:H2 gas composition of 1:1 (Table 1). By using the ohmic heater it was possible to reduce the screen power to values up to 3.3 kW. As can be seen in Table 1, the N2–H2 feed gas mixture had a significant influence on the resulting screen power. In the case of excess nitrogen in the N2–H2 gas mixture, a lower screen power was required to maintain the process temperature of 733 K. According to a previous study, a difference in AS power resulting from the composition of the N2–H2 feed gas corresponded to a significant change in the concentration of reactive species in the resulting process gas [29].
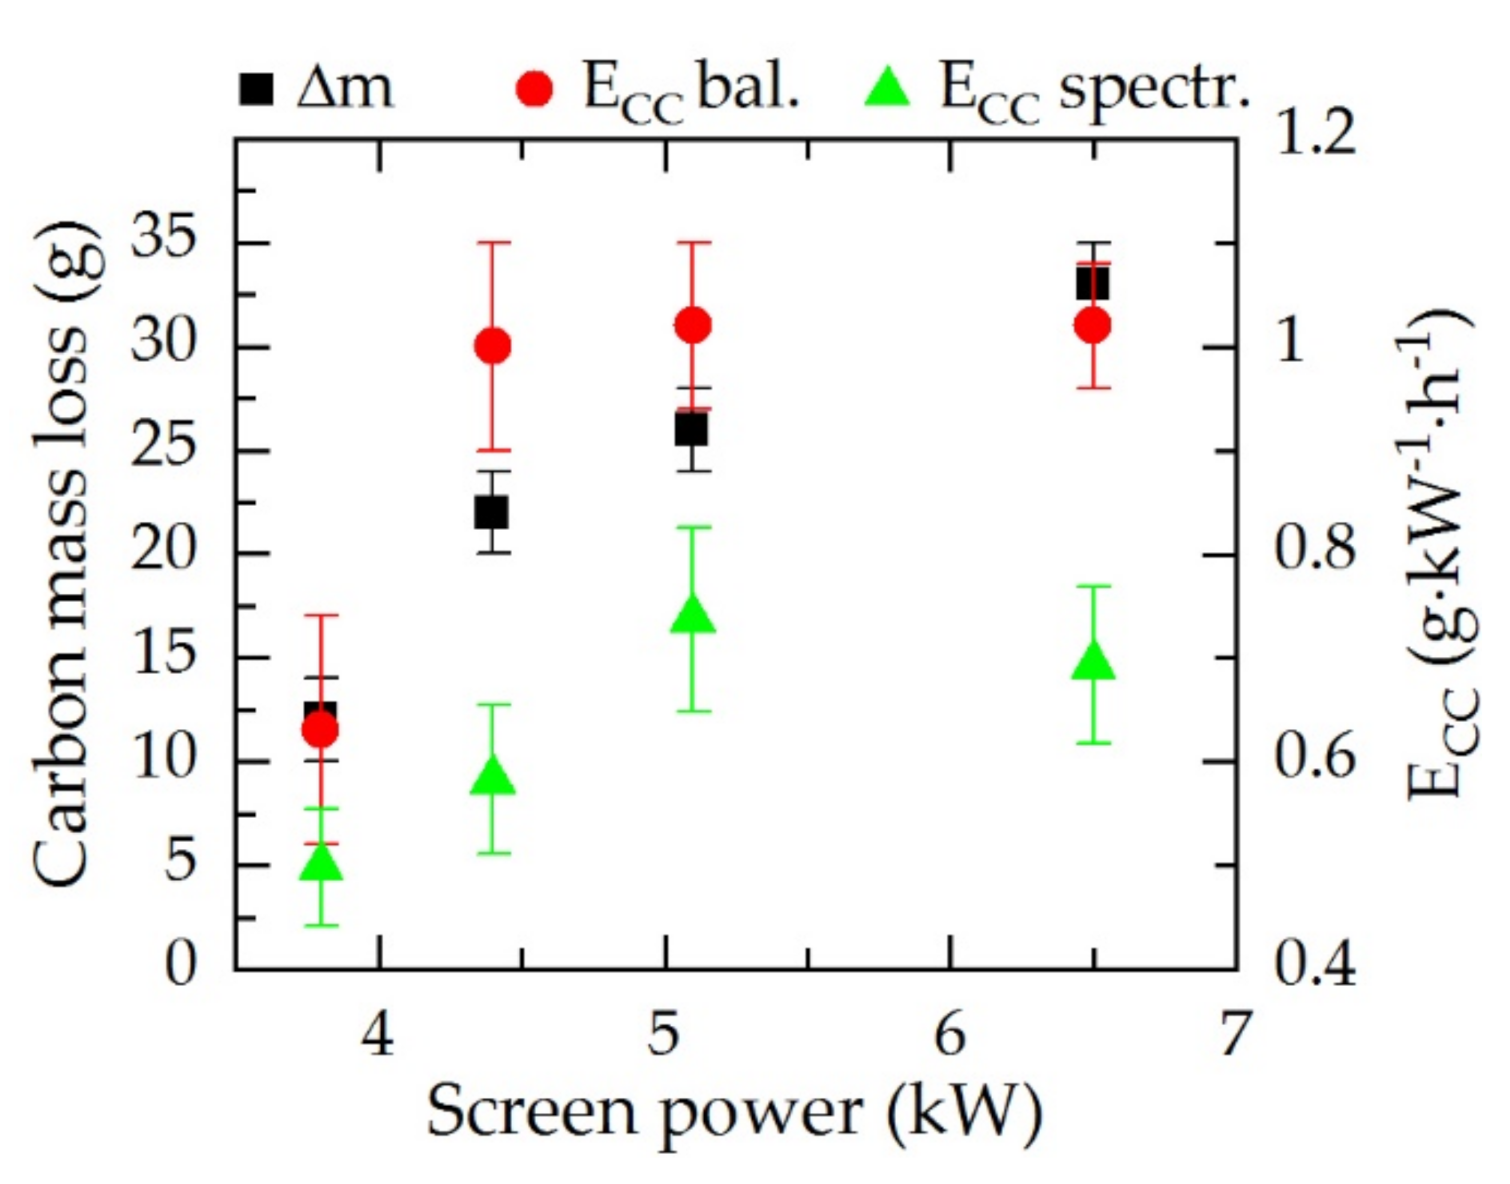
After the process, loss of screen material resulting from the chemical sputtering at the carbon surface was measured. Figure 2 shows the carbon mass loss of the screen material as well as the calculated carbon consumption determined by the balance and by the spectroscopic data for a N2:H2 gas mixture of 1:1.
After the process, a reduction in the screen weight was observed, due to the plasma–chemical reactions and sputtering during the treatment. A dependency of the carbon erosion on the screen power can be assumed from the observations shown in Figure 2. It is evident that by changing the screen power, the carbon loss can be controlled. At a low screen power level of 3.8 kW, the total carbon loss was only 12 g after 5 h treatment process. In contrast, with increasing screen power, the total carbon loss increased up to 33 g at 6.5 kW. The calculation by normalizing the carbon loss shows that for 4.4, 5.1, and 6.5 kW, the carbon consumption was approximately 1 g·kW−1·h−1. By reducing the plasma power to 3.8 kW, the carbon consumption was reduced to 0.6 g kW−1 h−1. In situ determination of the carbon consumption by IRLAS provided significantly lower values for all screen powers from 0.5 g kW−1 h−1 at 3.8 kW, 0.6 g kW−1 h−1 at 4.4 kW, and approximately 0.7 g kW−1 h−1 at 5.1 and 6.5 kW. Considering both measurement methods, a flattening toward a borderline value was observed, indicating a saturation of the carbon consumption. However, the absolute values for the screen weight measurement were significantly higher since carbon was already eroded during the heating phase which cannot be deducted.

3.2. Spectroscopic Results

In Figure 3, the spectroscopic results using IRLAS are presented. For the species HCN, NH3, C2H2, and CH4, the mole fractions in dependence of the screen power for the gas compositions N2:H2 = 1:9, 1:3, 1:1, 3:1, and 9:1 are shown.
As already observed by Puth et al. [19] in a model reactor the four species with the highest concentrations (i.e,. HCN, NH3, C2H2, and CH4) produced at the AS showed a dependency on the screen power. Cyanide (HCN) and NH3 were the two species with the highest mole fractions for all detected gas compositions; however, the dependencies of their concentrations on the screen power were noticeably different. Whereas the mole fraction of HCN rose by increasing the screen power, NH3 decreased slightly. Therefore, for a low screen power, NH3 is the species with the highest concentration. From a certain nitrogen-dependent threshold of screen power, HCN had the highest fraction. Acetylene (C2H2) increased similar to HCN, but the absolute concentration was nearly an order of magnitude lower. For CH4, no clear trend was visible; however, by increasing the nitrogen content in the feed gas, CH4 decreased significantly since less hydrogen was available for the formation. In addition, for N2:H2 = 3:1 and 9:1, the CH4 concentration was too low and could not be determined. For all species except CH4, the highest concentrations were obtained for N2:H2 = 1:1, whereas the lowest was for N2:H2 = 1:9.

3.3. Layer Formation

The influence of the screen power variation on the resulting surface layer modification generated on 316L stainless steel is discussed using the example of an N2–H2 gas composition of 1:1 exhibiting the highest concentrations of reactive species. In Figure 4, micrographs of the resulting surface layers in dependence on the screen power are presented.
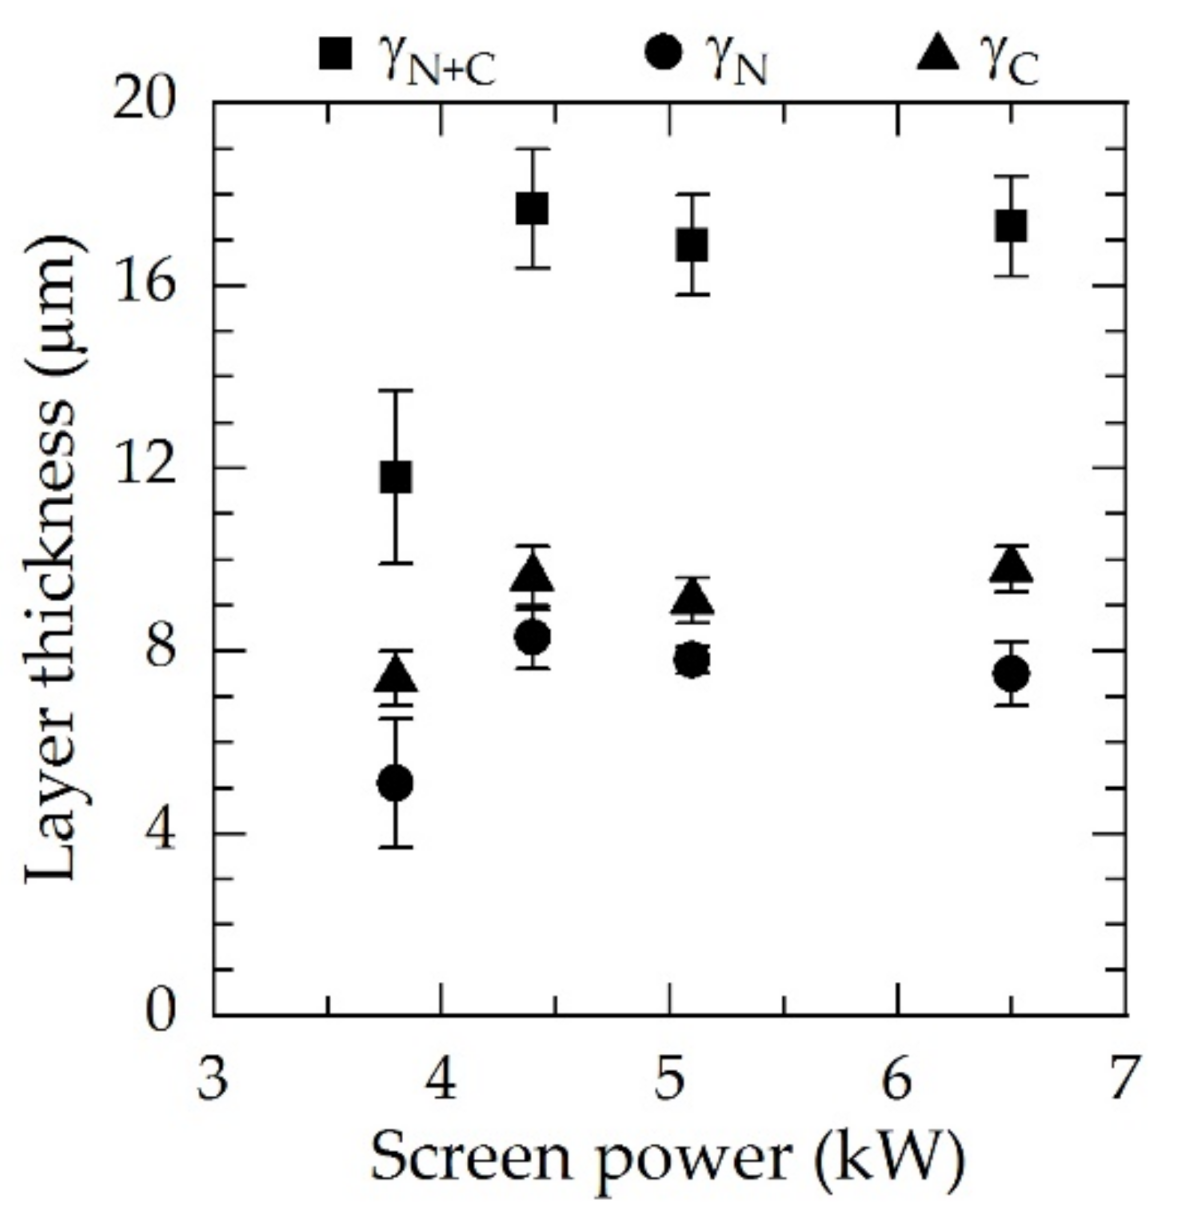
Independent of the screen power, a covering duplex expanded the austenite surface layer developed consisting of a nitrogen expanded austenite (γN) at the surface and an inner carbon expanded austenite (γC) indicated in Figure 4. From the micrographic pictures, the layer thicknesses were subsequently derived and are presented in Figure 5.
Dual layers of expanded austenite of up to 18 µm in thickness were produced. Above power values of 4.4 kW for N2:H2 = 1:1, no substantial changes in both layer thickness and ratios of γN to γC occurred. Thus, the layer thicknesses of γN and γC were comparable for all conditions. In all cases, γC was slightly thicker than γN. For 3.8 kW, a significant reduction in both the layer thickness and nitriding and carburizing potential was observed, and the standard deviation rose in particular for γN.
The concentration–depth profiles of N and C as determined by GDOES are given in Figure 6 for the gas composition N2:H2 = 1:1 at different screen powers.
The specimens revealed a power dependence for the carbon and nitrogen distributions within the expanded austenite. At 3.8 kW, the maximum content of nitrogen was up to 22 at.%, and the maximum carbon content was up to approximately 5 at.%. A major increase both in nitrogen and carbon concentrations were observed at 4.4 kW screen power, at which the incorporation of nitrogen reached up to 27 at.% and for carbon up to 8 at.%. Thus, both the nitriding and the carburizing potential increased. A further increase in screen power up to 5.1 kW did not significantly affect the carbon and nitrogen distributions (Figure 6); however, at 6.5 kW the maximum content of nitrogen increased to 34 at.%, while the maximum content of carbon increased to 9 at.%. Additionally, the diffusion depth of nitrogen (11 μm) and carbon (approximately 24 μm) enlarged.
The concentration–depth profiles indicated that the shallow surface zone was not a pure nitrogen expanded austenite but a mixture of nitrogen and carbon expanded austenite (up to 2 at.% carbon) as already reported by Dalke et al. [29]. In all cases, at least 1.5 at.% carbon was solved in the γN layer. Conversely, no nitrogen could be detected in the γC layer by means of GDOES.
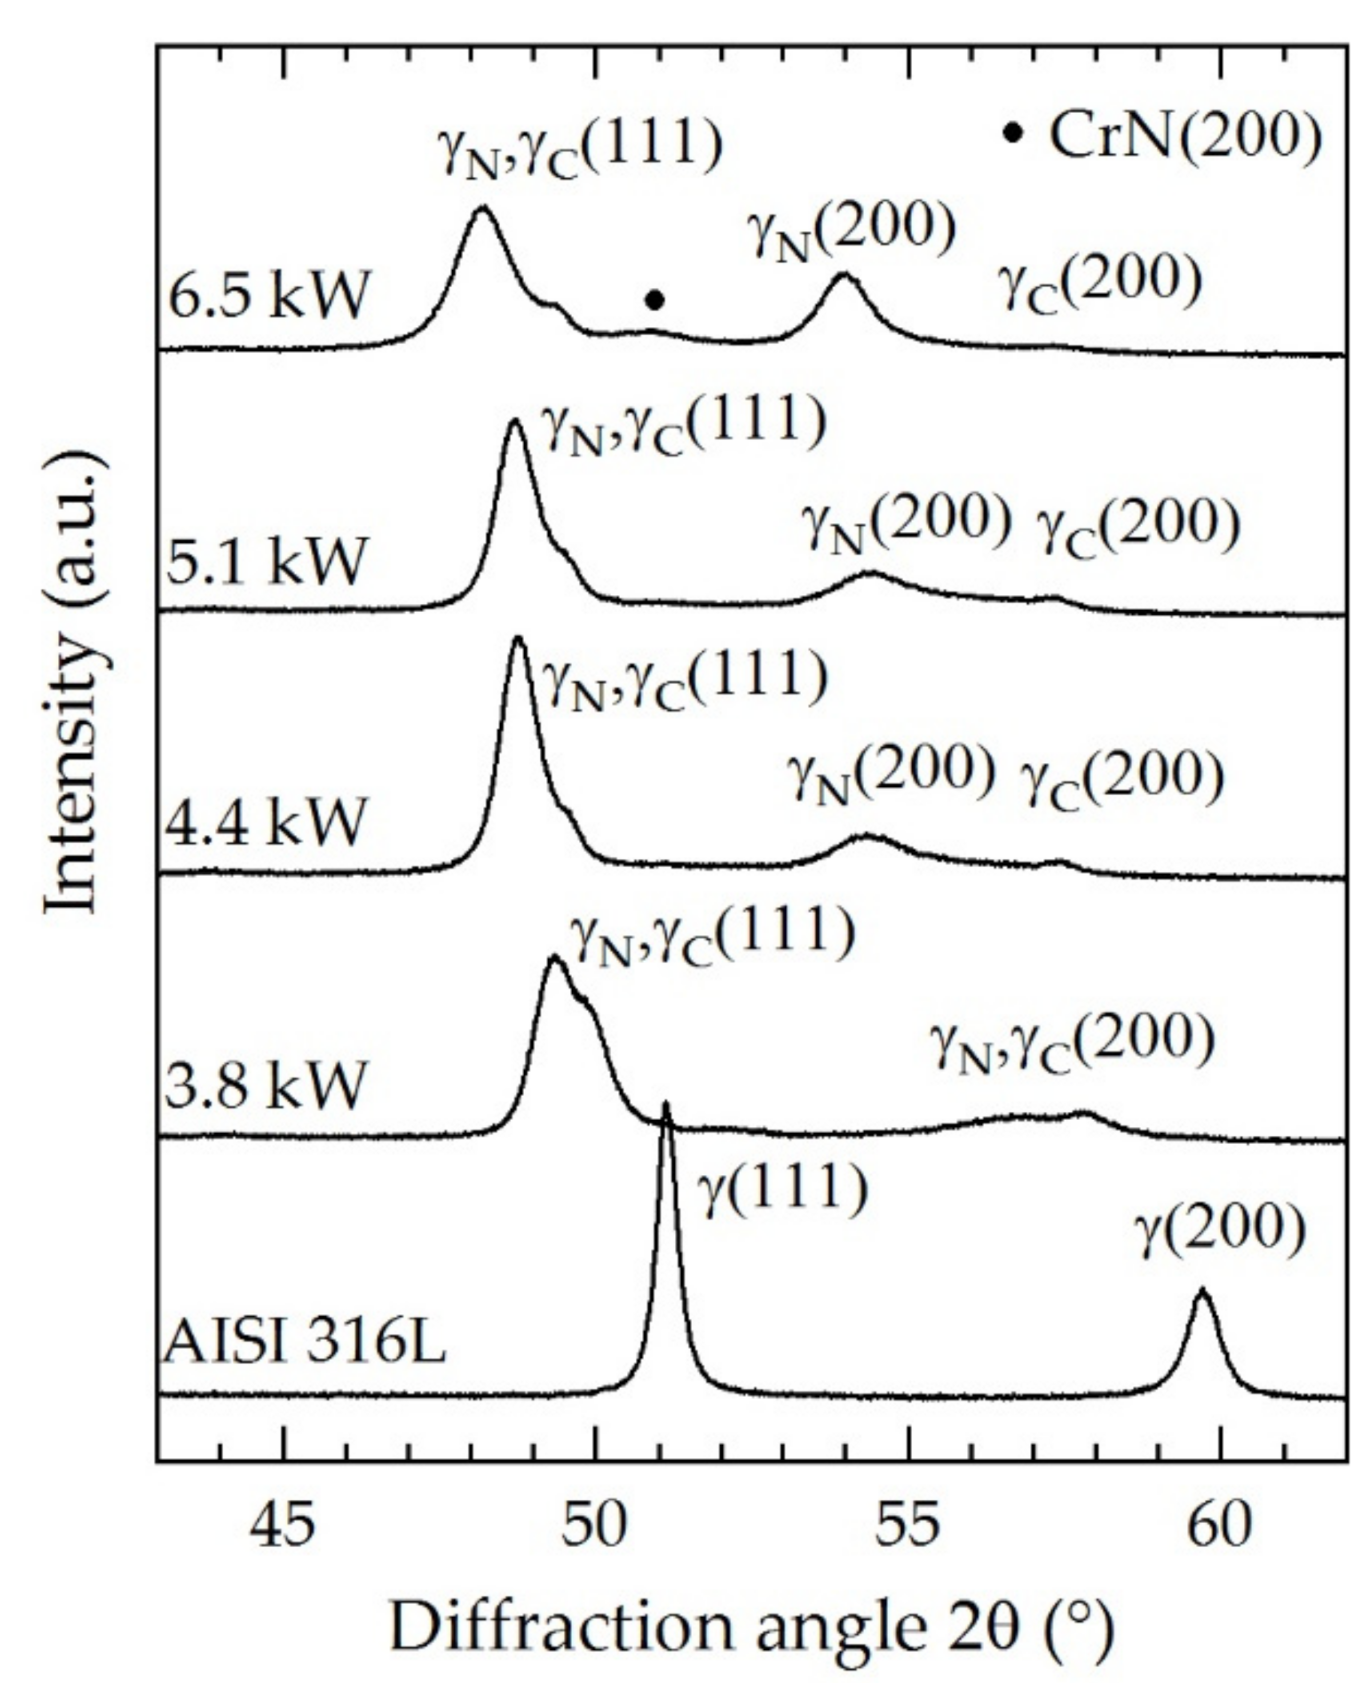
Figure 7 shows the Co-Kα X-ray diffraction profiles of the untreated substrate and the ASPNC treated specimens for N2:H2 = 1:1.
The diffraction profile of the base material (AISI 316L) showed defined and sharp peaks for γ(111) at approximately 51° and γ(200) at approximately 60°. After treatment, the austenite peak positions shifted to lower angles as a result of the lattice expansion. Due to the thickness of the expanded austenite layers, the base material was not detectable. Typically, the expansion is larger for γ(200) than for γ(111) because of the crystallographic anisotropy [37]. After the ASPNC treatment at 3.8 kW, a peak splitting was detected due to the formation of the dual layer made of γN (49.3°) and γC (50.0°) with different lattice parameters. Thereby, the level of expansion turned out to be larger for γN. The layer thicknesses of γN are considerably lower compared to the penetration depth of the radiation. Thus, a distinct and shifted dual peak was detected since γC was also detected. Additionally, for all peaks shown in Figure 7, broadening occurred which can be attributed to micro-strains and the element–depth concentration profiles. An increase in the screen power to 4.4 kW increased the concentration of nitrogen and carbon inside the expanded austenite (Figure 6). As a result, atomic spacing increased and a further lattice expansion for both γN (48.8°) and γC (49.5°) occurred, resulting in a peak shift to lower angles. Furthermore, the intensity of γN increased, which can be attributed to the thicker γN layer and lower detected volume of γC. Therefore, the intensity of γC decreased correspondingly. Another increase in the screen power to 5.1 kW did not change the diffraction profile significantly. The γN(200) and γC(200) peaks showed similar behavior compared to the condition of the 4.4 kW screen power. However, the peak splitting for the (200) peak profile was significantly larger than in the case of the (111) peak profiles. At 6.5 kW, the absolute concentration of nitrogen inside the expanded austenite increased. Thus, the (111) and (200) peaks of γN were further shifted and broadened while γC(200) was not strongly affected. Additionally, CrN can be detected at 6.5 kW which is not visible in the cross-section (Figure 4).
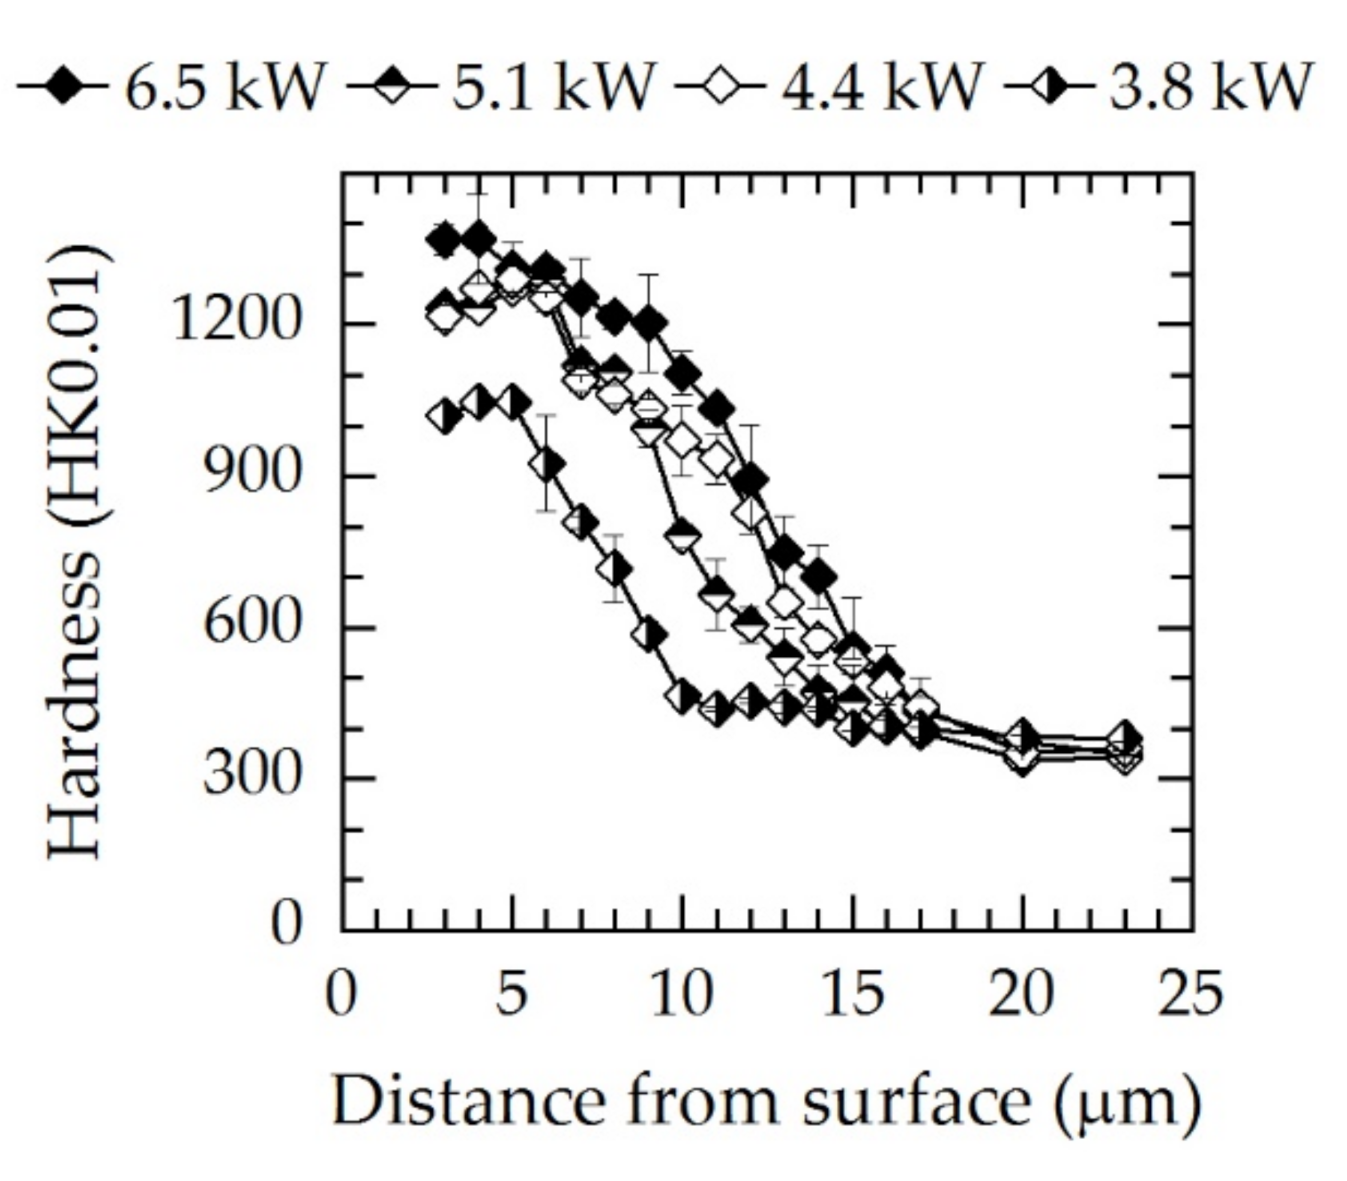
Figure 8 shows the resulting hardness-depth profiles in dependence of the AS power.
After ASPNC, a typical smooth hardness gradient resulted. In the case of the lowest level of screen power (Pscreen = 3.8 kW), the hardness profile significantly deviated from the other profiles, as the measured hardness was lower for the full range of diffusion depth. A maximum hardness of 1150 HK0.01 was observed. Due to the higher nitrogen content inside γN, maximum hardness values of approximately 1200–1300 HK0.01 were obtained for screen power levels at and above 4.4 kW. At high screen power levels, in the range of γN, a hardness plateau was measured up to a depth of 6 µm which subsequently declines toward the base material analogously to the carbon concentration decrease (Figure 6). A reduction in hardness occurred in the transition zone between γN and γC and can be related to decreasing nitrogen contents. Although treatment at 4.4 and 5.1 kW yielded nearly identical γN hardness values as well as nitrogen and carbon distributions, higher hardness values inside γC were obtained for the 4.4 kW screen power. A further increase to 6.5 kW led to a higher maximum hardness of 1400 HK0.01, which can be attributed to higher nitrogen concentrations and the formation of CrN. Additionally, a hardness plateau like for the other powers was not visible which might be attributed to the formation of CrN at the first few micrometers. The subsequent hardness decline toward the base material was not strongly affected; however, the hardness values were slightly higher.

3.4. Influence of the Feed Gas Composition

As presented in Section 3.2., the absolute concentrations of reactive species depend both on the screen power and on the feed gas composition. Accordingly, in this section, the influence of the N2–H2 gas composition on the layer formation will be discussed. To obtain the effect of only the gas composition, experiments with similar screen powers are compared.
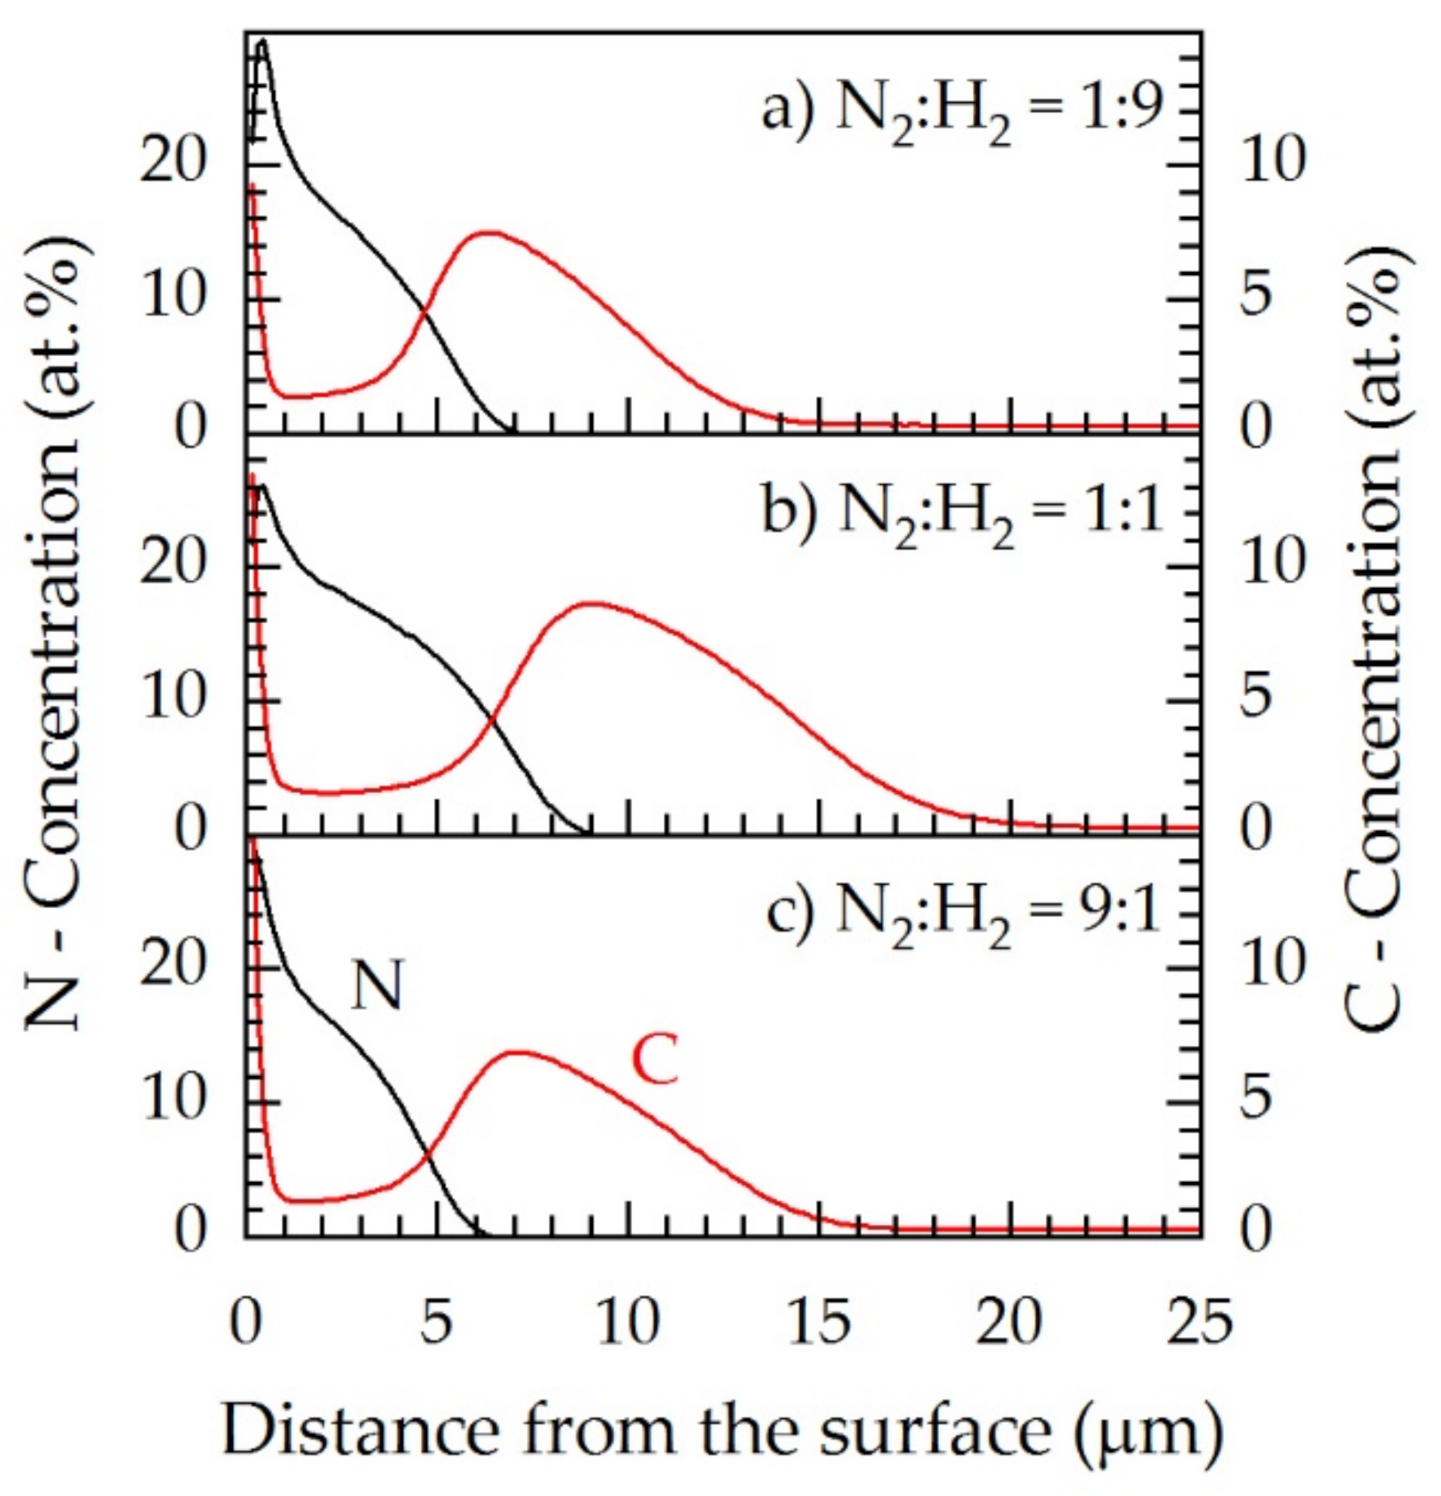
Figure 9 shows the concentration–depth profiles for N2:H2 = 1:9 (5.0 kW), N2:H2 = 1:1 (5.1 kW), and N2:H2 = 9:1 (4.5 kW). As described in Section 3.3., approximately 2 at.% carbon can be found inside γN, independent of the gas composition. However, both the concentrations of nitrogen and carbon inside the expanded austenite layer differed for the different feed gas compositions. For N2:H2 = 1:1, the highest amounts of nitrogen and carbon diffused inside the material. In the case of N2:H2 = 1:9 and N2:H2 = 9:1, lower masses of nitrogen and carbon were dissolved; however, the maximum nitrogen concentrations at the surface were slightly higher. The shapes of the profiles, however, are nearly identical which can be explained by the nearly identical gas compositions of the resulting process gas (Figure 3).
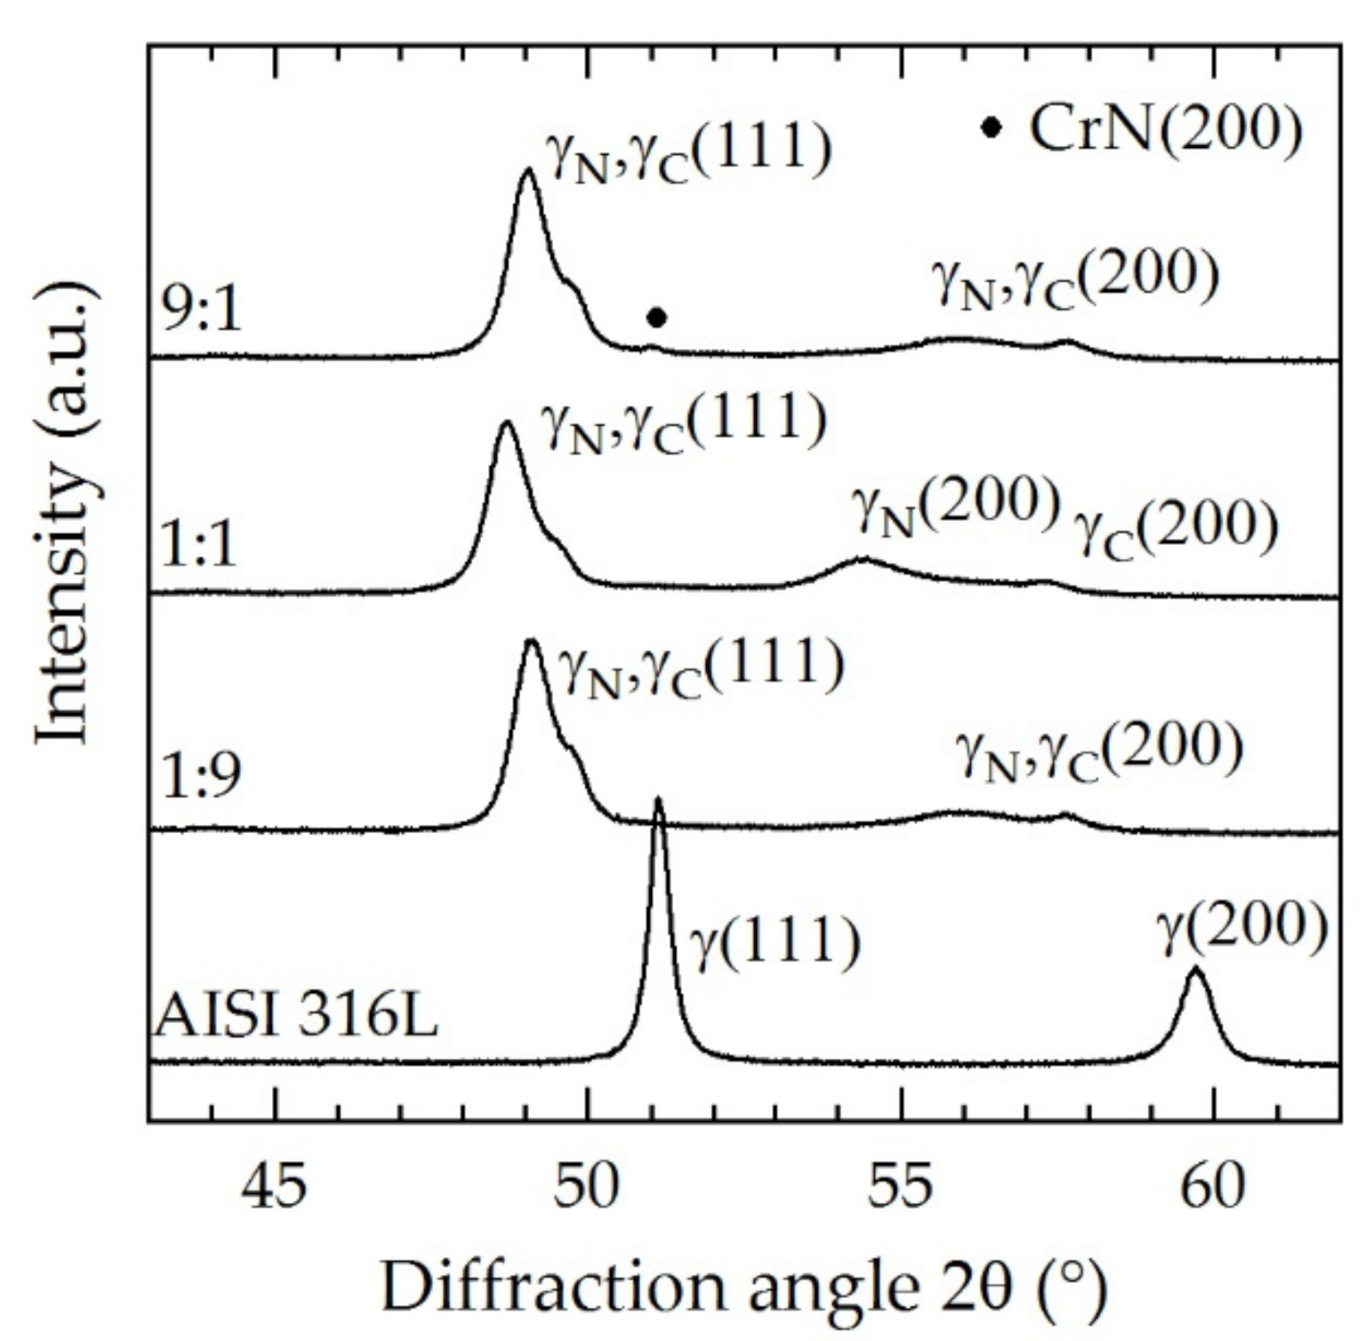
Figure 10 shows the X-ray diffraction profile of the specimens treated at N2:H2 = 1:9, 1:1, and 9:1.
Like in all specimens, the peaks shifted to lower angles and peak splitting occurred. For N2:H2 = 1:1, the peaks shifted to the lowest angle due to the higher amount of nitrogen solved in the expanded austenite layer. For both N2:H2 = 1:9 and 9:1, the peak shift was lower compared to N2:H2 = 1:1. The differences between the gas compositions N2:H2 = 1:9 and 9:1 are relatively small. CrN formation was evidenced for N2:H2 = 9:1; however, we cannot estimate why it only occurred for this particular case. How gas composition and screen power affect CrN formation will be the subject of a future work.
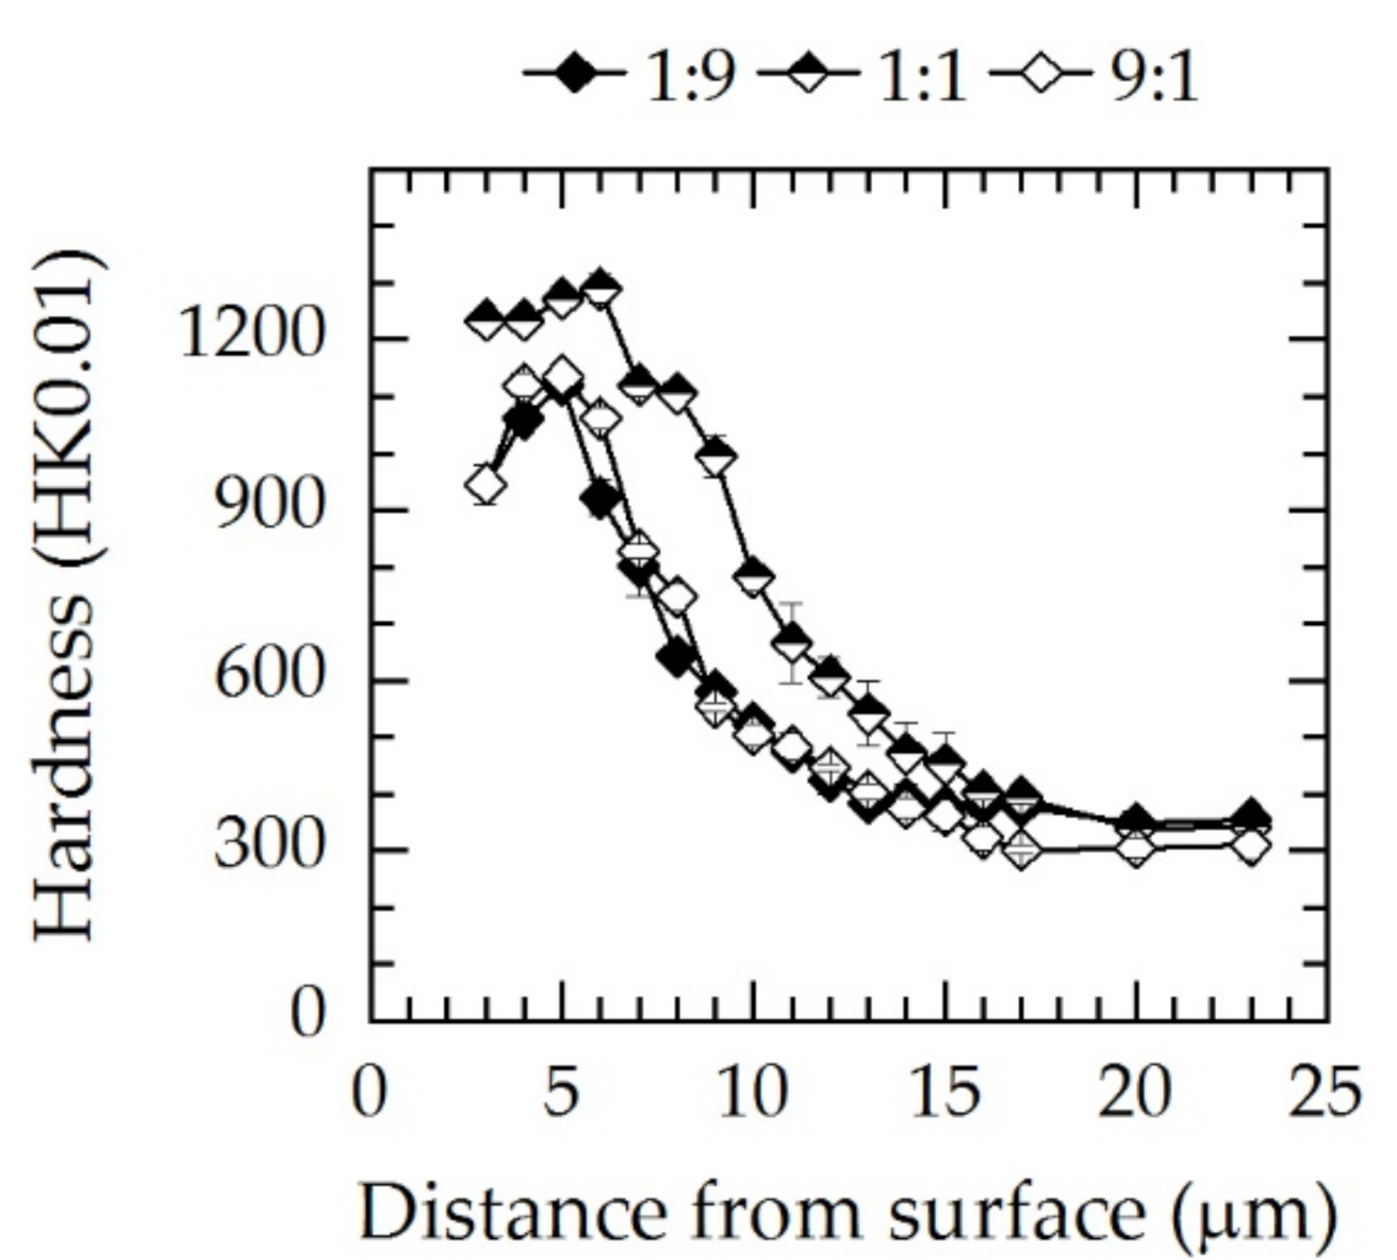
Microhardness–depth profiles measured on the cross-sections are presented in Figure 11. Analogously to the X-ray diffraction and GDOES profiles, it can be seen that the maximum hardness of approximately 1200–1300 HK0.01 was achieved for the gas composition N2:H2 = 1:1. For N2:H2 = 1:9 and 9:1, the maximum hardness was measured a few micrometers below the surface in γN and was significantly lower at 1100 HK0.01. Additionally, the hardness–depth profiles were equal within the measuring uncertainty and were consistent with the X-ray diffraction and GDOES analyses.

4. Discussion

The application of an AS made of CFC opens up new possibilities for the surface hardening of stainless steels. As a result of the interaction of the plasma-activated carbon surface of the AS with different N2–H2 feed gas mixtures, a resulting process gas consisting of several reaction products was produced. By chemical sputtering, much higher concentrations of carbon-bearing reactive species are created compared to a steel screen [23].
As already reported by Puth et al. [19] for model reactor conditions, the production rate of reactive species formed at a solid carbon source depends on both screen power and feed gas composition. The reported results are consistent with the spectroscopic results that were obtained for an industrial-scale reactor in the present study. For the selected feed gas compositions, by increasing the screen power the concentrations of carbon bearing species HCN and C2H2, except CH4, increase, while NH3 decreases. Therefore, from a certain screen power level HCN becomes the predominant species. The highest concentrations of reactive species (i.e., HCN, NH3, C2H2) were produced for a feed gas composition of N2:H2 = 1:1, whereas the lowest concentrations were obtained for excess nitrogen or excess hydrogen (N2:H2 = 1:9 and 9:1), respectively.
As reported by Lebrun [38] in a patent application, HCN and C2H2 in sufficiently high concentrations can reduce the chromium oxide passive layers on stainless steels thus enabling the intake of carbon and nitrogen. This was confirmed by the present study due to the formation of expanded austenite surface layers generated even without adjusting an additional bias plasma discharge on specimens made of austenitic stainless steel AISI 316L (Figure 4).
In order to study the effect of reactive species, the austenitic stainless steel 316L was treated under different conditions with regards to AS power and feed gas composition. Independent of the gas composition and screen power, an expanded austenite was formed that covered the surface completely. Maximum nitrogen concentrations of up to 30 at.%, and maximum carbon concentrations within the carbon expanded austenite layer of up to 8 at.% were created. Thus, a high lattice expansion and resulting beneficial layer properties of a high surface hardness and smooth hardness–depth profiles resulted. The high carburizing potential led to high carbon contents inside the expanded austenite. In all specimens, a carbon content of approximately 2 at.% within the zone of the expanded nitrogen austenite was detected.
Diffusion of both nitrogen and carbon leads to the occupation of energetically favorable octahedral trapping sites near chromium atoms and the formation of a thermodynamically driven distinctive dual layer made of an outer γN and subjacent γC [39]. However, the strong energetic bond of chromium and nitrogen explains only the presence of significantly lower nitrogen contents (Cr:N ≈ 1:1). For higher concentrations, nitrogen is present in a further, higher energetic state. The presence of carbon in lattice gaps inside γN can be explained by the diffusion from the surface through the nitrogen expanded austenite γN to the carbon expanded austenite γC below. Besides nitrogen, carbon contributes to the hardness increase of γN.
Nevertheless, the material properties and layer homogeneity varied depending on the screen power and feed gas composition. For the investigated conditions, dual layers of expanded austenite with thicknesses up to 18 µm were generated. This is assumed to be the maximum at the given time and temperature and limited by the substrate-dependent diffusion rate. Furthermore, the layer thickness of γN and γC was almost equal, which is characteristic for nitrocarburizing in an afterglow condition when using a carbon AS. The γN reached up to 8 µm, whereas γC reached up to 10 µm thickness. If the power dropped below a feed-gas depended threshold value, a significant reduction of both nitrogen and carbon contents inside the expanded austenite occurred. As a result, the total layer thickness was reduced.
By changing the screen power and feed gas composition, different hardness–depth profiles and layer hardness values were produced. Above a certain screen power, hardness plateaus inside γN up to approximately 1300 HK0.01 and 6 μm depth were generated and were supported by the graduated and softer γC. A further increase in the screen power led to higher hardness values of 1400 HK0.01; however, this was associated with the formation of undesired CrN. A declining screen power impedes the formation of hardness plateaus and reduces the hardness inside both γN and γC. Therefore, a lower threshold screen power is recommended to generate the highest possible layer thickness of expanded austenite with sufficient hardness properties.
Based on the expanded austenite formation it was evident that by increasing the screen power both the nitriding and the carburizing potential increase. Both are connected to each other. Due to the fact that only two nitrogen-bearing species in notable concentrations were available, and the NH3 concentration decreased while the nitrogen concentration inside the expanded austenite increased, it is to be expected that HCN had a main impact on nitrogen uptake. Additionally, it is assumed that HCN provides a large proportion of the carbon uptake. What impact other species like NH3 or C2H2 have on the results of nitrocarburizing cannot be conclusively assessed at this point but will be part of further investigations. However, to obtain a satisfactory material result, including a homogeneous and thick expanded austenite layer for the austenitic stainless steel AISI 316L, a minimal concentration of HCN in the process gas is recommended. The present study found that the minimal concentration of 1.5 × 10¹⁵ molecules cm−3 can produce nitrocarburized layers of sufficient quality. By reducing the HCN concentration below this value by decreasing the screen power, both thickness reduction and inhomogeneity were observed. Exceeding the plasma power required for this concentration may result in slightly improved surface layers; however, CrN formation and a higher carbon loss are the result and, thus, a lower life time of the carbon AS. Comparing different gas compositions at a fixed screen power, the highest concentration of HCN is obtained for N2:H2 = 1:1. Therefore, the highest amount of nitrogen and carbon is solved inside the surface layer compared to N2:H2 = 1:9 and 9:1. As a result, the hardest layer and highest lattice expansion is generated for N2:H2 = 1:1. To obtain a similar minimum concentration of 1.5 × 10¹⁵ molecules cm−3 the resulting screen power for other gas compositions, such as N2:H2 = 1:9 and 9:1, would have to be significantly higher.
The present results thus show that a stable process with significant stability in terms of process parameters can be set using a CFC AS. The analysis of the process gas by IRLAS helped to control the set conditions. The use of a heating independent of the screen power provided an additional parameter to optimize the process of ASPNC, in addition to changes of the feed gas composition and bias power [30]. By this way, a new system with a process control is a reasonable next step of future work.

5. Conclusions

In the present study, the effect of screen power variation during ASPNC without adjustment of an additional bias on the austenitic stainless steel AISI 316L samples was investigated. The concentrations of the gas species generated at the carbon screen, HCN, NH3, CH4, and C2H2, showed dependencies on power. By increasing the screen power, the concentrations of carbon-bearing species increased, while the concentration of NH3 decreased. The highest concentration of species (HCN, NH3 and C2H2) was generated for N2:H2 = 1:1.
It was shown that the produced reactive afterglow with high concentrations of HCN and C2H2 was able to activate the surface of stainless steels. Further, the treatment resulted in a dual layer of expanded austenite with a thickness of up to 18 µm and a maximum hardness of up to 1400 HK0.01. The thicknesses of the nitrogen-expanded austenite layer and carbon-expanded austenite layer were comparable. Based on the presented results HCN is expected to be the most important species for the nitrogen uptake.
A gas mixture dependent threshold of the power of the AS was found above which no significant changes in the layer thickness are measured. Below, the decrease in AS power led to a decrease in the diffusion depths of nitrogen and carbon. The use of an additional bias plasma is not required which opens up new possibilities for plasma-assisted bulk material treatments of austenitic stainless steels.

Author Contributions

Conceptualization, J.B. and A.D.; methodology, J.B. and A.P.; investigation, J.B.; validation, H.B., J.R., and J.-P.H.v.H.; formal analysis, H.B.; resources, J.B. and A.P.; data curation, J.B. and A.P.; writing—original draft preparation, J.B.; writing—review and editing, H.B. and A.D.; visualization, J.B.; supervision, H.B.; project administration, A.D.; funding acquisition, H.B. and J.R. All authors have read and agreed to the published version of the manuscript.

Funding

This research was funded by the Deutsche Forschungsgemeinschaft (DFG, German Research Foundation: 289846720) (BI 418/31-2; RO 2202/10-2). Open Access Funding by the Publication Fund of the TU Bergakademie Freiberg.

Acknowledgments

The authors thank Christian Schimpf (TU Bergakademie Freiberg, Institute of Materials Science) for XRD analysis and Irena Diegel (TU Bergakademie Freiberg, Institute of Materials Engineering) for the practical support.

Conflicts of Interest

The authors declare no conflict of interest.

References

  1. Somers, M.A.J.; Christiansen, T.L. Low temperature surface hardening of stainless steel. In Thermochemical Surface Engineering of Steels, 62nd ed.; Mittemeijer, E.J., Somers, M.A.J., Eds.; Woodhead Publishing Series in Metals and Surface Engineering; Woodhead Publishing: Sawston, UK, 2015; ISBN 978-0-85709-592-3. [Google Scholar]
  2. Bell, T. Surface engineering of austenitic stainless steel. Surf. Eng. 2002, 18, 415–422. [Google Scholar] [CrossRef]
  3. Ceschini, L.; Chiavari, C.; Lanzoni, E.; Martini, C. Low-temperature carburised AISI 316L austenitic stainless steel: Wear and corrosion behaviour. Mater. Des. 2012, 38, 154–160. [Google Scholar] [CrossRef]
  4. Baranowska, J. Importance of surface activation for nitrided layer formation on austenitic stainless steel. Surf. Eng. 2010, 26, 293–298. [Google Scholar] [CrossRef]
  5. Sun, Y.; Haruman, E. Effect of carbon addition on low-temperature plasma nitriding characteristics of austenitic stainless steel. Vacuum 2006, 81, 114–119. [Google Scholar] [CrossRef]
  6. de Las Heras, E.; Ybarra, G.; Lamas, D.; Cabo, A.; Dalibon, E.L.; Brühl, S.P. Plasma nitriding of 316L stainless steel in two different N2-H2 atmospheres-Influence on microstructure and corrosion resistance. Surf. Coat. Technol. 2017, 313, 47–54. [Google Scholar] [CrossRef]
  7. Spies, H.-J.; Eckstein, C.; Biermann, H.; Franke, A. Corrosion behaviour of stainless steels after low temperature thermochemical treatment. Materialwiss. Werkst. 2010, 41, 133–141. [Google Scholar] [CrossRef]
  8. Riviere, J.P.; Cahoreau, M.; Meheust, P. Chemical bonding of nitrogen in low energy high flux implanted austenitic stainless steel. J. Appl. Phys. 2002, 91, 6361. [Google Scholar] [CrossRef]
  9. Georges, J. Nitriding Process and Nitriding Furnace Therefor. U.S. Patent 5989363, 23 November 1999. [Google Scholar]
  10. Li, C.X. Active screen plasma nitriding–an overview. Surf. Eng. 2010, 26, 135–141. [Google Scholar] [CrossRef]
  11. Jaoul, C.; Belmonte, T.; Czerwiec, T.; David, N. Nitrocarburizing treatments using flowing afterglow processes. Appl. Surf. Sci. 2006, 252, 8360–8366. [Google Scholar] [CrossRef]
  12. Ricard, A. Spectroscopy of flowing discharges and post-discharges in reactive gases. Surf. Coat. Technol. 1993, 59, 67–76. [Google Scholar] [CrossRef]
  13. Legrand, J.-C.; Diamy, A.-M.; Hrach, R.; Hrachova, V. Methane Conversion in the Flowing Afterglow of a Dinitrogen Microwave Plasma: Initiation of the Reaction. Contrib. Plasma Phys. 1997, 37, 521–537. [Google Scholar] [CrossRef]
  14. Burlacov, I.; Hamann, S.; Spies, H.-J.; Dalke, A.; Röpcke, J.; Biermann, H. A Novel Approach of Plasma Nitrocarburizing Using a Solid Carbon Active Screen–a Proof of Concept. HTM J. Heat Treat. Mater. 2017, 72, 254–259. [Google Scholar] [CrossRef]
  15. Dalke, A.; Burlacov, I.; Hamann, S.; Puth, A.; Spies, H.-J.; Röpcke, J.; Biermann, H. Plasma Nitrocarburizing of AISI 316L Austenitic Stainless Steel Applying a Carbon Active Screen: Status and Perspectives. HTM J. Heat Treat. Mater. 2018, 73, 246–257. [Google Scholar] [CrossRef]
  16. Burlacov, I.; Börner, K.; Spies, H.-J.; Biermann, H.; Lopatik, D.; Zimmermann, H.; Röpcke, J. In-situ monitoring of plasma enhanced nitriding processes using infrared absorption and mass spectroscopy. Surf. Coat. Technol. 2012, 206, 3955–3960. [Google Scholar] [CrossRef]
  17. Hamann, S.; Börner, K.; Burlacov, I.; Hübner, M.; Spies, H.-J.; Röpcke, J. Spectroscopic studies of conventional and active screen N2–H2 plasma nitriding processes with admixtures of CH4 or CO2. Plasma Sources Sci. Technol. 2013, 22, 55022. [Google Scholar] [CrossRef]
  18. Burlacov, I.; Hamann, S.; Spies, H.-J.; Röpcke, J.; Biermann, H. In-line Process Control in the Active Screen Plasma Nitrocarburizing Using a Combined Approach Based on Infrafred Laser Absorption Spectroscopy and Bias Power Management. HTM J. Heat Treat. Mater. 2016, 71, 141–147. [Google Scholar] [CrossRef]
  19. Puth, A.; Hamann, S.; Kusýn, L.; Burlacov, I.; Dalke, A.; Spies, H.-J.; Biermann, H.; Röpcke, J. Spectroscopic investigations of plasma nitrocarburizing processes using an active screen made of carbon in a model reactor. Plasma Sources Sci. Technol. 2018, 27, 75017. [Google Scholar] [CrossRef]
  20. Puth, A.; Kusýn, L.; Pipa, A.V.; Burlacov, I.; Dalke, A.; Hamann, S.; van Helden, J.H.; Biermann, H.; Röpcke, J. Spectroscopic study of plasma nitrocarburizing processes with an industrial-scale carbon active screen. Plasma Sources Sci. Technol. 2020, 29, 35001. [Google Scholar] [CrossRef]
  21. Schlüter, M.; Hopf, C.; Jacob, W. Chemical sputtering of carbon by combined exposure to nitrogen ions and atomic hydrogen. New J. Phys. 2008, 10, 53037. [Google Scholar] [CrossRef] [Green Version]
  22. Bystrov, K.; Morgan, T.W.; Tanyeli, I.; de Temmerman, G.; van de Sanden, M.C.M. Chemical sputtering of graphite by low temperature nitrogen plasmas at various substrate temperatures and ion flux densities. J. Appl. Phys. 2013, 114, 133301. [Google Scholar] [CrossRef] [Green Version]
  23. Hamann, S.; Burlacov, I.; Spies, H.-J.; Biermann, H.; Röpcke, J. Spectroscopic investigations of plasma nitriding processes: A comparative study using steel and carbon as active screen materials. J. Appl. Phys. 2017, 121, 153301. [Google Scholar] [CrossRef]
  24. Song, Y.; Kim, J.-H.; Kim, K.-S.; Kim, S.; Song, P. Effect of C2H2/H2 Gas Mixture Ratio in Direct Low-Temperature Vacuum Carburization. Metals 2018, 8, 493. [Google Scholar] [CrossRef] [Green Version]
  25. Christiansen, T.L.; Hummelshøj, T.S.; Somers, M.A.J. Gaseous carburising of self-passivating Fe–Cr–Ni alloys in acetylene–hydrogen mixtures. Surf. Eng. 2011, 27, 602–608. [Google Scholar] [CrossRef]
  26. Hoshino, K.; Mayashita, M.; Kawamura, T.; Totsuka, T.; Eiraku, H.; Yashiro, K.; Kurosawa, T. Method for Activating Surface of Metal Member. EP1707646B1, 12 August 2009. [Google Scholar]
  27. Hubbard, P.; Dowey, S.J.; Doyle, E.D.; McCulloch, D.G. Influence of bias and in situ cleaning on through cage (TC) or active screen plasma nitrided (ASPN) steels. Surf. Eng. 2006, 22, 243–247. [Google Scholar] [CrossRef]
  28. Burlacov, I.; Börner, K.; Spies, H.-J.; Biermann, H. Progress in control of nitriding potential in ASPN process. Int. Heat Treat. Surf. Eng. 2014, 8, 139–143. [Google Scholar] [CrossRef]
  29. Dalke, A.; Burlacov, I.; Hamann, S.; Puth, A.; Böcker, J.; Spies, H.-J.; Röpcke, J.; Biermann, H. Solid carbon active screen plasma nitrocarburizing of AISI 316L stainless steel: Influence of N2-H2 gas composition on structure and properties of expanded austenite. Surf. Coat. Technol. 2019, 357, 1060–1068. [Google Scholar] [CrossRef]
  30. Jafarpour, S.M.; Puth, A.; Dalke, A.; Böcker, J.; Pipa, A.; Röpcke, J.; van Helden, J.-P.H.; Biermann, H. Solid carbon active screen plasma nitrocarburizing of AISI 316L stainless steel in cold wall reactor: Influence of plasma conditions. J. Mater. Res. Technol. 2020, 9, 9195–9205. [Google Scholar] [CrossRef]
  31. Burlacov, I.; Hamann, S.; Spies, H.-J.; Röpcke, J.; Biermann, H. On the influence of carbon contamination of reactor parts in active screen plasma nitrocarburizing processes. J. Appl. Phys. 2018, 123, 233302. [Google Scholar] [CrossRef]
  32. Gordon, I.E.; Rothman, L.S.; Hill, C.; Kochanov, R.V.; Tan, Y.; Bernath, P.F.; Birk, M.; Boudon, V.; Campargue, A.; Chance, K.V.; et al. The HITRAN2016 molecular spectroscopic database. J. Quant. Spectrosc. Radiat. Transf. 2017, 203, 3–69. [Google Scholar] [CrossRef]
  33. Ba, Y.A.; Wenger, C.; Surleau, R.; Boudon, V.; Rotger, M.; Daumont, L.; Bonhommeau, D.A.; Tyuterev, V.G.; Dubernet, M.-L. MeCaSDa and ECaSDa: Methane and ethene calculated spectroscopic databases for the virtual atomic and molecular data centre. J. Quant. Spectrosc. Radiat. Transf. 2013, 130, 62–68. [Google Scholar] [CrossRef]
  34. Kabbadj, Y.; Herman, M.; Di Lonardo, G.; Fusina, L.; Johns, J.W.C. The bending energy levels of C2H2. J. Mol. Spectrosc. 1991, 150, 535–565. [Google Scholar] [CrossRef]
  35. Maki, A.G.; Mellau, G.C.; Klee, S.; Winnewisser, M.; Quapp, W. High-Temperature Infrared Measurements in the Region of the Bending Fundamental of H12C14N, H12C15N, and H13C14N. J. Mol. Spectrosc. 2000, 202, 67–82. [Google Scholar] [CrossRef] [Green Version]
  36. Cottaz; Kleiner; Tarrago; Brown; Margolis; Poynter; Pickett; Fouchet; Drossart; Lellouch. Line Positions and Intensities in the 2nu(2)/nu(4) Vibrational System of (14)NH(3) near 5–7 µm. J. Mol. Spectrosc. 2000, 203, 285–309. [Google Scholar] [CrossRef] [PubMed]
  37. Mändl, S.; Rauschenbach, B. Anisotropic strain in nitrided austenitic stainless steel. J. Appl. Phys. 2000, 88, 3323–3329. [Google Scholar] [CrossRef]
  38. Poirier, L.; Lebrun, J.-P.; Delmas, B. Method for Treating the Surface of a Part and Resulting Part. U.S. Patent 7074460B2, 11 July 2006. [Google Scholar]
  39. Christiansen, T.; Somers, M.A.J. Controlled Dissolution of Colossal Quantities of Nitrogen in Stainless Steel. Metall. Mater. Trans. A 2006, 37, 675–682. [Google Scholar] [CrossRef]
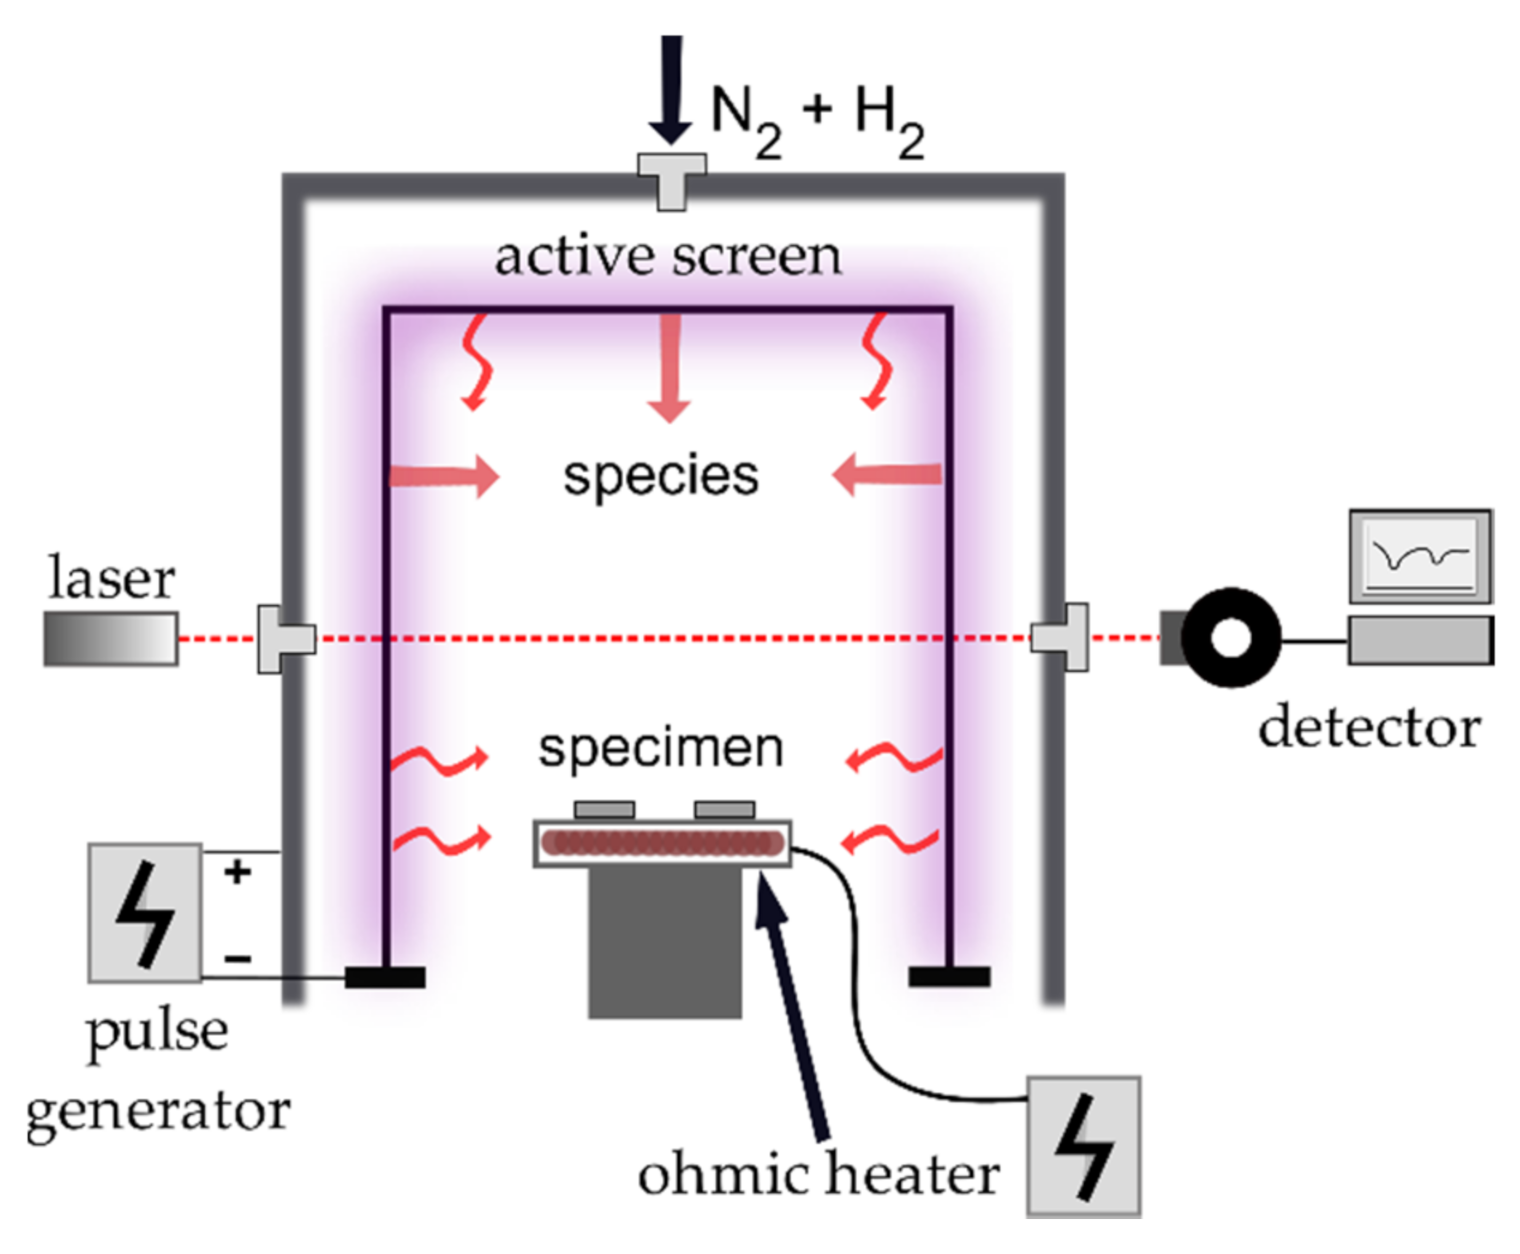
Figure 1. Schematic illustration of the experimental setup of active screen plasma nitrocarburizing (ASPNC) reactor and newly introduced ohmic heater.
Coatings 10 01112 g001
Figure 2. Carbon mass loss (Δm, black) and carbon consumption (ECC) determined after the process by the balance (ECC bal., red) and by spectroscopic data (ECC spectr., green) of the screen material in dependence of the resulting screen power for a gas composition of N2:H2 = 1:1, 5 h treatment time.
Coatings 10 01112 g002
Figure 3. Mole fractions of (a) cyanide (HCN), (b) NH3, (c) C2H2, and (d) CH4 in dependence of the screen power for different N2–H2 gas compositions.
Coatings 10 01112 g003
Figure 4. Resulting duplex layer formation for (a) 6.5 kW, (b) 5.1 kW, (c) 4.4 kW, and (d) 3.8 kW using a gas composition of N2:H2 = 1:1; T = 733 K; t = 5 h; etchant: Beraha II reagent.
Coatings 10 01112 g004
Figure 5. Layer thicknesses γN and γC and total layer thickness γN+C as a function of the screen power for N2:H2 = 1:1, T = 733 K, and t = 5 h measured on cross-sections.
Coatings 10 01112 g005
Figure 6. GDOES (glow discharge optical emission spectroscopy) concentration–depth profiles for nitrogen (left axis, black) and carbon (right axis, red) for the plasma power values at the active screen (AS) of (a) 6.5 kW, (b) 5.1 kW, (c) 4.4 kW, (d) 3.8 kW for N2:H2 = 1:1; T = 733 K; t = 5 h.
Coatings 10 01112 g006
Figure 7. X-ray diffraction profiles as function of the screen power for N2:H2 = 1:1; T = 733 K; t = 5 h.
Coatings 10 01112 g007
Figure 8. Microhardness–depth profiles for three different screen powers for N2:H2 = 1:1; T = 733 K; t = 5 h. The lines are a guide for the eye.
Coatings 10 01112 g008
Figure 9. GDOES concentration–depth profiles of nitrogen (left axis, black) and carbon (right axis, red) for three feed gas compositions of (a) N2:H2 = 1:9, (b) 1:1, (c) 9:1 at a fixed screen power of approximately 5 kW, T = 733 K; t = 5 h.
Coatings 10 01112 g009
Figure 10. X-ray diffraction profiles for three feed gas compositions at a fixed screen power of approximately 5 kW, T = 733 K; t = 5 h.
Coatings 10 01112 g010
Figure 11. Microhardness–depth profiles for three different gas compositions at a screen power of approximately 5 kW; T = 733 K; t = 5 h. The lines are a guide for the eye.
Coatings 10 01112 g011
Table 1. Average electrical parameters for ASPNC experiments for material treatment and spectroscopic measurements.
N2:H2PHeater (W)PScreen (kW)UScreen (V)IScreen (A)
1:908.034223.2
1:91007.233522.5
1:92006.432219.8
1:93005.631318.0
1:94005.030316.3
1:307.332822.2
1:31006.532220.3
1:32005.731418.2
1:33005.030616.3
1:34004.429814.7
1:106.530121.5
1:11005.829319.9
1:12005.128817.6
1:13004.428115.6
1:14003.827513.9
3:106.128021.7
3:11005.427519.6
3:12004.726917.6
3:13004.126215.7
3:14003.425613.5
9:106.028021.2
9:11005.327419.3
9:12004.526716.9
9:13004.026115.2
9:14003.325413.1
Table 2. Monitored species and their respective spectral positions, absorption line strengths at room temperature, and estimated limits of detection.
SpeciesPosition
(cm−1)
Line Strength
(cm−1/(Molecule cm−2))
Limit of Detection
(Molecule cm−3)
Reference
CH41356.48681.784 × 10−202 × 1013[33]
CH41356.59741.190 × 10−202 × 1013[33]
C2H21356.85541.301 × 10−191 × 1012[34]
HCN1356.70881.307 × 10−212 × 1013[35]
HCN1388.18184.621 × 10−205 × 1012[35]
NH31388.05522.726 × 10−222 × 1014[36]
Publisher’s Note: MDPI stays neutral with regard to jurisdictional claims in published maps and institutional affiliations.