1. Introduction
Since the initial discovery of the S-phase by Zhang and Bell [
1] and Ichii et al. [
2], understanding the structural nature of this phase and the anomalous shift of the (200)/(400) diffraction peaks has been a challenging problem. The S-phase (also termed “expanded austenite”) was discovered as a result of research aimed at creating a nitrogen-enriched surface layer on stainless steels for improved wear resistance. In the mid-to-late 1990’s much of the research was centered on the investigation of low-temperature plasma nitriding methods [
3,
4,
5,
6,
7,
8,
9,
10] and the development of surface hardening methods via a combination of nitrogen implantation and diffusion. These processes generally are carried out within the temperature range of 250–400 °C; at temperatures above 400, CrN forms, depleting the matrix of Cr and reducing corrosion resistance, while below 250 °C nitrogen diffusion is too slow to form a surface layer of significant depth. Numerous studies on plasma nitriding methods for stainless steels have been reported including ion beam implantation [
3,
4,
5] and the plasma immersion implantation method [
5,
6,
7,
8,
9,
10]. Structural characterization of treated surfaces revealed the formation of the S-phase, and a significant degree of surface hardening was observed along with substantial reductions in wear rates.
In addition to plasma nitriding methods, the S-phase can be produced by sputter deposition from stainless steel targets in a nitrogen-containing atmosphere [
11,
12,
13,
14,
15,
16]. Saker et al. [
11] and Bourjot et al. [
12] reported deposition of “stainless-steel nitrogen” coatings deposited by triode reactive magnetron sputtering from 310 stainless targets. A nitrogen content of up to 42% was obtained and the S-phase was confirmed by X-ray diffraction. The microhardness was measured and the maximum was reported as 15 GPa at a nitrogen concentration of about 15%. Shedden at al. [
13] deposited coatings from 316 stainless steel using magnetron sputtering and a substrate temperature of 350 °C. They found the nitrogen content in the films increased with the proportion of N
2 in the sputtering gas, and reached a maximum of about 40%. The films had a very strong <100> fiber texture, although the fiber axis tilted away from the substrate normal at the highest N
2 flow rates. In addition, they examined the formation of energetic neutrals during sputtering and showed the yield of nitrogen energetic neutrals was much greater than that for argon. Therefore, as nitrogen content of the sputter gas increased, the burial of nitrogen within the growing films also increased, indicating enrichment with nitrogen was a primarily dynamic phenomenon.
The nitrogen content in the films described above were all sub-stoichiometric, i.e., with N/Me < 1, and contained up to 40% nitrogen. However, higher nitrogen concentrations have been obtained by increasing the percentage of N
2 in the sputtering gas during deposition. Kappaganthu and Sun [
15] deposited films from a 316L target in an Ar+N
2 mixture with nitrogen contents ranging from 0 to 75% (at a constant sputtering pressure of 0.67 Pa.) The nitrogen content in the films increased with the -percent N
2 in the gas mixture and reached a maximum of 50% film nitrogen at N
2 content of 50% and higher. For film nitrogen concentrations between 35% and 45%, the (200) peak position anomaly was observed; however, for films with 50% nitrogen the d-spacings measured were all consistent with a single lattice parameter. The MeN (Me = Fe, Cr, Ni and Mo) phase was proposed to have a zinc-blende type structure. Kappaganthu and Sun [
16] also examined the effect of substrate temperature and found that deposition at 300 °C promoted single-phase S-phase formation, but at 400 °C some CrN formation was observed.
The (200)/(400) peak position anomaly (characterized by observations where the position of the (200)/(400) peaks are inconsistent with the remaining peaks in the XRD patterns) has puzzled investigators for over 30 years, and there is still no consensus on the structural features of the S-phase that cause this peak shift. However, four main explanations have been proposed: (1) the S-phase is not a single phase but consists of multiple phases; (2) the structure is not FCC but rather (slightly) distorted into a tetragonal, monoclinic or other structure; (3) the anomaly is due to a high density of stacking faults; and (4) the anomaly results from a very large anisotropy in elastic constants. Early investigations by Marchev et al. [
17,
18] led to the claim that the S-phase has a tetragonal structure, and in fact, they re-named the structure as the “m-phase” due to its similarity to bct martensite. In this case, the X-ray diffraction patterns should show split (200)/(002) peaks. However, no such peak split was observed, but its absence was attributed to the pronounced crystallographic texture (in this case a (111) orientation) in the samples. Bacci et al. [
19] also claimed that an fct-structured S-phase provided a reasonable fit to their diffraction data, but the presence of the S-phase in the form of a compositionally-varying diffusion layer, well as iron nitride phases, complicated the analysis.
To further examine the possibilities of non-cubic structures, Fewell et al. [
20] conducted TEM and XRD studies of plasma-nitrided AISI316 steel. In addition to the traditional Bragg-Brentano XRD method, they used a second beam angle (non-zero ψ) in order to measure a set of d-spacings for the same grain orientations (relative to the surface). They found no evidence for multiple phases and noted that the diffraction data again showed only expanded (200) and (400) planes. Attempts were made to rationalize this in terms of tetragonal, monoclinic and triclinic structures. The triclinic gave the best fit to the diffraction data; however, due to the broadening of the S-phase peaks, a definitive conclusion could not be made. Fewell and Priest [
21] then examined the S-phase using synchrotron radiation, allowing them to conduct higher-order diffractometry and d-spacing measurements out to the (622) planes. They presented an extensive analysis of numerous non-cubic structures, but found that none of them worked well in matching the higher-order reflections.
Numerous investigations have pointed to stacking faults (on {111} planes of the fcc structure) or other defects as an explanation for the diffraction anomaly [
22,
23,
24]. The basis of this approach is the theoretical analysis presented by Warren [
25] who determined the effect of stacking faults on the peak positions. The peak shifts were given in terms of the stacking fault density α (1/α is the number of planes between faults) and
(hkl)-dependent constants. In most cases, the value of α is determined based on the Δ2θ calculated from the peak shift in the (200) reflection. For example, Blawert et al. [
22] found α = 0.167 for their nitrogen expanded austenite samples; Christiansen and Somers [
23] used α~0.03 to obtain results consistent with their data; and while Xu et al. [
24] did not give a specific value for α, they noted it should be dependent on nitrogen content. In order to unambiguously test the stacking fault hypothesis, it would be necessary to independently measure the stacking fault density α, and compare the calculated Δ2θ values with the observed shifts. However, this does not appear to have been done in any of the above studies, although stacking faults have been observed in several TEM studies. Xu et al. [
26] and Stroz and Psoda [
27] both examined the microstructure of plasma nitrided samples and observed stacking faults in the S-phase; the high-resolution image in the latter study showed stacking fault bundles with α~0.1. Nonetheless, they proposed the peak shift was due to a slight rhombohedral distortion in the lattice. The stacking fault explanation has been criticized in a number of papers [
26,
28] due to the fact that Warren’s model becomes inaccurate at high values of α. A more detailed analysis of stacking fault effects was carried out by Velterop et al. [
29]. However, the general effects described by Warren still hold, and for the (200) reflections only slight changes to the calculated Δ2θ values appear to be necessary. Another problem with the stacking fault theory is that for the (400) reflections the peaks should shift in the opposite direction (to higher angles). However, careful measurements, such as those made by Fewell and Priest, show a decrease in the (400) position which is similar in magnitude to the (200) shift. Therefore, the stacking fault hypothesis does not seem consistent with much of the data.
The final explanation for the diffraction anomaly is the elastic anisotropy hypothesis. Grigull and Parascandola [
30] carried out a residual stress analysis for the S-phase layer to determine the strain perpendicular and parallel to the surface. The residual stress increased dramatically with nitrogen content in the layer, and at 23% N the (compressive) stress was 2.5–3 GPa. Abrasonis et al. [
31] found the strain in (100) oriented grains (relative to the surface) to be twice that of (111)-oriented grains. However, they used elastic constants for nitrogen-free austenitic stainless steel, since the elastic constants of the S-phase are not known. Nonetheless, they suggested that the combination residual stress and stacking fault effects could explain the diffraction anomaly.
The possibility of ordering of nitrogen atoms on the interstitial sublattice has been considered and potential evidence for such ordering was recently presented by Brink et al. [
32]. The presence of such ordering would require indexing of diffraction patterns based on a larger unit cell, and this unit cell could have a distorted (non-cubic) shape. Ordering may also influence the distribution of metal atoms on the metal sublattice as shown in a recent EXAFS (Extended X-ray Absorption Fine Structure) study [
33]. Another recent study by Czerwiec et al. [
34], where Mössbauer spectroscopy was used to examine the detailed atomic structure in annealed 316L nitride samples, proposed that the structure consisted of two different environments: a one which was supersaturated with nitrogen, and another consisting of a martensitic environment without nitrogen.
In summary, the structure of the S-phase still remains controversial as none of the four hypotheses appears adequate to explain all of the observed results. A recent article by Christiansen et al. [
35] concluded that stacking faults, composition gradients and residual stress gradients provided the best explanations the observed X-ray diffraction pattern anomalies in plasma treated bulk stainless steel samples.
In this work, we analyze films sputter-deposited from 304 stainless steel targets in a nitrogen-containing atmosphere and characterize these samples using X-ray diffraction methods. The novelty of this work stems from the following observation: when the Bragg-Brentano method is employed, measured d-spacings for (111) and (200) planes are made from grains of different orientations. In this case, stress and elastic anisotropy effects can impact measured values. Ideally, measurements of both d-spacings should be made from grains of similar orientations. This was done by Fewell et al. [
20] for select orientations. However, by using area detector diffactrometry a continuous range of orientations can be examined, which will be done here. We can then compare these results with those obtained using the Bragg-Bretano method. In addition, the possibility of a tetragonal-based structure will be examined.
In addition to insight gained from the use of area-detector diffractometry, the use of sputter-deposited samples deposited with variations in temperature and bias allow further understanding into the effects of composition and defect content on the structure of the S-phase [
36]. For this purpose, samples will first be characterized using the Bragg-Bretano method, where the extent of the diffraction anomaly will be evaluated using the following term:
where θ
111 and θ
200 are the peak positions obtained (by definition) from an X-ray diffraction scan carried out using the standard Bragg-Bretano configuration, i.e., with ψ = 0. The normal value of
RB for an FCC structure is 0.75, and a value of
RB > 0.75 indicates that the sample has the S-phase structure.
Following this analysis we will consider the S-phase structure as nominally FCC (rocksalt structure) with a slight deviation along one cube direction resulting in a tetragonal structure. The assumption of tetragonality is taken to allow the parameter
c/a to be calculated based on the equation presented by Fewell and Priest [
21], given by:
Alternatively, this equation can be written in terms of d-spacings:
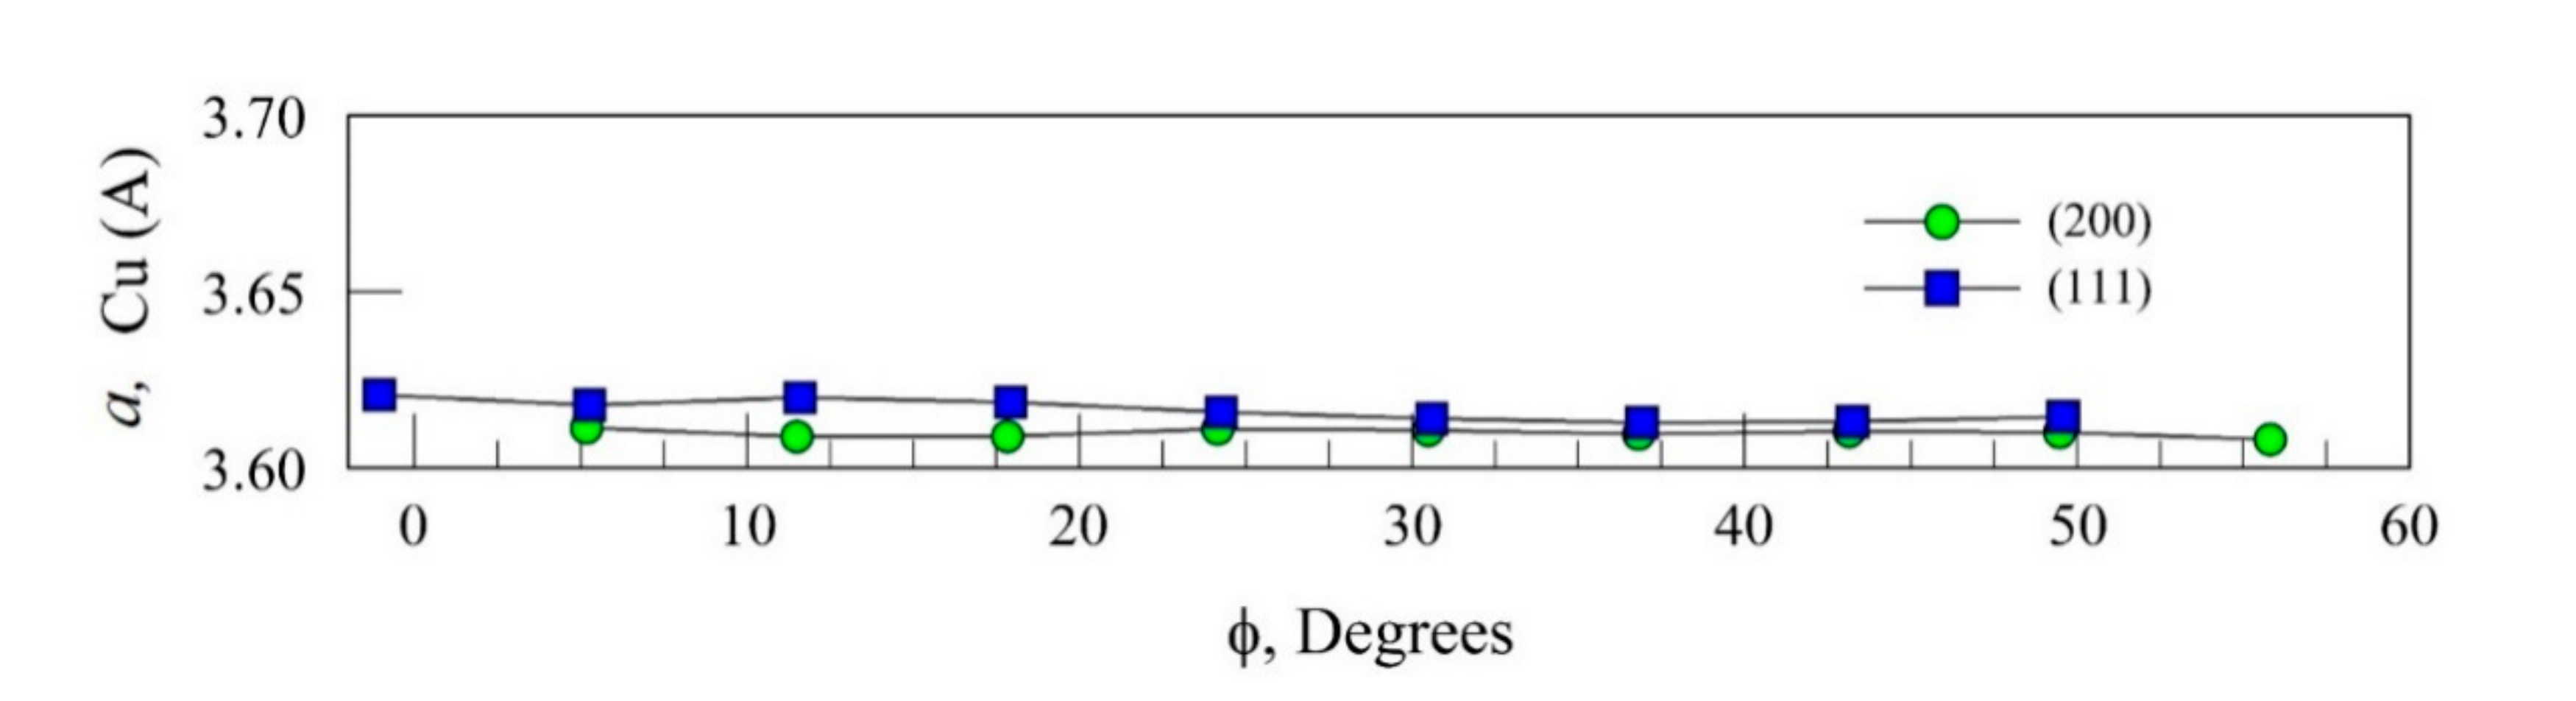
Which is more amenable to direct calculation from X-ray diffraction data and makes no presumptions about the relationships between ahkl and dhkl values. Here we have assumed that the c-axis corresponds to the [001] direction and c/a > 1. Using this equation, measurements of the (111) and (002) peak positions allow for determination of the c/a ratio. This will be done using d200 and d111 values from the same grain, or grains of the same orientation.
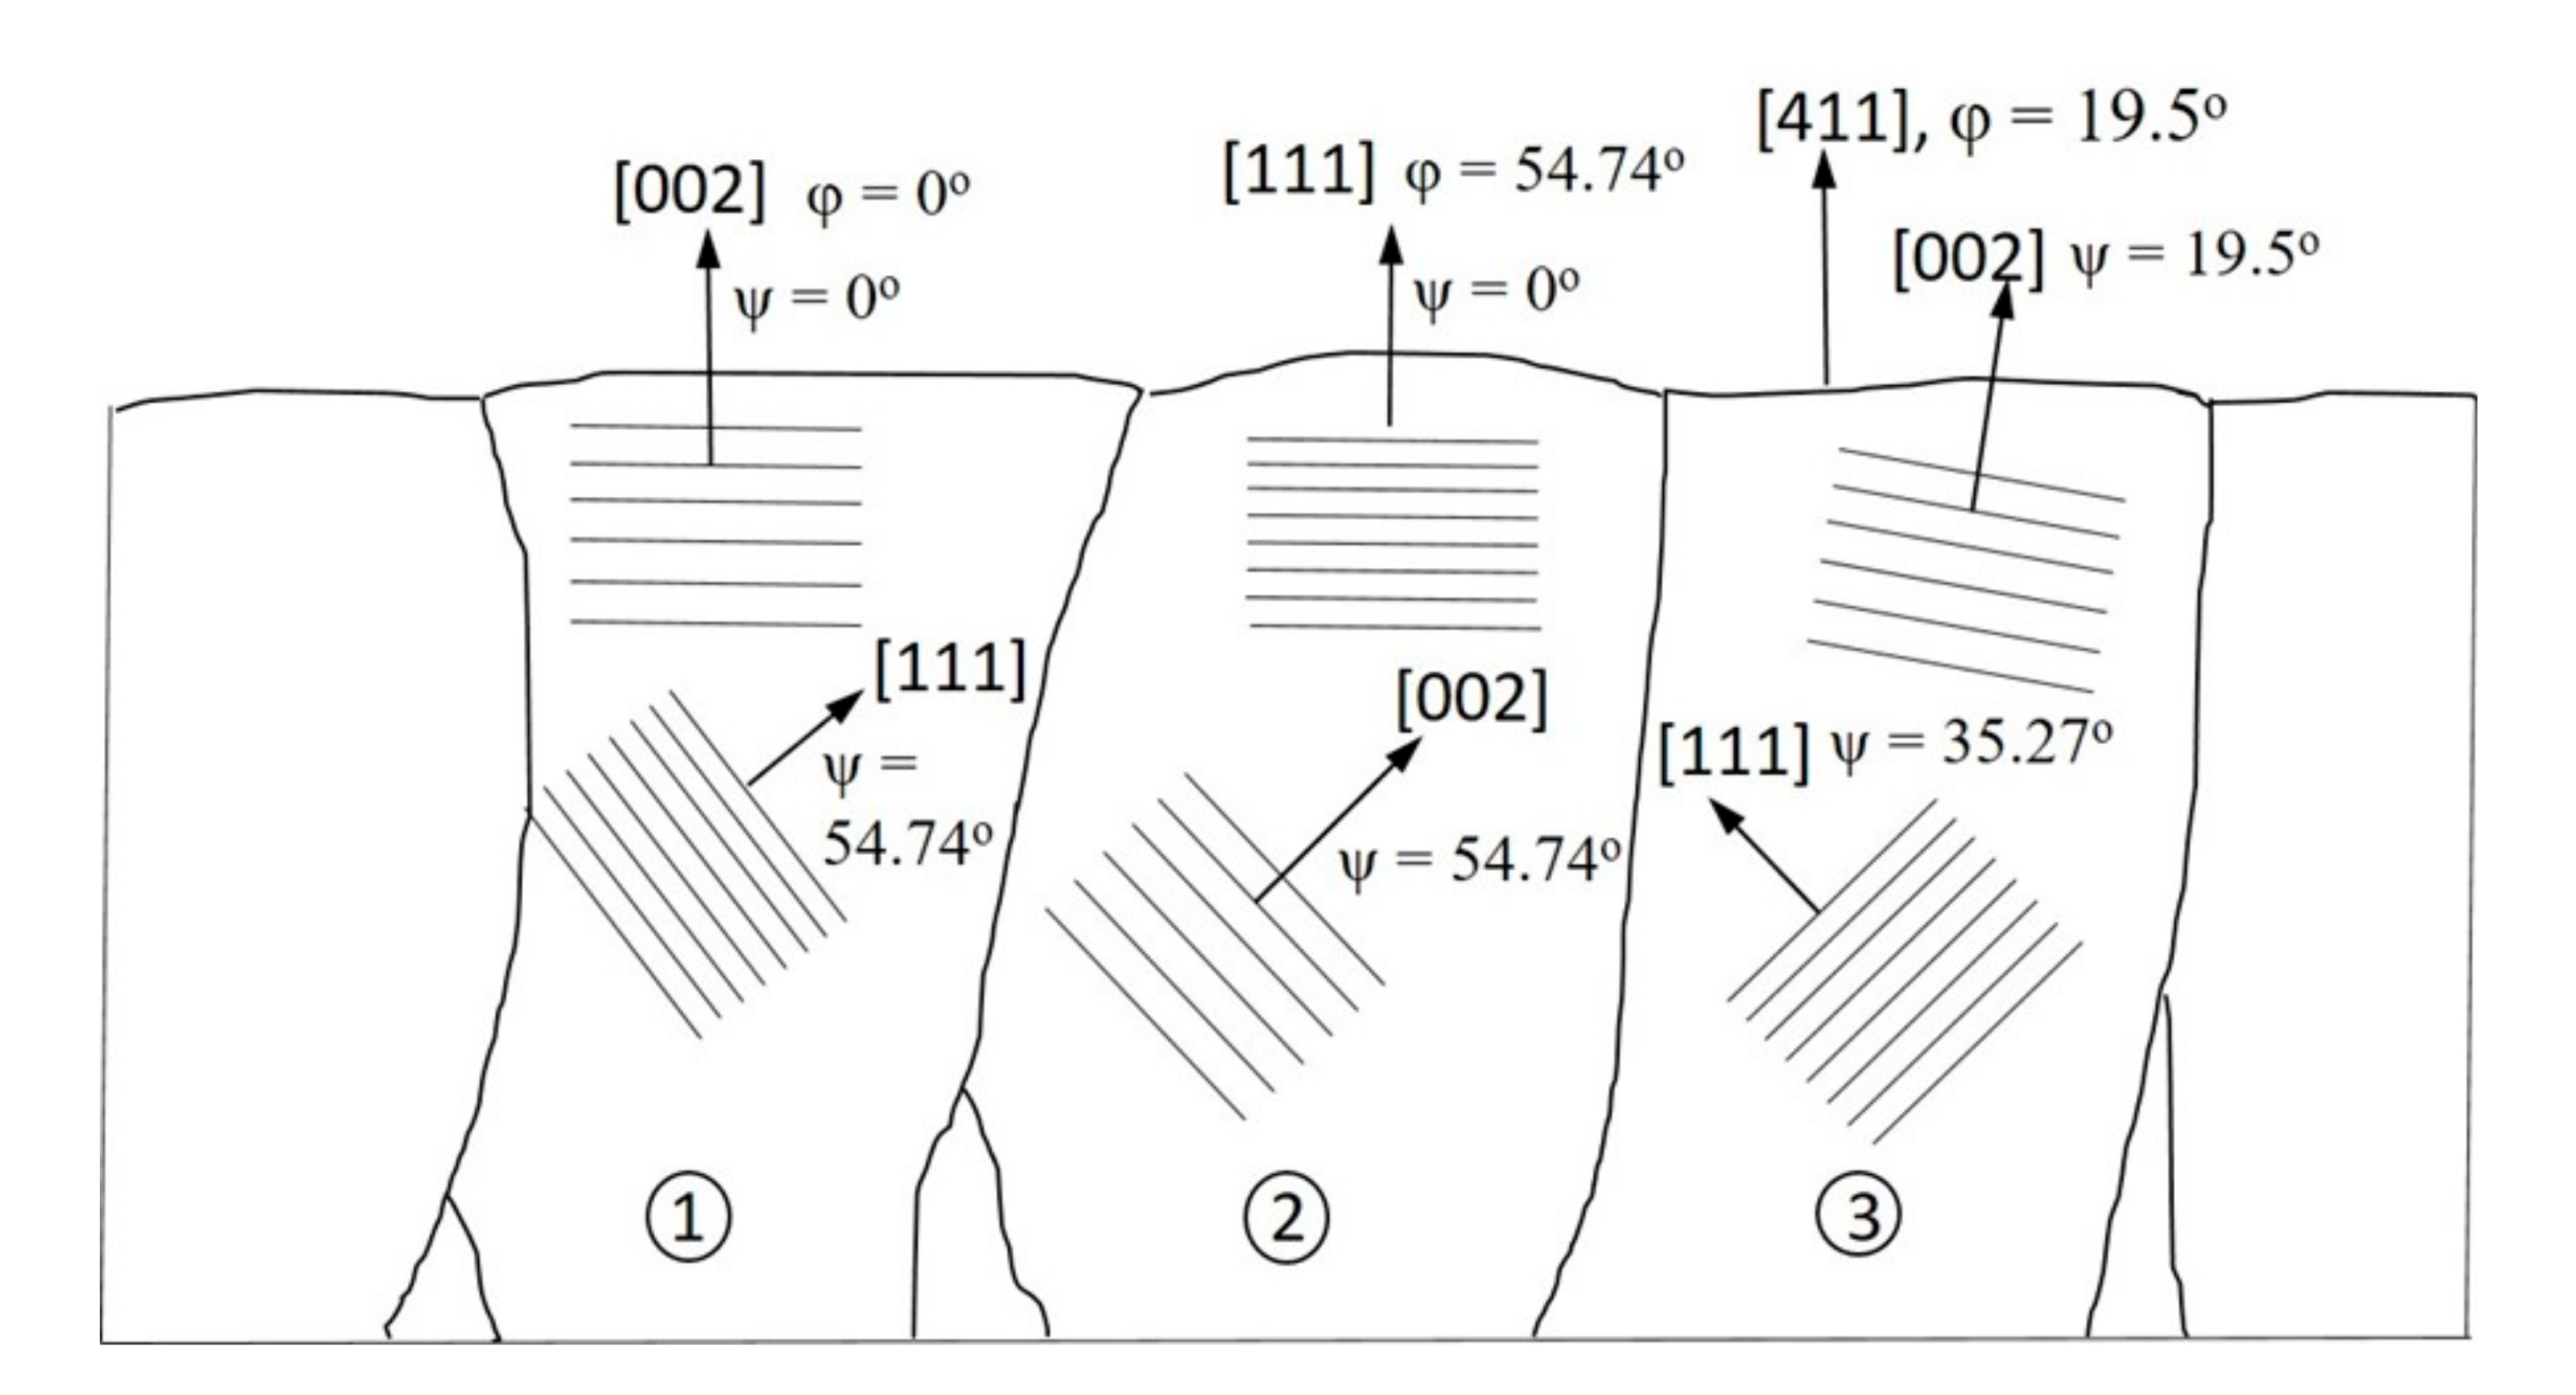
The method devised for this purpose is illustrated in
Figure 1, which shows a schematic diagram of a cross-section of a film with a typical columnar structure. We assume a fiber texture for the grain structure, and define the variable φ as the angle of tilt of the [001] direction away from the nominal surface normal (substrate plane). Three cases are shown in the diagram. For grain 1, the grain orientation is [002] so that φ = 0°. The value of
d002 for this grain can be determined by conducting an XRD scan with ψ = 0. However, to determine
d111 the scan needs to be run with ψ = 54.74°. For grain 2, φ = 54.74° but the value of
d111 is determined with ψ = 0°, and to find
d002 we set ψ = 54.74°. For grain 3, we examine an intermediate orientation, in this case a grain with a [411] orientation. This gives φ = 19.5°, necessitating the use of ψ = 19.5° to find
d002 and ψ = 35.27° to find
d111.
In general, we can write:
For d002: φ = ψ
For d111: φ = 54.74 − ψ
Therefore, if we can find d as a function ψ for the (111) and (200) reflections, the above equations can be used to find dhkl vs. φ and then determine c/a using Equation (3). Using this procedure, we find c/a as a function of φ. If there is no elastic anisotropy present, or in the absence of stress, c/a should be constant with φ.
4. Discussion
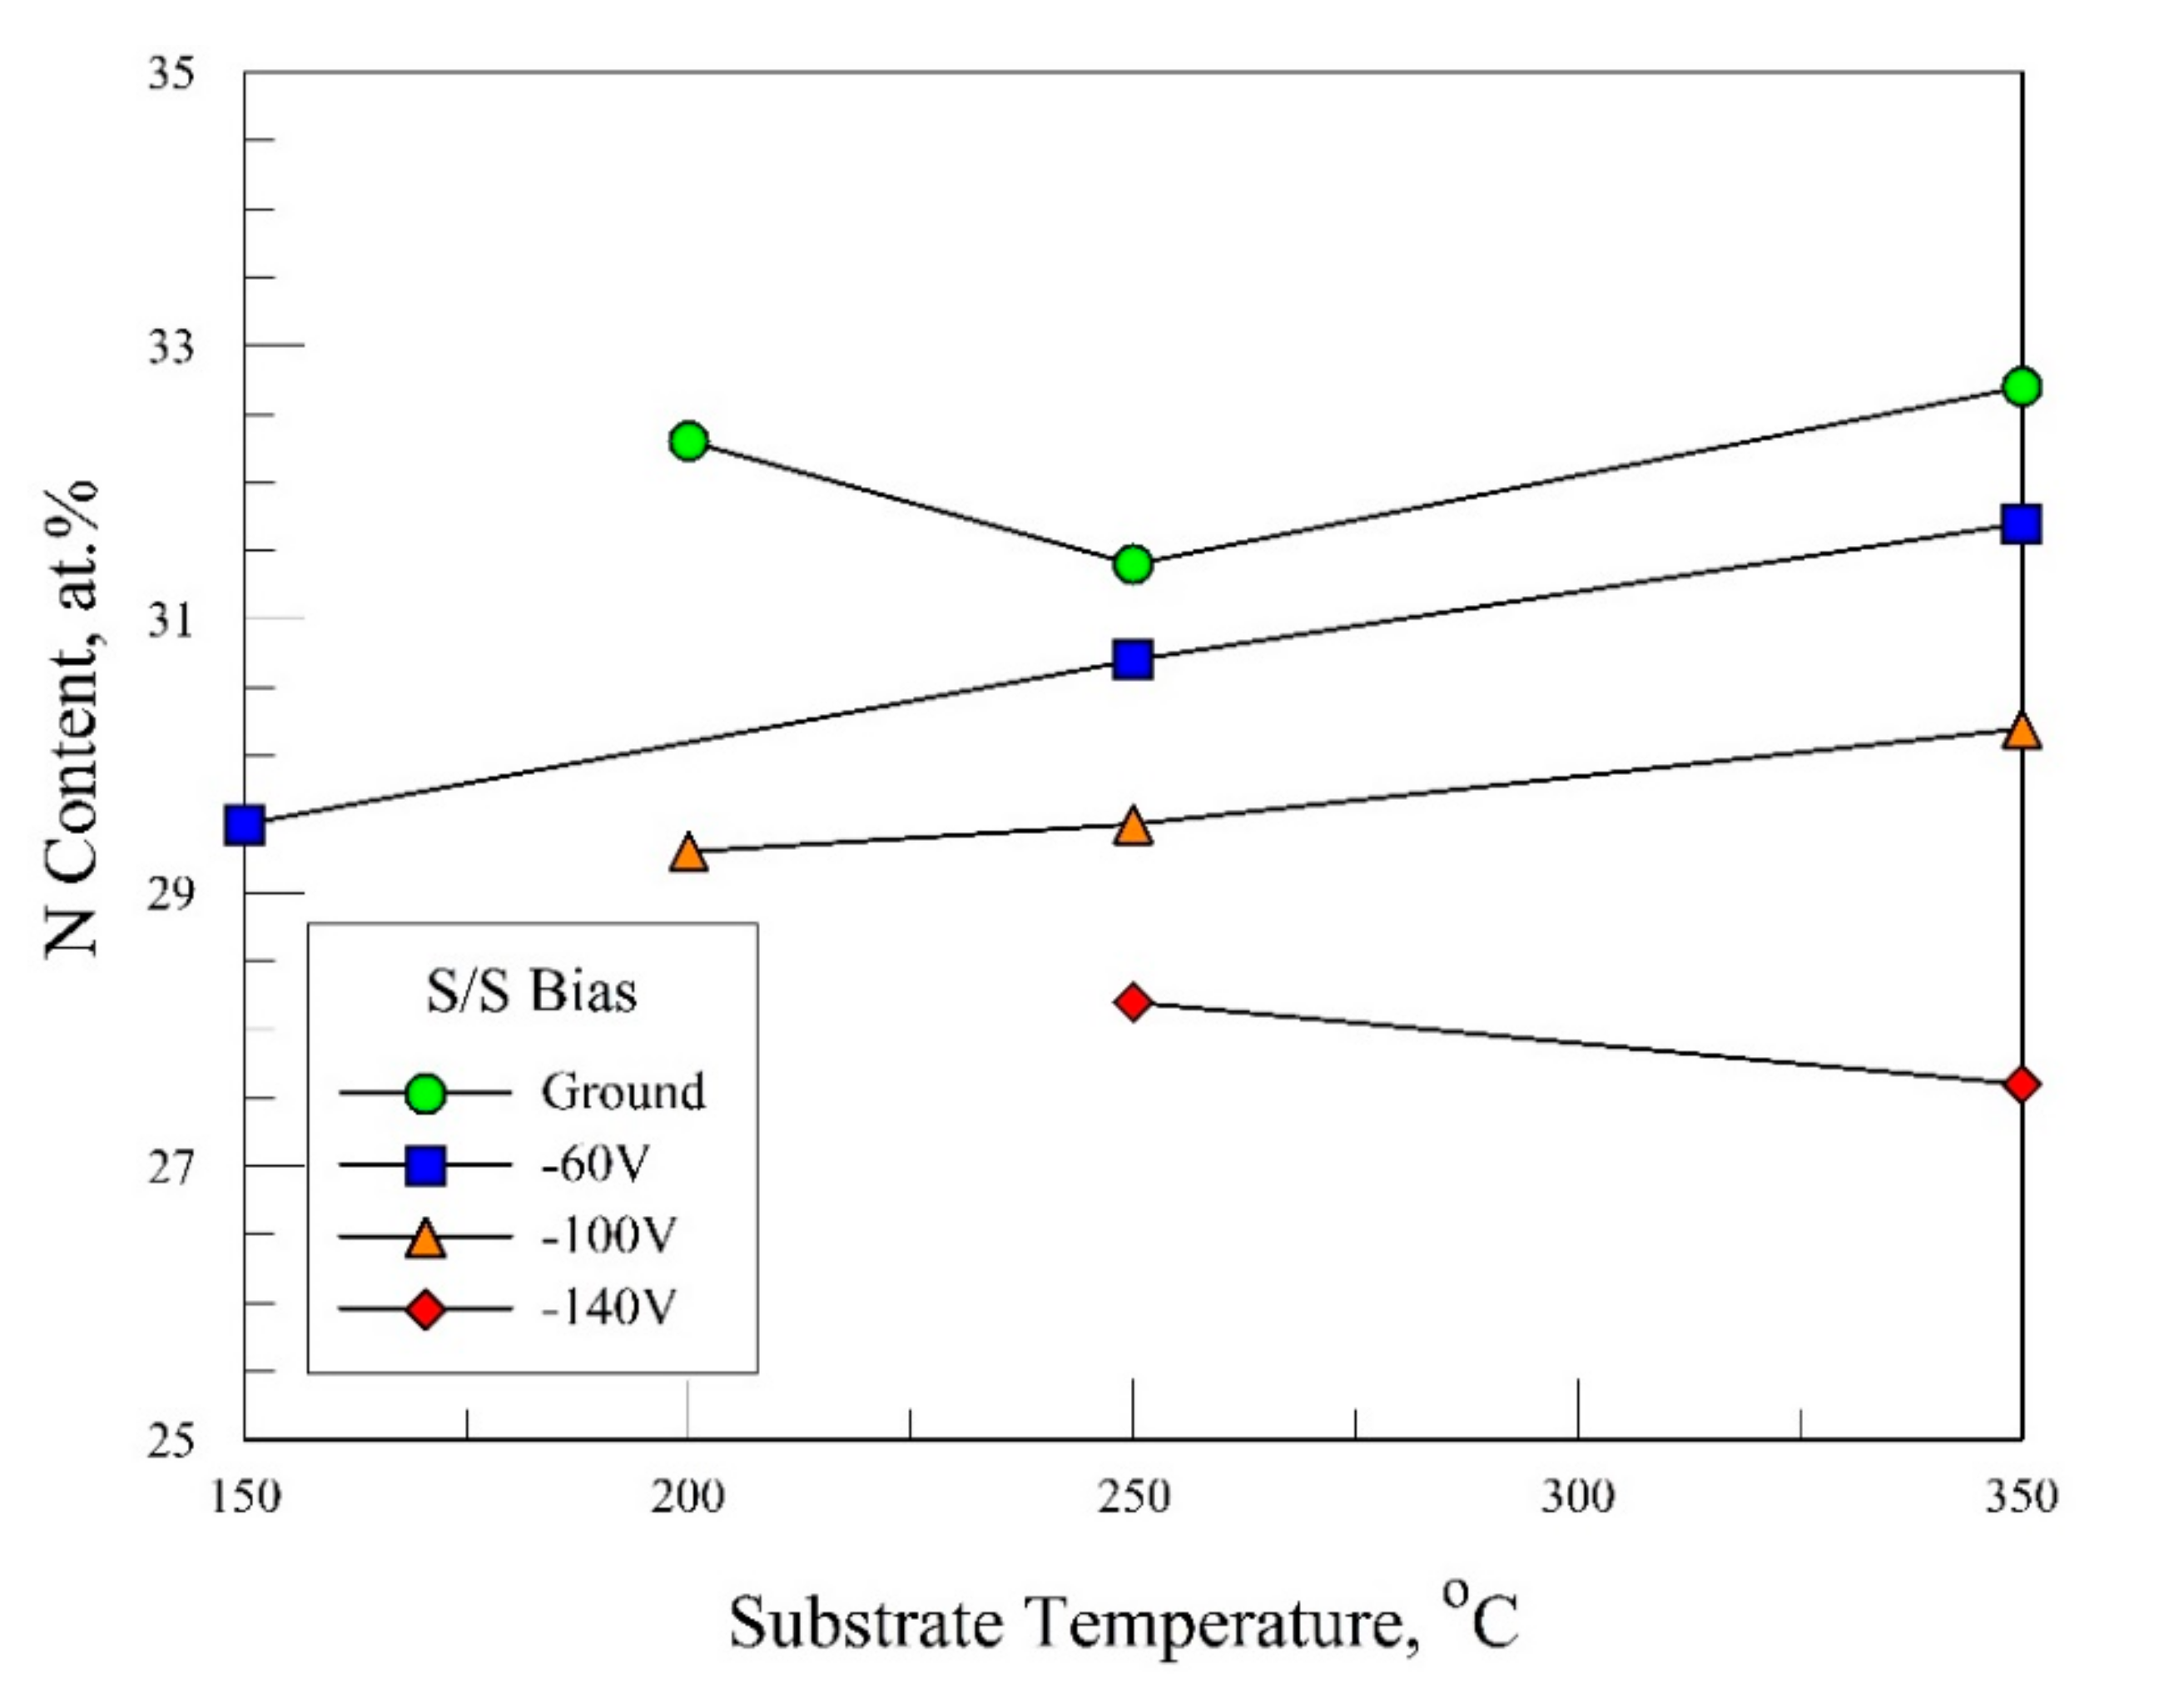
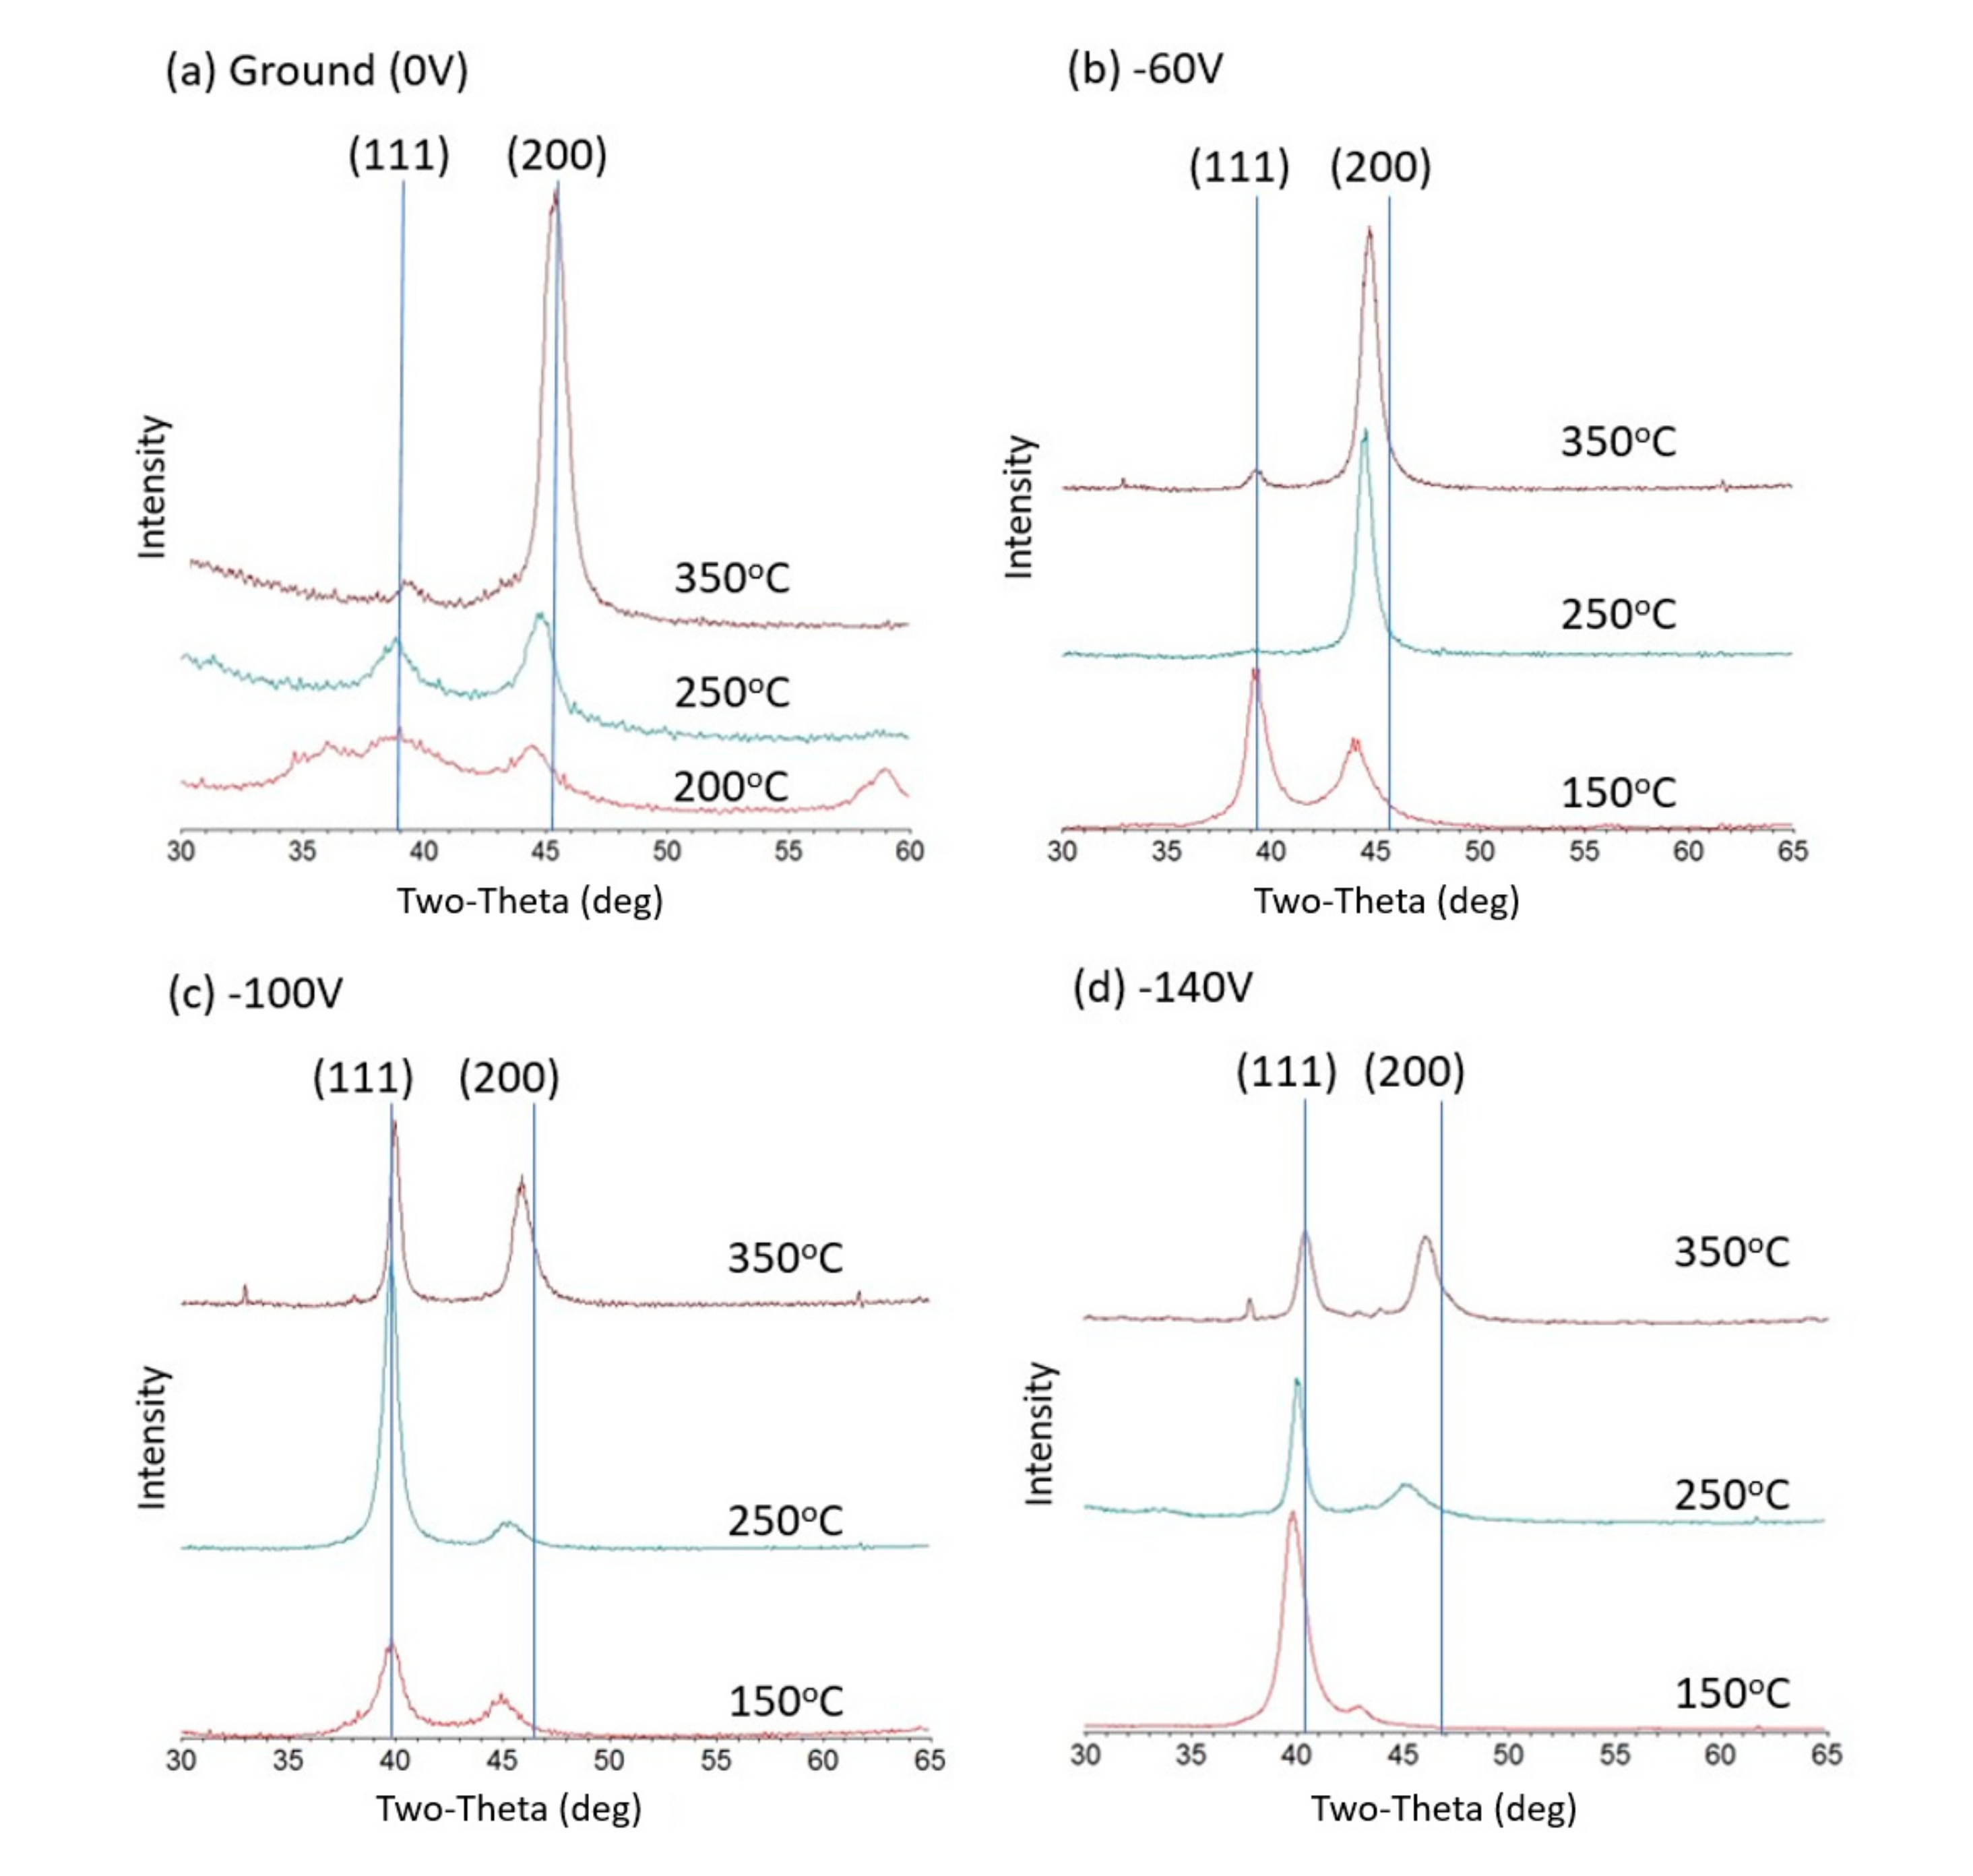
In this study the nature of the well-known diffraction anomaly observed in samples of expanded austenite or the S-phase in nitrogen supersaturated stainless steels has been studied in sputter-deposited thin films. The use of this thin film deposition technique allows us to examine the effects of variations in the substrate temperature and bias, and films can be deposited at temperatures lower than those typically used in plasma nitriding of bulk samples. Also, in contrast to most plasma-nitriding methods, sputter deposition results in compositionally uniform samples, and therefore simplifies the analysis of X-ray diffraction data.
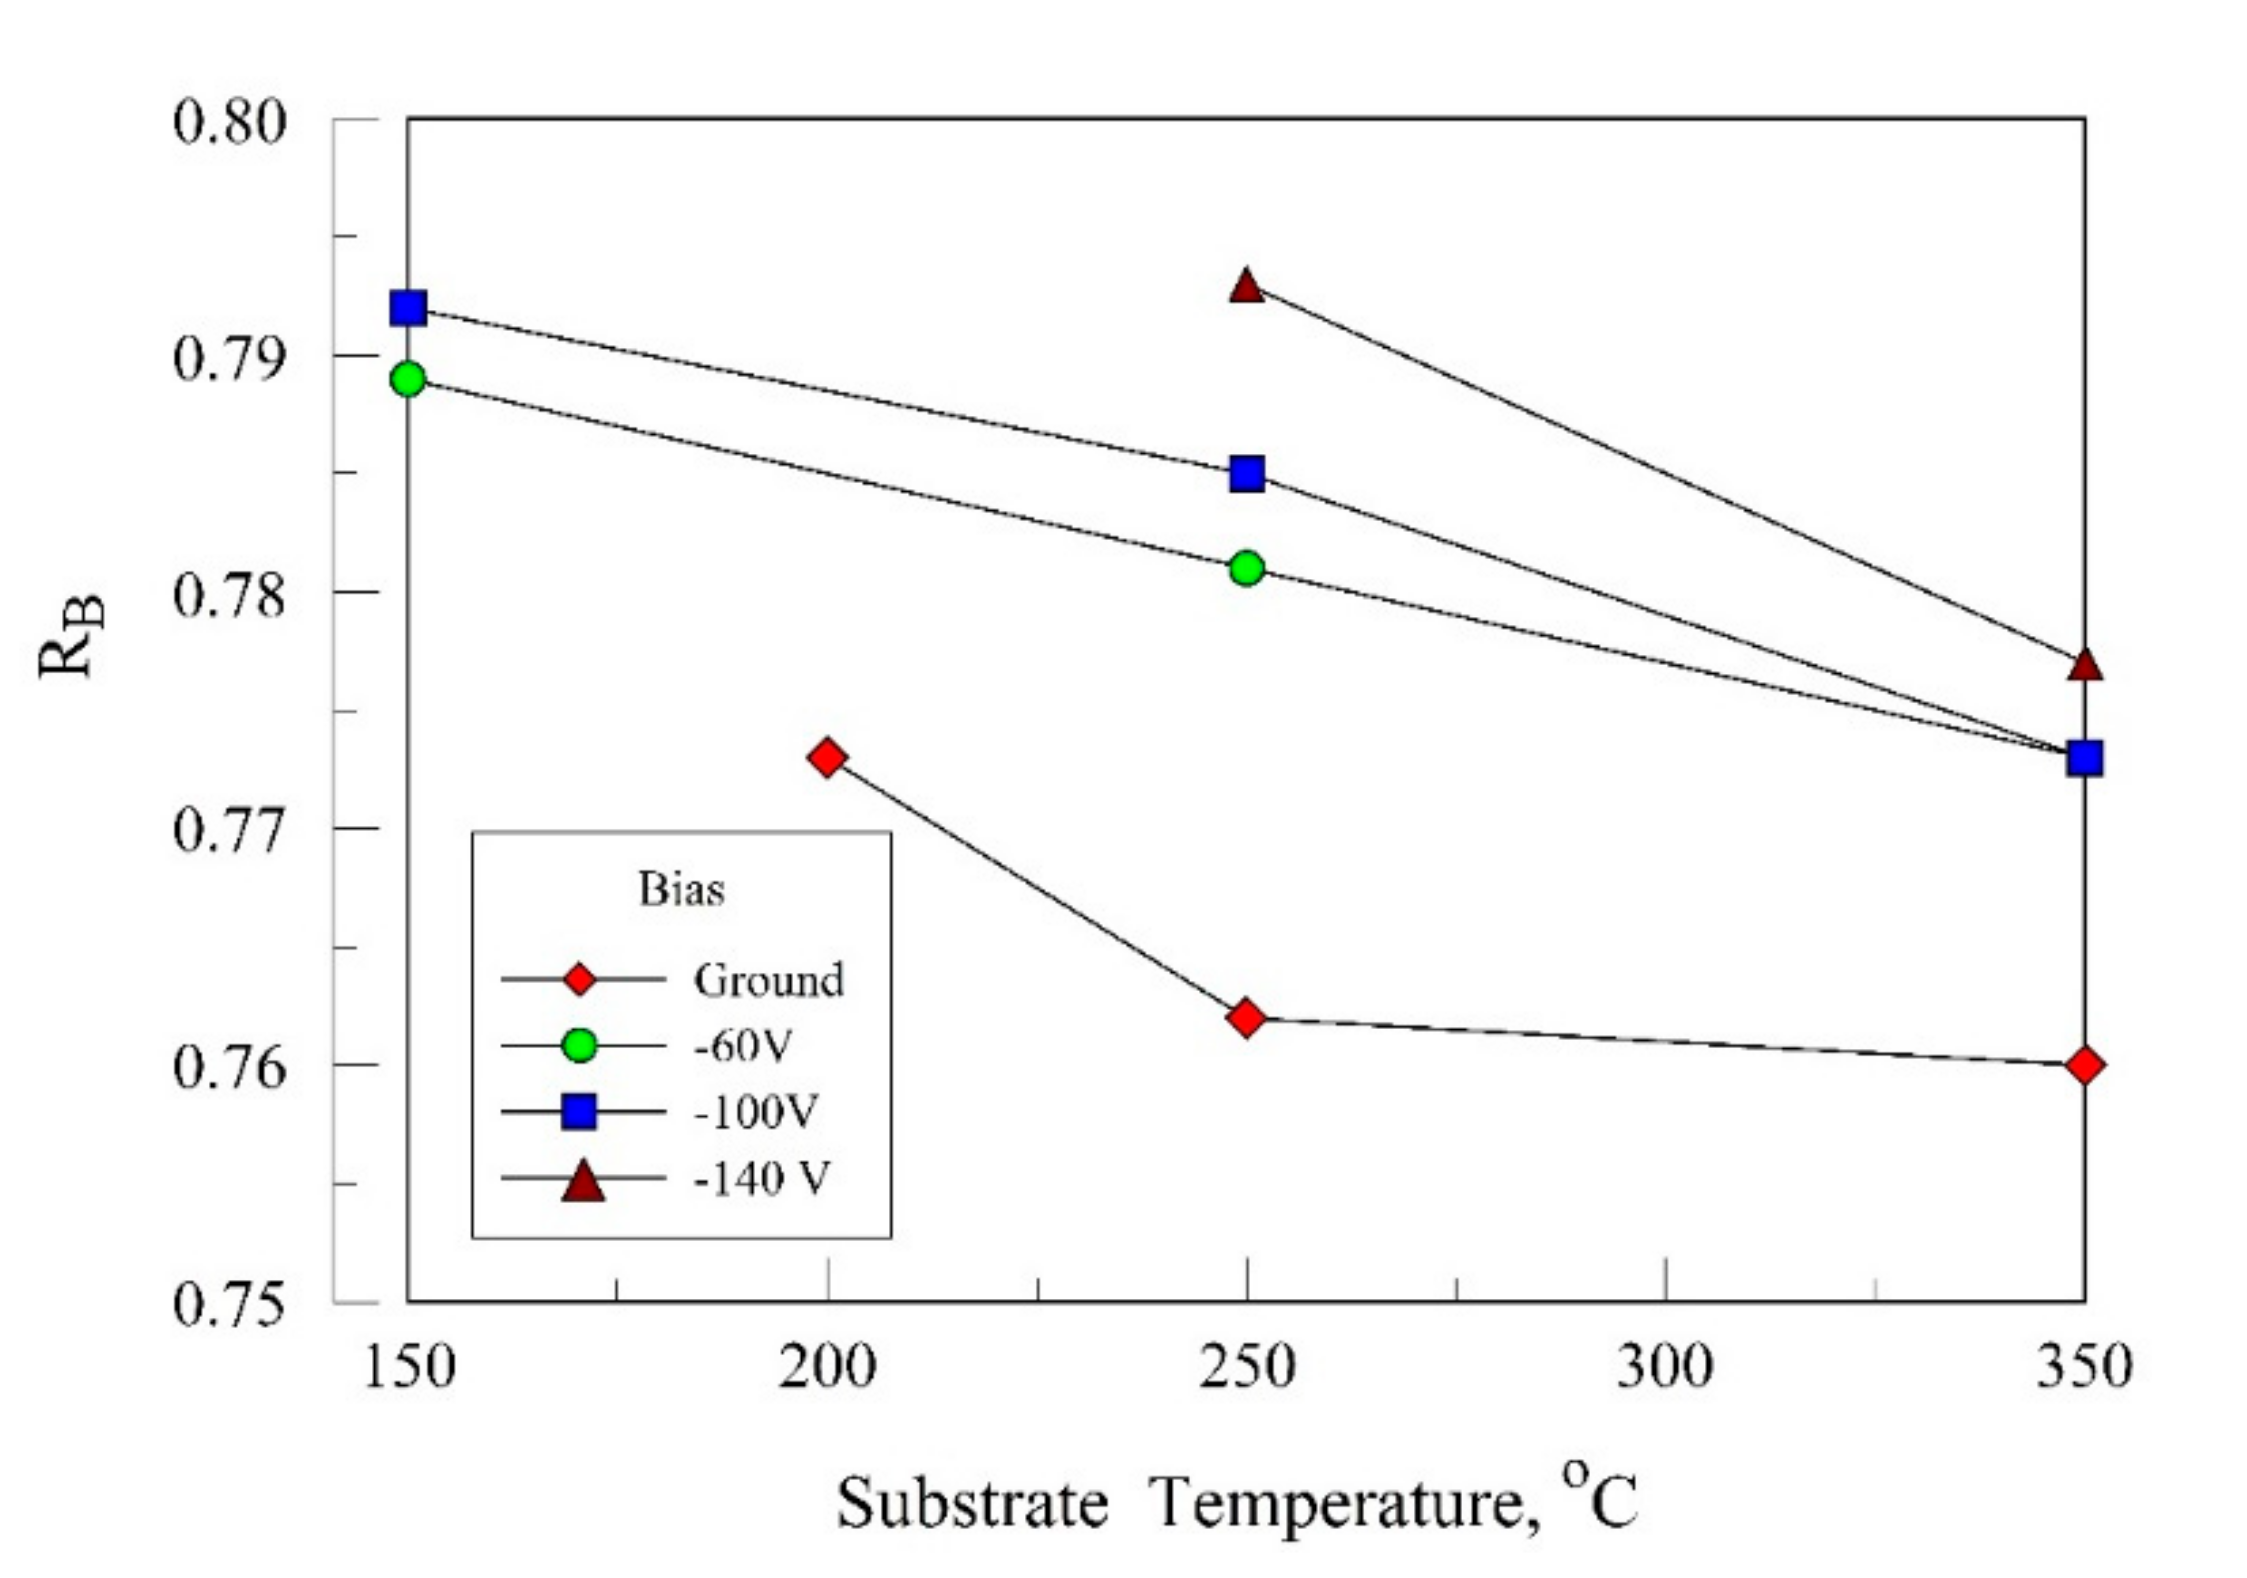
The extent of the diffraction anomaly was first characterized by calculating “
RB-values” from standard Bragg-Bretano X-ray diffraction patterns, with
RB = 0.75 indicating a normal cubic lattice. As shown in
Figure 4 and
Figure 5, the
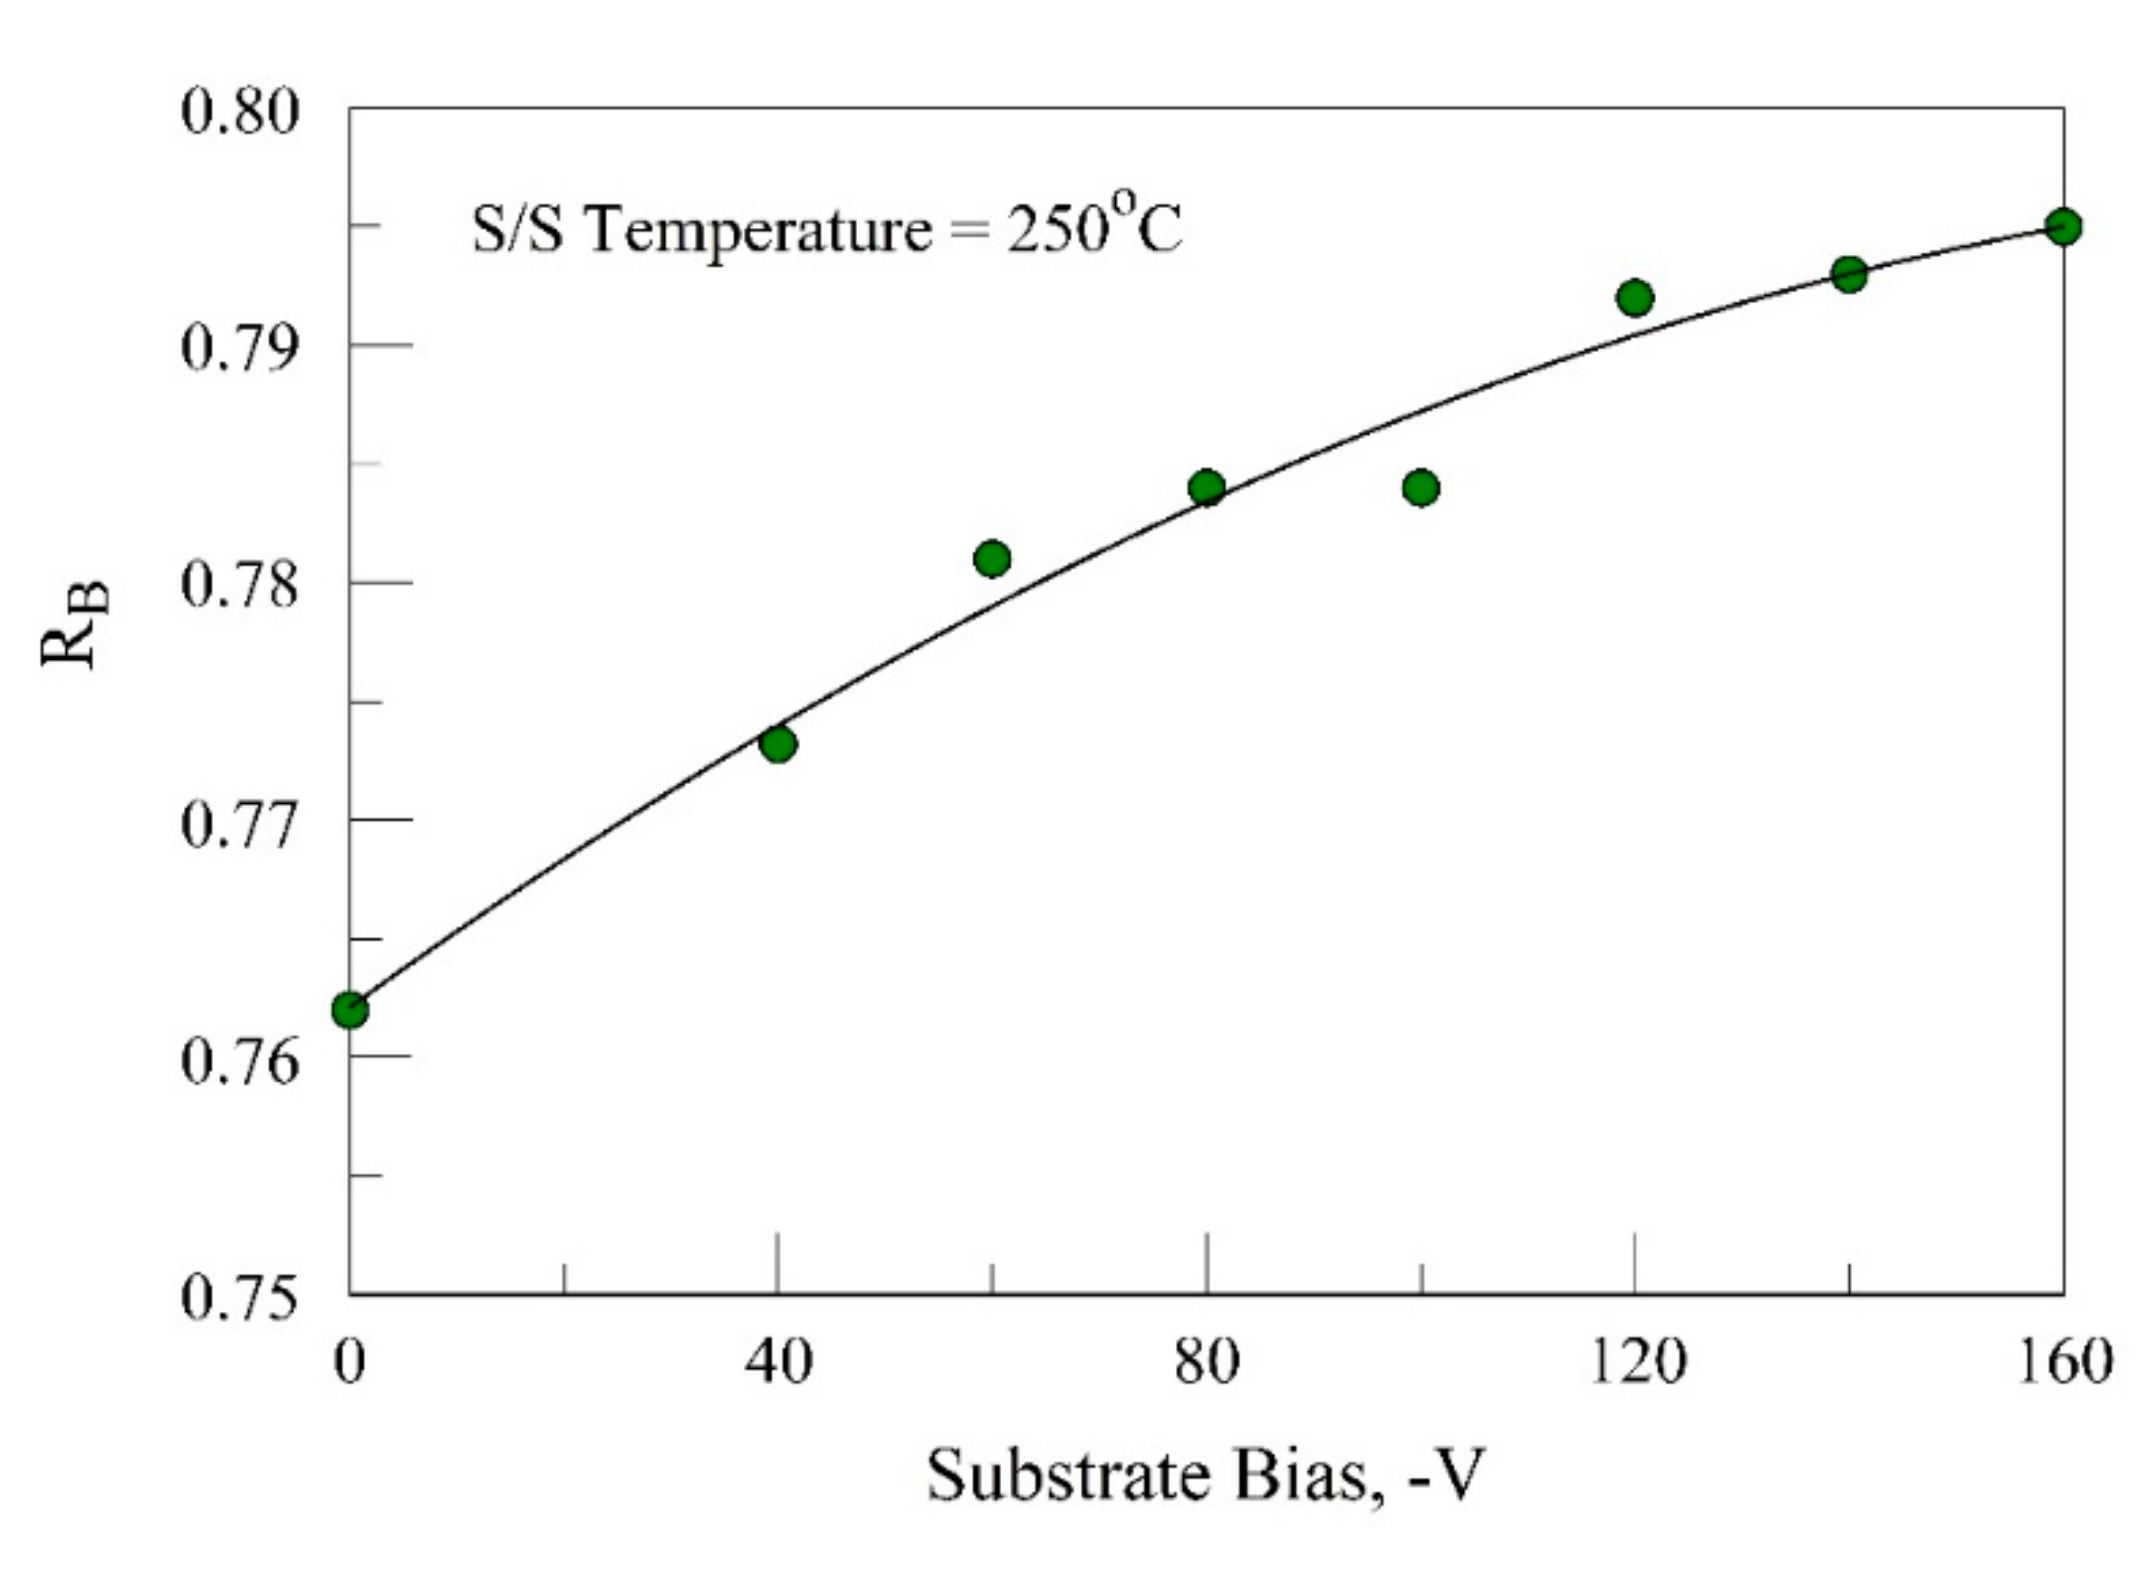
RB-values increased with substrate bias and decreased with increasing temperature. These results can be considered in parallel with the nitrogen content in the films (
Figure 2), which decreases with substrate bias but where only a small temperature effect is observed. The increase in
RB with bias, as well as the decrease in nitrogen content indicates that less N in the lattice increases the diffraction anomaly. Kappaganthu and Sun [
15] deposited similar films by reactive sputtering using a range of nitrogen gas concentrations and obtained
RB-values (as calculated based on their data) similar to those reported here, but also obtained stoichiometric films which had
RB-values of 0.75. These results support the conclusion that the extent of the diffraction anomaly is proportional to the deficiency of nitrogen in the lattice. However, the results shown in
Figure 4 also show a trend of decreasing
RB with increasing temperature in samples that had a relatively constant N content. It is well established, via the zone model, that higher deposition temperatures increases the film density and grain size while reducing film defects such as intergranular voids, faceted columns, and feather-like structures [
37]. However, the presence of such defects is not known to produce a diffraction anomaly. In addition, the results shown in
Figure 4 appear to suggest contradictory evidence for this hypothesis:
RB decreases with increasing substrate deposition temperature, which should help densify films, but increases with bias, which also increases film density. The possibility of peak shifts due to stacking fault defects, as discussed in the Introduction, may explain the temperature effect but detailed microscopic examinations of our samples will be needed to verify this.
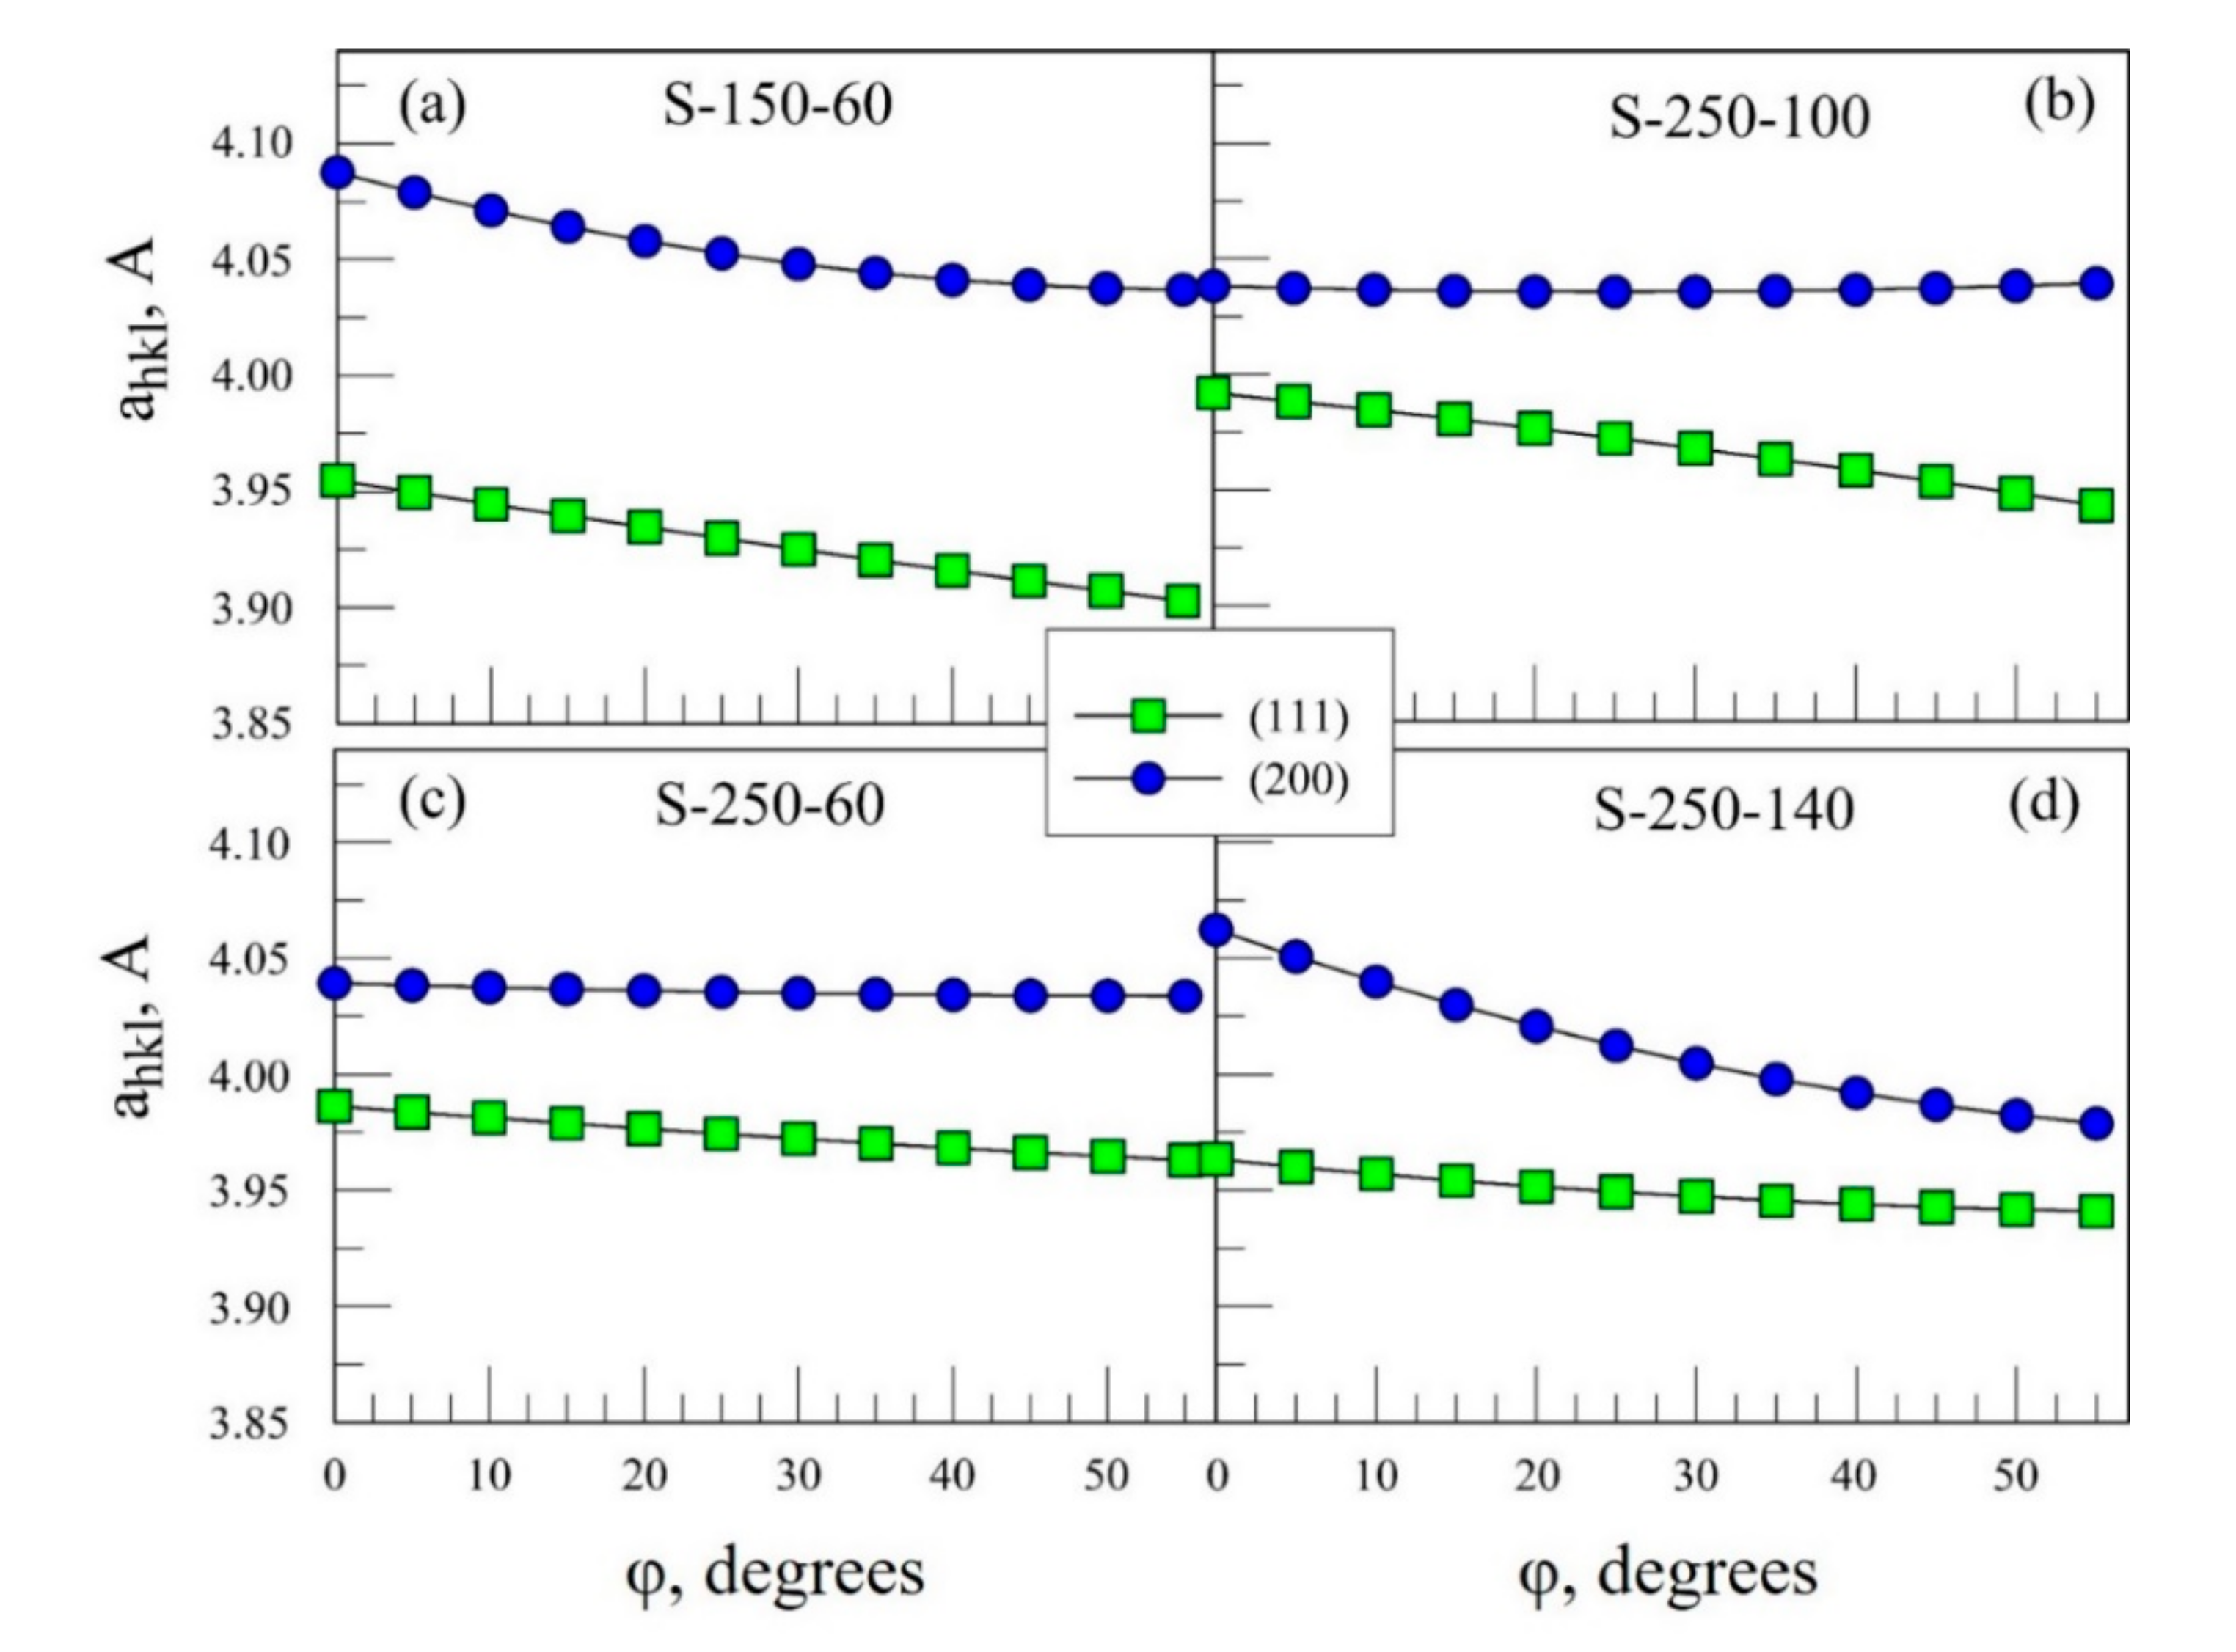
One explanation for the diffraction anomaly is that (002) and (111)-oriented grains have different nitrogen concentrations, and therefore different lattice constants; when measured using the Bragg-Brentano method each peak would represent different grains. Therefore, it is important to obtain the (111) and (002) interplanar spacings form similarly-oriented grains. This was done here using the area detector diffraction method, where interplanar spacings from planes oriented away from the substrate surface orientation could be measured. This allowed the interplanar spacings of (111) and (002) planes to be measured for grains of similar orientations. The results were first analyzed assuming a cubic structure, as shown in
Figure 6. As expected, the
a111 and
a200 had different values over the range of φ values. Generally, these
ahkl either decreased or remained constant with φ but were still significantly different over the range of φ. Physically, this means that measured
a111 and
a200 values were truly different within a single grain and not due to the fact that each was measure from grains of different orientations.
The variations of
ahkl with φ observed in
Figure 6 can be considered as possible effects of residual stress. We first consider the (002) planes parallel to the substrate normal, as shown in grain 1 in
Figure 1. For a compressive (in-plane) residual stress, these planes would have a higher value of
a002 compared to the unstressed state. For (002) planes tilted away from the substrate normal (increasing φ), as shown in grain 2, the value of
a002 will decrease. This is observed for
Figure 6a,d (the curves in
Figure 6b,c suggest little or no stress is present in these cases). For the (111) planes, the φ = 0 case refers to the tilted case (as shown in grain 1) and as φ increases the (111) planes become increasingly parallel to the surface. Therefore, when plotting the data as
a vs. φ, the
a111 values should increase with increasing φ (for a compressive stress). This is contrary to the data shown in
Figure 6, where
a111 is always decreasing. Therefore, while residual stress may impact the curves, it alone cannot explain the data shown in
Figure 6.
Next, the possibility of explaining the peak shift using a tetragonal structure was explored. Using Equation (3), the
c/
a values were calculated as shown in
Figure 7. The values were all greater than one, however, no consistent trend was observed when examining the φ-dependence. In fact, results ranged from being relatively constant to increasing to decreasing. However, calculation of relative unit cell volume (
Figure 8) did show a consistently decreasing value with φ although with varying magnitudes. This is consistent with the observation that the diffusion of N is highest for (002) oriented grains, giving these grains a higher N concentration and larger lattice constant. Even without the tetragonal lattice assumption (as observed in the data in
Figure 6), the largest lattice constants are generally found in the [002]-oriented grains.
The tetragonal model can also be used to calculate the location of the additional peaks that should be observed, and
Table 1 shows calculations of the expected peak split for the (002)/(200) reflections. However, no additional peaks were observed. Despite the fact that the d-spacings from the (111) and (002) peaks are inconsistent with the cubic structure, no evidence for a non-cubic structure could be found. This suggests that the anomaly is related to defects created by sub-stoichiometric N content, which is supported by the decreasing
RB values with increasing substrate temperature.


