Characterisation Method of the Passivation Mechanisms during the pre-discharge Stage of Plasma Electrolytic Oxidation Indicating the Mode of Action of Fluorides in PEO of Magnesium


Abstract
1. Introduction
1.1. Plasma Electrolytic Oxidation
1.2. Experimental Investigation of Passivation
1.3. Electrolyte Constituents
2. Experimental Procedure
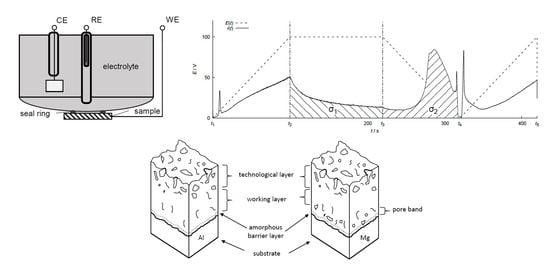
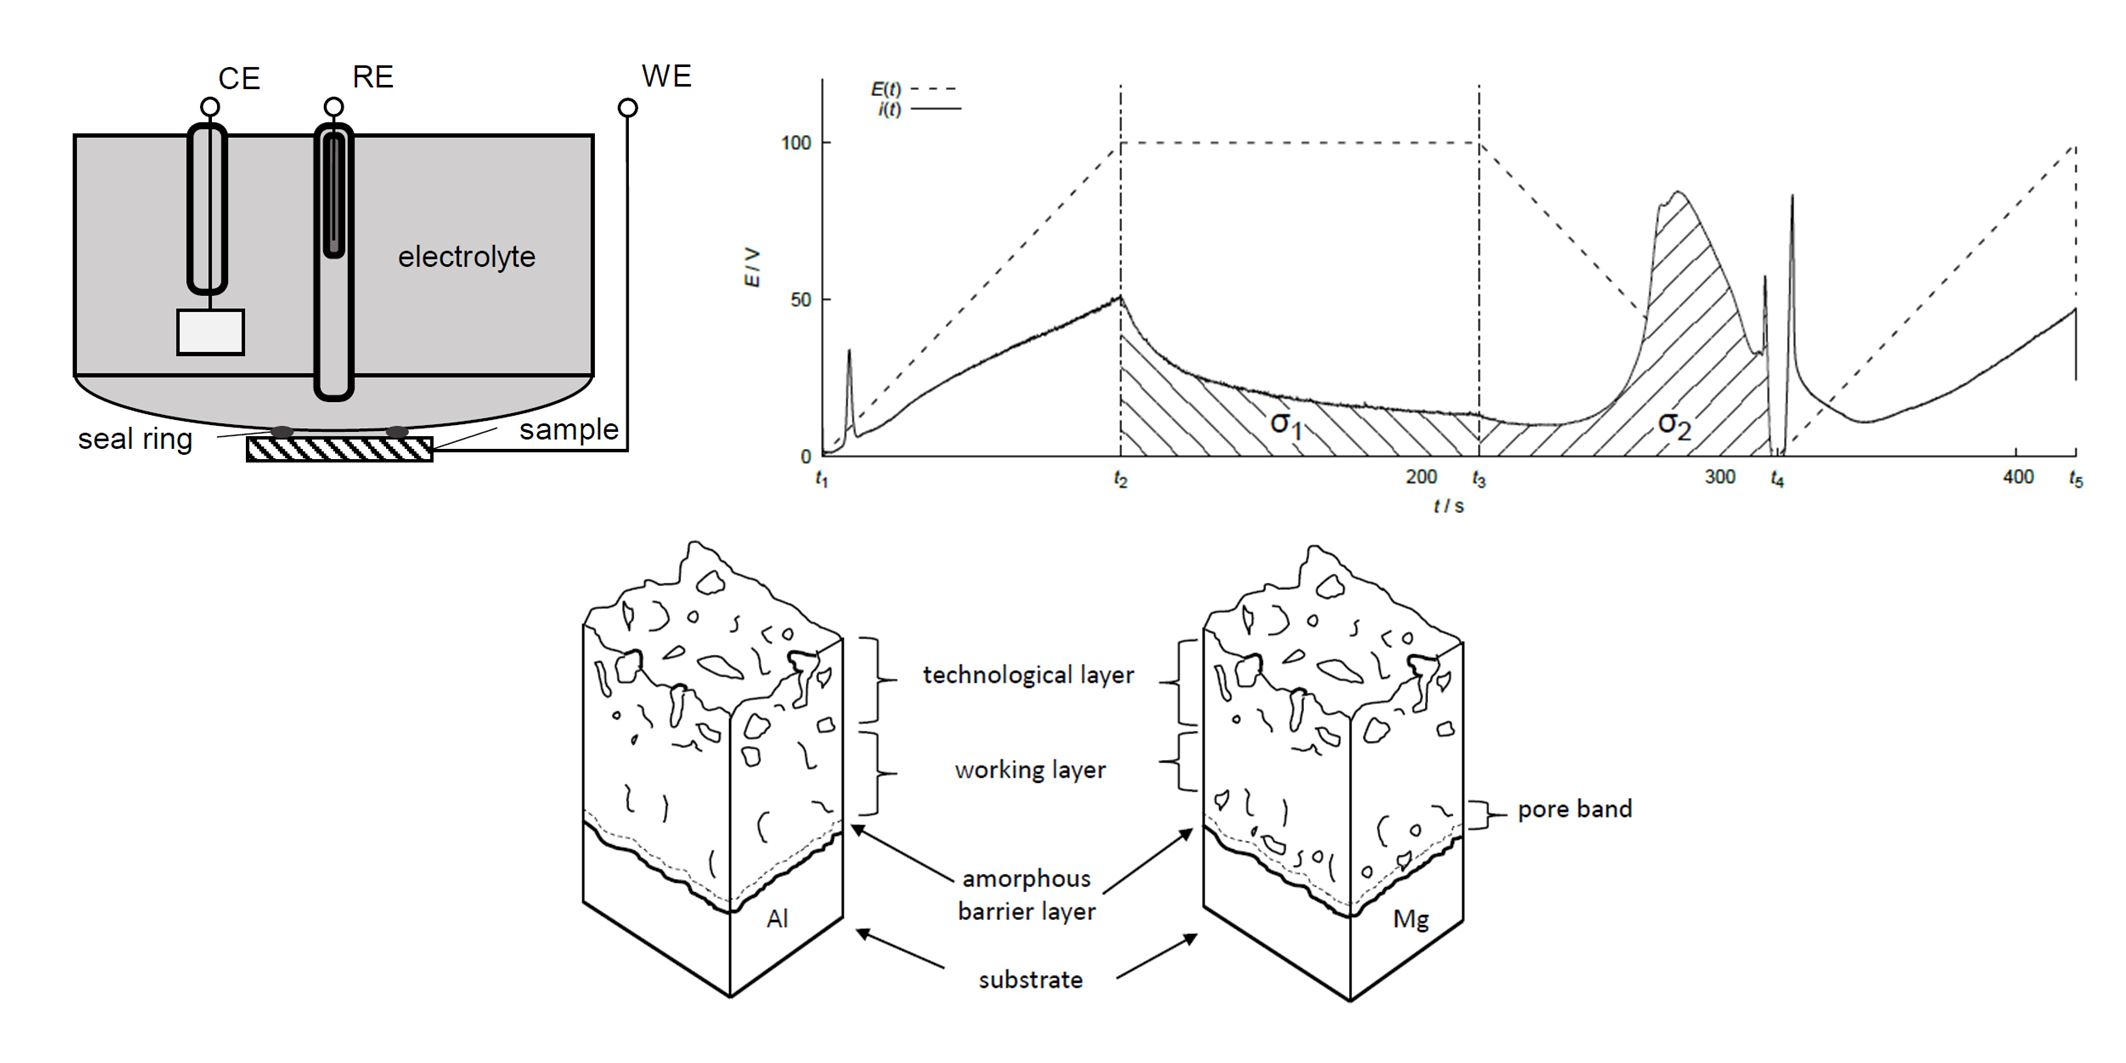
2.1. Setup, Methods, and Materials
2.2. Test Series
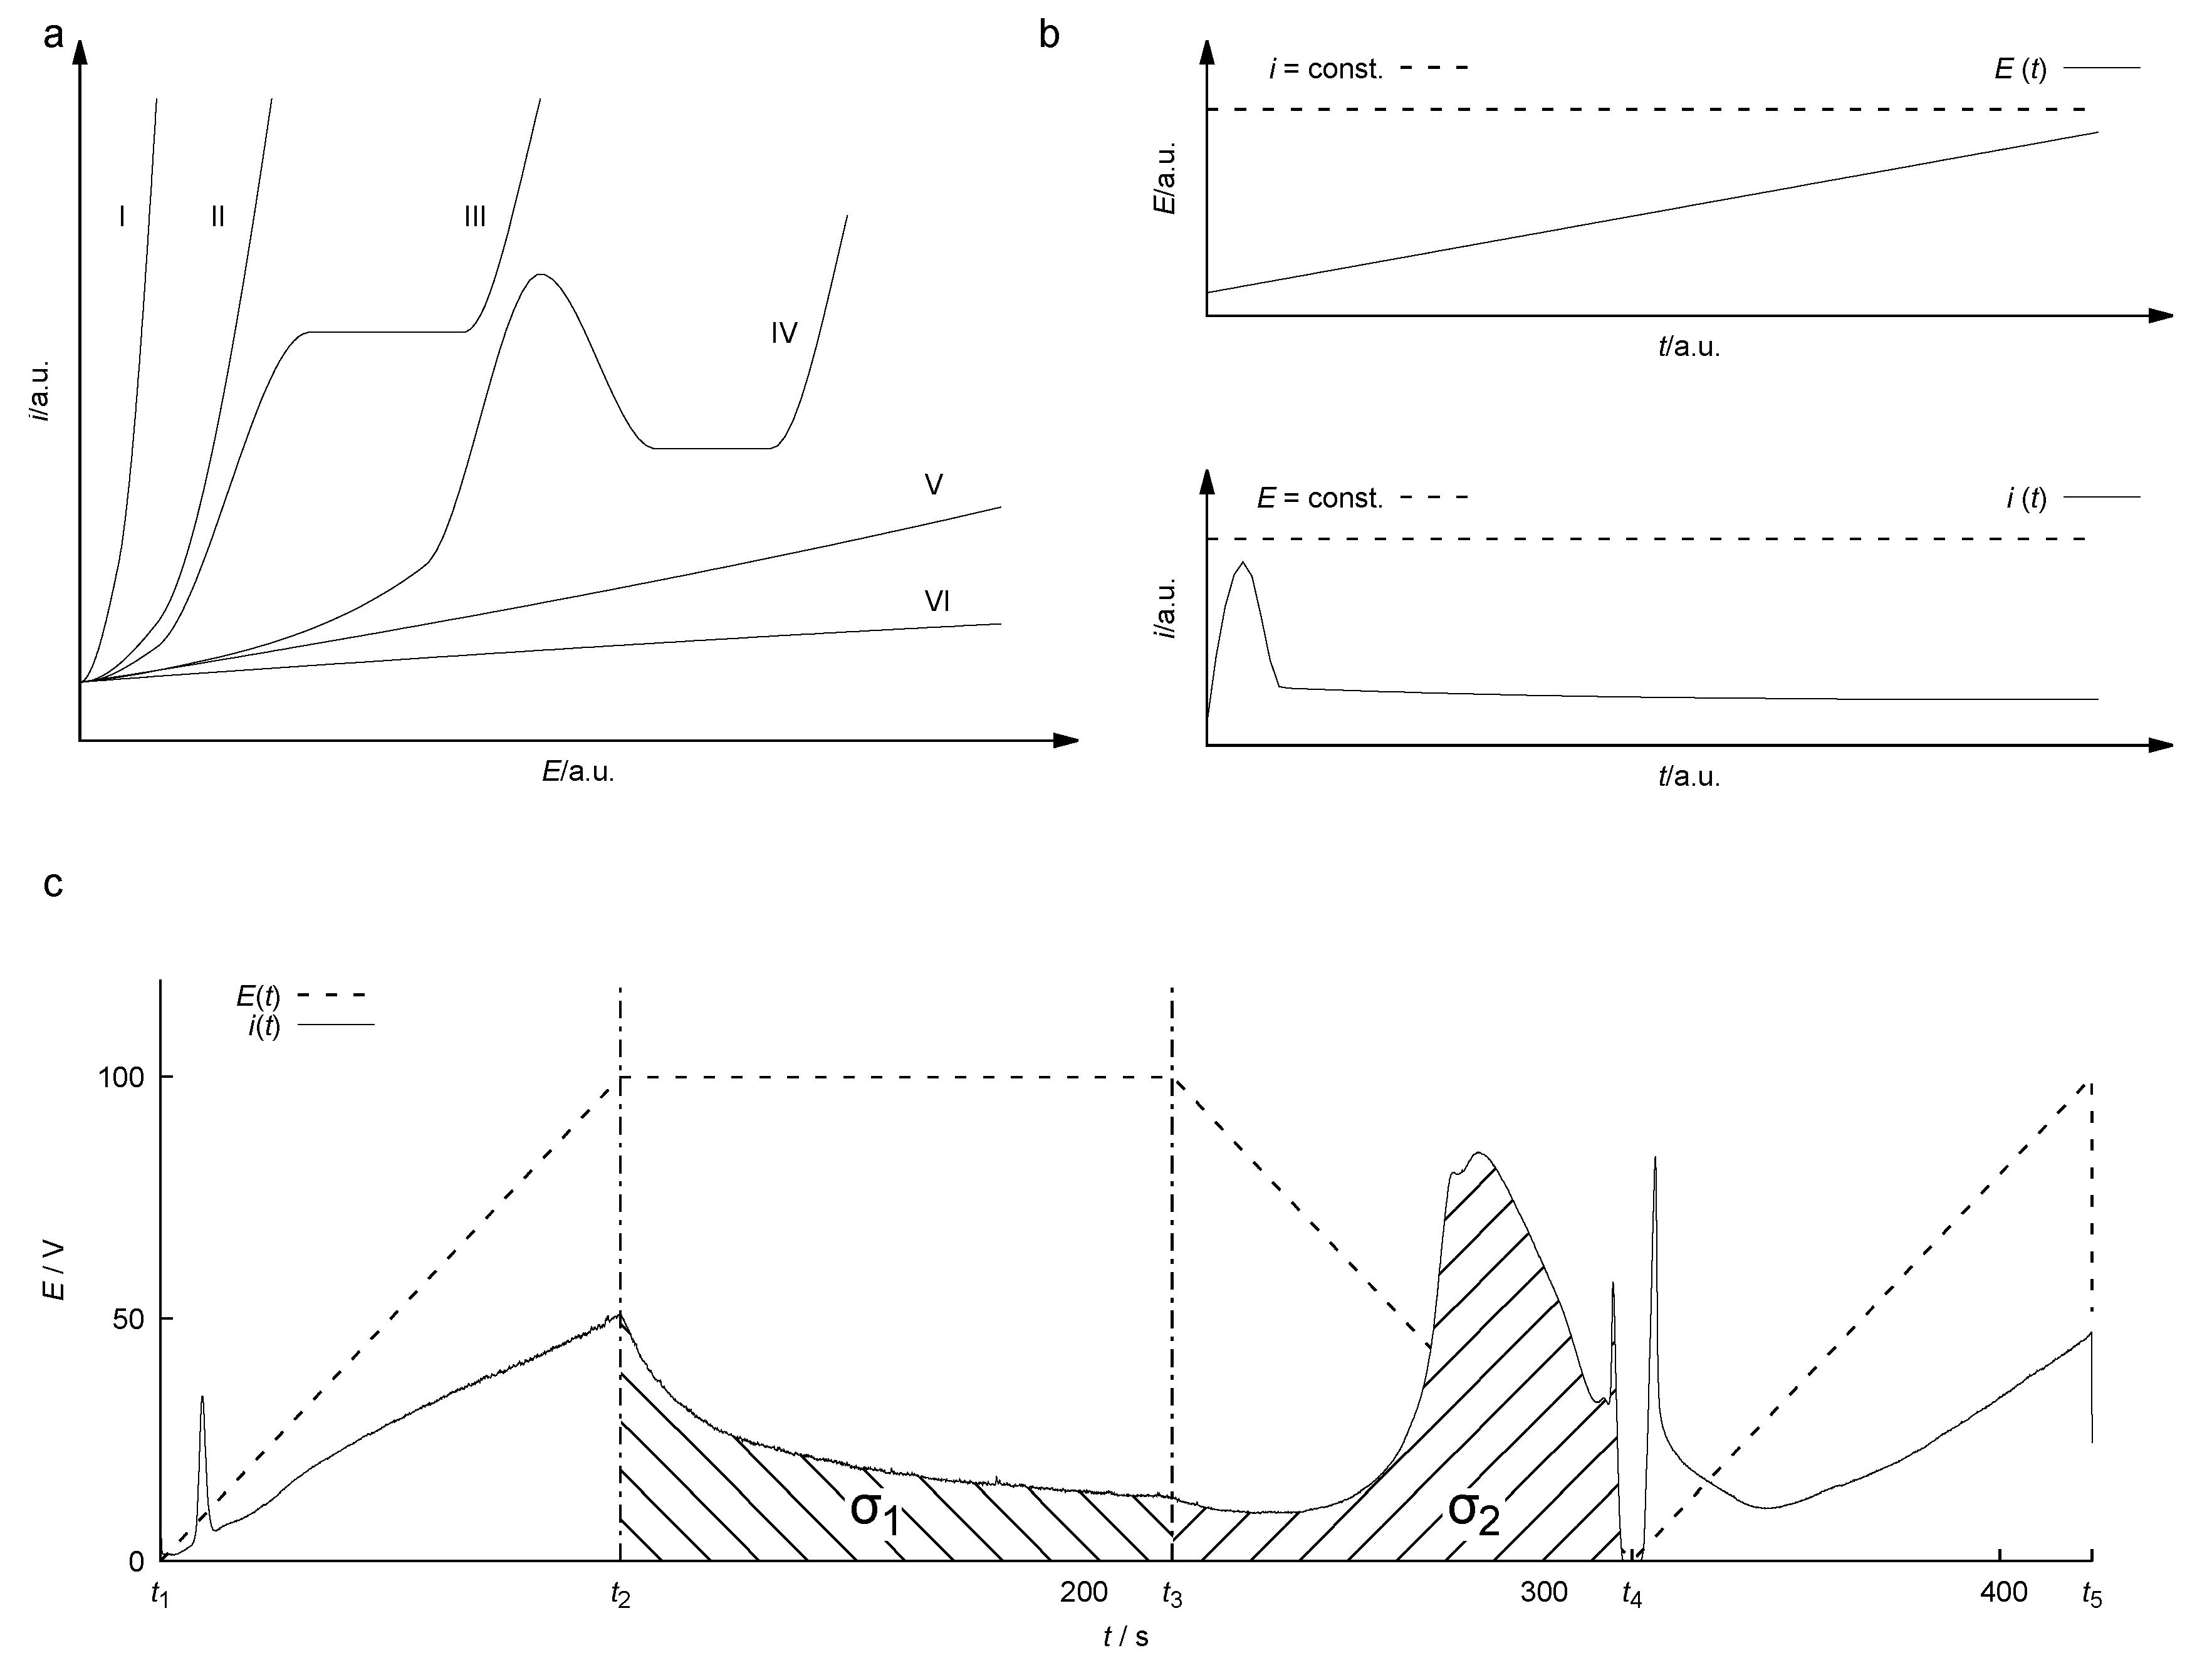
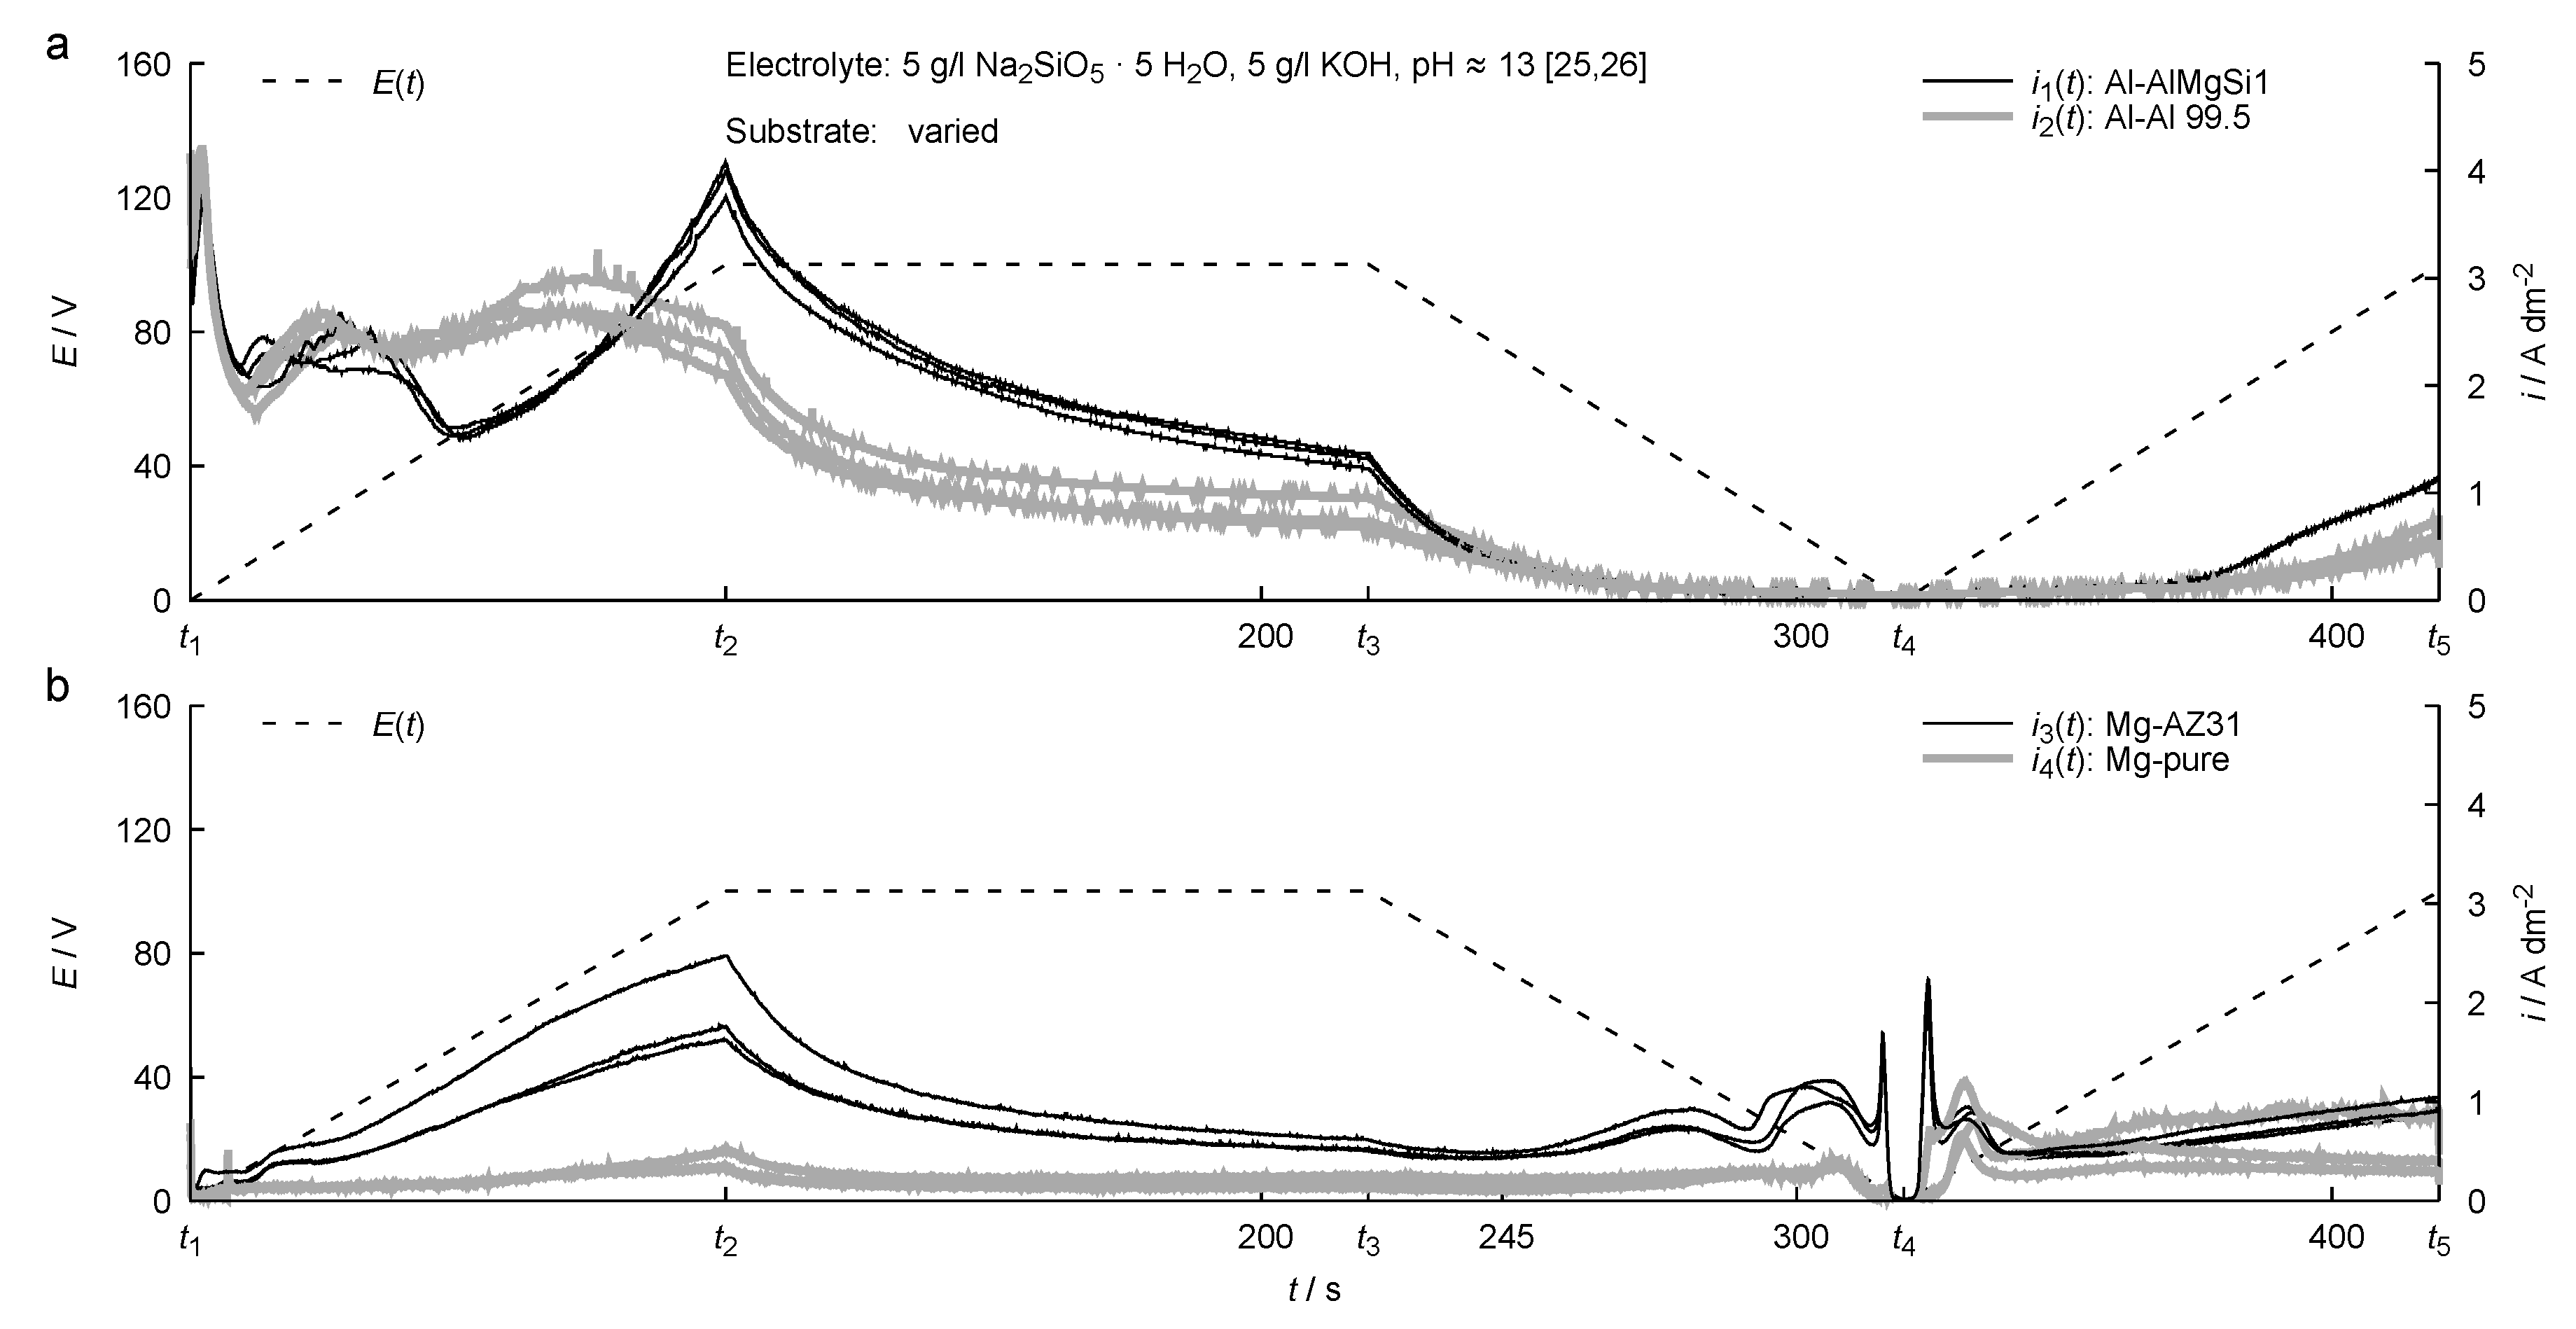
3. Results
4. Discussion
- formation of magnesium hydroxide:
- dissociation of water molecules and hydroxide ions:
- physiochemical passivation: adsorption of glycerol molecules on the substrate surface
- electrochemical passivation: passive layer enforcement by reaction of phosphate and fluoride with magnesium to stable, electrical isolating compounds
5. Conclusion
- A new method for the quantification of the passivation behaviour of substrate electrolyte combinations has been established. This procedure requires only low volumes and is suitable for the further development of PEO processes.
- A depassivation effect that occurs on formed Mg passive films has been described, which represents a significant difference to the passivation of aluminium materials.
- i
- An electrochemical model was developed to describe this mechanism.
- ii
- The model was used to explain the occurrence of insufficient layer adhesion in the PEO of magnesium and fluoride-free electrolytes.
- The following categorisation of the passivation mechanisms relevant for the PEO has been proposed:
- i
- physiochemical passivation by adsorption of organic compounds at the substrate/electrolyte interface
- ii
- chemical passivation by buffering of anodic formed protons
- iii
- electrochemical passivation by formation of chemically stable, electrically insulating, insoluble reaction products within the passive layer
- A new theory about the mode of action of fluoride compounds in PEO electrolytes for magnesium has been presented.
Author Contributions
Funding
Acknowledgments
Conflicts of Interest
References
- Yerokhin, A.L.; Nie, X.; Leyland, A.; Matthews, A.; Dowey, S.J. Plasma electrolysis for surface engineering. Surf. Coat. Technol. 1999, 122, 73–93. [Google Scholar] [CrossRef]
- Wielage, B.; Alisch, G.; Lampke, T.; Nickel, D. Anodizing–a key for surface treatment of aluminium. Key Eng. Mater. 2008, 384, 263–281. [Google Scholar] [CrossRef]
- Yerokhin, A.L. Discharge characterization in plasma electrolytic oxidation of aluminium. J. Phys. D Appl. Phys. 2003, 36, 2110–2120. [Google Scholar] [CrossRef]
- Kurze, P. Production, Characterization and Application of Al2O3 Layers, Especially on Aluminium and Iron Materials. Ph.D. Thesis, Tu Chemnitz, Chemnitz, Germany, 1982. (In German). [Google Scholar]
- Kurze, P.; Krysmann, W.; Marx, G. About anodic oxidation of aluminum under spark discharge ANOF in aqueous electrolytes. Wiss. Z. d. Techn. Hochsch. Karl-Marx-Stadt 1982, 24, 665–671. (In German) [Google Scholar]
- Snizhko, L.O.; Yerokhin, A.L.; Gurevina, N.L.; Misnyankin, D.O.; Pilkington, A.; Leyland, A.; Matthews, A. A model for galvanostatic anodising of al in alkaline solutions. Electrochim. Acta 2005, 50, 5458–5464. [Google Scholar] [CrossRef]
- Snizhko, L.O.; Yerokhin, A.; Gurevina, N.L.; Misnyankin, D.O.; Ciba, A.V.; Matthews, A. Voltastatic studies of magnesium anodising in alkaline solutions. Surf. Coat. Technol. 2010, 205, 1527–1531. [Google Scholar] [CrossRef]
- Sieber, M.; Simchen, F.; Scharf, I.; Lampke, T. Formation of a spinel coating on AZ31 magnesium alloy by plasma electrolytic oxidation. J. Mater. Eng. Perform. 2016, 25, 1157–1162. [Google Scholar] [CrossRef]
- Wu, D.; Liu, X.; Lu, K.; Zhang, Y.; Wang, H. Influence of C3H8O3 in the electrolyte on characteristics and corrosion resistance of the microarc oxidation coatings formed on AZ91D magnesium alloy surface. Appl. Surf. Sci. 2009, 255, 7115–7120. [Google Scholar] [CrossRef]
- Qiu, Z.; Zhang, Y.; Li, Y.; Sun, J.; Wang, R.; Wu, X. Glycerol as a leveler on ZK60 magnesium alloys during plasma electrolytic oxidation. RSC Adv. 2015, 5, 63738–63744. [Google Scholar] [CrossRef]
- Simchen, F.; Rymer, L.M.; Sieber, M.; Lampke, T. Composition of highly concentrated silicate electrolytes and ultrasound influencing the plasma electrolytic oxidation of magnesium. IOP Conf. Ser. Mat. Sci. Eng. 2017, 181, 012040. [Google Scholar] [CrossRef]
- Arrabal, R.; Matykina, E.; Viejo, F.; Skeldon, P.; Thompson, G.E. Corrosion resistance of WE43 and AZ91D magnesium alloys with phosphate peo coatings. Corros. Sci. 2008, 50, 1744–1752. [Google Scholar] [CrossRef]
- Schmelling, E.L.; Röschenbleck, B.; Weidemann, M.H. Method for the Production of Corrosion and Wear Resistant Protective Layers on Magnesium and Magnesium Alloys (German). EP 0 333 048 A1, 20 September 1989. [Google Scholar]
- Yun, G.Y.; You, J.I.; You, J.Y.; Yun, J.G.; Kim, J.H.; Park, C.H.; Kim, D.H.; Lee, M.K. Composition for Plasma Electrolytic Oxidation (PEO) Treatment of Magnesium Alloy Products. US P 8337689 B2, 25 December 2012. [Google Scholar]
- Blawert, C.; Dietzel, W.; Ghali, E.; Song, G. Anodizing treatments for magnesium alloys and their effect on corrosion resistance in various environments: Dow17 hae. Adv. Eng. Mat. 2006, 8, 511–533. [Google Scholar] [CrossRef]
- Darband, G.; Aliofkhazraei, M.; Hamghalam, P.; Valizade, N. Plasma electrolytic oxidation of magnesium and its alloys: Mechanism, properties and applications. J. Magnes. Alloy. 2017, 5, 74–132. [Google Scholar] [CrossRef]
- Wang, L.; Chen, L.; Yan, Z.; Wang, H.; Peng, J. Effect of potassium fluoride on structure and corrosion resistance of plasma electrolytic oxidation films formed on az31 magnesium alloy. J. Alloy. Compd. 2009, 480, 469–474. [Google Scholar] [CrossRef]
- Liang, J.; Guo, B.; Tian, J.; Liu, H.; Zhou, J.; Xu, T. Effect of potassium fluoride in electrolytic solution on the structure and properties of microarc oxidation coatings on magnesium alloy. Appl. Surf. Sci. 2005, 252, 345–351. [Google Scholar] [CrossRef]
- Wierzbicka, E.; Pillado, B.; Mohedano, M.; Arrabal, R.; Matykina, E. Calcium Doped Flash-PEO Coatings for Corrosion Protection of Mg Alloy. Metals 2020, 10, 916. [Google Scholar] [CrossRef]
- Kazanski, B.; Kossenko, A.; Zinigrad, M.; Lugovskoy, A. Fluoride ions as modifiers of the oxide layer produced by plasma electrolytic oxidation on AZ91D magnesium alloy. Appl. Surf. Sci. 2013, 287, 461–466. [Google Scholar] [CrossRef]
- Moon, S.; Kwon, D. Anodic oxide films formed on AZ31 magnesium alloy by plasma electrolytic oxidation method in electrolytes containing various naf concentrations. J. Korean Inst. surf. Eng. 2016, 49, 225–230. [Google Scholar] [CrossRef]
- Liang, J.; Srinivasan, P.B.; Blawert, C.; Störmer, M.; Dietzel, W. Electrochemical corrosion behaviour of plasma electrolytic oxidation coatings on AM50 magnesium alloy formed in silicate and phosphate based electrolytes. Electrochim. Acta 2009, 54, 842–3850. [Google Scholar] [CrossRef]
- Lu, X.; Blawert, C.; Scharnagl, N.; Kainer, K.U. Influence of incorporating Si3N4 particles into the oxide layer produced by plasma electrolytic oxidation on AM50 Mg alloy on coating morphology and corrosion properties. J. Magnes. Alloy. 2013, 1, 267–274. [Google Scholar] [CrossRef]
- Ma, X.; Blawert, C.; Höche, D.; Zheludkevich, M.L.; Kainer, K.U. Investigation of electrode distance impact on PEO coating formation assisted by simulation. Appl. Surf. Sci. 2016, 388, 304–312. [Google Scholar] [CrossRef]
- Sieber, M.; Mehner, T.; Dietrich, D.; Alisch, G.; Nickel, D.; Meyer, D.; Scharf, I.; Lampke, T. Wear-resistant coatings on aluminium produced by plasma anodising—A correlation of wear properties, microstructure, phase composition and distribution. Surf. Coat. Technol. 2014, 240, 96–102. [Google Scholar] [CrossRef]
- Sieber, M.; Simchen, F.; Morgenstern, R.; Scharf, I.; Lampke, T. Plasma electrolytic oxidation of high-strength aluminium alloys—substrate effect on wear and corrosion performance. Metals 2018, 8, 356. [Google Scholar] [CrossRef]
- Song, G.; Atrens, A.; Stjohn, D.; Nairn, J.; Li, Y. The electrochemical corrosion of pure magnesium in 1 N NaCl. Corros. Sci. 1997, 35, 855–875. [Google Scholar] [CrossRef]
- Bender, S.; Goellner, J.; Heyn, A.; Schmigalla, S. A new theory for the negative difference effect in magnesium corrosion. Mater. Corros. 2011, 63, 707–712. [Google Scholar] [CrossRef]
- Rossrucker, L.; Samaniego, A.; Grote, J.P.; Mingers, A.M.; Laska, C.A.; Birbilis, N.; Frankel, G.S.; Mayrhofer, K.J.J. The pH Dependence of Magnesium Dissolution and Hydrogen Evolution during Anodic Polarization. J. Electrochem. Soc. 2015, 162, C333–C339. [Google Scholar] [CrossRef]
- Simchen, F.; Sieber, M.; Lampke, T. Electrolyte influence on ignition of plasma electrolytic oxidation processes on light metals. Surf. Coat. Technol. 2017, 315, 205–213. [Google Scholar] [CrossRef]
- Ono, S.; Moronuki, S.; Mori, Y.; Koshi, A.; Liao, J.; Asoh, H. Effect of Electrolyte Concentration on the Structure and Corrosion Resistance of Anodic Films Formed on Magnesium through Plasma Electrolytic Oxidation. Electrochim. Acta 2017, 240, 415–426. [Google Scholar] [CrossRef]
- Pourbaix, M. Atlas of electrochemical equlibria in aquesouse solutions. NACE Int. Cebelcor 1974, 144 ff, 174ff. [Google Scholar]
- Puigdomenech, I. Medusa software: Make Equilibrium Diagrams Using Sophisticated Algorithms: Royal Institute of Technology; Stockholm, Sweden. 2010. Available online: https://www.kth.se/che/medusa (accessed on 16 September 2020).
- Pilling, N.; Bedworth, R.J. The oxidation of metals at high temperatures. Inst. Met. 1923, 29, 529. [Google Scholar]
- Song, L.; Song, Y.; Shan, D.; Zhu, G.; Han, E. Product/metal ratio (PMR): A novel criterion for the evaluation of electrolytes on micro-arc oxidation (MAO) of Mg and its alloys. Sci. China Technol. Sci. 2011, 54, 2795–2801. [Google Scholar] [CrossRef]
- Perry, D.L. Handbook of Inorganic Compounds, 2nd ed.; CRC Press: Boca Raton, FL, USA, 2011; p. 247 ff. [Google Scholar]
- Mg3P2O8 (Mg3[PO4]2 m) Crystal Structure. Springer Materials. Available online: https://materials.springer.com/isp/crystallographic/docs/sd_1904740 (accessed on 16 September 2020).
- Hwang, D.Y.; Kim, Y.M.; Shin, D.H. Corrosion resistance of plasma-anodized AZ91 Mg alloy in the electrolyte with/without potassium fluoride. Mat. Trans. 2009, 50, 671–678. [Google Scholar]


| n | 1 | 2 | 3 | 4 | 5 | 6 |
|---|---|---|---|---|---|---|
| /V | 0 | 100 | 100 | 0 | 100 | 0 |
| /s | 0 | 100 | 220 | 320 | 420 | ≈420 |
| Mass Fraction/% | ||||
|---|---|---|---|---|
| Element | Al 99.5 | AlMgSi1 | Pure Mg | AZ31 |
| Al | balance | balance | 0 | 3 |
| Mg | 0 | 1 | ≥99.9 | balance |
| Si | ≤0.25 | 0.7–1.3 | 0 | 0 |
| Zn | 0 | 0 | 0 | 1 |
| Substance | c/mol · l | /mS · cm |
|---|---|---|
| NaHPO | 0.03 | 36.1 |
| 0.10 | 53.5 | |
| CH(OH) | 0.03 | 20.3 |
| (glycerol) | 0.10 | 21.9 |
| NaF | 0.03 | 20.9 |
| 0.10 | 26.8 |
© 2020 by the authors. Licensee MDPI, Basel, Switzerland. This article is an open access article distributed under the terms and conditions of the Creative Commons Attribution (CC BY) license (http://creativecommons.org/licenses/by/4.0/).
Share and Cite
Simchen, F.; Sieber, M.; Mehner, T.; Lampke, T. Characterisation Method of the Passivation Mechanisms during the pre-discharge Stage of Plasma Electrolytic Oxidation Indicating the Mode of Action of Fluorides in PEO of Magnesium. Coatings 2020, 10, 965. https://doi.org/10.3390/coatings10100965
Simchen F, Sieber M, Mehner T, Lampke T. Characterisation Method of the Passivation Mechanisms during the pre-discharge Stage of Plasma Electrolytic Oxidation Indicating the Mode of Action of Fluorides in PEO of Magnesium. Coatings. 2020; 10(10):965. https://doi.org/10.3390/coatings10100965
Chicago/Turabian StyleSimchen, Frank, Maximilian Sieber, Thomas Mehner, and Thomas Lampke. 2020. "Characterisation Method of the Passivation Mechanisms during the pre-discharge Stage of Plasma Electrolytic Oxidation Indicating the Mode of Action of Fluorides in PEO of Magnesium" Coatings 10, no. 10: 965. https://doi.org/10.3390/coatings10100965
APA StyleSimchen, F., Sieber, M., Mehner, T., & Lampke, T. (2020). Characterisation Method of the Passivation Mechanisms during the pre-discharge Stage of Plasma Electrolytic Oxidation Indicating the Mode of Action of Fluorides in PEO of Magnesium. Coatings, 10(10), 965. https://doi.org/10.3390/coatings10100965