Article

Correlation between Substrate Ion Fluxes and the Properties of Diamond-Like Carbon Films Deposited by Deep Oscillation Magnetron Sputtering in Ar and Ar + Ne Plasmas

1
Department of Mechanical Engineering, CEMMPRE, University of Coimbra, Rua Luis Reis Santos, 3030-788 Coimbra, Portugal
2
“Solid State Electronics”, The Ångström Laboratory, Uppsala University, SE-75121 Uppsala, Sweden
3
National Institute of Research and Development for Optoelectronics–INOE 2000, 409 Atomistilor Str., 051431 Magurele-Bucharest, Romania
4
LED&Mat-IPN, Instituto Pedro Nunes, Laboratório de Ensaios Desgaste e Materiais, Rua Pedro Nunes, 3030-199 Coimbra, Portugal
*
Author to whom correspondence should be addressed.
Coatings 2020, 10(10), 914; https://doi.org/10.3390/coatings10100914
Submission received: 21 August 2020 / Revised: 16 September 2020 / Accepted: 22 September 2020 / Published: 24 September 2020

Abstract

:
Recently, the use of Ne as a processing gas has been shown to increase the ionization degree of carbon in High Power Impulse Magnetron Sputtering (HiPIMS) plasmas. In this work, time-resolved measurements of the substrate’s current density were carried out in order to study the time evolution of the ionic species arriving at the growing film. The addition of Ne to the plasma resulted in a steep increase of the sp3/sp2 ratio in the films once the Ne contents in the processing atmosphere exceeded 26%. Increasing the Ne content is shown to increase both the total number of C ions generated in the plasmas and the ratio of C/gaseous ions. The time-resolved substrate ion current density was used to evaluate the possibility of substrate biasing synchronizing with the discharge pulses in the HiPIMS process. It is shown that in pure Ar plasmas, substrate biasing should be confined to the time interval between 25 and 40 µs after the pulse starts, in order to maximize the C+/Ar+ ratio bombarding the substrate and minimize the formation of film stresses. However, Ne addition to the processing gas shortens the traveling time of the carbon species towards the substrate, reducing the separation between the gaseous and carbon ion arrival times.

1. Introduction

The physical vapor deposition of hard Diamond-like Carbon (DLC) films, such as tetragonal amorphous films (ta-C), relies on the subplantation of C ions into the subsurface region of the growing film, in order to promote the formation of sp3 sites. This process is easily implemented in ionized deposition technologies, such as filtered cathodic arc deposition (FCA) and pulsed laser deposition (PLD), as carbon ions are naturally produced [1,2]. In the standard direct current magnetron sputtering (DCMS) deposition process, however, most sputtered species are neutrals and, thus, the number of sp3 sites created during the deposition of DLC films is much lower than in FCA and PLD [3]. In the model proposed by Robertson et al. [4], the sp3 bonding is a direct consequence of the film densification produced by the subplantation of C ions. On the contrary, McKenzie et al. [5] proposed that the formation of sp3 sites is an outcome of the compressive stress originating from bombardment by ions with hyper-thermal energy. In practice, hard DLC films generally suffer from high internal stresses, which limit their maximum thickness [6,7]. Delamination occurs when the internal stress arising from the deposition mechanism creating the sp3 bonds exceeds a critical value. In DCMS, the vast majority of energetic species impinging on the growing film are Ar ions extracted from the plasma by substrate biasing, causing additional stresses without significantly contributing to sp3 formation.
Recently, High Power Impulse Magnetron Sputtering (HiPIMS) has been proposed for hard DLC deposition [8,9,10,11]. In HiPIMS, a large fraction of sputtered atoms are ionized, due to the much higher plasma densities than those in DCMS [12]. HiPIMS has been successfully implemented for many metals [13,14,15,16], i.e., for elements which exhibit ionization energies between 6 and 8 eV [17]. However, standard HiPIMS is not fully effective for carbon which exhibits a significantly higher ionization energy (11.6 eV) and lower ionization cross-section [18]. As a result, in HiPIMS discharges with a C target, the C+/C ratio does not exceed 5% [19]. Aijaz et al. [20] proposed the use of Ne as a processing gas in order to increase the ionization degree of carbon in HiPIMS plasmas. As Ne has a higher ionization energy than Ar—21.56 against 15.6 eV—introducing Ne in the plasma increases the electron temperature [20]. This leads to an increase of the electron impact ionization rate coefficient and thus to an increase of the ionization probability of the sputtered carbon species. Several authors have reported that partially or even totally replacing the conventional Ar sputtering gas with Ne [21,22,23] results in a significant improvement of the DLC coating’s mechanical and tribological properties. Besides producing an increased ionization degree of the film forming species, HiPIMS also has the potential to provide the possibility for selecting bombarding ions by suitably synchronizing the substrate bias with HiPIMS pulses. This strategy has already been demonstrated for metals, and relies on the intrinsic strong rarefaction which occurs in front of the HiPIMS target [24,25,26]. Metal ions are preferentially accelerated to the substrate, resulting in lower compressive stresses in the films [27,28]. Regarding carbon deposition by HiPIMS, besides the preferential selection of C ions, synchronous substrate bias can also be used to minimize the bombardment from background gas ions and thus decrease the unnecessary compressive stresses.
In a previous work, the authors showed that a recently developed variant of HiPIMS, called deep oscillation magnetron sputtering (DOMS), was suitable for the deposition of hydrogen-free DLC coatings with properties comparable to those of the DLC films deposited by other state of the art deposition processes [29]. In DOMS, packets of very short power pulses (~20 µs width) are applied to the cathode, resulting in an increase in sp3 formation [29]. In this work, time-resolved measurements of the substrate current density were carried out in both pure Ar and Ar + Ne plasmas, using a specially designed flat probe, in order to study the time evolution of the ionic species arriving at the growing film. The results were then correlated with the mechanical and structural properties of DLC films deposited with an increasing Ne content in the plasma. Additionally, the substrate current density measurements were discussed with regard to the potential use of synchronized biasing during the deposition of DLC films by DOMS.

2. Materials and Methods

The DLC films were deposited by sputtering a pure graphite (99.95%) target (150 × 150 × 10 mm3) in Ar and Ar + Ne plasmas at 0.8 Pa. The films were deposited onto 20 × 20 mm2 Si (100) substrates, which were ultrasonically cleaned in a sequence of acetone and ethanol solution baths, for 15 min each. The substrates were fixated onto a rotating substrate holder with the rotation axis parallel to the target, revolving at 23.5 rev/min around the central axis of the high grade stainless steel deposition chamber (400 × 400 × 400 mm3). The apparatus schematic used in this work can be found in reference [29]. The substrate-to-target distance was kept at 80 mm for all of the experiments. A base pressure lower than 3 × 10⁻⁴ Pa was achieved before all depositions using a system comprised of a scroll and a turbomolecular pump. Prior to all depositions, an etching treatment using an ion gun (producing Ar+ ions) was performed, in order to clean the substrates’ surface and increase the film adhesion. The ion gun voltage and current were kept at 36 V and 20 A, respectively, while a bias of −150 V was applied to the substrate holder for 40 min at 0.3 Pa. The ion gun-to-substrates distance was kept at 80 mm. Furthermore, a Cr adhesion layer (~400 nm) and a CrN supporting layer (~400 nm) were deposited before the DLC film deposition. Both were deposited by DCMS (Huttinger PFG 7500 DC) in pure Ar and Ar + 30% N at 0.8 Pa and P = 800 W, using a pure chromium target (99.99%) with dimensions of 150 × 150 × 10 mm3.
The DLC films were deposited by DOMS. The discharge voltage and current waveforms consisted of pulses composed of a sequence of oscillations, as shown in Figure 1. The pulses had a total duration (D) of the order of several hundred µs and frequency (F) of a few hundred Hz. Each oscillation consisted of a gradual increase of both the voltage and the current, up to a maximum value, followed by a gradual decrease down to zero, before the beginning of the next oscillation after the oscillation period (T). The on-time (ton) is the time during which the oscillations increase up to their maximum value. The full width at half maximum of the oscillations ranged between 10 and 15 µs. The peak voltage (Vp) and peak current (Ip) were calculated as the average values of the maxima of the voltage and current in each oscillation, respectively, taking all of the oscillations from one pulse into account. The peak power (Pp) is defined as the product Vp × Ip and was controlled by changing the charging voltage (DCint) of the DOMS power supply (HiPIMS Cyprium™ plasma generator, Zpulser Inc., Mansfield, MA, USA). All films were deposited with ton = 4 μs, T = 130 μs, and D = 1690 μs. The pulse frequency (F) was automatically adjusted by the DOMS power supply software, in order to maintain the time-averaged power (Pa) so that it was equal to 1.3 kW.
In this work, three DLC films were first deposited using a pure Ar plasma with an increasing substrate bias of −60, −80, and −100 V. The corresponding deposition conditions are shown in Table 1. In a second step, Ne was added to the discharge gas prior to plasma ignition, while the Ar flux was reduced to keep the deposition pressure at 0.8 Pa, as measured by a capacitance gauge. The corresponding deposition conditions are shown in Table 2. A maximum Ne content of 50% in the gas mixture used as plasma ignition could not be achieved above 60% Ne and only unstable discharges were obtained above 50% Ne.
The time-resolved substrate current densities (SCDs) were measured using a planar Langmuir probe with a guard ring positioned at 8 cm from the carbon target and aligned with the target center. Both the guard ring and probe were made of stainless steel, with the active area of the probe being a 10 mm diameter disc. The guard ring and probe were biased at the same potential, but only the current driven through the probe was registered, as the voltage drop on a 10 Ohm resistor. In order to maintain the voltage constant during the pulse, the biasing was performed using polarized electrolytic capacitors, as described in detail in [30].
All measurements were performed using voltage pulses with ton = 4 μs, T = 130 μs, D = 1690 μs, and F = 266 Hz and an average power (Pa) of 1.3 kW. As can be observed in Figure 1c, the substrate current density displays a pattern of oscillations following the current oscillations applied to the target. The maximum value of the substrate current density increases up to the third oscillation and stabilizes for the remaining ones, showing that the first oscillations are different form the rest. Indeed, ignition of the plasma is more difficult at the beginning of the pulse, as there are only a few charged particles remaining from the previous pulse. The initial current density oscillations build-up on this remaining background low density plasma. Once the plasma density builds up during the first two or three pulses, the ignition occurs more smoothly and in a more reproducible manner for the rest of the oscillations. Therefore, in order to improve the statistics, the SCDs presented in this work were obtained by averaging over the last 10 oscillations of each DOMS pulse.
The flat probe measurements were performed in both pure Ar and mixed Ar + Ne plasmas at a discharge pressure of 0.8 Pa total pressure. First, the substrate current densities in a pure Ar plasma were measured using increasing values of peak power. Then, the substrate current density at a constant peak power was measured as a function of the Ne contents in the discharge gas, which was varied between 0 and 60% by controlling the partial pressures of the gases before plasma ignition. For each set of discharge parameters, the SCD was acquired with substrate biases in the range of 0 to −120 V. The corresponding discharge parameters for both sets of measurements are shown in Table 3.
The interaction of the Ar+ and Ne+ ions with the carbon target was modeled using the SRIM 2013 software package [31] in surface sputtering mode. The impact of 106 ions was computed in each simulation. The computations provided a final list of the energy and direction of the sputtered ions leaving the target. The sputtering yield computed from the ratio of impinging ions and sputtered atoms and the average energy of the sputtered C atoms are shown in Table 4 as a function of the impinging ions’ energy.
The thickness of the films was measured from scanning electron microscopy (SEM) micrographs obtained using a Quanta 400FEG ESEM (FEI, Hillsboro, OR, USA). The deposition rate was calculated by dividing the film thickness (measured by SEM, Figure S1) by the deposition time. The structural investigation of the deposited films was performed by employing UV Raman spectroscopy using a Renishaw inVia Raman microscope equipped with an He-Cd laser of 325 nm. All recorded Raman spectra were fitted using the Breit-Wigner-Fano (BWF) line shape for both the D and G peaks of amorphous carbon. The hardness of the films was measured by nano-indentation (MicroMaterials NanoTester, Wrexham, UK) using a Berkovich diamond indenter. The hardness was evaluated from load–displacement curves using the depth-sensing method. Hardness measurements were conducted with 5 mN loads, ensuring an indentation depth of less than 10% of the coating’s thickness. In total, 16 hardness measurements were performed on each specimen.

3. Results

3.1. Evaluation of Substrate Currents in Pure Ar Plasmas

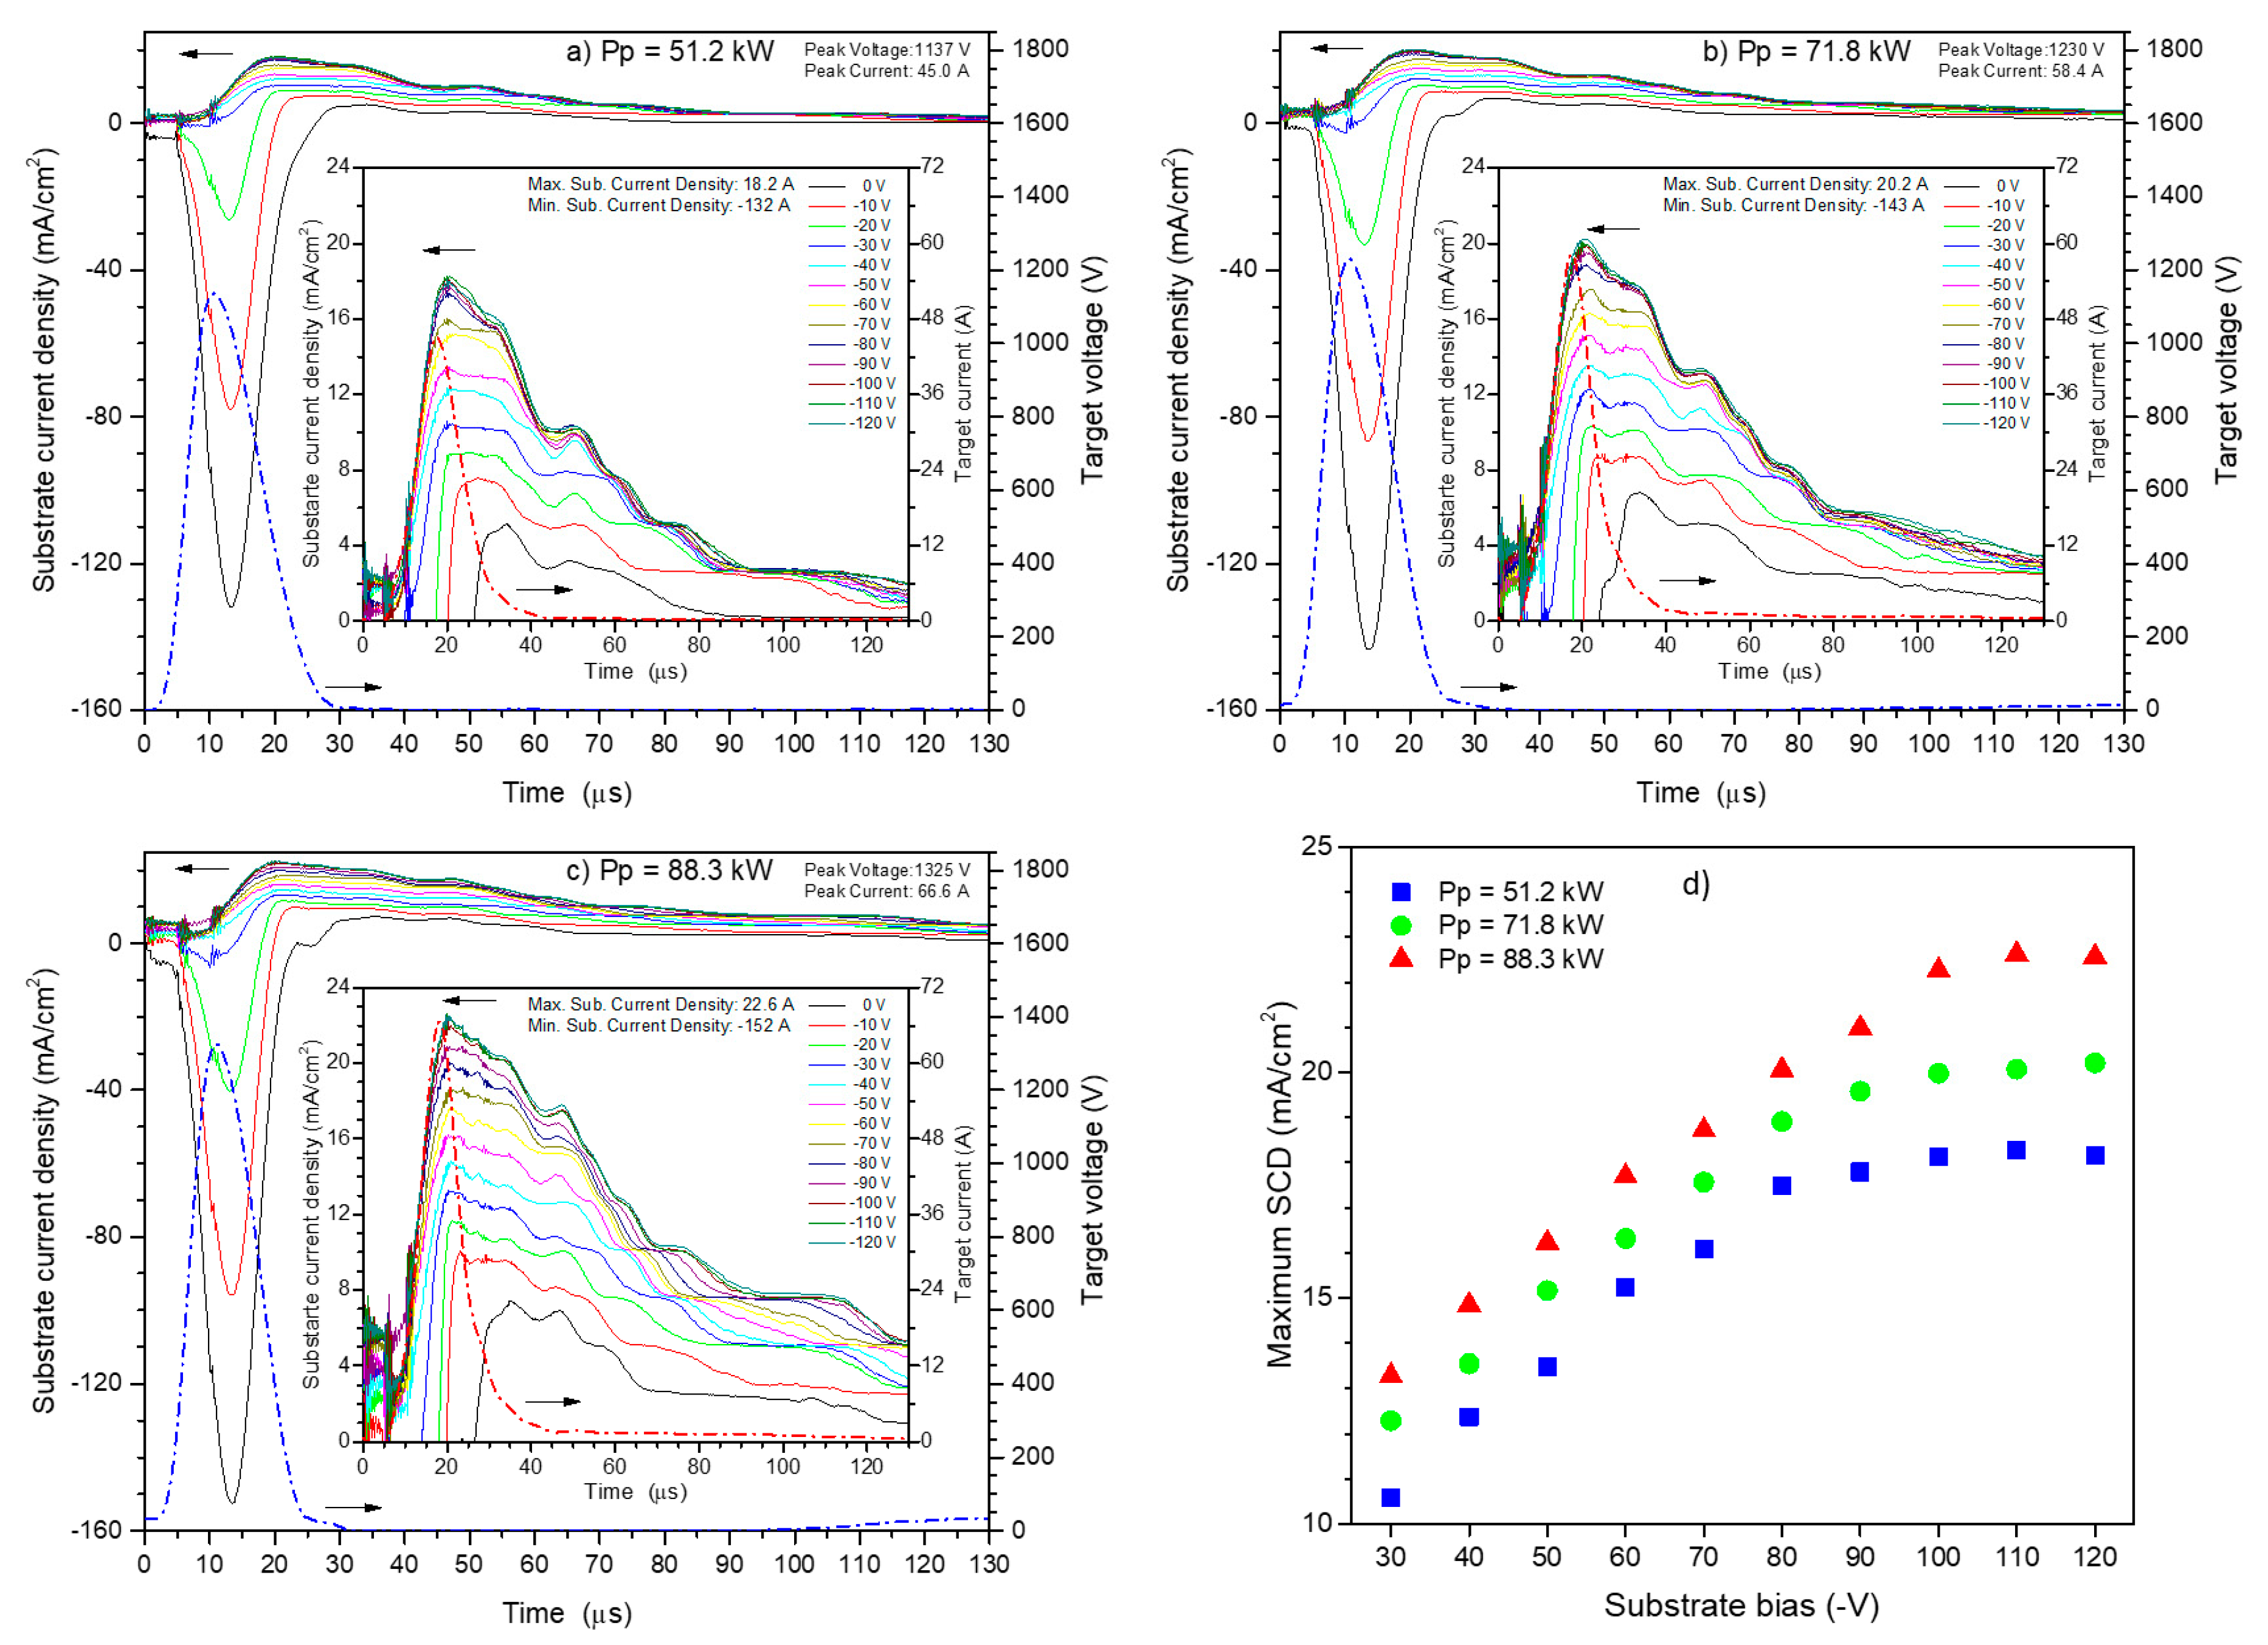
The time-resolved substrate current densities (SCDs) acquired in pure Ar plasmas are shown in Figure 2a–c for increasing peak powers and increasing substrate biases up to −120 V. Magnifications of the positive part of the SCDs are also shown in the insets of the figures. Additionally, the target voltage and current oscillations corresponding to the SCDs are superimposed in the main graphs and insets, respectively. At all peak powers, the SCDs are largely negative within the first ~25 µs if no bias is applied to the probe. Most of the electron current is suppressed by applying a substrate bias of ≈−30 V, showing that a large number of low energy electrons are always collected at the un-biased probe during the on time of the target voltage. The number of low energy electrons increases with an increasing peak power, as can be concluded from the corresponding increase of the area of the negative current density.
The SCDs measured with a Pp = 51.2 kW are shown in Figure 2a. As can be observed in the inset of this figure, the maximum value of the SCDs, which is reached shorty after t = 20 µs, increases with increasing negative biasing of the probe and then saturates. Increasing the negative bias repels an increasing number of electrons, with successively higher energies, until the ion saturation current (ISC) is reached. The maximum of the SCDs presented in Figure 2a is shown in Figure 2d as a function of the negative bias voltage. The ISC is reached at a bias close to −80 V at t = 20 µs, as can be inferred from the change of slope of the curve corresponding to Pp = 51.2 kW. A negative bias was needed to achieve ISC decreases during the afterglow period. For example, at delays of 40, 60, and 100 µs from the oscillation beginning, the ISC is reached at decreasing substrate biases close to −60, −40, and −20 V, respectively. The SCDs obtained at higher peak powers (Figure 2b,c) show similar trends with an increasing bias as those already pointed out for the SCDs obtained at the lowest peak power. However, the ISC is reached at higher negative bias values when higher peak powers are applied. This is most easily confirmed in Figure 2d, where the negative bias voltage required to reach the ISC is that corresponding to the change of slope in each curve (shown in the figure with an arrow). The ion saturation is obtained at bias voltages close to −90 and −100 V at peak powers of 71.8 and 88.3 kW, respectively. These results indicate that increasing the peak power increases the electron temperature (Te) of the plasma, with higher and higher negative voltages being needed to repel increasingly higher energy electrons from the substrate.
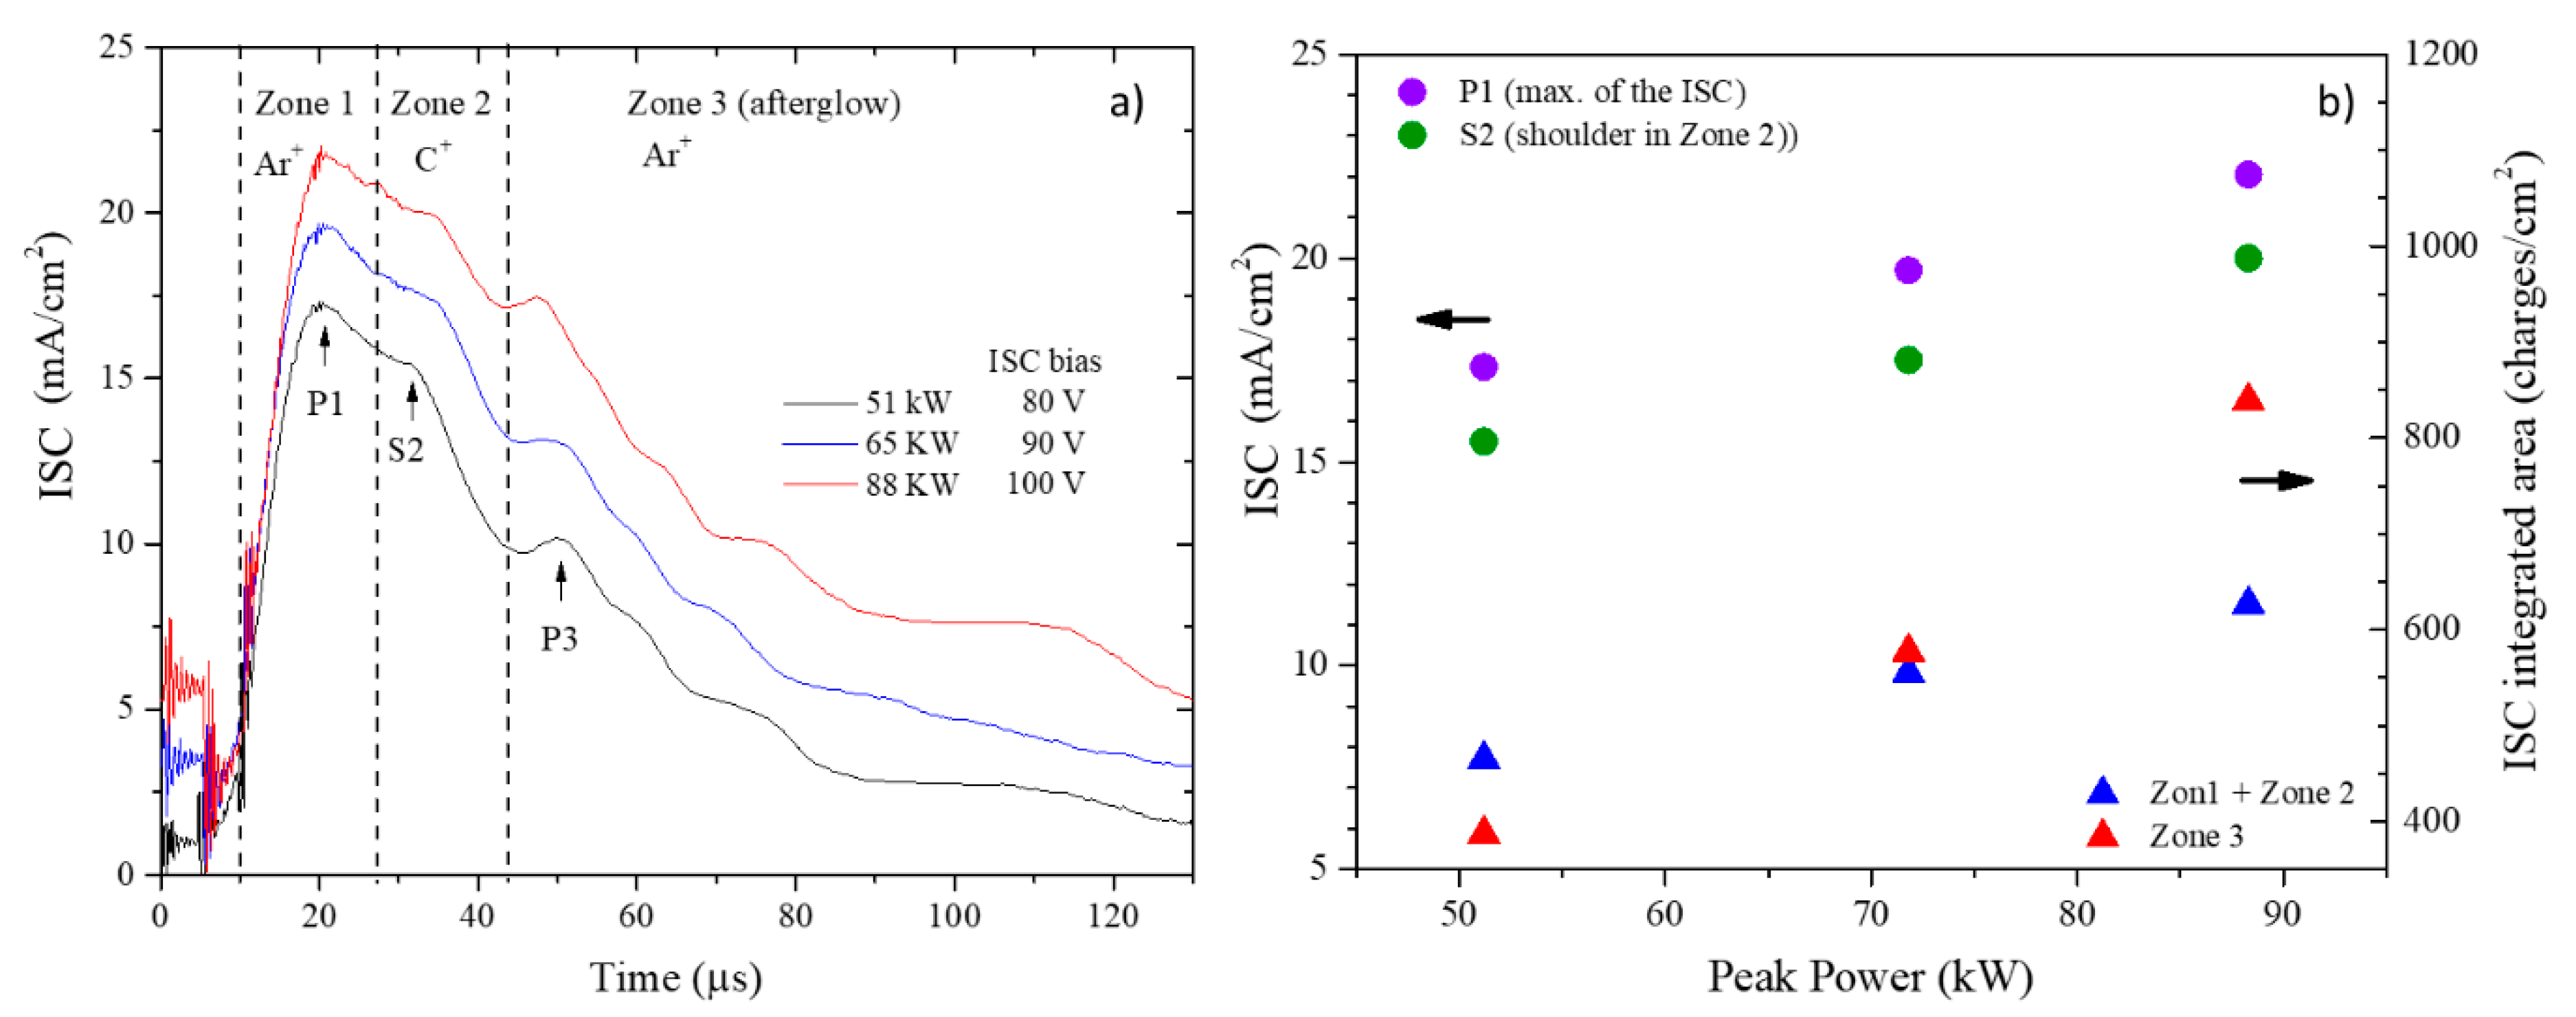
The ISCs obtained from Figure 2a–c are shown in Figure 3a. In general, the time evolution of all the ISCs displays several similar features. A fast initial increase of the ISC intensity is first observed (starting at t ~10 µs), closely following the target current increase, up to a maximum (labeled as P1 in Figure 3a) at a time shortly after the maximum of the target current (close to ~20 µs). Several authors have reported that HiPIMS discharges are dominated by gaseous ions in the first stages of the afterglow [32,33,34]. Although most studies were carried out with metallic targets, Schmidt et al. carried out Energy Resolved Mass Spectroscopy (ERMS) in HiPIMS plasmas obtained from a C target in pure Ar and found that Ar+ ions were detected in the plasma well before the arrival of C+ ions [35,36]. During the initial stages of the discharge, the secondary electrons released from the target surface are accelerated by the electric field that develops at the target sheath and produce sufficiently high ionization of gas atoms. Both electrons and ions are transported towards the substrate position by ambipolar diffusion, giving rise to the observed sharp increase of the ISC.
In spite of the continuous decrease of the target current down to near 0 V between t ~20 and ~35 µs, the intensity of the ISCs does not decrease monotonically in this time interval. After a small initial decrease, following the initial decrease of the target current, the ISCs display a small plateau of a fairly constant intensity followed by a steep decrease, i.e., the ISCs display a shoulder (labeled as S2 in Figure 3a).
ERMS measurements in an HiPIMS C plasma in pure Ar showed that C+ ions are only detected in the plasma at a later stage than Ar+ ions [35,36]. Some of the carbon neutrals sputtered from the target are ionized by the electron impact in the HiPIMS discharge and only reach the substrate at a later time, after the secondary electrons, which are much faster. Therefore, the shoulder observed in the ISCs obtained in this work between t = 25 and 35 µs is attributed to the arrival of C+ ions at the probe and the pronounced decrease of ISCs in this time interval corresponds to the extinction of the sputtering process at the target.
A clear local maximum of the ISCs is observed close to t = 50 µs (P3 in Figure 3a), followed by a decay during the remaining time in the afterglow period. The very high peak powers used in HiPIMS originate from an instantaneous sputtering of a huge number of C atoms from the target. This forms a “sputter wind” that travels through the plasma and locally replaces the gaseous species, i.e., it locally decreases the Ar+ ions’ density. This phenomenon, known as rarefaction [24], results in a drastic decrease of the number of Ar+ ions in the vicinity of the probe during the period of collection of the C+ ions. This conclusion agrees well with the results reported by Schmidt et al. [35] and Greczynski et al. [34] for HiPIMS plasmas in pure Ar using carbon and chromium targets, respectively. Both authors found that the increase of the sputtered ions count rate always occurred simultaneously with a decrease of the Ar+ ion count rate and that the peak of the sputtered ions coincided with a minimum of the Ar+ count rate. Once the arrival of C+ ions decreases, Ar neutrals and ions from the plasma refill the space in the vicinity of the probe, in order to maintain a homogeneous pressure and, thus, a local increase of the ISCs is observed.
According to the above discussion, the time-resolved ISCs can be divided into three different temporal zones, as shown in Figure 3a. Zone 1, which corresponds to plasma ignition, is dominated by Ar+ ions. Most of the C+ ions arrive at the probe in Zone 2, and, thus, most of the contribution of the energetic C+ ions to film growth happens within this time zone. Moreover, the vast majority of ions arriving at the probe in Zone 2 are C+ ions, as these replace the gaseous ions in the vicinity of the probe. Finally, Zone 3 corresponds to the decay of the plasma after the end of the sputtering process and is, once again, dominated by gaseous ions (Ar+).
Assuming that the vast majority of ions arriving at the probe are singly charged, the number of ions collected during the DOMS pulse is proportional to the sum of the areas of Zone 1 and Zone 2, while the number of ions collected during the afterglow is proportional to the area of Zone 3. As shown in Figure 3b, both the number of ions collected during the pulse and during the afterglow increase proportionally to the peak power. This result is due to both the increased number of secondary electrons (higher Ip) and the higher energy of the secondary electrons (higher Te), leading to an increased ionization fraction. The maximum of the ISCs in Zone 1 (P1 in Figure 3a) and the ISC intensity at the time corresponding to the shoulder in Zone 2 (S2 in Figure 3a) can be taken as roughly representative of the fluxes of Ar+ and C+ ions from the plasma to the substrate. As both peaks increase at the same rate with the peak power (Figure 3b), the relative flux of C+ to Ar+ ions remains roughly unchanged with an increasing peak power.

3.2. Ions Saturation Current (ISC) in Ar + Ne Plasmas

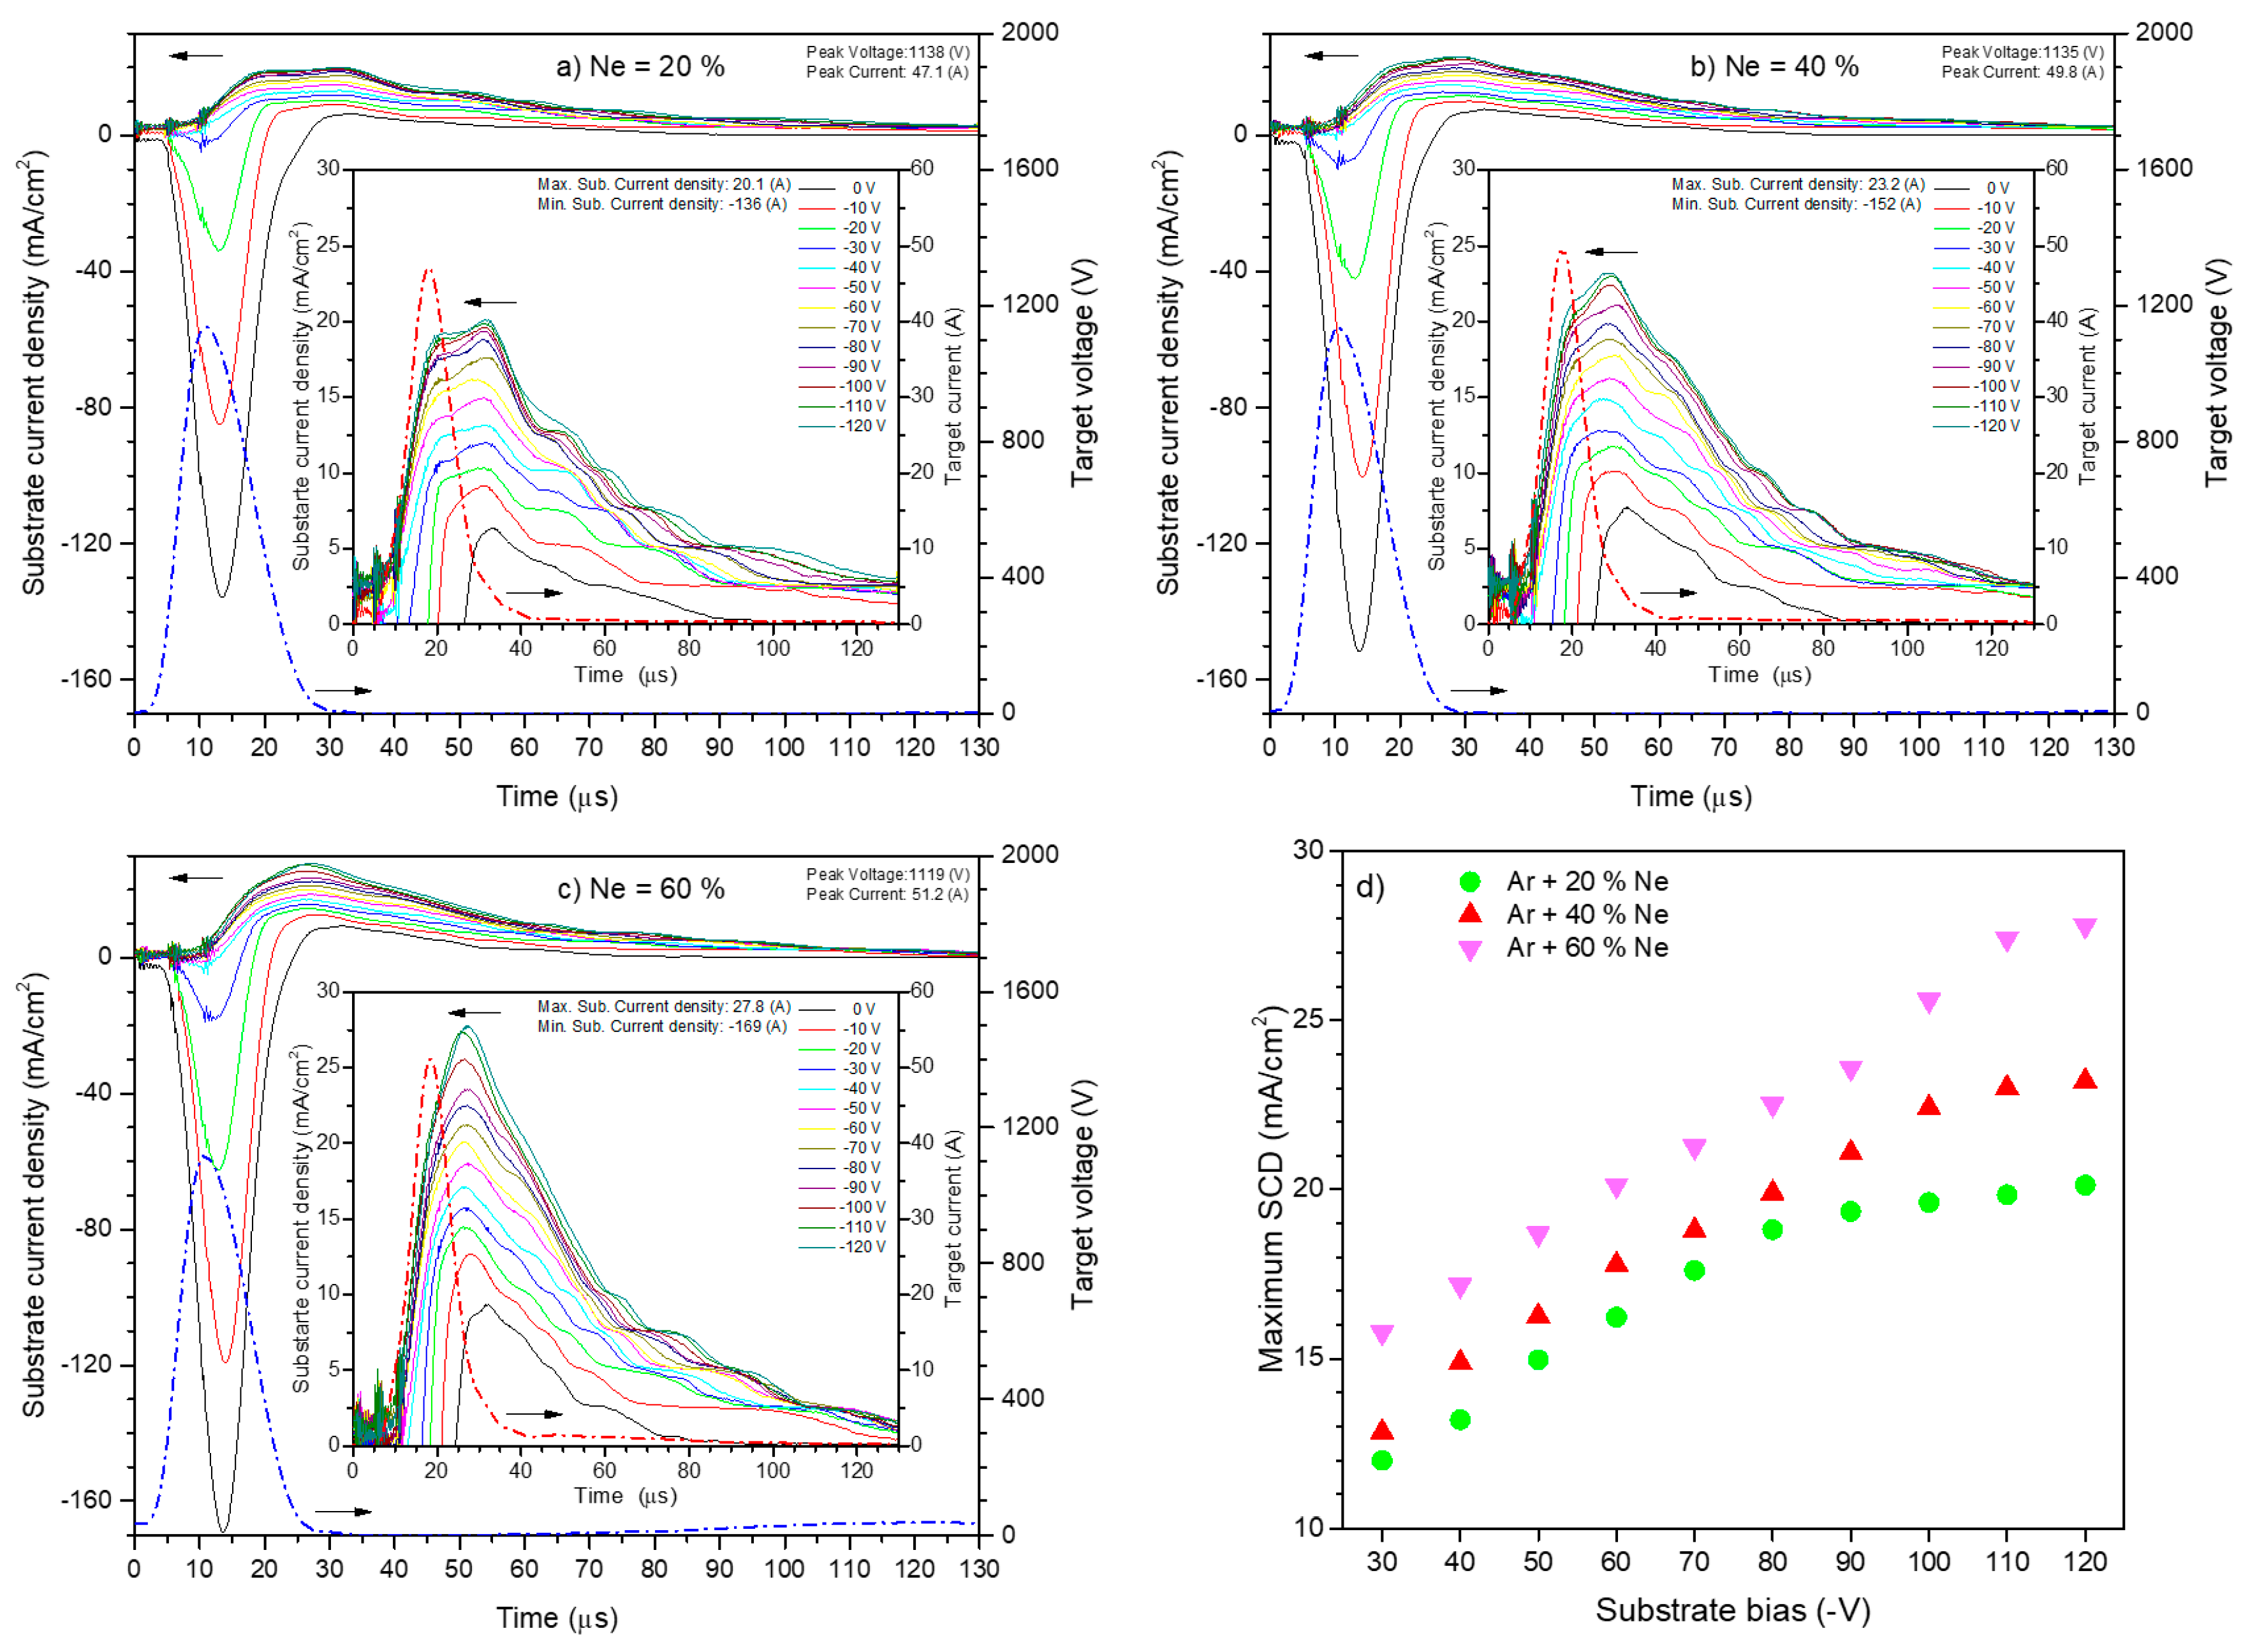
The time-resolved SCDs obtained from Ar + Ne plasmas are shown in Figure 4 as a function of Ne content in the plasma, for substrate biases up to −120 V and similar values of the peak power. Once again, the target voltage and current oscillations corresponding to the measured SCDs are also shown in the figure. As in pure Ar, the SCDs are largely negative during the on time of the target voltage (up to ~30 µs) when no bias is applied to the probe and most of the negative current is eliminated by applying substrate biases between −20 and −30 V. The number of low energy electrons increases with an increasing Ne content in the plasma in a similar fashion as was previously found for an increasing peak power.
The SCDs measured with 20% Ne in the plasma are shown in Figure 4a. During the pulse period, the ISC current is reached at a substrate bias close to −80 V, similar to that needed in pure Ar plasma at the same peak power. Increasing the Ne content in the plasma to 40 and 60% increases the negative bias voltage needed to achieved the ISC during the DOMS pulse to −100 and −110 V, respectively, as shown in Figure 4d. Therefore, the addition of 60% of Ne to the plasma results in a potentially higher increase of Te than that achieved by increasing the peak power. The negative bias needed to achieve the ISC decreases during the afterglow period, regardless of the Ne content, down to almost −20 V at the end of the afterglow period, reflecting the decay of the electron temperature (Te).
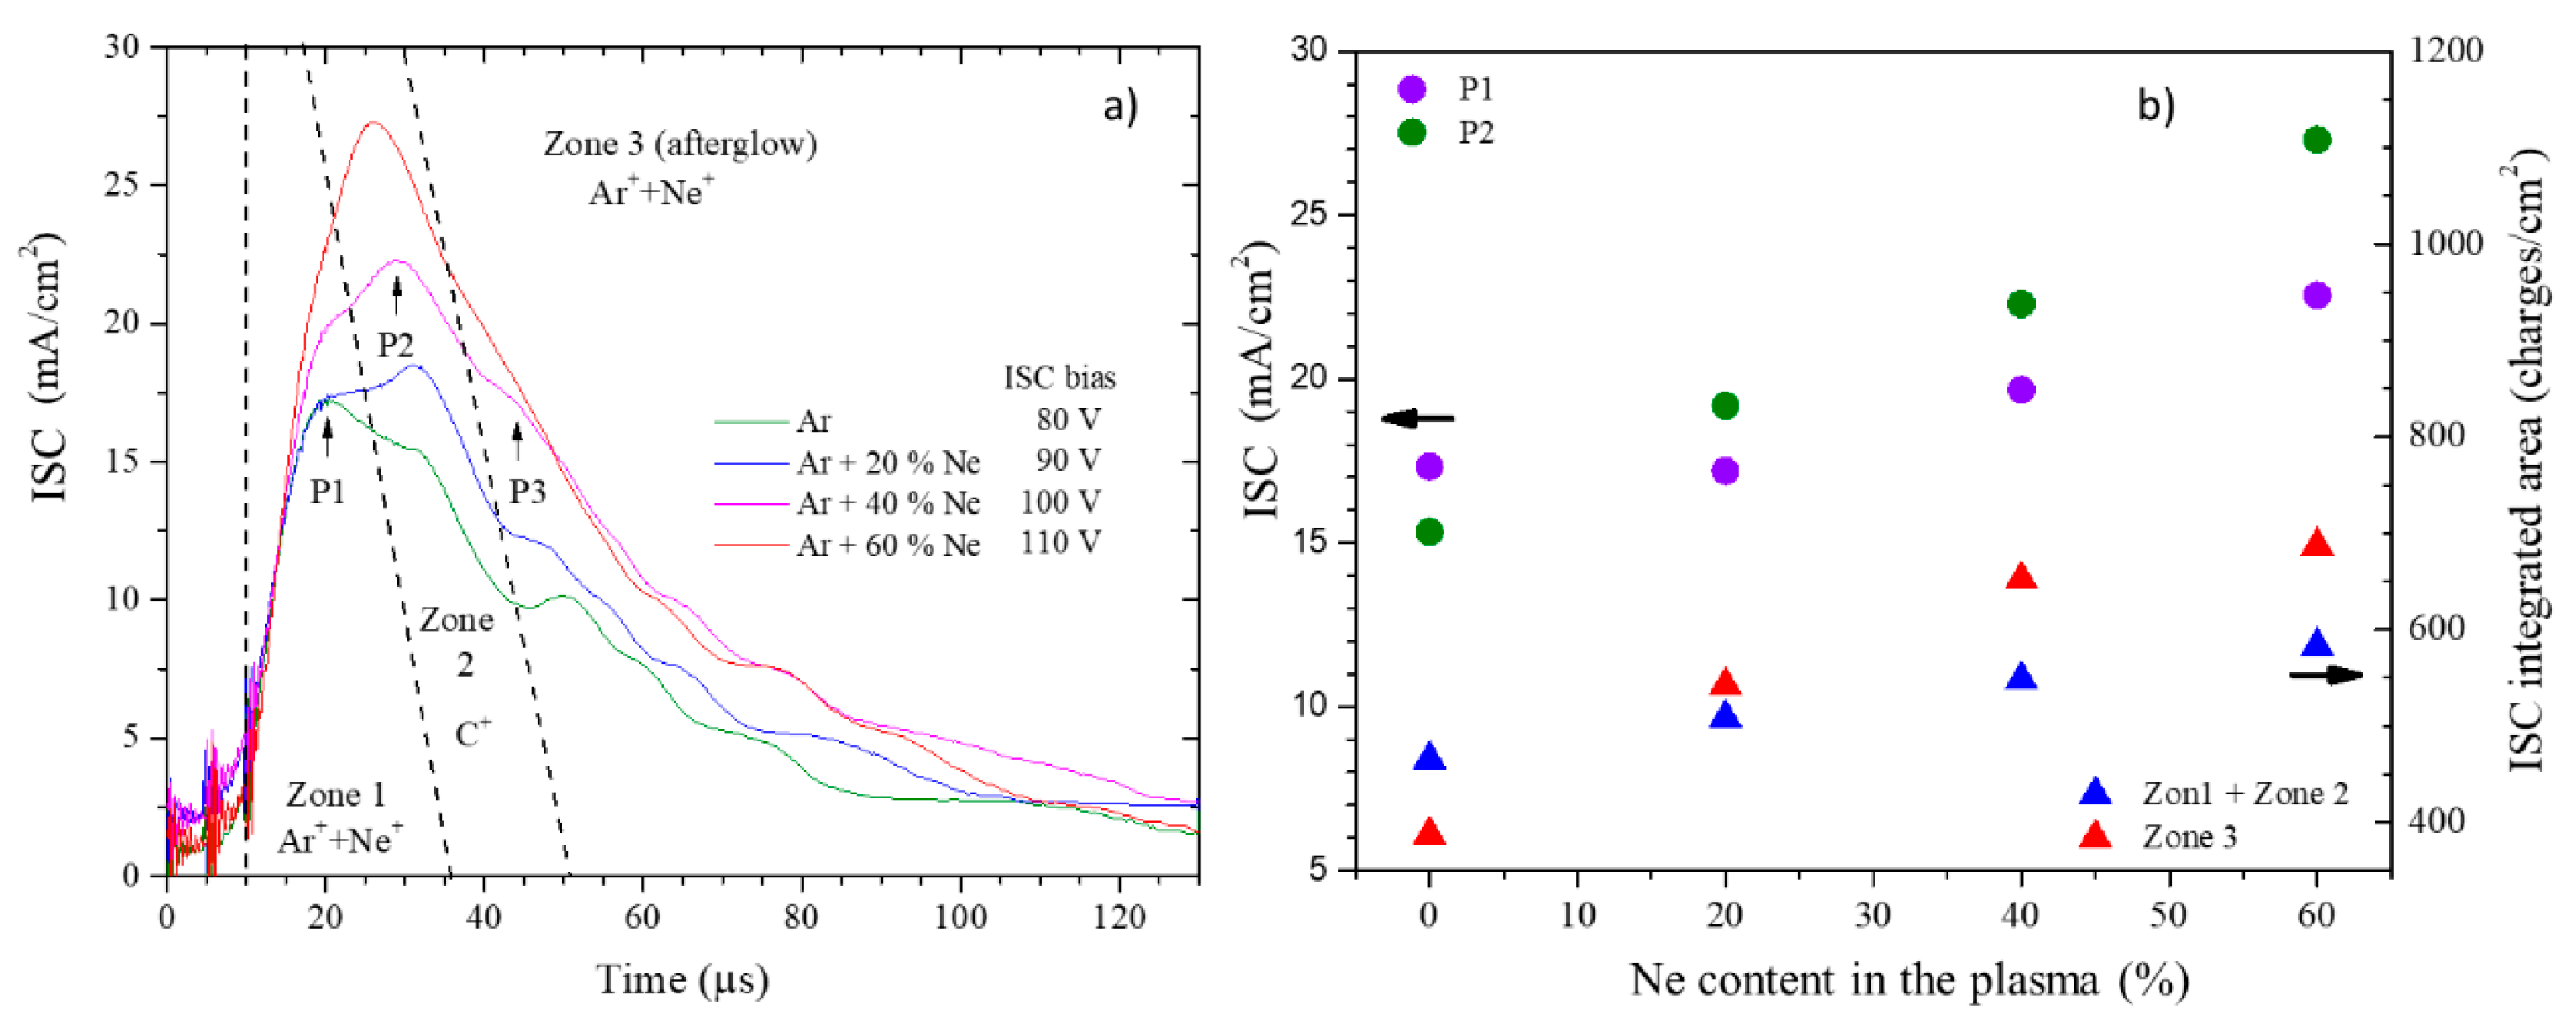
The ISCs obtained in Ar + Ne plasmas are shown in Figure 5a as a function of the Ne content. Additionally, the ISC obtained with a similar peak power, but in a pure Ar plasma, already shown in Figure 3a, is also displayed for comparison purposes. The initial fast increase of the ISC intensity between t = 10 and t = 20 µs, which corresponds to the plasma ignition, is similar in all of the ISC curves, regardless of the Ne content in the plasma. However, while adding 20% Ne to the plasma does not significantly change the ISC intensity at the end of the plasma ignition phase (P1 in Figure 5a), further increasing the Ne content in the plasma significantly increases the intensity of the ISCs, as shown in Figure 5b, despite comparable peak currents. Taking into account that the working pressure was kept constant in all measurements, the results show that replacing Ar by Ne in the plasma increases the plasma density in the vicinity of the probe. Aijaz et al. [23] reported that the plasma density of an HiPIMS discharge in pure Ne gas using a C target was twice as high as that measured in pure Ar in similar operating conditions. This result was mainly attributed to the higher initial ionization energy of Ne, compared to Ar, which induces a higher Te in the plasma and increases the ionization coefficient with an exponential factor [23]. It should also be noted that this result shows that both Ar and Ne ions start to arrive at the probe as soon as the plasma is ignited.
Neon addition shifts the maximum intensity of the ISCs to shorter time delays from pulse onset as the shoulder observed in the ISC in pure Ar develops into a clear peak with an increasing intensity as the neon content is increased (P2 in Figure 5a). According to the discussion already presented, this peak corresponds to the arrival of the C+ ions at the probe after travelling through the deposition chamber. The intensity of the C+ ions peak plasma almost doubles with Ne addition to the plasma, as is shown in Figure 5b. On the other hand, it increases at a much higher rate with increasing Ne than the peak associated with the collection of gaseous ions (P1 in Figure 5b). Although some superposition of the collection of gaseous and C ions during the DOMS pulse is expected, as the gaseous ions in the vicinity of the probe are replaced by the C ions arriving at the probe, the intensities of peaks P1 and P2 can be taken as roughly representative of the number of collected gaseous and C ions. Therefore, assuming only singly charged ions, the above results show that increasing the Ne content in the plasma increases both the number of C ions and the ratio between C and gaseous ions.
Following the analysis carried out for the ICS in pure Ar plasmas, the time-resolved ISC obtained from the Ar + Ne plasmas can also be divided into three different temporal zones corresponding to plasma ignition (Zone 1 in Figure 5a), the collection of sputtered species (Zone 2 in Figure 5a), and plasma decay in the afterglow (Zone 3 in Figure 5a). Both the peak associated with the arrival of C ions in Zone 2 (P2) and the increase of the ISC intensity associated with the refill of the space in the vicinity of the probe with gaseous ions at the beginning of Zone 3 (P3 in Figure 5a) are shifted to shorter times with an increasing Ne content in the plasma. Therefore, the frontiers of Zone 2 and Zone 3 are correspondingly shifted to shorter times, as shown in Figure 5a. Schmidt et al. [36] also performed time-resolved ion mass spectrometry of the HiPIMS C discharge in pure Ne. The authors found that the peak of C+ ions arriving at the spectrometer closely followed the peak of Ne+ ions, while in pure Ar, the peak of C+ ions was significantly delayed with respect to the peak of Ar+ ions. On the other hand, the authors also found that the peak of C+ ions was shifted to shorter times in the HiPIMS C discharge in pure Ne compared to pure Ar. Both results agree well with those obtained in this work. The shift of the C ions peak to shorter times with increasing Ne in the plasma is a consequence of the higher average energy of the C neutrals sputtered at the target in Ne compared to Ar, as shown in Table 2. It should also be noted that the time interval between the C+ ions peak (P2) and the refill peak (P3) is not significantly changed with increasing Ne in the plasma, in accordance with the refill mechanism of Ar species from the plasma proposed in this work.
Assuming again that mostly singly charged ions arrive at the probe, the number of ions collected both during the pulse, which is proportional to the sum of the areas of Zone 1 and Zone 2, and during the afterglow, which is proportional to the area of Zone 3, increase with the Ne content in the plasma (Figure 5b). Overall, the increase in the number of ions for both is comparable with that obtained by increasing the peak power in pure Ar plasmas. Although the maximum intensity of both P1 and P2 in Figure 5b increases with the Ne content in the plasma, the later increases at a higher rate. Therefore, increasing the Ne content in the plasma increases the relative amount of C+ to gas ions, while this ratio remains constant with an increasing peak power, as shown previously.
As was mentioned in the introduction, one of the aims of this work was to evaluate the DOMS process for synchronized biasing of the substrate with the target pulses. Regarding the results obtained in pure Ar, as most of the C ions arrive at the substrate in zone 2, substrate biasing should be confined to the time interval roughly between 25 and 40 µs. This will maximize the C+/Ar+ ratio of energetic ions bombarding the substrate and minimize the formation of additional stresses by avoiding unnecessary bombardment by energetic Ar+ ions both during plasma ignition (Zone 1) and in the afterglow (Zone 3). Similar conclusions can be drawn from the results obtained in Ar + Ne plasmas. However, adding Ne to the plasma shortens the traveling time of the carbon species towards the substrate. Therefore, the maxima of arriving C and gaseous fluxes are much closer to each other, as was also shown in [36], and the separation of gaseous and carbon ions becomes more difficult. On the other hand, the boundary between Zone 2 and Zone 3 is shifted to shorter times and, thus, the bias synchronization of the DOMS pulse has to be optimized as a function of the composition of the background gas.

3.3. Properties of the DLC Films

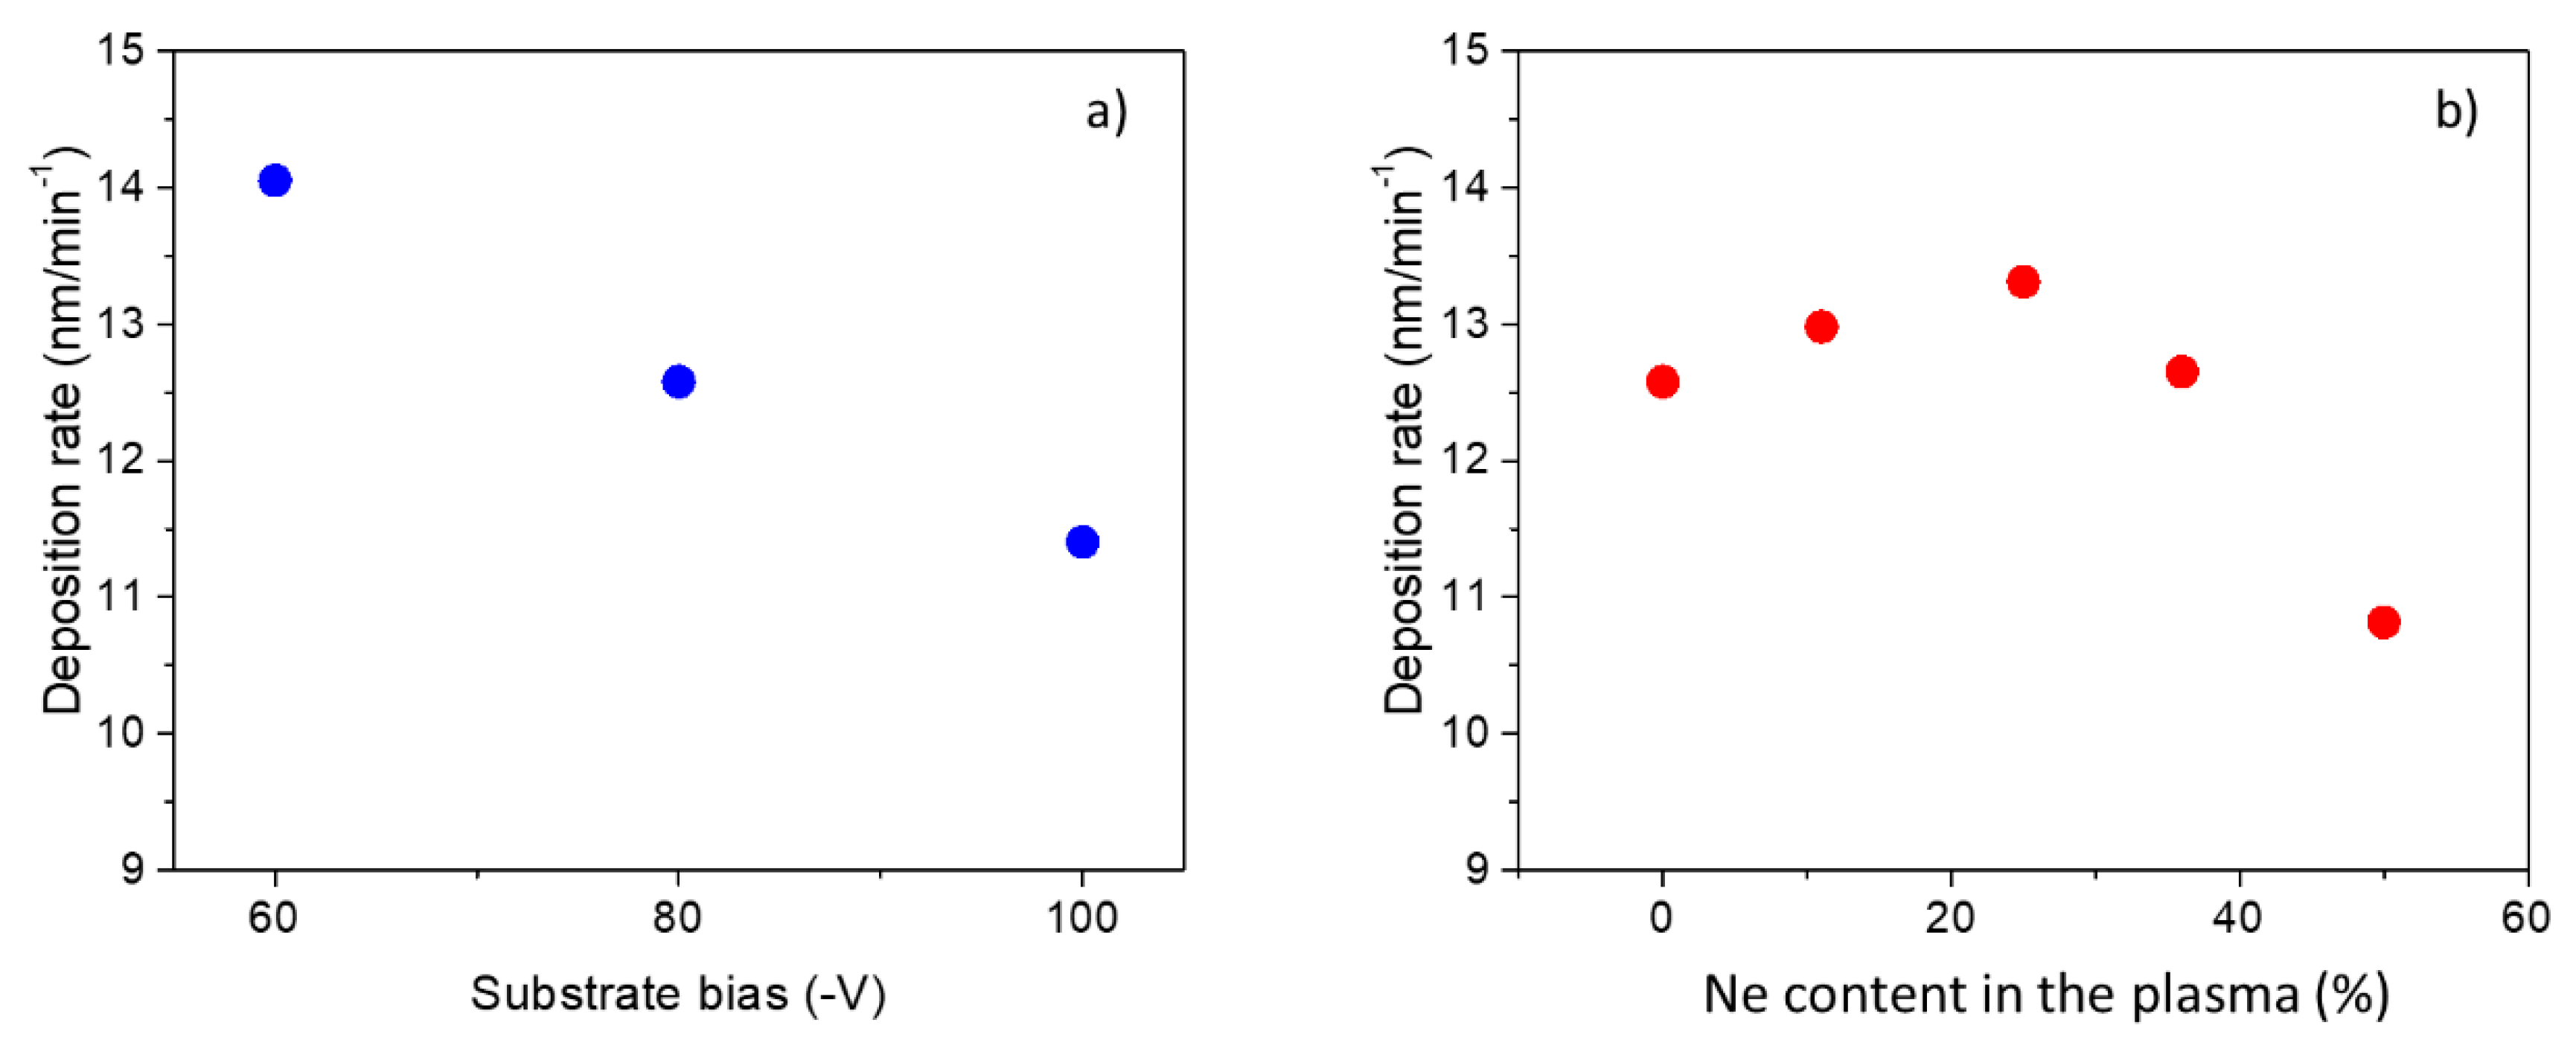
The deposition rate of the DLC films in pure Ar plasma decreases by ~25% with increasing substrate negative biasing from −60 to −100 V (Figure 6a), at a constant power of 1.3 kW. This result is most likely due to an increased re-sputtering of the DLC films, i.e., an increased sputtering of carbon species from the films’ surface by the more energetic species bombarding the growing film. For the films deposited with a substrate bias of −80 V, the deposition rate initially increases with the addition of Ne to the plasma up to 26% and sharply decreases as more Ne is added (Figure 6b). During the DOMS deposition, the ions bombarding the target will be accelerated not only at the maximum voltage, which is close to 1400 V for all depositions (Table 3 and Table 4), but also at much lower voltages during the increasing/decreasing portions of the oscillation. Although the sputtering yields of Ne+ and Ar+ are very similar above 1000 eV (Table 2), the Ne+ ions have a considerably higher sputtering yield in the lower energy range. For example, at 300 eV, the sputtering yield of Ne+ is nearly 40% higher than that of Ar+. Therefore, the initial increase of the deposition rate can be related to the higher sputtering yield of Ne+ in the low energies range. The sharp decrease of the deposition rate at higher Ne contents in the plasma cannot be explained by the different sputtering yields of the gaseous species. A possible explanation for this result is the deposition of denser films at higher Ne contents. Even though the number of sputtered carbon atoms increases continuously as Ar is substituted by Ne in the plasma, the deposition rate, which is calculated from the thickness of the films, may nevertheless decrease if the mass density of the films is significantly increased.
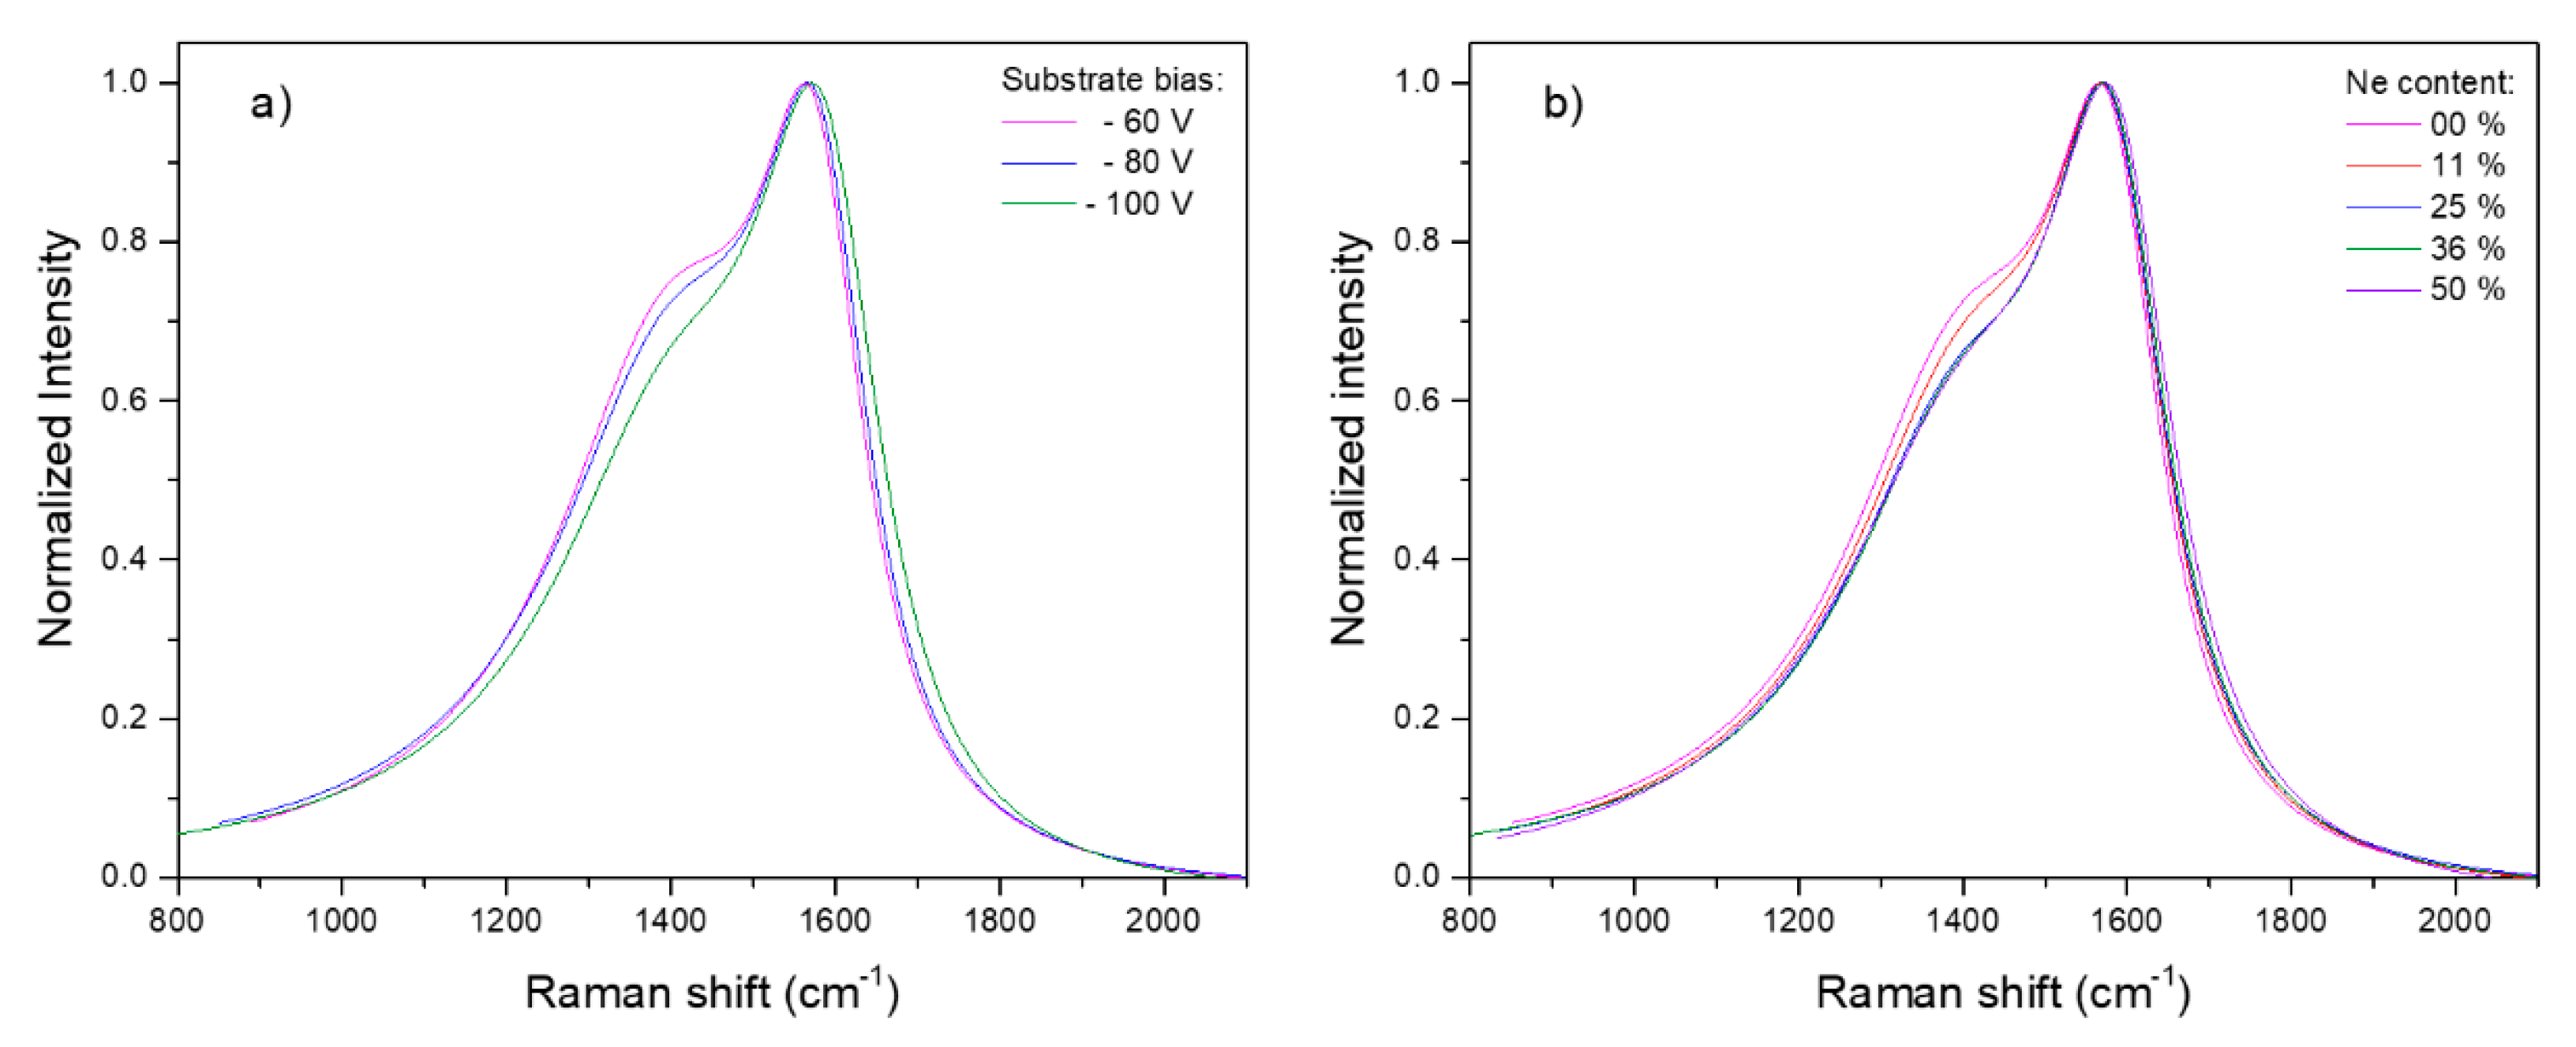
The Raman spectra of DLC films usually exhibit at least two distinct broad bands: The “graphitic carbon” (G) band located above 1500 cm−1 and the “disordered carbon” (D) band, which is located at lower Raman shifts than the G band [4]. The Raman spectra for DLC coatings deposited by DOMS in this work are shown in Figure 7. In other to facilitate a comparison, the Raman spectra have been normalized to unity. All of the spectra clearly show the presence of both the G and the D bands, with the latter appearing as a shoulder on the left side of the former.
Increasing the bias voltage from −60 to −80 V only results in a small decrease of the relative intensity of the D band, as shown by the decreasing height of the shoulder region (Figure 7a). Further increasing the bias voltage to −100 V also decreases the relative intensity of the D band, but it additionally results in a shift of the G band to slightly higher frequencies. Increasing the Ne content in the films up to 25% decreases the D band’s relative intensity (Figure 7b). However, further increasing the Ne content does not significantly change the relative intensity of the D and G bands. On the other hand, adding Ne to the plasma results in a continuous shift of the G band to higher frequencies.
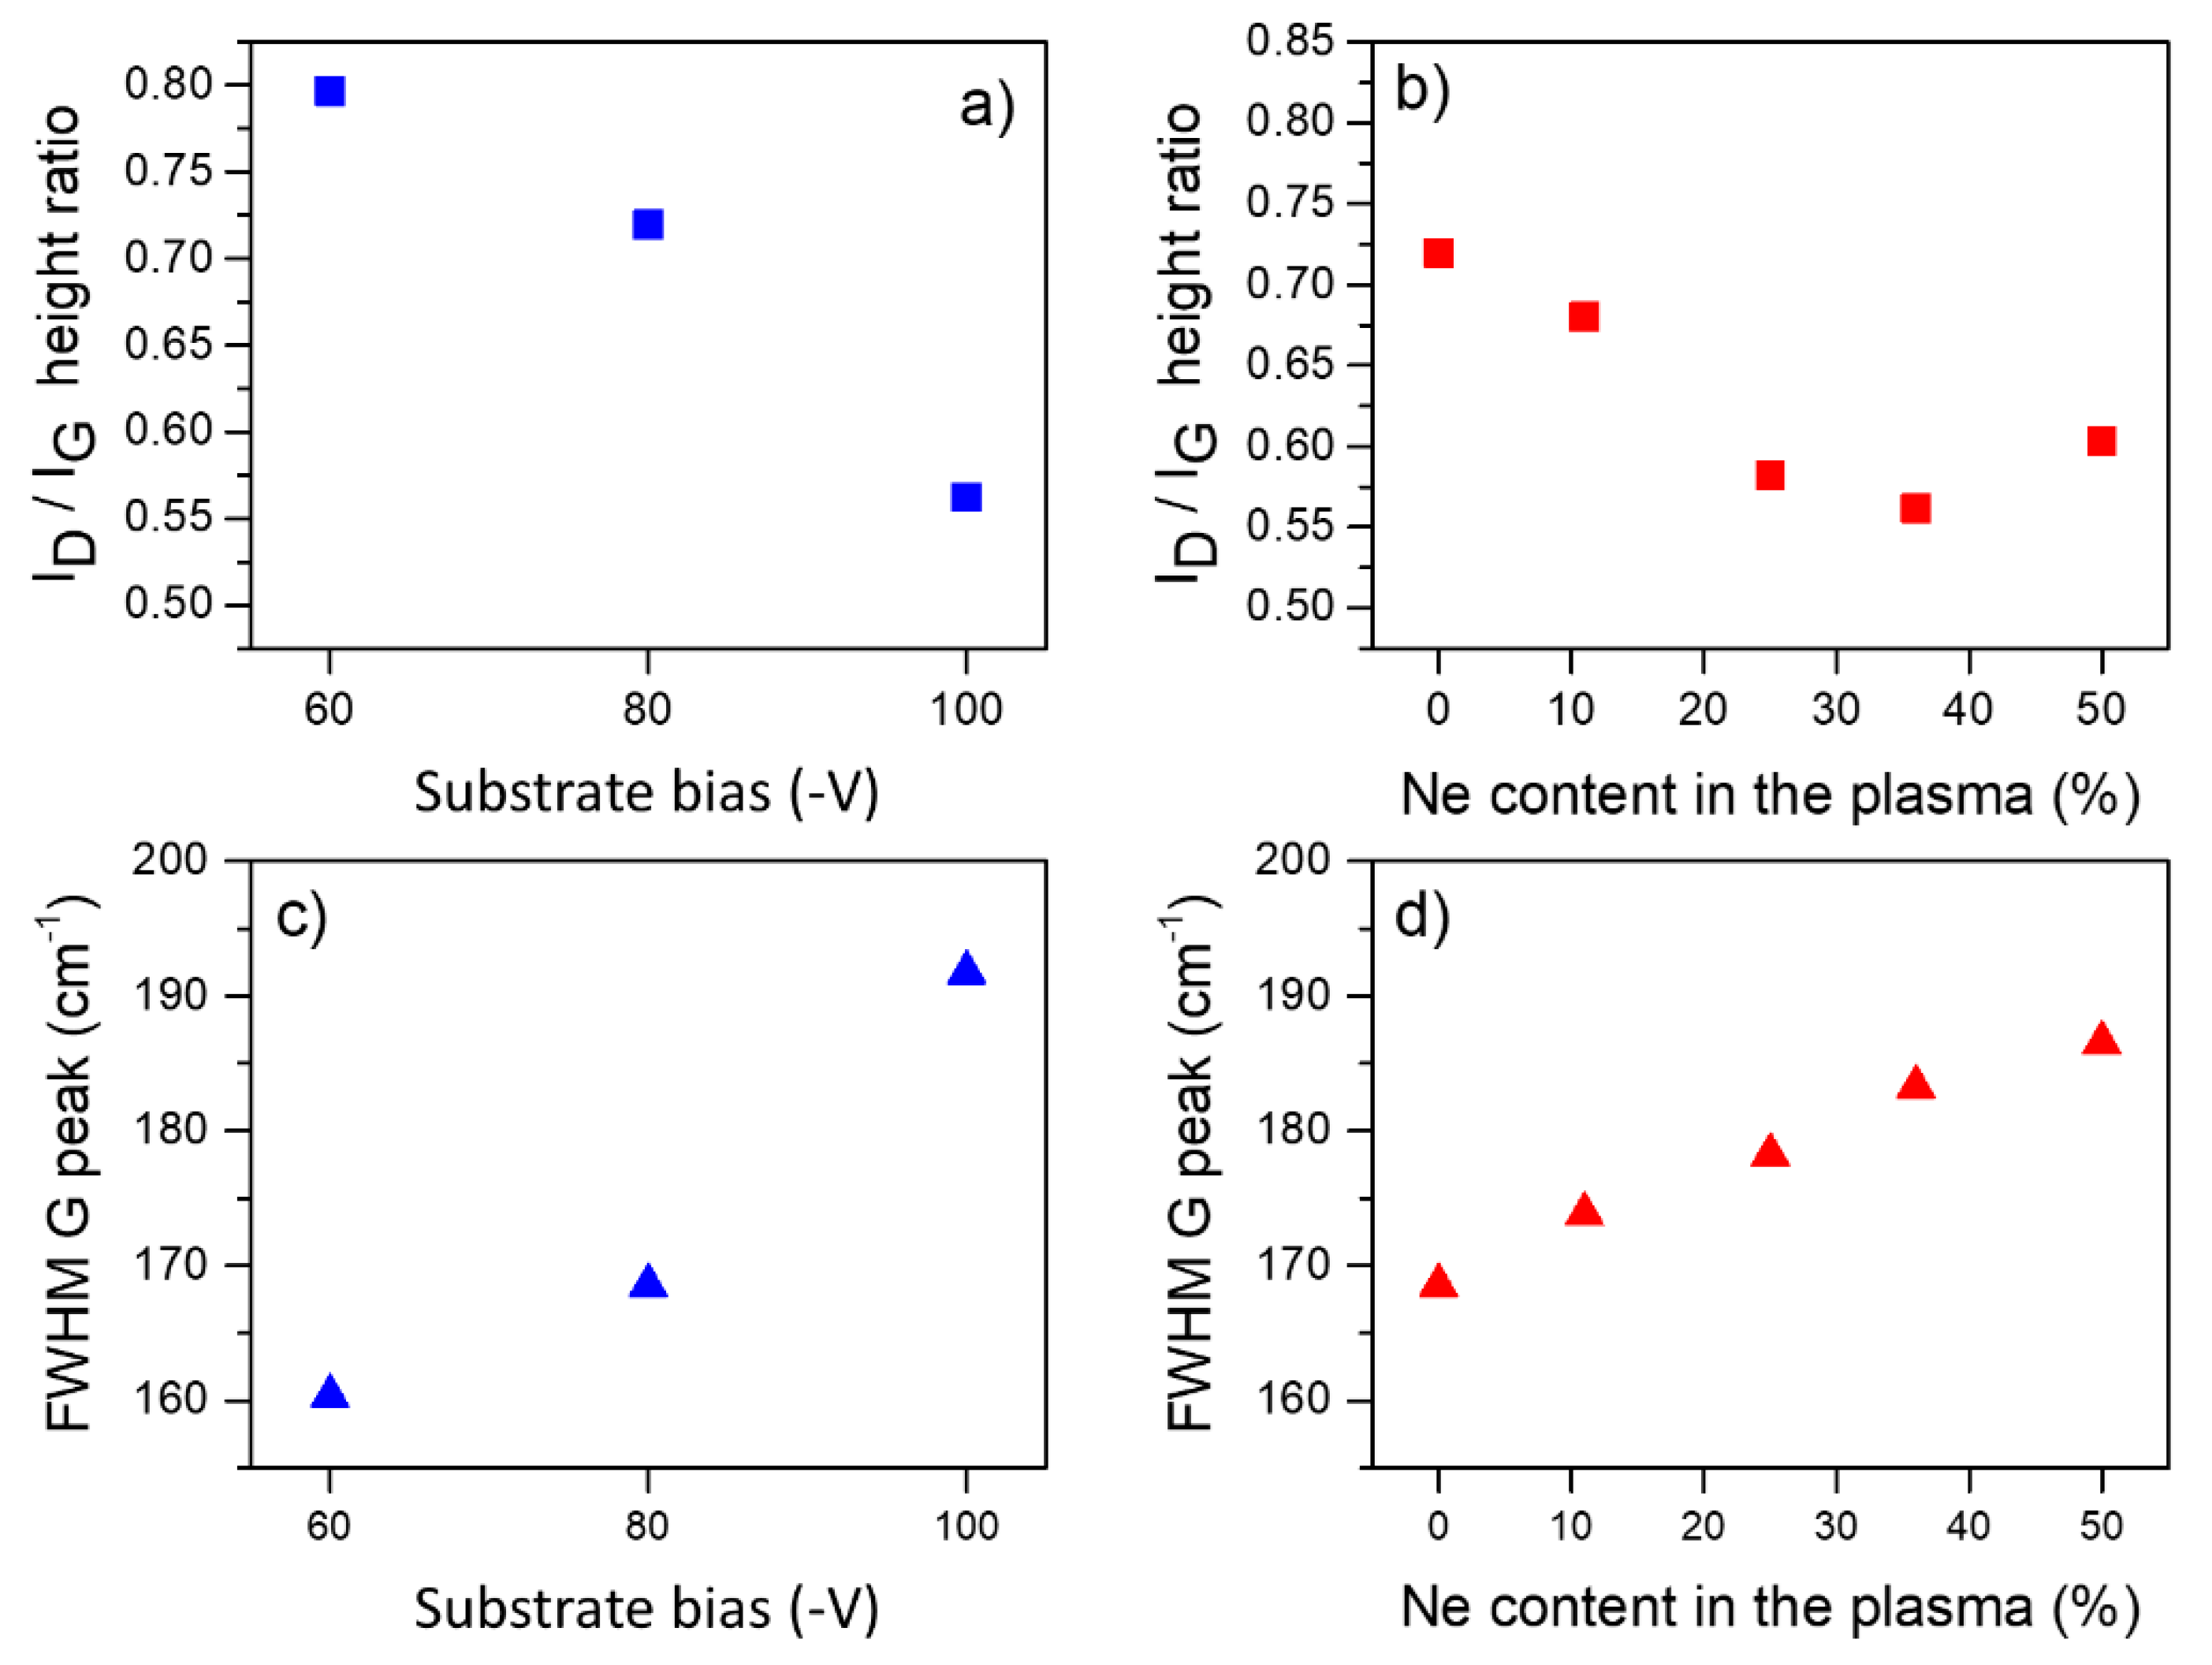
In order to quantify the above described changes, the D and G bands were fitted in this work using Lorentzian and Breit-Wigner-Fano (BWF) line shapes, respectively. In a previous work [29] on the deposition of DLC films by DOMS, the authors showed that the ratio of the intensities (height) of the D and G bands (ID/IG ratio) could be successfully used to probe the sp3 content in the films. The ID/IG ratio obtained from the fit of the Raman spectra of the DLC films deposited in this work are shown as a function of the applied substrate bias in Figure 8a and as a function of the Ne content in the plasma in Figure 8b.
The ID/IG ratio decreases with increasing negative substrate bias from −60 to −100 V. As previously shown by the authors [29], this result is consistent with the deposition of carbon films within the second stage of the Ferrari three-stage model [37] and indicates an increasing amount of sp3 in the deposited films with increasing bias. The ID/IG ratio exhibits an initial decrease with an increasing Ne content up to 25% and stabilizes at higher Ne contents. Once again, according to the Ferrari three-stage model, the initial decrease of the ID/IG ratio denotes an increase of the sp3/sp2 ratio in the films up to ~20%. The stabilization of the ID/IG ratio at higher Ne contents is either due to the deposition of films with similar sp3 contents or corresponds to the deposition of DLC films in stage 3 of the Ferrari three-stage model. In the latter case, the sp3 content in the films still increases as the deposition of a-C films is gradually substituted by ta-C films. The full width at half maximum of the G band (FWHMG) is a probe of the structural disorder of sp2 sites in DLC films, i.e., it is a probe of the physical distortions of both the length and angles of the π bonds [38]. In DLC films deposited with a subplantation of C species, which is the case in this work, the FWMMG is an indirect probe of the sp3 content via distortions of the sp2 sites. The FWHMG values of the DLC films deposited in this work are shown in Figure 8c,d. The FWHMG increases with increasing substrate bias from −60 to −100 V, showing that, in agreement with the ID/IG results, the sp3 content in the films increases with increasing bias. On the other hand, the FWHMG continuously increases with the Ne content in the films, showing that the sp3 content in the films increases, even within the plasma composition region, where similar values of ID/IG were found (above 25% Ne).
One interesting feature in Figure 8 is that increasing the substrate bias from −80 to −100 V results in a very similar variation of the ID/IG ratio compared to that obtained by increasing the Ne content in the plasma from 0 to 50%. On the other hand, although both the bias and Ne content increases also result in a significant increase of the FWHMG, a higher FWHMG is found upon increasing the substrate bias.
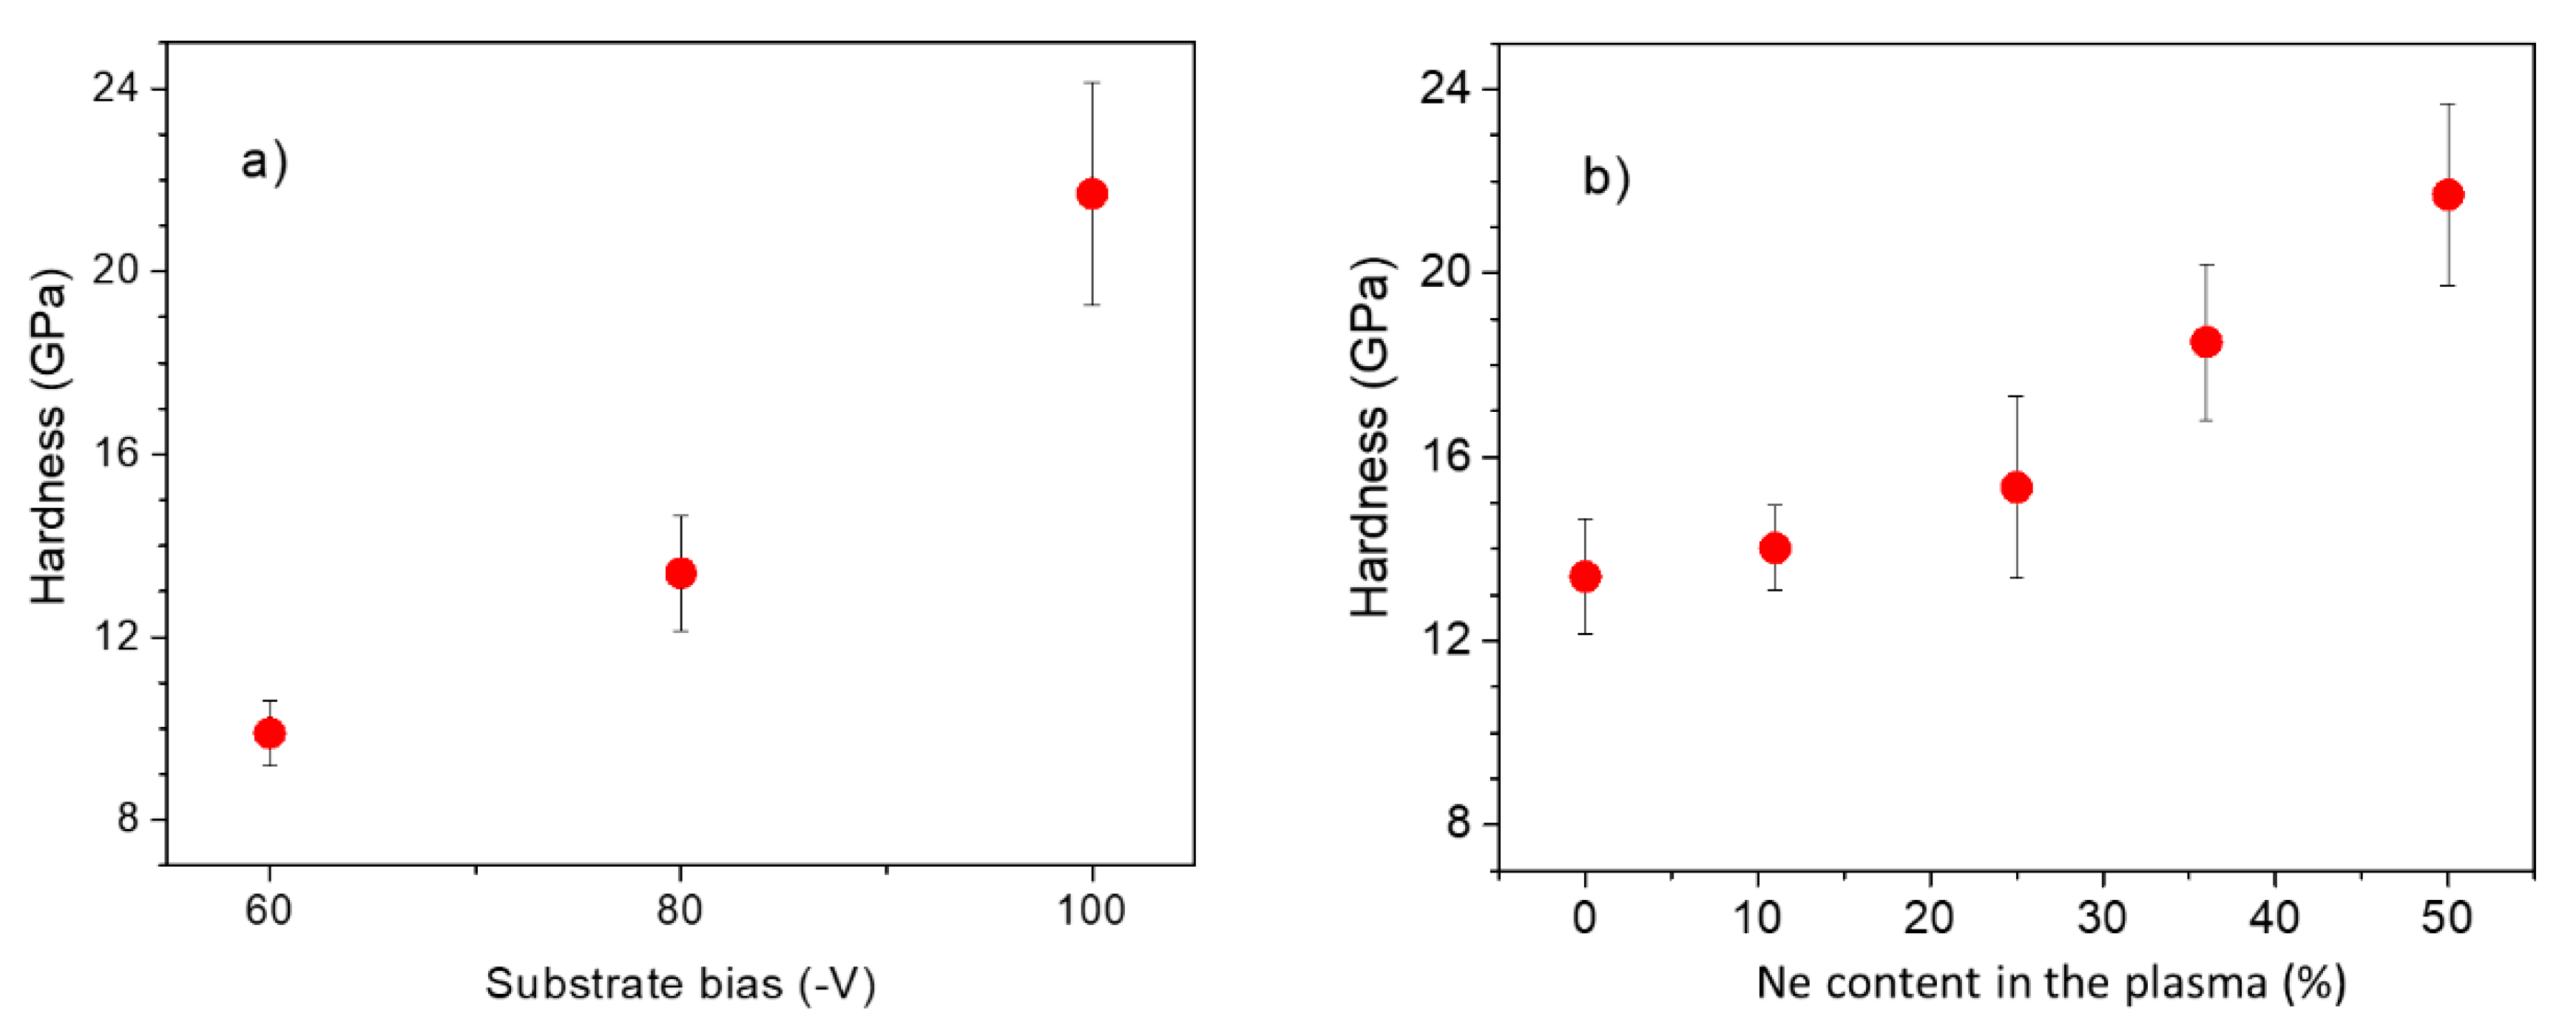
The hardness of the DLC films deposited by DOMS is shown in Figure 9 as a function of both the substrate voltage (Figure 9a) and the Ne content in the plasma (Figure 9b). The hardness of the films increases from close to 10 GPa to almost 22 GPa as the substrate bias is increased from −60 to −100 V. Adding Ne to the plasma does not significantly increase the hardness of the films up to 25%. On the contrary, the further addition of Ne to the plasma resulted in a pronounced increase of hardness up to nearly 22 GPa. Overall, increasing the bias from −80 V to −100 V results in a hardness increase of 8 GPa similar to that obtained by increasing the Ne content in the plasma from 0 to 50%.

4. Conclusions

The evolution of the properties of the DLC films deposited with the addition of increasing amounts of Ne to the plasma points out two different regimes. At lower Ne contents of up to 26%, the hardness and deposition rate increase slowly, while the ID/IG ratio decreases sharply. Above 26% of Ne in the plasma, a pronounced increase in the hardness accompanied by a steep decrease in the deposition rate is observed. In this region, the ID/IG ratio remains approximately constant. These results demonstrate an initial moderate increase of the sp3/sp2 ratio in the films with an increasing Ne content in the plasma, followed by a much steeper increase of this ratio at higher Ne contents. On the other hand, the FWHMG values increase continuously across all Ne compositions, suggesting a continuous decrease of the structural disorder of sp2 sites in DLC films, which indirectly confirms the formation of sp3 sites within the entire Ne composition range. These conclusions agree well with the ISCs obtained in this work. The increasing Ne content was shown to increase both the total number of C ions generated during the DOMS oscillations and the ratio of C ions to ions of the processing gases. Therefore, the growing DLC films are bombarded with an increasing number of C ions when the Ne content is increased. The C bombardment, in turn, enhances the subplantation effect, which is responsible for the formation of sp3 sites. However, there is no clear change in the ISC characteristics corresponding to the pronounced change in the film evolution at 26% Ne.
The feasibility of the substrate biasing synchronized with the target pulses in the DOMS process was also evaluated. In pure Ar, the substrate biasing should be confined to the time interval roughly between 25 and 40 µs after the pulse start. This will maximize the C+/Ar+ ratio of energetic ions bombarding the substrate and minimize the formation of film stresses by avoiding unnecessary bombardment by energetic Ar+ ions both during plasma ignition and in the afterglow. Similar conclusions can be drawn from the results obtained in Ar + Ne plasmas. However, adding Ne to the plasma shortens the traveling time of the carbon species towards the substrate. Therefore, the maxima of arriving C and gaseous fluxes are much closer to each other, and the separation of gaseous and carbon ions becomes more difficult. In conclusion, bias synchronization of the DOMS pulse has to be optimized as a function of the composition of the background gas.

Supplementary Materials

The following are available online at https://www.mdpi.com/2079-6412/10/10/914/s1, Figure S1: SEM micrographs (ap) of DLC coatings.

Author Contributions

Conceptualization, J.O.; methodology, R.S. and F.F.; validation, J.O., R.S., and F.F.; formal analysis, J.O.; investigation, J.O.; resources, A.C. writing—original draft preparation, J.O.; writing—review and editing, T.K., C.V., and F.F.; project administration, J.O.; funding acquisition, A.C. All authors have read and agreed to the published version of the manuscript.

Funding

This research was funded by FEDER funds through the program COMPETE—Programa Operacional Factores de Competitividade—and by national funds through FCT—Fundação para a Ciência e a Tecnologia—under the projects UIDB/00285/2020, HardRings (AAC n° 02/SAICT/2017, project n° 29122), and GREENCOAT-M-ERA-NET2/0014/2016, as well as M-ERA Net project TANDEM through the Romanian Research and Innovation Ministry, UEFISCDI project No 56/2016, and PROINSTITUTIO Project No. 19PFE/17.10.2018.

Conflicts of Interest

The authors declare no conflict of interest.

Abbreviations

-SymbolDescription
Discharge Pulse ParametersDDOMS pulse duration
Fpulse frequency
Toscillation period
tonoscillation on-time
Vposcillation peak voltage
Iposcillation peak current
Pppeak power
Patime-averaged power
DCintcharging voltage
ttime
Deposition TechniquesDCMSdirect current magnetron sputtering
HiPIMShigh power impulse magnetron sputtering
DOMSdeep oscillation magnetron sputtering
PLDpulsed laser deposition
FCAfiltered cathodic arc deposition
Flat ProbeISCion saturation current
ERMSenergy resolved mass spectroscopy
SCDstime-resolved substrate current densities
Teelectron temperature
Raman SpectroscopyGgraphitic carbon band
Ddisordered carbon band
ID/IGratio of the intensities (height) of D and G bands
FWHMGfull width at half maximum of the G band
BWFBreit-Wigner-Fano
SEMscanning electron microscopy
DLCdiamond-like carbon
ta-Ctetragonal amorphous carbon

References

  1. Veerasamy, V.; Amaratunga, G.; Milne, W.; Robertson, J.; Fallon, P. Influence of carbon ion energy on properties of highly tetrahedral diamond-like carbon. J. Non-Cryst. Solids 1993, 164, 1111–1114. [Google Scholar] [CrossRef]
  2. Weissmantel, S.; Reisse, G.; Rost, D. Preparation of superhard amorphous carbon films with low internal stress. Surf. Coat. Technol. 2004, 188, 268–273. [Google Scholar] [CrossRef]
  3. Logothetidis, S.; Gioti, M.; Patsalas, P.; Charitidis, C. Insights on the deposition mechanism of sputtered amorphous carbon films. Carbon 1999, 37, 765–769. [Google Scholar] [CrossRef]
  4. Robertson, J. Plasma deposition of diamond-like carbon. Jpn. J. Appl. Phys. 2011, 50, 01AF01. [Google Scholar] [CrossRef]
  5. McKenzie, D.; Muller, D.; Pailthorpe, B. Compressive-stress-induced formation of thin-film tetrahedral amorphous carbon. Phys. Rev. Lett. 1991, 67, 773. [Google Scholar] [CrossRef]
  6. Jacobs, R. 10—Industrial development of carbon-based coatings. In Proceedings of the International Conference on Metallurgical Coatings and Thin Films (ICMCTF), San Diego, CA, USA, 24–28 April 2017. [Google Scholar]
  7. Chhowalla, M. Thick, well-adhered, highly stressed tetrahedral amorphous carbon. Diam. Relat. Mater. 2001, 10, 1011–1016. [Google Scholar] [CrossRef]
  8. Tucker, M.; Ganesan, R.; McCulloch, D.; Partridge, J.; Stueber, M.; Ulrich, S.; Bilek, M.; McKenzie, D.; Marks, N. Mixed-mode high-power impulse magnetron sputter deposition of tetrahedral amorphous carbon with pulse-length control of ionization. J. Appl. Phys. 2016, 119, 155303. [Google Scholar] [CrossRef]
  9. Lattemann, M.; Abendroth, B.; Moafi, A.; McCulloch, D.; McKenzie, D. Controlled glow to arc transition in sputtering for high rate deposition of carbon films. Diam. Relat. Mater. 2011, 20, 68–74. [Google Scholar] [CrossRef]
  10. Nakao, S.; Yukimura, K.; Nakano, S.; Ogiso, H. DLC coating by HiPIMS: The influence of substrate bias voltage. IEEE Trans. Plasma Sci. 2013, 41, 1819–1829. [Google Scholar] [CrossRef]
  11. Santiago, J.; Fernández-Martínez, I.; Kozák, T.; Capek, J.; Wennberg, A.; Molina-Aldareguia, J.; Bellido-González, V.; González-Arrabal, R.; Monclús, M. The influence of positive pulses on HiPIMS deposition of hard DLC coatings. Surf. Coat. Technol. 2019, 358, 43–49. [Google Scholar] [CrossRef]
  12. Sarakinos, K.; Alami, J.; Konstantinidis, S. High power pulsed magnetron sputtering: A review on scientific and engineering state of the art. Surf. Coat. Technol. 2010, 204, 1661–1684. [Google Scholar] [CrossRef]
  13. Ferreira, F.; Serra, R.; Oliveira, J.; Cavaleiro, A. Effect of peak target power on the properties of Cr thin films sputtered by HiPIMS in deep oscillation magnetron sputtering (DOMS) mode. Surf. Coat. Technol. 2014, 258, 249–256. [Google Scholar] [CrossRef]
  14. Ferreira, F.; Sousa, C.; Cavaleiro, A.; Anders, A.; Oliveira, J. Phase tailoring of tantalum thin films deposited in deep oscillation magnetron sputtering mode. Surf. Coat. Technol. 2017, 314, 97–104. [Google Scholar] [CrossRef] [Green Version]
  15. Lin, J.; Moore, J.J.; Sproul, W.D.; Mishra, B.; Wu, Z. Modulated pulse power sputtered chromium coatings. Thin Solid Films 2009, 518, 1566–1570. [Google Scholar] [CrossRef]
  16. Samuelsson, M.; Lundin, D.; Jensen, J.; Raadu, M.A.; Gudmundsson, J.T.; Helmersson, U. On the film density using high power impulse magnetron sputtering. Surf. Coat. Technol. 2010, 205, 591–596. [Google Scholar] [CrossRef] [Green Version]
  17. Helmersson, U.; Lattemann, M.; Bohlmark, J.; Ehiasarian, A.P.; Gudmundsson, J.T. Ionized physical vapor deposition (IPVD): A review of technology and applications. Thin Solid Films 2006, 513, 1–24. [Google Scholar] [CrossRef] [Green Version]
  18. Sarakinos, K.; Braun, A.; Zilkens, C.; Mráz, S.; Schneider, J.; Zoubos, H.; Patsalas, P. Exploring the potential of high power impulse magnetron sputtering for growth of diamond-like carbon films. Surf. Coat. Technol. 2012, 206, 2706–2710. [Google Scholar] [CrossRef] [Green Version]
  19. DeKoven, B.; Ward, P.; Weiss, R.E.; Christie, D.J.; Scholl, R.A.; Sproul, W.D.; Tomasel, F.; Anders, A. Carbon thin film deposition using high power pulsed magnetron sputtering. In Proceedings of the 46th Annual Technical Conference Proceedings of the Society of Vacuum Coaters, San Francisco, CA, USA, 3 May 2003. [Google Scholar]
  20. Aijaz, A.; Sarakinos, K.; Lundin, D.; Brenning, N.; Helmersson, U. A strategy for increased carbon ionization in magnetron sputtering discharges. Diam. Relat. Mater. 2012, 23, 1–4. [Google Scholar] [CrossRef] [Green Version]
  21. Bobzin, K.; Brögelmann, T.; Kalscheuer, C.; Engels, M. Synthesis of aC coatings by HPPMS using Ar, Ne and He as process gases. Surf. Coat. Technol. 2016, 308, 80–89. [Google Scholar] [CrossRef]
  22. Bobzin, K.; Brögelmann, T.; Kruppe, N.; Engels, M. Advanced deposition of hard aC: Me coatings by HPPMS using Ne as process gas. Surf. Coat. Technol. 2017, 332, 242–252. [Google Scholar] [CrossRef]
  23. Aijaz, A.; Ferreira, F.; Oliveira, J.; Kubart, T. Mechanical properties of hydrogen free diamond-like carbon thin films deposited by high power impulse magnetron sputtering with Ne. Coatings 2018, 8, 385. [Google Scholar] [CrossRef] [Green Version]
  24. Palmucci, M.; Britun, N.; Konstantinidis, S.; Snyders, R. Rarefaction windows in a high-power impulse magnetron sputtering plasma. J. Appl. Phys. 2013, 114, 113302. [Google Scholar] [CrossRef]
  25. Villamayor, M.M.S.; Keraudy, J.; Shimizu, T.; Viloan, R.P.B.; Boyd, R.; Lundin, D.; Greene, J.E.; Petrov, I.; Helmersson, U. Low temperature (T s/T m< 0.1) epitaxial growth of HfN/MgO (001) via reactive HiPIMS with metal-ion synchronized substrate bias. J. Vac. Sci. Technol. A Vac. Surf. Film. 2018, 36, 061511. [Google Scholar] [CrossRef] [Green Version]
  26. Greczynski, G.; Lu, J.; Jensen, J.; Petrov, I.; Greene, J.E.; Bolz, S.; Kölker, W.; Schiffers, C.; Lemmer, O.; Hultman, L. Metal versus rare-gas ion irradiation during Ti1−xAlxN film growth by hybrid high power pulsed magnetron/dc magnetron co-sputtering using synchronized pulsed substrate bias. J. Vac. Sci. Technol. A Vac. Surf. Film. 2012, 30, 061504. [Google Scholar] [CrossRef] [Green Version]
  27. Cemin, F.; Abadias, G.; Minea, T.; Lundin, D. Tuning high power impulse magnetron sputtering discharge and substrate bias conditions to reduce the intrinsic stress of TiN thin films. Thin Solid Films 2019, 688, 137335. [Google Scholar] [CrossRef]
  28. Aijaz, A.; Kubart, T. Ion induced stress relaxation in dense sputter-deposited DLC thin films. Appl. Phys. Lett. 2017, 111, 051902. [Google Scholar] [CrossRef]
  29. Ferreira, F.; Aijaz, A.; Kubart, T.; Cavaleiro, A.; Oliveira, J. Hard and dense diamond like carbon coatings deposited by deep oscillations magnetron sputtering. Surf. Coat. Technol. 2018, 336, 92–98. [Google Scholar] [CrossRef]
  30. Vitelaru, C.; Aijaz, A.; Parau, A.C.; Kiss, A.E.; Sobetkii, A.; Kubart, T. Discharge runaway in high power impulse magnetron sputtering of carbon: The effect of gas pressure, composition and target peak voltage. J. Phys. D Appl. Phys. 2018, 51, 165201. [Google Scholar] [CrossRef]
  31. Ziegler, J.F.; Ziegler, M.D.; Biersack, J.P. SRIM–The stopping and range of ions in matter (2010). Nucl. Instrum. Methods Phys. Res. Sect. B Beam Interact. Mater. Atoms 2010, 268, 1818–1823. [Google Scholar] [CrossRef] [Green Version]
  32. Britun, N.; Minea, T.; Konstantinidis, S.; Snyders, R. Plasma diagnostics for understanding the plasma–surface interaction in HiPIMS discharges: A review. J. Phys. D Appl. Phys. 2014, 47, 224001. [Google Scholar] [CrossRef] [Green Version]
  33. Greczynski, G.; Zhirkov, I.; Petrov, I.; Greene, J.E.; Rosen, J. Time evolution of ion fluxes incident at the substrate plane during reactive high-power impulse magnetron sputtering of groups IVb and VIb transition metals in Ar/N2. J. Vac. Sci. Technol. A Vac. Surf. Films 2018, 36, 020602. [Google Scholar] [CrossRef] [Green Version]
  34. Greczynski, G.; Hultman, L. Time and energy resolved ion mass spectroscopy studies of the ion flux during high power pulsed magnetron sputtering of Cr in Ar and Ar/N2 atmospheres. Vacuum 2010, 84, 1159–1170. [Google Scholar] [CrossRef] [Green Version]
  35. Schmidt, S.; Czigány, Z.; Greczynski, G.; Jensen, J.; Hultman, L. Ion mass spectrometry investigations of the discharge during reactive high power pulsed and direct current magnetron sputtering of carbon in Ar and Ar/N2. J. Appl. Phys. 2012, 112, 013305. [Google Scholar] [CrossRef] [Green Version]
  36. Schmidt, S.; Czigány, Z.; Greczynski, G.; Jensen, J.; Hultman, L. Influence of inert gases on the reactive high power pulsed magnetron sputtering process of carbon-nitride thin films. J. Vac. Sci. Technol. A Vac. Surf. Films 2013, 31, 011503. [Google Scholar] [CrossRef]
  37. Ferrari, A.C.; Robertson, J. Interpretation of Raman spectra of disordered and amorphous carbon. Phys. Rev. B 2000, 61, 14095. [Google Scholar] [CrossRef] [Green Version]
  38. Ferrari, A.; Robertson, J. Resonant Raman spectroscopy of disordered, amorphous, and diamondlike carbon. Phys. Rev. B 2001, 64, 075414. [Google Scholar] [CrossRef] [Green Version]
Figure 1. Typical deep oscillation magnetron sputtering (DOMS) target voltage (a) and target current (b) oscillating waveforms obtained by sputtering a carbon target in pure Ar. Each pulse consists of 13 oscillations separated by 130 µs, as shown in the insets. The corresponding substrate current density (c) measured with the flat probe with a polarizing voltage of −90 V (P = 0.7 Pa; DCint = 400 V; F = 266 Hz; D = 1690 μs; ton = 4 μs; T = 130 μs).
Coatings 10 00914 g001
Figure 2. Time-resolved substrate current density (mA/cm2) for substrate biases between 0 and −120 V obtained with Pp = 51.2 kW (a), Pp = 71.8 kW (b), and Pp = 88.3 kW (c). Maximum of the SCD curves as a function of the peak power and substrate bias (d).
Coatings 10 00914 g002
Figure 3. Ion saturation current (a), and area and maximum values of the ion saturation current (ISC) (b) as a function of the peak power.
Coatings 10 00914 g003
Figure 4. Time-resolved current densities at the substrate for substrate biases between 0 and −120 V obtained with 20% Ne (a), 40% Ne (b), and 60% Ne (c) in the plasma. Maximum of the SCD curves as a function of the Ne content and substrate bias (d).
Coatings 10 00914 g004
Figure 5. Ion saturation current (a), and area and maximum values of the ISC (b) as a function of the Ne content in the plasma.
Coatings 10 00914 g005
Figure 6. Deposition rate of the DLC films as a function of the substrate bias (a) and the Ne content in the plasma (b).
Coatings 10 00914 g006
Figure 7. Raman spectra of the DLC films as a function of the substrate bias (a) and the Ne content in the plasma (b).
Coatings 10 00914 g007
Figure 8. IG/ID height ratio (a,b) and full width at half maximum of the G band (FWHMG) (c,d) as a function of the substrate bias and the Ne content in the plasma.
Coatings 10 00914 g008
Figure 9. Hardness of the DLC coatings as a function of the substrate bias (a) and the Ne content in the plasma (b).
Coatings 10 00914 g009
Table 1. Experimental parameters used for the deposition of Diamond-like Carbon (DLC) films in pure Ar plasma.
Pressure (Pa)Vbias (V)Vp (V)Ip (A)PP (kW)F (Hz)
0.8−6013986591251
−8014016591250
−10014006692253
Table 2. Experimental parameters used for the deposition of DLC films in Ar + Ne plasma.
Pressure (Pa)Vb (V)Ne (%)Vp (V)Ip (A)PP (kW)Fi (Hz)
0.8−801113967098253
−8025139872101254
−8036139578109252
−8050139580112250
Table 3. Experimental conditions used for the flat probe substrate current density (SCD) measurements.
-Ne (%)Vp (V)Ip (A)Pp (kW)
Peak power study011374551.2
0123058.471.8
0132566.688.3
Ne content study20%113847.153.6
40%113549.856.6
60%111951.257.2
Table 4. Sputtering yield and average energy of carbon under bombardment with Ar+ and Ne+ as a function of the ions’ energy, as calculated with the software package SRIM.
Ion Energy (eV)Ar+ IonsNe+ Ions
Sputtering YieldC Atoms av. Energy (eV)Sputtering YieldC Atoms av. Energy (eV)
3000.067.20.1010.8
6000.1510.40.1914.7
9000.2312.60.2517.3
12000.2914.30.3019.4
15000.3415.70.3321.4