Abstract
Background. Antimicrobial resistance (AMR) poses a significant global health threat, necessitating a deeper understanding of bacterial adaptation mechanisms. Introduction. This study investigates the genotypic and phenotypic evolutionary trajectories of Escherichia coli under meropenem and gentamicin selection, and it benchmarks these findings against florfenicol-evolved strains. Methodology. Utilizing a downsized, three-layer acrylic modified “Microbial Evolution and Growth Arena (MEGA-plate) system”—scaled to 40 × 50 cm for sterile handling and uniform 37 °C incubation—we tracked adaptation over 9–13 days, enabling real-time visualization of movement across antibiotic gradients. Results. Meropenem exposure elicited pronounced genetic heterogeneity and morphological remodeling (filamentous and circular forms), characteristic of SOS-mediated division arrest and DNA-damage response. In contrast, gentamicin exposure produced a uniform resistance gene profile and minimal shape changes, suggesting reliance on conserved defenses without major morphological adaptation. Comprehensive genomic analysis revealed a core resistome of 22 chromosomal loci shared across all three antibiotics, highlighting potential cross-resistance and the central roles of baeR, gadX, and marA in coordinating adaptive responses. Gene ontology enrichment underscored the positive regulation of gene expression and intracellular signaling as key themes in resistance evolution. Discussion. Our findings illustrate the multifaceted strategies E. coli employs—combining metabolic flexibility with sophisticated regulatory networks—to withstand diverse antibiotic pressures. This study underscores the utility of the MEGA-plate system in dissecting spatiotemporal AMR dynamics in a controlled yet ecologically relevant context. Conclusions. The divergent responses to meropenem and gentamicin highlight the complexity of resistance development and reinforce the need for integrated, One Health strategies. Targeting shared regulatory hubs may open new avenues for antimicrobial intervention and help preserve the efficacy of existing drugs.
1. Introduction
Antimicrobial resistance (AMR) has emerged as one of the foremost global health challenges, projected to cause up to 10 million deaths per year by 2050—surpassing cancer mortality—and impose an economic burden to the global economy exceeding USD 100 trillion [1]. At its core, resistance reflects Darwinian selection: spontaneous genetic variants (whether chromosomal mutations or mobile element acquisitions) that survive antibiotic exposure expand and dominate the population [2]. Excessive and often inappropriate antibiotic use in human medicine, agriculture, and animal husbandry has accelerated this process [3]. Overprescription, patient misuse, and the use of antibiotics as growth promoters in livestock create selective pressures that foster the emergence and spread of resistant strains [4].
A key factor in the evolution of resistance is the phenotypic and genotypic adaptability of bacteria, propelled by high reproduction rates, horizontal gene transfer, and mutations [5]. Bacteria can quickly acquire and disseminate resistance determinants across various lineages and environments [6]. Sub-inhibitory antibiotic concentrations—common in clinical settings with suboptimal dosing and in the environment via runoff—select for resistant phenotypes and enrich multidrug-resistant (MDR) populations [7,8].
Understanding the evolutionary mechanisms behind AMR hinges on elucidating the role of chromosomal loci encoding resistance-associated functions—hereafter referred to as antibiotic resistance genes (ARGs)—which are central to this arms race. Many of these loci are ancient and embedded in basic bacterial functions, but under selective pressure can be co-opted to confer resistance [9]. Efflux pumps, for instance, are highly conserved transport proteins that expel toxic substances, including antibiotics, from the cell [10]. Upregulation or mutations in these systems can amplify resistance [11]. Thus, examining ARGs in both normal physiology and the evolution of resistance is crucial for unraveling AMR and MDR.
Resistance becomes more complex when different antibiotic classes are involved. Carbapenems, including imipenem and meropenem, are last-resort agents against severe Gram-positive and Gram-negative infections due to their broad spectrum, resilience to most β-lactamases, and low cytotoxicity [12]. However, carbapenem-resistant Enterobacteriaceae (CRE) have emerged globally, often linked to high morbidity and mortality [13]. The principal resistance mechanisms involve carbapenemase production, efflux pumps, and porin loss, which prevents antibiotic entry [14,15].
Meropenem is effective against Enterobacteriaceae such as Citrobacter freundii, Enterobacter aerogenes, Enterobacter cloacae, Escherichia coli, Klebsiella pneumoniae, Klebsiella oxytoca, Morganella morganii, Proteus vulgaris, and Serratia marcescens [16]. By binding to PBPs and blocking cell wall synthesis, it causes bacterial cell death [17]. The emergence of meropenem-resistant strains presents a major threat, restricting treatment to less effective or more toxic alternatives [18].
Aminoglycosides, including gentamicin, amikacin, tobramycin, neomycin, and streptomycin, remain vital for treating serious Gram-negative infections [19]. Gentamicin is commonly used against E. coli, K. pneumoniae, Serratia spp., Enterobacter spp., and Pseudomonas aeruginosa [20]. It binds the 30S ribosomal subunit, disrupting protein synthesis and causing the production of truncated proteins that may be integrated into the cell wall, leading to cell impermeability, oxidative stress, and ultimately bacterial death [21,22]. Resistance to aminoglycosides arises through diverse mechanisms, including enzymatic drug modification, target site mutations, reduced uptake, and increased efflux [23].
Veterinary antibiotic use further complicates the AMR crisis. Florfenicol, a synthetic derivative of chloramphenicol, is widely employed in livestock and aquaculture for its broad-spectrum activity against respiratory and enteric infections. Like chloramphenicol, it inhibits protein synthesis by binding the 50S ribosomal subunit, and resistance commonly arises via antibiotic modification and efflux pumps [24,25]. Although florfenicol is not approved for human therapy, its use fosters cross-resistance and the transfer of ARGs to human pathogens, posing serious public health risks [26]. Moreover, agricultural application of antibiotics contributes substantially to the environmental ARG reservoir, facilitating dissemination through the food chain and other routes [27]. In this study, we include florfenicol as a veterinary benchmark to compare the evolutionary trajectories of chromosomal resistance loci across human and animal antibiotic exposures.
Clarifying how E. coli and other bacteria evolve resistance under varying antibiotic pressures is vital for guiding treatment and devising interventions to curb AMR. The MEGA-plate (Microbial Evolution and Growth Arena) experimental platform allows researchers to observe bacterial evolution in a spatially structured environment featuring gradient antibiotic concentrations [5], simulating real-world scenarios—clinical treatments, agricultural applications, and environmental exposures—where bacteria encounter fluctuating antibiotic levels. Previous MEGA-plate studies have documented the rapid emergence of resistance and the spatial dynamics of evolving bacterial populations. These works spotlight the roles of genetic mutation, horizontal gene transfer, and selective sweeps [5,24]. Nevertheless, comparative analyses of how diverse antibiotics shape resistance evolution in the same species are limited. Here, we incorporate genomic profiles from a published florfenicol evolution experiment chosen for its identical MEGA-plate design and sequencing pipeline. By benchmarking our meropenem and gentamicin results against these externally generated, but methodologically matched, florfenicol data, we can pinpoint cross-class resistome elements under truly comparative conditions.
This study aims to decipher the genotypic and phenotypic evolutionary trajectories of E. coli under the selective pressures of meropenem and gentamicin—key antibiotics in human medicine—and compare these results with florfenicol, a major veterinary antibiotic. By employing a modified MEGA-plate method, we seek to identify the mutational pathways, ARG dynamics, and resistance strategies that enable AMR and MDR. Our comparative approach will provide insights into how different antibiotic classes drive bacterial adaptation and resistance evolution, contributing to a broader understanding essential for designing effective strategies against AMR. While MEGA-plate evolution platforms have been used to visualize resistance emergence in single-drug contexts, our study innovates by systematically comparing two distinct clinical antibiotics (meropenem vs. gentamicin) alongside a veterinary benchmark (florfenicol data), thereby revealing both shared and antibiotic-specific adaptation pathways.
2. Results
2.1. Spatiotemporal Adaptation Dynamics
Two independent Escherichia coli lineages were evolved on a modified MEGA-plate under meropenem and gentamicin selection, with assays running 9 and 13 days, respectively (Figure 1). Each plate was divided into five zones corresponding to 0×, 1×, 10×, 100×, and 1000× the minimum inhibitory concentration (MIC), set at 0.125 µg/mL for meropenem and 4 µg/mL for gentamicin. In the meropenem experiment (Figure 1A), all lineages traversed the gradient within 9 days, whereas gentamicin-exposed populations (Figure 1B) required the full 13 days to reach the highest concentration. Meropenem-selected fronts advanced rapidly through the gradient, whereas gentamicin-exposed populations progressed more slowly but with striking uniformity.
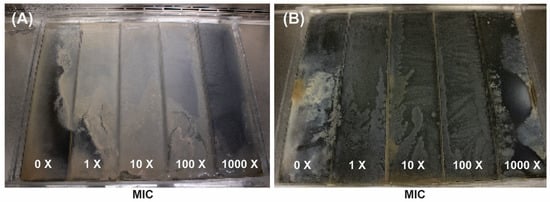
Figure 1.
MEGA-plate experiments displaying bacterial colonization and adaptation across gradients of increasing antibiotic concentrations (0× to 1000× the minimum inhibitory concentration [MIC]) for meropenem (A) and gentamicin (B). (A) shows results from a 9-day incubation with meropenem, while (B) shows results from a 13-day incubation with gentamicin. Both images reveal how bacterial populations progressively adapt and spread into higher antibiotic concentrations over time.
2.2. Variant Sampling and Sequencing
To define the genetic changes driving adaptation, we selected a total of eight meropenem-resistant and ten gentamicin-resistant isolates drawn across the five MIC zones (0×, 1×, 10×, 100×, 1000×). Genomic DNA from all eighteen isolates was deep-sequenced and mapped to the Escherichia coli ATCC 11229 reference. Variants were called using conservative filters (≥30× coverage; ≥75% allele frequency) and then annotated via the CARD’s RGI pipeline (≥90% identity/coverage). The CARD flagged only native chromosomal loci—no foreign contigs or mobile elements were detected—and from these loci we identified high-confidence mutations (Table 1).

Table 1.
Heatmap illustrating the presence (red) or absence (blue) of 64 antibiotic resistance genes (ARGs) in E. coli exposed to florfenicol, gentamicin, and meropenem. Each row represents an ARG, and each column corresponds to one of the three antibiotics. The red boxes indicate the detected presence of the corresponding ARG under that antibiotic, while the blue boxes indicate its absence.
2.3. Construction of ARG Databases
The CARD’s RGI pipeline identified 57 unique chromosomal resistance loci in meropenem-evolved genomes and 37 in gentamicin-evolved genomes (Supplementary Tables S1 and S2). These span RND (e.g., acrAB–TolC, acrS), MFS (e.g., emrE, eptA), SMR (qacJ), ABC (msbA) efflux families, global regulators (marA, soxR, gadX, baeR), two-component systems (evgA/evgS, baeS), and stress-response enzymes (hns, vanG). A complete breakdown of all CARD hits, mutation frequencies, and locus-by-antibiotic distributions is provided in the Supplementary Materials (Materials and Methods, Bioinformatic Analysis).
2.4. Distribution and Clustering of ARGs
Hierarchical clustering of presence–absence profiles revealed two clear subgroups in each dataset (Figure 2A,B and Figure 3A,B): a core cluster enriched for efflux regulators and SOS-linked loci (e.g., acrS, baeR, hns) versus a more variable cluster carrying additional stress-response or inactivation genes. In the meropenem dataset, the core cluster comprises M2, M4, M6, and M7, while M1, M3, M5, and M8 form the divergent group; gentamicin lineages split similarly around their shared efflux-centric resistome. Notably, acrS, eptA, emrE, evgA, hns, and vanG were conserved across all eight meropenem-evolved samples, while leuO and the locus annotated as EC-13 appeared exclusively in M1, and uhpT was uniquely retained in M8 (Supplementary Table S1).
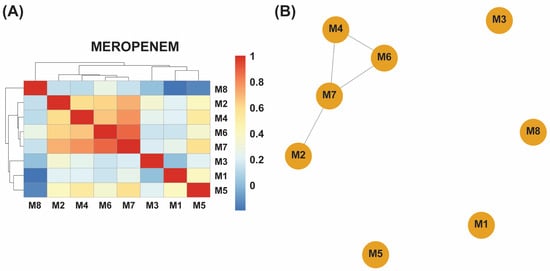
Figure 2.
(A) A hierarchical clustering heatmap of antibiotic resistance genes (ARGs) detected in eight meropenem-exposed samples (M1–M8). The blue-to-red color scale represents the relative abundance or presence frequency of each ARG, revealing two distinct clusters: samples M2, M4, M6, and M7 share similar ARG profiles, whereas M1, M3, M5, and M8 display greater genetic variability. (B) An association network of the same samples further illustrates these relationships, with the closely connected cluster (M2, M4, M6, and M7) reflecting similar ARG compositions and the more isolated samples (M1, M3, M5, and M8) indicating higher ARG diversity in response to meropenem exposure.
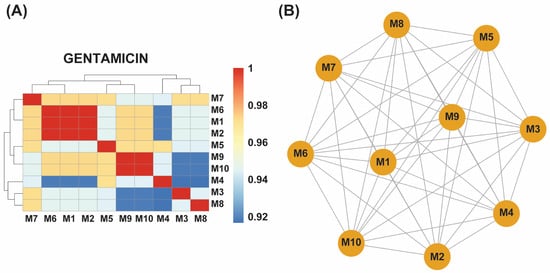
Figure 3.
(A) A hierarchical clustering heatmap showing antibiotic resistance genes (ARGs) detected in ten gentamicin-exposed samples (M1–M10). The blue-to-red color scale indicates the relative abundance or presence frequency of each ARG. Samples M1, M2, and M6 form a distinct cluster with identical ARG profiles, while M9 and M10 exhibit another shared cluster. Other samples (M3, M4, M5, M7, and M8) correlate closely with these clusters, indicating a more uniform ARG distribution in response to gentamicin exposure. (B) An association network of the gentamicin-exposed samples further illustrates the relationships among their ARG profiles. M1, M2, and M6 are highly interconnected, reflecting identical ARG profiles, while M9 and M10 are similarly grouped. The remaining samples show a strong correlation with these clusters, confirming a more uniform resistance response across all ten samples.
By contrast, gentamicin-evolved isolates displayed greater homogeneity. Three samples (M1, M2, M6) shared identical locus profiles, and another pair (M9, M10) likewise clustered together, with the remaining five (M3, M4, M5, M7, M8) showing high similarity to these core groups. Across all ten gentamicin-evolved samples, marA, gadX, and hns remained ubiquitous, while uhpT was present in six isolates (M1, M2, M3, M6, M7, M8), and mdtF appeared in five (M1, M2, M6, M9, M10) (Supplementary Table S2).
These clustering patterns underscore a heterogeneous adaptive response to meropenem—reflected by distinct subgroups with variable locus repertoires—versus a more unified response to gentamicin, in which resistance-associated loci were broadly shared across evolved populations.
2.5. Resistance Mechanisms Identified
Efflux pump systems emerged as the predominant resistance mechanism in both datasets, facilitating active extrusion of antibiotics and reducing intracellular drug concentrations. Several efflux pump families were identified: Resistance-Nodulation-Division (RND), Major Facilitator Superfamily (MFS), Small Multidrug Resistance (SMR), and ATP-Binding Cassette (ABC) transporters.
In the meropenem-evolved isolates, the CARD annotation revealed a broad spectrum of efflux and accessory systems. Within the RND family, we observed frequent hits to acrB, acrD, acrE, acrF, acrS, and adeF, alongside the complete AcrAB–TolC complex with mutations in its regulators acrR and marR. The two-component regulator baeR, the envelope-stress sensor cpxA, and the global transcriptional regulator crp were also repeatedly flagged. Downstream modulators gadX, marA, and the small RNA chaperone rsmA featured prominently, as did multiple subunits of the Mex-type pumps—mdtA, mdtB, mdtC, mdtE, mdtF—and the membrane channel tolC itself.
MFS-family pumps were equally well represented, with hits to emrA, emrB, emrK, emrR, mdfA, mdtG, mdtH, mdtN, mdtO, mdtP, and the transcriptional regulator leuO. SMR-family loci included the native emrE, the CARD-annotated kpnF homolog, and qacJ. From the ABC family, only msbA appeared (in addition to tolC under RND annotation), and no MATE-family genes were detected.
Beyond efflux, loci involved in target modification and stress response were prominent: arnT, bacA, eptA, the elongation factor tuf (EF-Tu), the hexose phosphate transporter uhpT, and the vancomycin-related ligase vanG. Two inactivation-related genes—ampC β-lactamase and the uncharacterized locus EC-13—were identified, and the KdpDE two-component kinase kdpE was found in all but one lineage (M8) (Supplementary Table S1).
In the gentamicin-evolved isolates, resistance again centered on RND-family efflux pumps, with the CARD annotation flagging acrS, adeF, and the AcrAB–TolC complex bearing marR mutations. Two-component regulators baeR and baeS, the global regulator crp, and master transcription factors gadX and marA were also consistently detected, as were the RND-linked modulators mdtE, mdtF, and the small RNA chaperone rsmA. Notably, the CARD additionally flagged a homolog of acrA.
MFS-family pumps featured prominently, with hits to emrB, emrK, emrR, emrY, leuO, mdtM, mdtN, mdtO, and mdtP. SMR-family loci included the native emrE, alongside kpnE and kpnF homologs and qacJ. From the ABC transporter family, only msbA appeared. Unlike meropenem-evolved lines, no single gentamicin isolate co-flagged ABC, MFS, and RND pumps simultaneously; however, the two-component pair evgA/evgS and the nucleoid-associated protein hns bridged efflux and regulatory networks across multiple isolates. Inactivation mechanisms were limited to a single β-lactamase variant (act-17).
These patterns mirror those seen under meropenem selection—with a dominant role for RND and MFS efflux systems complemented by global regulators and stress-response loci—but they exhibit a more uniform distribution of resistance determinants and a narrower repertoire of inactivation genes (Supplementary Table S2).
2.6. Single Nucleotide Polymorphisms (SNPs) and Mutations
High-confidence variant calling identified a handful of recurrent mutations in both antibiotic settings (Supplementary Tables S1 and S2). In meropenem-evolved isolates, two missense mutations—Y137H and G103S—were detected in the marR regulator of the AcrAB–TolC pump, likely modulating efflux expression. Additional nonsynonymous changes included tufA (encoding EF-Tu) R234F, glpT E448K, uhpT E350Q, and dual substitutions in the penicillin-binding protein pbp3 (D350N, S357N). Gentamicin-evolved populations converged on three of these loci, with EF-Tu R234F, UhpT E350Q, and PBP3 D350N/S357N recurring across independent lineages. These alterations—found in transporters, global regulators, and target enzymes—are poised to affect drug uptake, binding affinity, and efflux dynamics, collectively contributing to elevated resistance.
2.7. Resistance to Disinfectants and Antiseptics
In addition to antibiotic-specific determinants, both meropenem- and gentamicin-evolved populations carried chromosomal loci previously associated with tolerance to disinfectants and antiseptics. Meropenem-selected isolates uniformly flagged the outer-membrane channel tolC, the regulator marA, and the RND-pump subunits acrA, acrB, and acrS together with mutations in acrR and marR. Several MFS pumps (mdtN, mdtO, mdtP, mdtM, mdfA), the phosphoethanolamine transferase eptA, and the SMR-family transporter qacJ were also detected, as were stress-response regulators leuO, soxR, and soxS. Homologs annotated by the CARD as kpnE and kpnF likewise appeared, reflecting E. coli variants of these efflux components (Supplementary Table S1).
Gentamicin-evolved isolates exhibited a similar antiseptic-tolerance profile. The RND pumps AcrS and TolC (with MarR mutations), the MFS pumps MdtN, MdtO, and MdtP, and the SMR transporter QacJ were consistently present, alongside marA, leuO, and the two-component regulators BaeR/BaeS. The CARD-labeled homologs kpnE and kpnF appeared again, and an acrA homolog was flagged in several lines (Supplementary Table S2).
The co-occurrence of antibiotic- and biocide-tolerant loci underscores the potential for cross-resistance. Enrichment of these efflux and regulatory systems may compromise disinfection protocols in clinical and agricultural settings, facilitating the persistence and spread of resistant E. coli.
2.8. Phenotype of Resistant Strains
Under meropenem, E. coli progressed from rods (0× MIC) to elongated filaments (1×–10× MIC) and, at the highest concentrations (100×–1000× MIC), to small spheroplast-like cells, a pattern consistent with SOS-driven division arrest and cell-wall remodeling (Figure 4A–C and Figure 5A–I). Gentamicin-exposed populations retained predominantly rod shapes, showing only moderate elongation at mid-MIC zones (Figure 6A–F). A more comprehensive description of Figure 4, Figure 5 and Figure 6 can be found in the Supplementary Materials and Methods Section Selection of Resistant Phenotypes.
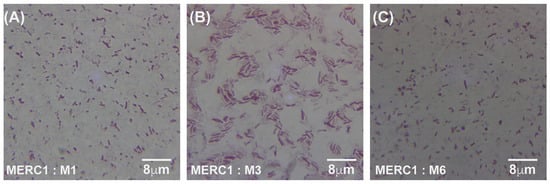
Figure 4.
Gram-stained micrographs (100× magnification) of E. coli samples taken from the meropenem control lane (C1), which contained no antibiotic. Panels (A–C) correspond to samples M1, M3, and M6, respectively, all originating from the same antibiotic-free lane. MER = meropenem, C1 = lane without antibiotic, and M = sample number from that lane.
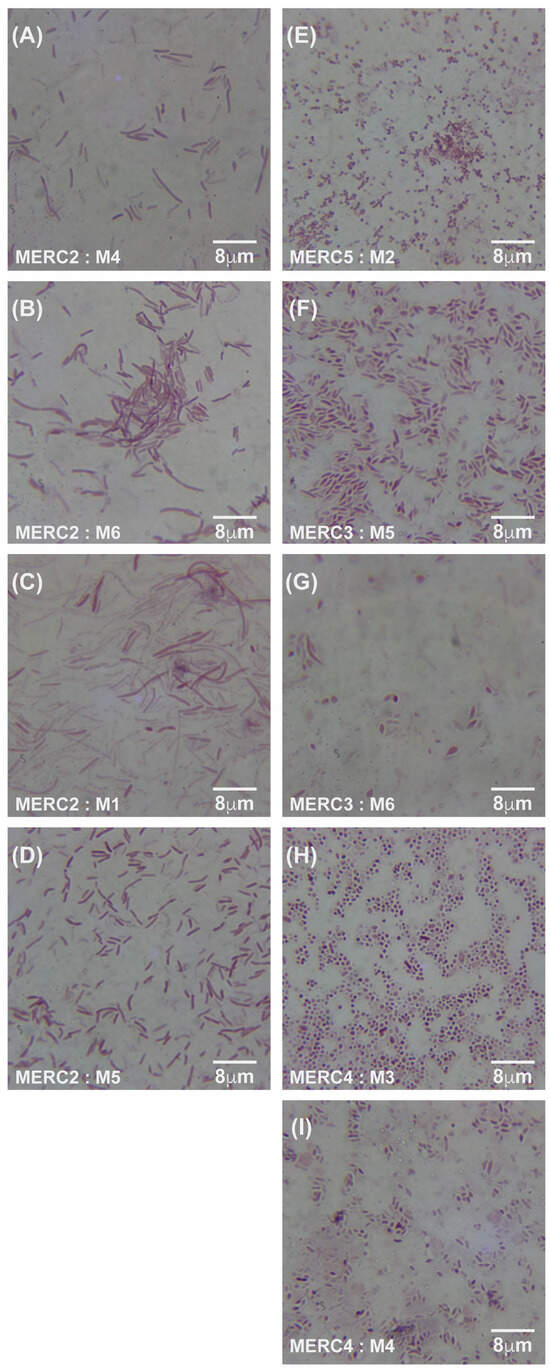
Figure 5.
Gram-stained micrographs (100× magnification) of E. coli samples. (A–D) display samples from meropenem lane 2 (C2) at an MIC of 0.125 μg/mL, with corresponding micrographs of samples M4, M6, M1, and M5, respectively. (E–I) show samples from lanes 3, 4, and 5 (C3–C5), with micrographs of M2 from lane 5 at an MIC of 125 μg/mL, M5 and M6 from lane 3 at an MIC of 1.25 μg/mL, and M3 and M4 from lane 4 at an MIC of 12.5 μg/mL. MER = meropenem, C2–C5 = lane numbers, and M = sample number from the respective lane.
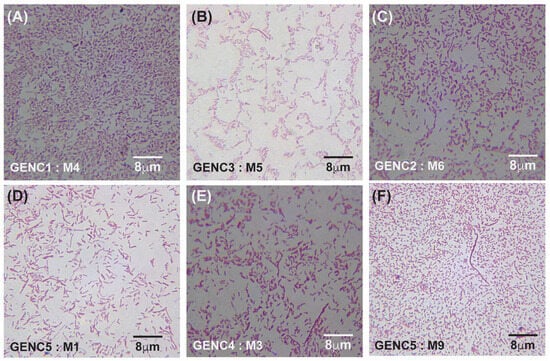
Figure 6.
Gram-stained micrographs (100× magnification) of E. coli samples obtained from gentamicin-treated lanes. (A–C) represent samples from lanes 1 (C1), 2 (C2), and 3 (C3): panel (A) corresponds to sample M4 from antibiotic-free lane 1, panel (B) to sample M5 from lane 3 at an MIC of 40 μg/mL, and panel (C) to sample M6 from lane 2 at an MIC of 4 μg/mL. (D–F) show samples from lanes 4 (C4) and 5 (C5): panel (D) represents sample M1 from lane 5 at an MIC of 4000 μg/mL, panel (E) represents sample M3 from lane 4 at an MIC of 400 μg/mL, and panel (F) represents sample M9 from lane 5 at an MIC of 4000 μg/mL. GEN denotes gentamicin, C indicates the lane number, and M refers to the sample number from each lane.
3. Comparative Analysis of Meropenem, Gentamicin, and Florfenicol Resistance Profiles
To identify both common and antibiotic-specific adaptations, we compared our meropenem- and gentamicin-evolved E. coli loci with those reported for florfenicol-selected populations by Kerek et al. (2024) [24]. Across the three datasets, we catalogued 64 unique resistance-associated loci, of which 22 were shared under all three selection pressures (Table 1).
The shared loci—acrS, baeR, crp, emrB, emrK, emrR, emrY, eptA, emrE, evgA, evgS, gadX, hns, marA, mdtE, mdtF, mdtM, mdtN, mdtO, mdtP, msbA, and pmrF—encode core components of multidrug efflux systems (RND and MFS families), global regulators of stress response and pump expression, and enzymes that alter the cell envelope. Their consistent detection across carbapenem, aminoglycoside, and phenicol challenges highlights a universal chromosomal network that E. coli recruits to tolerate diverse antibiotics.
Each antibiotic regimen also selected for unique loci reflecting specialized mechanisms. Under florfenicol, ampH, gadW, and ugd appeared exclusively; ampH encodes a class C β-lactamase, GadW regulates acid-response genes, and Ugd modifies lipopolysaccharide structure, potentially reducing drug influx. In the meropenem lines, unique hits included the uncharacterized locus EC-13, the efflux repressor acrR (mutated within the AcrAB–TolC complex), the glycerol-3-phosphate transporter glpT, and the oxidative-stress regulators soxR and soxS. These mutations likely drive the overexpression of efflux or stress-defense pathways specific to β-lactam pressure. Gentamicin selection yielded two bespoke loci: the β-lactamase variant act-17 and an acrA homolog, suggesting possible co-selection or structural variations in the efflux apparatus under ribosomal-targeting stress.
Together, these findings reveal a dual strategy of adaptation in E. coli: a shared core resistome of regulatory and efflux functions that underpins multidrug tolerance, and antibiotic-specific loci that fine-tune the response to distinct mechanisms of action. The identification of common loci across all three drug classes highlights potential broad-spectrum targets, while the unique adaptations associated with each antibiotic indicate specialized mechanisms that may be critical targets for antibiotic development and therapeutic interventions.
4. Functional Categorization of Antibiotic Resistance Genes
To uncover the overarching biological processes underpinning resistance, we performed gene ontology (GO) enrichment analysis using the ClueGO plugin. In both our meropenem- and gentamicin-evolved datasets, five GO terms were significantly overrepresented: positive regulation of gene expression, sulfathiazole transport, response to drug, response to antibiotic, and intracellular signal transduction (Figure 7 and Figure 8; Supplementary Tables S3 and S4). These categories emphasize the coordinated engagement of transcriptional regulators, efflux systems, and signaling pathways as E. coli adapts to antibiotic stress.
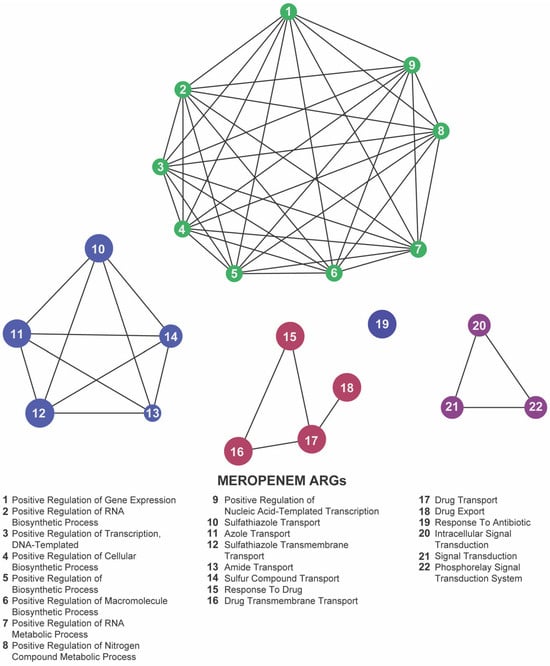
Figure 7.
Network representation of biological functions associated with meropenem-related antibiotic resistance genes (ARGs). Each numbered node corresponds to a specific function (listed below), and the edges indicate relationships or co-occurrence between these functions. The clusters of nodes (indicated by distinct colors) represent groups of related processes—regulation of gene expression, biosynthetic activities, and antibiotic transport or response mechanisms—highlighting the complex functional landscape that emerges under meropenem pressure.
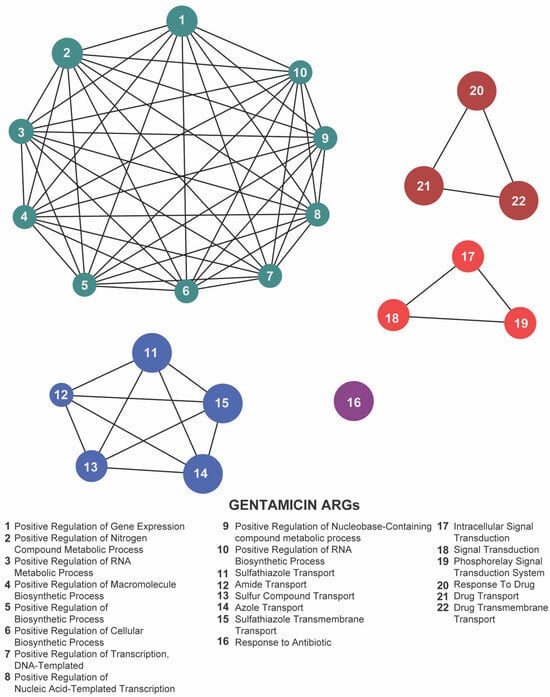
Figure 8.
Network representation of biological functions associated with gentamicin-related antibiotic resistance genes (ARGs). Each numbered node corresponds to a specific function (listed below), and the edges indicate relationships or co-occurrence among these functions. The clusters of nodes (color-coded) represent interconnected groups of biological processes—metabolic regulation, biosynthetic pathways, and antibiotic transport or response mechanisms—highlighting a tightly coordinated functional network under gentamicin exposure.
By contrast, florfenicol-resistant populations (Kerek et al., 2024) [24] exhibited enrichment in seven GO terms: methylglyoxal catabolic process to D-lactate via S-lactoyl-glutathione, lipopolysaccharide metabolic process, drug export, response to antibiotic, response to drug, phosphorelay signal transduction system, and sulfathiazole transport (Figure 9; Supplementary Table S5). The prominence of metabolic pathways—particularly the methylglyoxal detoxification and LPS remodeling—suggests that florfenicol selection uniquely pressures E. coli to rewire its metabolism alongside efflux and regulatory responses.
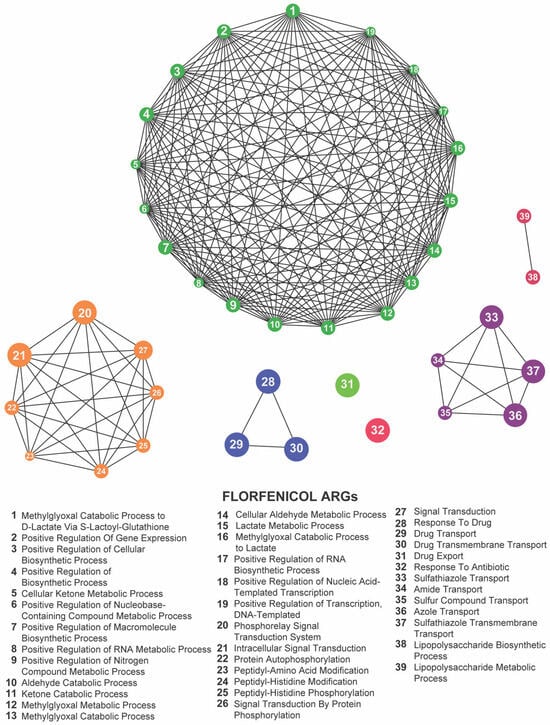
Figure 9.
Network representation of biological functions associated with florfenicol-related antibiotic resistance genes (ARGs). Each numbered node corresponds to a specific function (listed below), and the edges indicate relationships or co-occurrence among these functions. The large, densely connected cluster represents a complex network of metabolic and biosynthetic processes, while the smaller groups highlight additional functions such as protein modifications, signal transduction pathways, and antibiotic transport or response. Together, these clusters illustrate the intricate functional landscape influenced by florfenicol exposure.
Focusing on the 22 loci shared across the meropenem, gentamicin, and florfenicol lines, six GO terms remained significantly enriched: methylglyoxal catabolic process to D-lactate via S-lactoyl-glutathione, lipopolysaccharide metabolic process, response to antibiotic, response to drug, phosphorelay signal transduction system, and sulfathiazole transport (Figure 10; Supplementary Table S6). The recurrence of these processes highlights a core functional network in which E. coli integrates metabolic flexibility with sophisticated regulatory circuits and efflux-mediated transport to survive diverse antibiotic pressures.
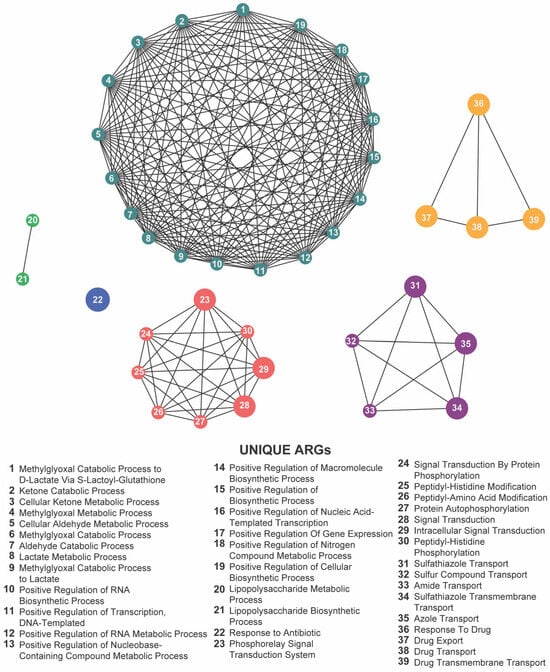
Figure 10.
Network visualization of distinct biological functions associated with antibiotic resistance genes (ARGs) identified under exposure to meropenem, gentamicin, and florfenicol. Each numbered node represents a unique biological function (listed below), and the edges indicate functional relationships or co-occurrences. The densely interconnected cluster, along with the multiple smaller groups, highlights a wide range of metabolic, biosynthetic, regulatory, and transport-related processes that collectively shape the complex resistance landscape across these antibiotics.
Together, these enrichment profiles underscore the multifaceted nature of chromosomal adaptation: while gene-expression regulation and intracellular signaling form the backbone of a shared resistance strategy, drug-specific metabolic pathways further refine the response to individual antibiotic classes. These findings provide valuable insights into the biological functions associated with resistance-associated loci and highlight potential targets for novel antimicrobial strategies.
5. Discussion
5.1. Genomic Adaptations
By applying the MEGA-plate system, we tracked the real-time adaptation of Escherichia coli under meropenem and gentamicin gradients [5] and benchmarked these dynamics against florfenicol-evolved strains [24].
Meropenem selection yielded highly heterogeneous resistance profiles: four isolates (M1, M3, M5, M8) diverged sharply from the other half of the population. This pattern implies that multiple mutational pathways can confer survival at elevated meropenem concentrations, reflecting the interplay of mutation, selection, and clonal competition. Spontaneous mutants with variable fitness [28] arise under antibiotic stress [29,30]. Baym et al. (2016) [5] showed that, under trimethoprim, faster-growing but less resistant clones can overtake hyper-resistant mutants. Our observation of coexisting, divergent meropenem lineages aligns with these competitive dynamics.
By contrast, gentamicin-exposed populations—and florfenicol lines from Kerek et al. (2024) [24]—showed uniform adaptive responses. This conserved response suggests reliance on a core efflux-and-regulator toolkit when facing aminoglycosides or phenicols.
Within meropenem-adapted populations, six SOS-linked loci—acrS, eptA, emrE, evgA, hns, and vanG—were omnipresent, marking them as central hubs of resistance. AcrS represses AcrAB–TolC efflux [31]; EptA modifies lipid A to deter cationic peptides [32]; EmrE exports diverse toxins [33]; EvgA regulates acid-stress and efflux genes [34,35]; H-NS globally silences or activates stress loci [36,37]; and VanG—in spite of its enterococcal origin—may reflect chromosomal remodeling [38].
The enrichment of H-NS under all three antibiotics underscores its versatility as a global repressor, modulating virulence, stress, metabolism, and foreign gene expression [39,40]. Its recurrent detection suggests that H-NS helps synchronize multi-drug stress responses.
Although the gentamicin and florfenicol lines maintained their core ARG sets, we observed the variable presence of uhpT—a hexose phosphate importer regulated by UhpABC [41,42,43]—and of mdtF, an MdtEF–TolC efflux component [44,45]. These fluctuations imply the modulation of nutrient uptake and pump expression under aminoglycoside stress.
Both meropenem and gentamicin regimens co-select loci known to mediate biocide tolerance—qacJ, mdfA, mdtM, and AcrAB–TolC [46,47,48]. Such cross-resistance threatens sterilization efficacy and underscores the need to regulate biocide usage in healthcare settings.
Our screen did not detect any plasmid-borne or other mobile-element–associated resistance factors; all hits mapped to the chromosome. This likely reflects both the starting strain and the relatively short timescale and controlled conditions of the MEGA-plate experiment, which may not favor horizontal transfer of large resistance plasmids. In more complex or longer-term settings—where bacteria interact with environmental reservoirs or other species—plasmid-mediated and transposon-associated ARGs often play a major role. Thus, while our chromosomal focus has illuminated the core, endogenous resistome recruited under steep gradients, it may underestimate the full spectrum of resistance strategies available in natural settings.
While our genomic and phenotypic data nominate master regulators (e.g., marA, baeR) and efflux loci (e.g., acrS, mdtE) as key resistance nodes, direct confirmation via gene knock-out or overexpression remains to be conducted. In future work, we plan the targeted deletion of marA and abeR and heterologous overexpression of acrS in wild-type E. coli to quantify their individual contributions to MIC shifts. These experiments will validate the causal roles of the core resistome uncovered here.
5.2. Phenotype of Resistant Strains
Beyond the gene-level shifts, we also observed striking, antibiotic-specific cell-shape changes. Meropenem targets penicillin-binding proteins (PBPs), disrupting cell-wall synthesis [49,50,51]. Under such stress, Enterobacteriaceae trigger SOS-linked loci [52], form cell-wall–deficient spheroplasts [53], alter division machinery, rewire envelope biogenesis and ATP metabolism [51], and generate persisters [54,55]—all of which echo the diverse mechanisms flagged in our meropenem-adapted genomes.
Gentamicin binds the 30S ribosomal subunit, causing mistranslation and ribosome stalling [19]. Resistance chiefly involves antibiotic-modifying enzymes, efflux pumps, and ribosomal mutations [23]. Although SOS activation and major shape changes are uncommon under aminoglycosides, cell elongation and reduced ribosome density have been noted [56], mirroring our gentamicin lines’ uniform ARG set and modest morphological shifts.
Morphological adaptations under antibiotic stress can influence both survival in clinical reservoirs [57,58,59] and the efficacy of disinfection protocols [60,61,62]. In our MEGA-plate experiments, the divergent ARG repertoires under meropenem contrasted sharply with the uniform ARG set under gentamicin—and these genetic patterns tracked with equally divergent morphological outcomes.
Under meropenem, cells progressed from rods (0× MIC) to filaments at mid-MIC—indicative of SOS-induced division arrest—and then through oval intermediates to coccoid forms at the highest concentrations, echoing β-lactam–induced spheroplast-like states. Similar to ciprofloxacin-induced filamentation, meropenem triggers patterns that activate SOS-mediated mutagenesis [52], generating elongated cells that can yield genetically diverse progeny [52].
These divergent morphologies—dramatic remodeling under cell-wall stress versus conservative shape under ribosomal stress—underscore how the antibiotic mode of action dictates the phenotypic pathways of adaptation.
Moreover, the circular morphology observed at the highest antibiotic concentrations does not correspond to previously described spheroplasts, indicating the possibility of an uncharacterized survival strategy that warrants further investigation. In addition, the stability of ARG profiles and the morphological changes in gentamicin-exposed samples in the last lanes in E. coli suggest a different adaptive approach. The lack of significant phenotypic alterations may reflect a reliance on inherent resistance mechanisms, such as efflux pumps or enzymatic modifications, rather than inducing extensive morphological transformations.
By imposing spatial antibiotic gradients, the MEGA-plate system captures both mutation and clonal competition in real time. In our hands, it uniquely revealed the dichotomy between multi-pathway meropenem adaptation and uniform gentamicin resistance—insights that would be obscured in well-mixed or static assays.
Our cross-drug comparison [63] pinpointed a core resistome of 22 chromosomal loci shared evenly with florfenicol-evolved strains. Recognizing such universal nodes—rather than isolated ARGs—will sharpen both drug-development efforts and molecular surveillance pipelines.
Identifying a shared core resistome [64,65,66] of 22 loci across human (meropenem, gentamicin) and veterinary (florfenicol) antibiotics reinforces a One Health framework [67,68]. Agricultural antibiotic use can seed environmental ARGs that eventually infiltrate clinical strains or the food chain [27,69], highlighting the necessity of coordinated stewardship.
Future research should expand on challenging E. coli with antibiotic pairs (e.g., meropenem plus efflux pump inhibitor) on MEGA-plates to dissect synergistic or antagonistic trajectories. Such combinatorial gradients may reveal collateral sensitivities exploitable in therapy.
We demonstrate that mechanism-specific evolutionary routes—morphological remodeling under meropenem vs. efflux stability under gentamicin—coexist atop a shared chromosomal backbone of resistance loci. Integrating these insights into One Health frameworks will be essential for next-generation antimicrobial design and stewardship.
5.3. Biological Functions
GO enrichment highlighted the positive regulation of gene expression as the top functional category in both meropenem- and gentamicin-adapted populations, driven primarily by three master regulators: baeR, gadX, and marA.
BaeR (of the BaeSR two-component system) [70,71] upregulates key efflux pumps (e.g., mdtABC, acrD) to export diverse toxins—β-lactams, novobiocin, detergents, and bile salts [34,72]. It also controls a broader regulon (>50 genes) spanning signal transduction and membrane biogenesis [72]. Its GO enrichment in our dataset underscores BaeR’s central role in coordinating efflux-based and envelope-related defenses against antibiotic stress.
GadX drives the glutamate-dependent acid-resistance system while also modulating sugar catabolism and general stress-response genes [73,74,75]. Its enrichment here suggests E. coli co-opts acid-stress circuitry to bolster survival during antibiotic challenge.
MarA orchestrates the mar regulon [75], boosting AcrAB–TolC efflux, downregulating porins (e.g., ompF), and upregulating oxidative-stress defenses [76,77]. This multifaceted control reduces intracellular drug levels and enhances survival under diverse antibiotic stresses.
Collectively, the GO enrichment of baeR, gadX, and marA highlights transcriptional regulation as a linchpin of adaptation—driving efflux, membrane remodeling, and stress responses in concert. Disrupting these regulators may therefore cripple multiple resistance routes simultaneously.
Standard MIC and disk-diffusion tests overlook dynamic factors [78]—population density, biofilms, sub-MIC zones, and ecological interactions—that drive real-world resistance evolution [30,79,80,81,82]. Furthermore, it is increasingly recognized that microbial susceptibility to antibiotics is not solely an intrinsic property but is significantly influenced by interspecies interactions and ecological niche conditions [83,84]. The microbial community context can modulate gene expression, horizontal gene transfer, and metabolic cooperation or competition, all of which impact the emergence and spread of AMR.
By imposing spatially graded antibiotic pressures, the MEGA-plate captures in situ mutation, selection, and competition—revealing both heterogeneous and uniform adaptive strategies that static assays miss.
Therefore, here we show that E. coli deploys mechanism-tailored adaptations—extensive remodeling under meropenem versus efflux-centric stability under gentamicin—anchored by a shared set of transcriptional regulators. Targeting these regulatory nodes offers a promising path to disrupt multifaceted resistance and inform next-generation antimicrobial design.
5.4. Study Limitations—Contextual Considerations
Our study has several key constraints that should inform the interpretation and generalizability of these findings. First, the MEGA-plate experiments ran for only 9–13 days and employed a single laboratory strain of E. coli, likely underrepresenting the full diversity of resistance trajectories accessible to clinical or environmental isolates in polymicrobial contexts. Second, by design, we focused exclusively on chromosomal mutations and did not capture plasmid-, transposon-, or integron-mediated horizontal gene transfer, which plays a major role in resistance dissemination in natural and clinical settings. Third, although nanopore sequencing provided broad coverage of point mutations and gene presence, it may have missed low-frequency variants, structural rearrangements, and small indels; deeper, longer-read, or complementary short-read sequencing would improve detection of these events. Fourth, our modifications to the standard Baym et al. [5] MEGA-plate—downsizing to 40 × 50 cm and adapting for orbital incubator and laminar-hood constraints—optimized handling and temperature uniformity but could subtly affect gradient diffusion dynamics; while we observed no obvious impact on bacterial migration or resistance emergence, quantitative comparisons to the original design remain to be made. Finally, we did not experimentally validate the phenotypic effects of the identified resistance loci; future work using gene knock-outs, overexpression assays, and fitness measurements in diverse strains will be critical to confirm their causal roles and assess their clinical relevance. Together, these limitations highlight the need for extended evolution experiments, inclusion of multiple strains and resistance mechanisms, and targeted functional studies to build on the chromosomal resistome framework presented here.
6. Materials and Methods
6.1. Microbial Strains and Conditions
Escherichia coli ATCC 11229 was used as the model organism. Cultures were maintained in Luria–Bertani (LB) broth (Difco Laboratories, Detroit, MI, USA) at 37 °C with 150 rpm agitation. Overnight cultures were initiated from single colonies and grown for 16 h. See Supplementary Materials for full details.
6.2. Determination of Minimum Inhibitory Concentration (MIC)
MICs for meropenem and gentamicin were determined via broth microdilution following adapted CLSI guidelines [85,86]. Stock solutions (prepared per manufacturers’ instructions) were used to achieve initial concentrations of 1 µg/mL (meropenem) and 32 µg/mL (gentamicin) in 200 μL volumes. Serial dilutions (1–0.0625 µg/mL for meropenem and 16–0.5 µg/mL for gentamicin) were performed. An overnight culture was adjusted to an OD600 of 0.2 (~107–108 cells/mL) and diluted 1:100, and 100 μL was added to each well (final concentration ≈105 cells/mL). Plates were incubated at 37 °C for 24 h, with MIC defined as OD600 < 0.05. All experiments were run in triplicate. See Supplementary Materials for complete protocols.
6.3. Design of the 40 × 54 cm Acrylic MEGA-Plate
A modified acrylic plate was constructed to study bacterial migration and resistance emergence (Supplementary Figure S1), adapted from Baym (2016) [5].
To fit our incubator (IS-971/IL-21A) and laminar-flow hood, we scaled the plate down to 40 × 50 cm acrylic, glued with dichloromethane and sealed with silicone to prevent leakage. Three agar layers (contrast base, support middle, 0.28% surface) were cast sequentially to preserve steep 0×–1000× MIC gradients, and the entire assembly was designed for sterile manipulation and uniform 37 °C incubation. These adaptations maintain the original diffusive-growth dynamics while improving handling and contamination control. For construction details and dimensions, refer to the Supplementary Materials.
6.4. Sterilization of the MEGA-Plate and Culture Media
Prior to use, each antibiotic-specific plate was disinfected overnight with 5–10% diluted hypochlorite. Six liters of LB medium underwent a double sterilization cycle and were distributed in three layers (base, intermediate, and surface) with varying agar concentrations. The base layer (2 L) contained 2% agar and 30 µg/mL kanamycin; both the base and intermediate layers included India ink (4 mL). The surface layer was prepared as a semi-solid medium (0.28% agar) with an antibiotic gradient (0, 1×, 10×, 100×, and 1000× MIC). Additional specifics are in the Supplementary Materials.
6.5. Inoculation of E. coli Bacteria and Selection of Resistant Phenotypes
A 300 μL aliquot of the standardized culture was inoculated along the edge of the antibiotic-free lane using a sterile pipette tip to form a uniform starting line. Plates were incubated at 37 °C for 9–13 days, allowing migration across the gradient. Colonies appearing beyond the initial MIC zone were deemed resistant. Six representative colonies per lane were subcultured on LB agar with the corresponding antibiotic concentration and in liquid LB broth (triplicate cultures), then stored at −80 °C in LB with 20% glycerol. See Supplementary Materials for detailed selection and confirmation procedures.
6.6. DNA Extraction, Sequencing, and Bioinformatic Analysis
Genomic DNA from selected meropenem- and gentamicin-resistant isolates was extracted using the PureLink Genomic DNA Mini Kit (Invitrogen, Carlsbad, CA, USA) and sequenced via nanopore technology at Secoya Labs [87]. Sequences were analyzed using the Comprehensive Antibiotic Resistance Database (CARD) (https://card.mcmaster.ca/, accessed on 22 June 2025) [88] through the RGI platform with strict thresholds (≥90% identity/coverage) to identify resistance genes [89,90,91]. Subsequent analysis included constructing heat maps, network visualizations using R (version 6.0.5) [92] Cytoscape (version 3.10.3) [93] and the ClueGo (version 2.5.1) gene ontology enrichment plugin [94], and hierarchical clustering based on the Jaccard similarity index [95] to compare gene profiles across antibiotic concentrations. A heatmap was created using color-coded genes (blue for absence and red for presence) to visually represent gene presence across the antibiotics [96]. A bar plot was then utilized to illustrate the total number of genes present for each antibiotic [97], followed by a stacked bar plot to depict the proportion of genes present or absent for each antibiotic. For network analyses, pairwise binary similarity between isolates in the gentamicin dataset was calculated using the Jaccard index. Similarity matrices were thresholded at 0.40, which was chosen after evaluating values between 0.30 and 0.50 for interpretability and connectivity balance. For the meropenem dataset, Pearson correlation coefficients were computed between binary gene-presence profiles, and a threshold of 0.65 was applied after testing values from 0.35 to 0.65; this value preserved meaningful relationships while avoiding spurious edges. Threshold selection was based on the distribution of similarity values, a visual inspection of connectivity patterns, and the goal of preserving biologically interpretable clusters. Sensitivity checks confirmed that network topology was stable within ±0.05 of the chosen thresholds. A full description of bioinformatic workflows is provided in the Supplementary Materials.
7. Conclusions
Our work leverages a modified MEGA-plate to map, in real time, how Escherichia coli navigates steep meropenem and gentamicin gradients, uncovering both drug-specific and shared survival tactics. Under meropenem, E. coli populations displayed high genetic heterogeneity and pronounced shape changes (filamentation→spheroplast-like forms), consistent with cell-wall stress responses. In contrast, gentamicin elicited a uniform resistance gene set and minimal morphological change, indicating reliance on conserved efflux and enzymatic defenses rather than wholesale remodeling.
Cross-comparison with florfenicol-evolved strains revealed a core resistome of 22 chromosomal loci—among them the global regulators baeR, gadX, and marA—that orchestrate efflux, stress response, and membrane adaptation across antibiotic classes. These master regulators represent high-value targets: impairing them could collapse multiple resistance pathways simultaneously.
By faithfully recapitulating spatial antibiotic gradients, the MEGA-plate bridges the gap between static in vitro assays and the complexity of natural settings, offering a powerful platform for dissecting resistance evolution. Our findings underscore the need for One Health-minded surveillance—tracking shared resistance nodes across human, veterinary, and environmental reservoirs—and point toward combination therapies or adjuvants aimed at these regulatory hubs.
Moving forward, applying MEGA-plate–based approaches to antibiotic cocktails and other pathogens will deepen our understanding of bacterial adaptability. Ultimately, decoding these genetic and phenotypic trajectories is pivotal for designing next-generation interventions that outpace resistance and preserve antimicrobial efficacy.
Supplementary Materials
The following supporting information can be downloaded at: https://www.mdpi.com/article/10.3390/antibiotics14080841/s1. Figure S1. Schematic representation of the MEGA-plate constructed in AutoCAD (version 2025), illustrating its layered structure and dimensions (54 cm × 40 cm × 25 mm). Table S1. Antibiotic resistance genes (ARGs) identified in the meropenem dataset. A total of 325 ARGs (57 unique genes) were found, conferring resistance to 20 different antibiotics (including penams, penems, carbapenems, fluoroquinolones, and tetracyclines). Table S2. Antibiotic resistance genes (ARGs) identified in the gentamicin samples. Table S3. Significantly enriched gene ontology (GO) terms in the meropenem dataset. Table S4. Significantly enriched gene ontology (GO) terms in the gentamicin dataset. Table S5. Significantly enriched gene ontology (GO) terms identified in the florfenicol-resistant populations analyzed by Kerek et al. [24]. Table S6. Enriched gene ontology (GO) terms for unique ARGs shared among meropenem-, gentamicin-, and florfenicol-resistant populations.
Author Contributions
Conceptualization, N.M.-D. and J.R.M.-R.; Methodology, N.M.-D. and J.R.M.-R.; Software, N.M.-D., R.Á.M. and J.R.M.-R.; Validation, N.M.-D., R.Á.M. and J.R.M.-R.; Formal analysis, N.M.-D. and J.R.M.-R.; Investigation, N.M.-D. and J.R.M.-R.; Resources, J.R.M.-R.; Data curation, N.M.-D., A.L.-B., R.Á.M. and J.R.M.-R.; Writing—original draft, N.M.-D., A.L.-B. and J.R.M.-R.; Writing—review & editing, N.M.-D. and J.R.M.-R.; Visualization, J.R.M.-R.; Supervision, J.R.M.-R.; Project administration, J.R.M.-R.; Funding acquisition, J.R.M.-R. All authors have read and agreed to the published version of the manuscript.
Funding
The authors want to thank the Universidad Autonoma de Nuevo León and CONACyT for providing financial support through Paicyt 2019–2020, Paicyt 2020–2021, and Paicyt 2022–2023 Science Grants. CONAHCyT Grants for: Basic science grant 221332, Fronteras de la Ciencia grant 1502, Infraestructura Grant 279957, and Apoyos a la Ciencia de Frontera grant 316869 y Grant a Ciencia de Frontera CF-2023-I-1327. Nami Morales Duran for the support from Beca Nacional de Posgrado from CONAHCyT; Angel León Buitimea for the support from Becas Nacionales de Postdoctorado from CONAHCyT.
Institutional Review Board Statement
Not applicable.
Informed Consent Statement
Not applicable.
Data Availability Statement
The original contributions presented in this study are included in the article/Supplementary Material. The sequence datasets generated and analyzed during the current study are available on NCBI SRA under accession number PRJNA1234206 for gentamycin samples and under accession number PRJNA1234170 for meropenem samples. Please contact the corresponding author for further information.
Conflicts of Interest
The authors declare no competing interests.
References
- O’Neill, J. Tackling Drug-Resistant Infections Globally: Final Report and Recommendations; Wellcome Trust: London, UK, 2016. [Google Scholar]
- Palmer, A.C.; Kishony, R. Understanding, Predicting and Manipulating the Genotypic Evolution of Antibiotic Resistance. Nat. Rev. Genet. 2013, 14, 243–248. [Google Scholar] [CrossRef]
- Klein, E.Y.; Van Boeckel, T.P.; Martínez, E.M.; Pantalón; Suraj; Gandra, S.; Levin, S.A.; Goossens, H.; Laxminarayan, R. Global Increase and Geographic Convergence in Antibiotic Consumption between 2000 and 2015. Proc. Natl. Acad. Sci. USA 2018, 115, E3463–E3470. [Google Scholar] [CrossRef]
- Ventola, C.L. The Antibiotic Resistance Crisis: Part 1: Causes and Threats. Pharm. Ther. 2015, 40, 277. [Google Scholar]
- Baym, M.; Lieberman, T.D.; Kelsic, E.D.; Chait, R.; Gross, R.; Yelin, I.; Kishony, R. Spatiotemporal Microbial Evolution on Antibiotic Landscapes. Science 2016, 353, 1147–1151. [Google Scholar] [CrossRef]
- Lopatkin, A.J.; Meredith, H.R.; Srimani, J.K.; Pfeiffer, C.; Durrett, R.; You, L. Persistence and Reversal of Plasmid-Mediated Antibiotic Resistance. Nat. Commun. 2017, 8, 1689. [Google Scholar] [CrossRef]
- Andersson, D.I.; Hughes, D. Microbiological Effects of Sublethal Levels of Antibiotics. Nat. Rev. Microbiol. 2014, 12, 465–478. [Google Scholar] [CrossRef] [PubMed]
- Ching, C.; Zaman, M.H. Development and Selection of Low-Level Multi-Drug Resistance over an Extended Range of Sub-Inhibitory Ciprofloxacin Concentrations in Escherichia coli. Sci. Rep. 2020, 10, 8754. [Google Scholar] [CrossRef] [PubMed]
- Martinez, J.L.; Sánchez, M.B.; Martínez-Solano, L.; Hernandez, A.; Garmendia, L.; Fajardo, A.; Alvarez-Ortega, C. Functional Role of Bacterial Multidrug Efflux Pumps in Microbial Natural Ecosystems. FEMS Microbiol. Rev. 2009, 33, 430–449. [Google Scholar] [CrossRef]
- Neyfakh, A.A.; Bidnenko, V.E.; Chen, L.B. Efflux-Mediated Multidrug Resistance in Bacillus Subtilis: Similarities and Dissimilarities with the Mammalian System. Proc. Natl. Acad. Sci. USA 1991, 88, 4781–4785. [Google Scholar] [CrossRef]
- Sun, J.; Deng, Z.; Yan, A. Bacterial Multidrug Efflux Pumps: Mechanisms, Physiology and Pharmacological Exploitations. Biochem. Biophys. Res. Commun. 2014, 453, 254–267. [Google Scholar] [CrossRef]
- Elshamy, A.A.; Aboshanab, K.M. A Review on Bacterial Resistance to Carbapenems: Epidemiology, Detection and Treatment Options. Future Sci. OA 2020, 6, FSO438. [Google Scholar] [CrossRef] [PubMed]
- Nordmann, P.; Naas, T.; Poirel, L. Global Spread of Carbapenemase-Producing Enterobacteriaceae. Emerg. Infect. Dis. 2011, 17, 1791. [Google Scholar] [CrossRef]
- Durante-Mangoni, E.; Andini, R.; Zampino, R. Management of Carbapenem-Resistant Enterobacteriaceae Infections. Clin. Microbiol. Infect. 2019, 25, 943–950. [Google Scholar] [CrossRef]
- Meletis, G. Carbapenem Resistance: Overview of the Problem and Future Perspectives. Ther. Adv. Infect. Dis. 2016, 3, 15. [Google Scholar] [CrossRef]
- Baldwin, C.M.; Lyseng-Williamson, K.A.; Keam, S.J. Meropenem. Drugs 2008, 68, 803–838. [Google Scholar] [CrossRef]
- Steffens, N.A.; Zimmermann, E.S.; Nichelle, S.M.; Brucker, N. Meropenem Use and Therapeutic Drug Monitoring in Clinical Practice: A Literature Review. J. Clin. Pharm. Ther. 2021, 46, 610–621. [Google Scholar] [CrossRef]
- Tamma, P.D.; Aitken, S.L.; Bonomo, R.A.; Mathers, A.J.; van Duin, D.; Clancy, C.J. Infectious Diseases Society of America 2022 Guidance on the Treatment of Extended-Spectrum β-Lactamase Producing Enterobacterales (ESBL-E), Carbapenem-Resistant Enterobacterales (CRE), and Pseudomonas Aeruginosa with Difficult-to-Treat Resistance (DTR-P. Aeruginosa). Clin. Infect. Dis. Off. Publ. Infect. Dis. Soc. Am. 2022, 75, 187. [Google Scholar] [CrossRef]
- Krause, K.M.; Serio, A.W.; Kane, T.R.; Connolly, L.E. Aminoglycosides: An Overview. Cold Spring Harb. Perspect. Med. 2016, 6, a027029. [Google Scholar] [CrossRef] [PubMed]
- Phillips, I.; Eykyn, S.; King, B.A.; Jenkins, C.; Warren, C.A.; Shannon, K.P. The in Vitro Antibacterial Activity of Nine Aminoglycosides and Spectinomycin on Clinical Isolates of Common Gram-Negative Bacteria. J. Antimicrob. Chemother. 1977, 3, 403–410. [Google Scholar] [CrossRef]
- Beganovic, M.; Luther, M.K.; Rice, L.B.; Arias, C.A.; Rybak, M.J.; LaPlante, K.L. A Review of Combination Antimicrobial Therapy for Enterococcus Faecalis Bloodstream Infections and Infective Endocarditis. Clin. Infect. Dis. 2018, 67, 303–309. [Google Scholar] [CrossRef]
- Kohanski, M.A.; Dwyer, D.J.; Hayete, B.; Lawrence, C.A.; Collins, J.J. A Common Mechanism of Cellular Death Induced by Bactericidal Antibiotics. Cell 2007, 130, 797–810. [Google Scholar] [CrossRef] [PubMed]
- Ramirez, M.S.; Tolmasky, M.E. Aminoglycoside Modifying Enzymes. Drug Resist. Updat. Rev. Comment. Antimicrob. Anticancer Chemother. 2010, 13, 151. [Google Scholar] [CrossRef]
- Kerek, Á.; Török, B.; Laczkó, L.; Somogyi, Z.; Kardos, G.; Bányai, K.; Kaszab, E.; Bali, K.; Jerzsele, Á. In Vitro Microevolution and Co-Selection Assessment of Amoxicillin and Cefotaxime Impact on Escherichia coli Resistance Development. Antibiotics 2024, 13, 247. [Google Scholar] [CrossRef]
- Schwarz, S.; Kehrenberg, C.; Doublet, B.; Cloeckaert, A. Molecular Basis of Bacterial Resistance to Chloramphenicol and Florfenicol. FEMS Microbiol. Rev. 2004, 28, 519–542. [Google Scholar] [CrossRef]
- Tang, K.L.; Caffrey, N.P.; Nóbrega, D.B.; Cork, S.C.; Ronksley, P.E.; Barkema, H.W.; Polachek, A.J.; Ganshorn, H.; Sharma, N.; Kellner, J.D.; et al. Restricting the Use of Antibiotics in Food-Producing Animals and Its Associations with Antibiotic Resistance in Food-Producing Animals and Human Beings: A Systematic Review and Meta-Analysis. Lancet Planet. Health 2017, 1, e316. [Google Scholar] [CrossRef]
- Woolhouse, M.; Ward, M.; van Bunnik, B.; Farrar, J. Antimicrobial Resistance in Humans, Livestock and the Wider Environment. Philos. Trans. R. Soc. B Biol. Sci. 2015, 370, 20140083. [Google Scholar] [CrossRef]
- Lipsitch, M.; Samore, M.H. Antimicrobial Use and Antimicrobial Resistance: A Population Perspective. Emerg. Infect. Dis. 2002, 8, 347–354. [Google Scholar] [CrossRef]
- Blondeau, J.M. New Concepts in Antimicrobial Susceptibility Testing: The Mutant Prevention Concentration and Mutant Selection Window Approach. Vet. Dermatol. 2009, 20, 383–396. [Google Scholar] [CrossRef]
- Levin-Reisman, I.; Ronin, I.; Gefen, O.; Braniss, I.; Shoresh, N.; Balaban, N.Q. Antibiotic Tolerance Facilitates the Evolution of Resistance. Science 2017, 355, 826–830. [Google Scholar] [CrossRef] [PubMed]
- Nishino, K.; Inazumi, Y.; Yamaguchi, A. Global Analysis of Genes Regulated by EvgA of the Two-Component Regulatory System in Escherichia coli. J. Bacteriol. 2003, 185, 2667–2672. [Google Scholar] [CrossRef] [PubMed]
- Samantha, A.; Vrielink, A. Lipid A Phosphoethanolamine Transferase: Regulation, Structure and Immune Response. J. Mol. Biol. 2020, 432, 5184–5196. [Google Scholar] [CrossRef]
- Yerushalmi, H.; Schuldiner, S. An Essential Glutamyl Residue in EmrE, a Multidrug Antiporter from Escherichia coli*. J. Biol. Chem. 2000, 275, 5264–5269. [Google Scholar] [CrossRef] [PubMed]
- Hirakawa, H.; Takumi-Kobayashi, A.; Theisen, U.; Hirata, T.; Nishino, K.; Yamaguchi, A. AcrS/EnvR Represses Expression of the acrAB Multidrug Efflux Genes in Escherichia coli. J. Bacteriol. 2008, 190, 6276–6279. [Google Scholar] [CrossRef] [PubMed]
- Masuda, N.; Church, G.M. Escherichia coli Gene Expression Responsive to Levels of the Response Regulator EvgA. J. Bacteriol. 2002, 184, 6225. [Google Scholar] [CrossRef] [PubMed]
- Erol, I.; Jeong, K.-C.; Baumler, D.J.; Vykhodets, B.; Ho Choi, S.; Kaspar, C.W. H-NS Controls Metabolism and Stress Tolerance in Escherichia coli O157:H7 That Influence Mouse Passage. BMC Microbiol. 2006, 6, 72. [Google Scholar] [CrossRef]
- Nishino, K.; Yamaguchi, A. Role of Histone-Like Protein H-NS in Multidrug Resistance of Escherichia coli. J. Bacteriol. 2004, 186, 1423–1429. [Google Scholar] [CrossRef]
- Depardieu, F.; Bonora, M.G.; Reynolds, P.E.; Courvalin, P. The vanG Glycopeptide Resistance Operon from Enterococcus Faecalis Revisited. Mol. Microbiol. 2003, 50, 931–948. [Google Scholar] [CrossRef]
- Dorman, C.J. H-NS: A Universal Regulator for a Dynamic Genome. Nat. Rev. Microbiol. 2004, 2, 391–400. [Google Scholar] [CrossRef]
- Navarre, W.W.; Porwollik, S.; Wang, Y.; McClelland, M.; Rosen, H.; Libby, S.J.; Fang, F.C. Selective Silencing of Foreign DNA with Low GC Content by the H-NS Protein in Salmonella. Science 2006, 313, 236–238. [Google Scholar] [CrossRef]
- Garallah, E.T.; Al-Jubori, S.S. Molecular Detection of glpT and uhpT Genes as Fosfomycin Pathways in UTI Infection Patients. Gene Rep. 2020, 21, 100930. [Google Scholar] [CrossRef]
- Island, M.D.; Wei, B.Y.; Kadner, R.J. Structure and Function of the Uhp Genes for the Sugar Phosphate Transport System in Escherichia coli and Salmonella Typhimurium. J. Bacteriol. 1992, 174, 2754–2762. [Google Scholar] [CrossRef]
- Mowlaboccus, S.; Daley, D.A.; Birdsall, J.; Gottlieb, T.; Merlino, J.; Nimmo, G.R.; George, N.; Korman, T.; Streitberg, R.; Robson, J.; et al. Molecular Characterization of Fosfomycin-Resistant Escherichia coli Urinary Tract Infection Isolates from Australia. Clin. Microbiol. Infect. 2021, 27, 1360–1361. [Google Scholar] [CrossRef]
- Elkins, C.A.; Nikaido, H. Chimeric Analysis of AcrA Function Reveals the Importance of Its C-Terminal Domain in Its Interaction with the AcrB Multidrug Efflux Pump. J. Bacteriol. 2003, 185, 5349–5356. [Google Scholar] [CrossRef]
- Nishino, K.; Senda, Y.; Yamaguchi, A. CRP Regulator Modulates Multidrug Resistance of Escherichia coli by Repressing the mdtEF Multidrug Efflux Genes. J. Antibiot. 2008, 61, 120–127. [Google Scholar] [CrossRef]
- Ammar, A.M.; El-Naenaeey, E.-S.Y.; El-Malt, R.M.S.; El-Gedawy, A.A.; Khalifa, E.; Elnahriry, S.S.; El-Hamid, M.I.A. Prevalence, Antimicrobial Susceptibility, Virulence and Genotyping of Campylobacter Jejuni with a Special Reference to the Anti-Virulence Potential of Eugenol and Beta-Resorcylic Acid on Some Multi-Drug Resistant Isolates in Egypt. Animals 2020, 11, 3. [Google Scholar] [CrossRef] [PubMed]
- Blair, J.M.; Richmond, G.E.; Piddock, L.J. Multidrug Efflux Pumps in Gram-Negative Bacteria and Their Role in Antibiotic Resistance. Future Microbiol. 2014, 9, 1165–1177. [Google Scholar] [CrossRef] [PubMed]
- El-Sokkary, M.; Abdelmegeed, E. Characterisation of Class 1 Integron among Escherichia coli Isolated from Mansoura University Hospitals in Egypt. Adv. Microbiol. 2015, 5, 269–277. [Google Scholar] [CrossRef]
- Drusano, G. Meropenem: Laboratory and Clinical Data. Clin. Microbiol. Infect. 1997, 3, S51–S54. [Google Scholar] [CrossRef] [PubMed]
- Papp-Wallace, K.M.; Endimiani, A.; Taracila, M.A.; Bonomo, R.A. Carbapenems: Past, Present, and Future. Antimicrob. Agents Chemother. 2011, 55, 4943–4960. [Google Scholar] [CrossRef]
- Thomson, N.M.; Turner, A.K.; Yasir, M.; Bastkowski, S.; Lott, M.; Webber, M.A.; Charles, I.G. A Whole-Genome Assay Identifies Four Principal Gene Functions That Confer Tolerance of Meropenem Stress upon Escherichia coli. Front. Antibiot. 2022, 1, 957942. [Google Scholar] [CrossRef]
- Bos, J.; Zhang, Q.; Vyawahare, S.; Rogers, E.; Rosenberg, S.M.; Austin, R.H. Emergence of Antibiotic Resistance from Multinucleated Bacterial Filaments. Proc. Natl. Acad. Sci. USA 2015, 112, 178–183. [Google Scholar] [CrossRef]
- Cross, T.; Ransegnola, B.; Shin, J.-H.; Weaver, A.; Fauntleroy, K.; VanNieuwenhze, M.S.; Westblade, L.F.; Dörr, T. Spheroplast-Mediated Carbapenem Tolerance in Gram-Negative Pathogens. Antimicrob. Agents Chemother. 2019, 63, 9. [Google Scholar] [CrossRef] [PubMed]
- Lee, J.S.; Choi, J.-Y.; Chung, E.S.; Peck, K.R.; Ko, K.S. Variation in the Formation of Persister Cells against Meropenem in Klebsiella Pneumoniae Bacteremia and Analysis of Its Clinical Features. Diagn. Microbiol. Infect. Dis. 2019, 95, 114853. [Google Scholar] [CrossRef]
- Urbaniec, J.; Getino, M.; McEwan, T.B.-D.; Sanderson-Smith, M.L.; McFadden, J.; Hai, F.; La Ragione, R.; Hassan, M.M.; Hingley-Wilson, S. Anti-Persister Efficacy of Colistin and Meropenem against Uropathogenic Escherichia coli Is Dependent on Environmental Conditions. Microbiology 2023, 169, 001403. [Google Scholar] [CrossRef]
- Muhamad Hendri, N.A.; Nor Amdan, N.A.; Dounis, S.O.; Sulaiman Najib, N.; Louis, S.R. Ultrastructural and Morphological Studies on Variables Affecting Escherichia coli with Selected Commercial Antibiotics. Cell Surf. 2024, 11, 100120. [Google Scholar] [CrossRef] [PubMed]
- Alexander, J.; Hembach, N.; Schwartz, T. Identification of Critical Control Points for Antibiotic Resistance Discharge in Sewers. Sci. Total Environ. 2022, 820, 153186. [Google Scholar] [CrossRef] [PubMed]
- Hanafiah, A.; Sukri, A.; Yusoff, H.; Chan, C.S.; Hazrin-Chong, N.H.; Salleh, S.A.; Neoh, H. Insights into the Microbiome and Antibiotic Resistance Genes from Hospital Environmental Surfaces: A Prime Source of Antimicrobial Resistance. Antibiotics 2024, 13, 127. [Google Scholar] [CrossRef]
- Ma, X.; Dong, X.; Cai, J.; Fu, C.; Yang, J.; Liu, Y.; Zhang, Y.; Wan, T.; Lin, S.; Lou, Y.; et al. Metagenomic Analysis Reveals Changes in Bacterial Communities and Antibiotic Resistance Genes in an Eye Specialty Hospital and a General Hospital Before and After Wastewater Treatment. Front. Microbiol. 2022, 13, 848167. [Google Scholar] [CrossRef]
- Perry, M.R.; Lepper, H.C.; McNally, L.; Wee, B.A.; Munk, P.; Warr, A.; Moore, B.; Kalima, P.; Philip, C.; de Roda Husman, A.M.; et al. Secrets of the Hospital Underbelly: Patterns of Abundance of Antimicrobial Resistance Genes in Hospital Wastewater Vary by Specific Antimicrobial and Bacterial Family. Front. Microbiol. 2021, 12, 703560. [Google Scholar] [CrossRef]
- Wu, D.; Jin, L.; Xie, J.; Liu, H.; Zhao, J.; Ye, D.; Li, X. Inhalable Antibiotic Resistomes Emitted from Hospitals: Metagenomic Insights into Bacterial Hosts, Clinical Relevance, and Environmental Risks. Microbiome 2022, 10, 19. [Google Scholar] [CrossRef]
- Zhang, Z.; Zhang, Q.; Wang, T.; Xu, N.; Lu, T.; Hong, W.; Penuelas, J.; Gillings, M.; Wang, M.; Gao, W.; et al. Assessment of Global Health Risk of Antibiotic Resistance Genes. Nat. Commun. 2022, 13, 1553. [Google Scholar] [CrossRef]
- Gupta, S.; Arango-Argoty, G.; Zhang, L.; Pruden, A.; Vikesland, P. Identification of Discriminatory Antibiotic Resistance Genes among Environmental Resistomes Using Extremely Randomized Tree Algorithm. Microbiome 2019, 7, 123. [Google Scholar] [CrossRef] [PubMed]
- D’Costa, V.M.; McGrann, K.M.; Hughes, D.W.; Wright, G.D. Sampling the Antibiotic Resistome. Science 2006, 311, 374–377. [Google Scholar] [CrossRef] [PubMed]
- Kim, D.-W.; Cha, C.-J. Antibiotic Resistome from the One-Health Perspective: Understanding and Controlling Antimicrobial Resistance Transmission. Exp. Mol. Med. 2021, 53, 301–309. [Google Scholar] [CrossRef]
- Wright, G.D. The Antibiotic Resistome: The Nexus of Chemical and Genetic Diversity. Nat. Rev. Microbiol. 2007, 5, 175–186. [Google Scholar] [CrossRef]
- McEwen, S.A.; Collignon, P.J. Antimicrobial Resistance: A One Health Perspective. Microbiol. Spectr. 2018, 6, 521–547. [Google Scholar] [CrossRef] [PubMed]
- Robinson, T.P.; Bu, D.P.; Carrique-Mas, J.; Fèvre, E.M.; Gilbert, M.; Grace, D.; Hay, S.I.; Jiwakanon, J.; Kakkar, M.; Kariuki, S.; et al. Antibiotic Resistance Is the Quintessential One Health Issue. Trans. R. Soc. Trop. Med. Hyg. 2016, 110, 377. [Google Scholar] [CrossRef]
- Marshall, B.M.; Levy, S.B. Food Animals and Antimicrobials: Impacts on Human Health. Clin. Microbiol. Rev. 2011, 24, 718. [Google Scholar] [CrossRef]
- Baranova, N.; Nikaido, H. The baeSR Two-Component Regulatory System Activates Transcription of the yegMNOB (mdtABCD) Transporter Gene Cluster in Escherichia coli and Increases Its Resistance to Novobiocin and Deoxycholate. J. Bacteriol. 2002, 184, 4168–4176. [Google Scholar] [CrossRef]
- Nagakubo, S.; Nishino, K.; Hirata, T.; Yamaguchi, A. The Putative Response Regulator BaeR Stimulates Multidrug Resistance of Escherichia coli via a Novel Multidrug Exporter System, MdtABC. J. Bacteriol. 2002, 184, 4161–4167. [Google Scholar] [CrossRef]
- Nishino, K.; Honda, T.; Yamaguchi, A. Genome-Wide Analyses of Escherichia coli Gene Expression Responsive to the BaeSR Two-Component Regulatory System. J. Bacteriol. 2005, 187, 1763–1772. [Google Scholar] [CrossRef]
- Tramonti, A.; Visca, P.; De Canio, M.; Falconi, M.; De Biase, D. Functional Characterization and Regulation of gadX, a Gene Encoding an AraC/XylS-Like Transcriptional Activator of the Escherichia coli Glutamic Acid Decarboxylase System. J. Bacteriol. 2002, 184, 2603–2613. [Google Scholar] [CrossRef] [PubMed]
- Gallegos, M.T.; Schleif, R.; Bairoch, A.; Hofmann, K.; Ramos, J.L. Arac/XylS Family of Transcriptional Regulators. Microbiol. Mol. Biol. Rev. 1997, 61, 393–410. [Google Scholar] [CrossRef]
- Martin, R.G.; Rosner, J.L. The AraC Transcriptional Activators. Curr. Opin. Microbiol. 2001, 4, 132–137. [Google Scholar] [CrossRef]
- Ruiz, C.; Levy, S.B. Many Chromosomal Genes Modulate MarA-Mediated Multidrug Resistance in Escherichia coli. Antimicrob. Agents Chemother. 2010, 54, 2125–2134. [Google Scholar] [CrossRef]
- Schneiders, T.; Barbosa, T.M.; McMurry, L.M.; Levy, S.B. El Regulador Transcripcional MarA de Escherichia Coli Reprime Directamente La Transcripción de purA y hdeA*. J. Biol. Chem. 2004, 279, 9037–9042. [Google Scholar] [CrossRef] [PubMed]
- Andrews, J.M. Determination of Minimum Inhibitory Concentrations. J. Antimicrob. Chemother. 2001, 48 (Suppl. S1), 5–16. [Google Scholar] [CrossRef] [PubMed]
- Gullberg, E.; Cao, S.; Berg, O.G.; Ilbäck, C.; Sandegren, L.; Hughes, D.; Andersson, D.I. Selection of Resistant Bacteria at Very Low Antibiotic Concentrations. PLoS Pathog. 2011, 7, e1002158. [Google Scholar] [CrossRef]
- Macia, M.D.; Rojo-Molinero, E.; Oliver, A. Antimicrobial Susceptibility Testing in Biofilm-Growing Bacteria. Clin. Microbiol. Infect. 2014, 20, 981–990. [Google Scholar] [CrossRef]
- Olson, M.E.; Ceri, H.; Morck, D.W.; Buret, A.G.; Read, R.R. Biofilm Bacteria: Formation and Comparative Susceptibility to Antibiotics. Can. J. Vet. Res. 2002, 66, 86–92. [Google Scholar]
- Yu, G.; Baeder, D.Y.; Regoes, R.R.; Rolff, J. Predicting Drug Resistance Evolution: Insights from Antimicrobial Peptides and Antibiotics. Proc. R. Soc. B Biol. Sci. 2018, 285, 20172687. [Google Scholar] [CrossRef] [PubMed]
- Allen, R.C.; Popat, R.; Diggle, S.P.; Brown, S.P. Targeting Virulence: Can We Make Evolution-Proof Drugs? Nat. Rev. Microbiol. 2014, 12, 300–308. [Google Scholar] [CrossRef] [PubMed]
- Foster, K.R.; Bell, T. Competition, Not Cooperation, Dominates Interactions among Culturable Microbial Species. Curr. Biol. 2012, 22, 1845–1850. [Google Scholar] [CrossRef]
- Garza-Cervantes, J.A.; Meza-Bustillos, J.F.; Resendiz-Hernández, H.; Suárez-Cantú, I.A.; Ortega-Rivera, O.A.; Salinas, E.; Escárcega-González, C.E.; Morones-Ramírez, J.R. Re-Sensitizing Ampicillin and Kanamycin-Resistant, E. coli and S. sureus Using Synergistic Metal Micronutrients-Antibiotic Combinations. Front. Bioeng. Biotechnol. 2020, 8, 612. [Google Scholar] [CrossRef]
- M100 Ed34|Performance Standards for Antimicrobial Susceptibility Testing, 34th ed.; Clinical and Laboratory Standards Institute: Wayne, PA, USA, 2024; Available online: https://clsi.org/standards/products/microbiology/documents/m100/ (accessed on 11 November 2024).
- Wang, Y.; Zhao, Y.; Bollas, A.; Wang, Y.; Au, K.F. Nanopore Sequencing Technology, Bioinformatics and Applications. Nat. Biotechnol. 2021, 39, 1348–1365. [Google Scholar] [CrossRef]
- McArthur, A.G.; Waglechner, N.; Nizam, F.; Yan, A.; Azad, M.A.; Baylay, A.J.; Bhullar, K.; Canova, M.J.; De Pascale, G.; Ejim, L.; et al. The Comprehensive Antibiotic Resistance Database. Antimicrob. Agents Chemother. 2013, 57, 3348–3357. [Google Scholar] [CrossRef]
- Alcock, B.P.; Huynh, W.; Chalil, R.; Smith, K.W.; Raphenya, A.R.; Wlodarski, M.A.; Edalatmand, A.; Petkau, A.; Syed, S.A.; Tsang, K.K.; et al. CARD 2023: Expanded Curation, Support for Machine Learning and Resistome Prediction at the Comprehensive Antibiotic Resistance Database. Nucleic Acids Res. 2023, 51, D690–D699. [Google Scholar] [CrossRef]
- Alcock, B.P.; Raphenya, A.R.; Lau, T.T.Y.; Tsang, K.K.; Bouchard, M.; Edalatmand, A.; Huynh, W.; Nguyen, A.-L.V.; Cheng, A.A.; Liu, S.; et al. CARD 2020: Antibiotic Resistome Surveillance with the Comprehensive Antibiotic Resistance Database. Nucleic Acids Res. 2020, 48, D517–D525. [Google Scholar] [CrossRef]
- Jia, B.; Raphenya, A.R.; Alcock, B.; Waglechner, N.; Guo, P.; Tsang, K.K.; Lago, B.A.; Dave, B.M.; Pereira, S.; Sharma, A.N.; et al. CARD 2017: Expansion and Model-Centric Curation of the Comprehensive Antibiotic Resistance Database. Nucleic Acids Res. 2017, 45, D566–D573. [Google Scholar] [CrossRef]
- R: The R Project for Statistical Computing. Available online: https://www.r-project.org/ (accessed on 9 May 2024).
- Otasek, D.; Morris, J.H.; Bouças, J.; Pico, A.R.; Demchak, B. Cytoscape Automation: Empowering Workflow-Based Network Analysis. Genome Biol. 2019, 20, 185. [Google Scholar] [CrossRef] [PubMed]
- Bindea, G.; Mlecnik, B.; Hackl, H.; Charoentong, P.; Tosolini, M.; Kirilovsky, A.; Fridman, W.-H.; Pagès, F.; Trajanoski, Z.; Galon, J. ClueGO: A Cytoscape Plug-in to Decipher Functionally Grouped Gene Ontology and Pathway Annotation Networks. Bioinformatics 2009, 25, 1091–1093. [Google Scholar] [CrossRef] [PubMed]
- Jaccard, P. Étude comparative de la distribution florale dans une portion des Alpes et du Jura. Bull. Soc. Vaud. Sci. Nat. 1901, 37, 547–579. [Google Scholar] [CrossRef]
- Pheatmap Function in, R. R CHARTS|A Collection of Charts and Graphs Made with the R Programming Language. Available online: https://r-charts.com/correlation/pheatmap/ (accessed on 15 October 2024).
- Ggplot2 Package. R CHARTS|A Collection of Charts and Graphs Made with the R Programming Language. Available online: https://r-charts.com/ggplot2/ (accessed on 11 November 2024).
Disclaimer/Publisher’s Note: The statements, opinions and data contained in all publications are solely those of the individual author(s) and contributor(s) and not of MDPI and/or the editor(s). MDPI and/or the editor(s) disclaim responsibility for any injury to people or property resulting from any ideas, methods, instructions or products referred to in the content. |
© 2025 by the authors. Licensee MDPI, Basel, Switzerland. This article is an open access article distributed under the terms and conditions of the Creative Commons Attribution (CC BY) license (https://creativecommons.org/licenses/by/4.0/).