
The Impact of Human Milk Oligosaccharides on Antibiotic-Induced Microbial Dysbiosis and Gut Inflammation in Mice
 ,
,  , , , ,
  , and
, and 
Abstract
1. Introduction
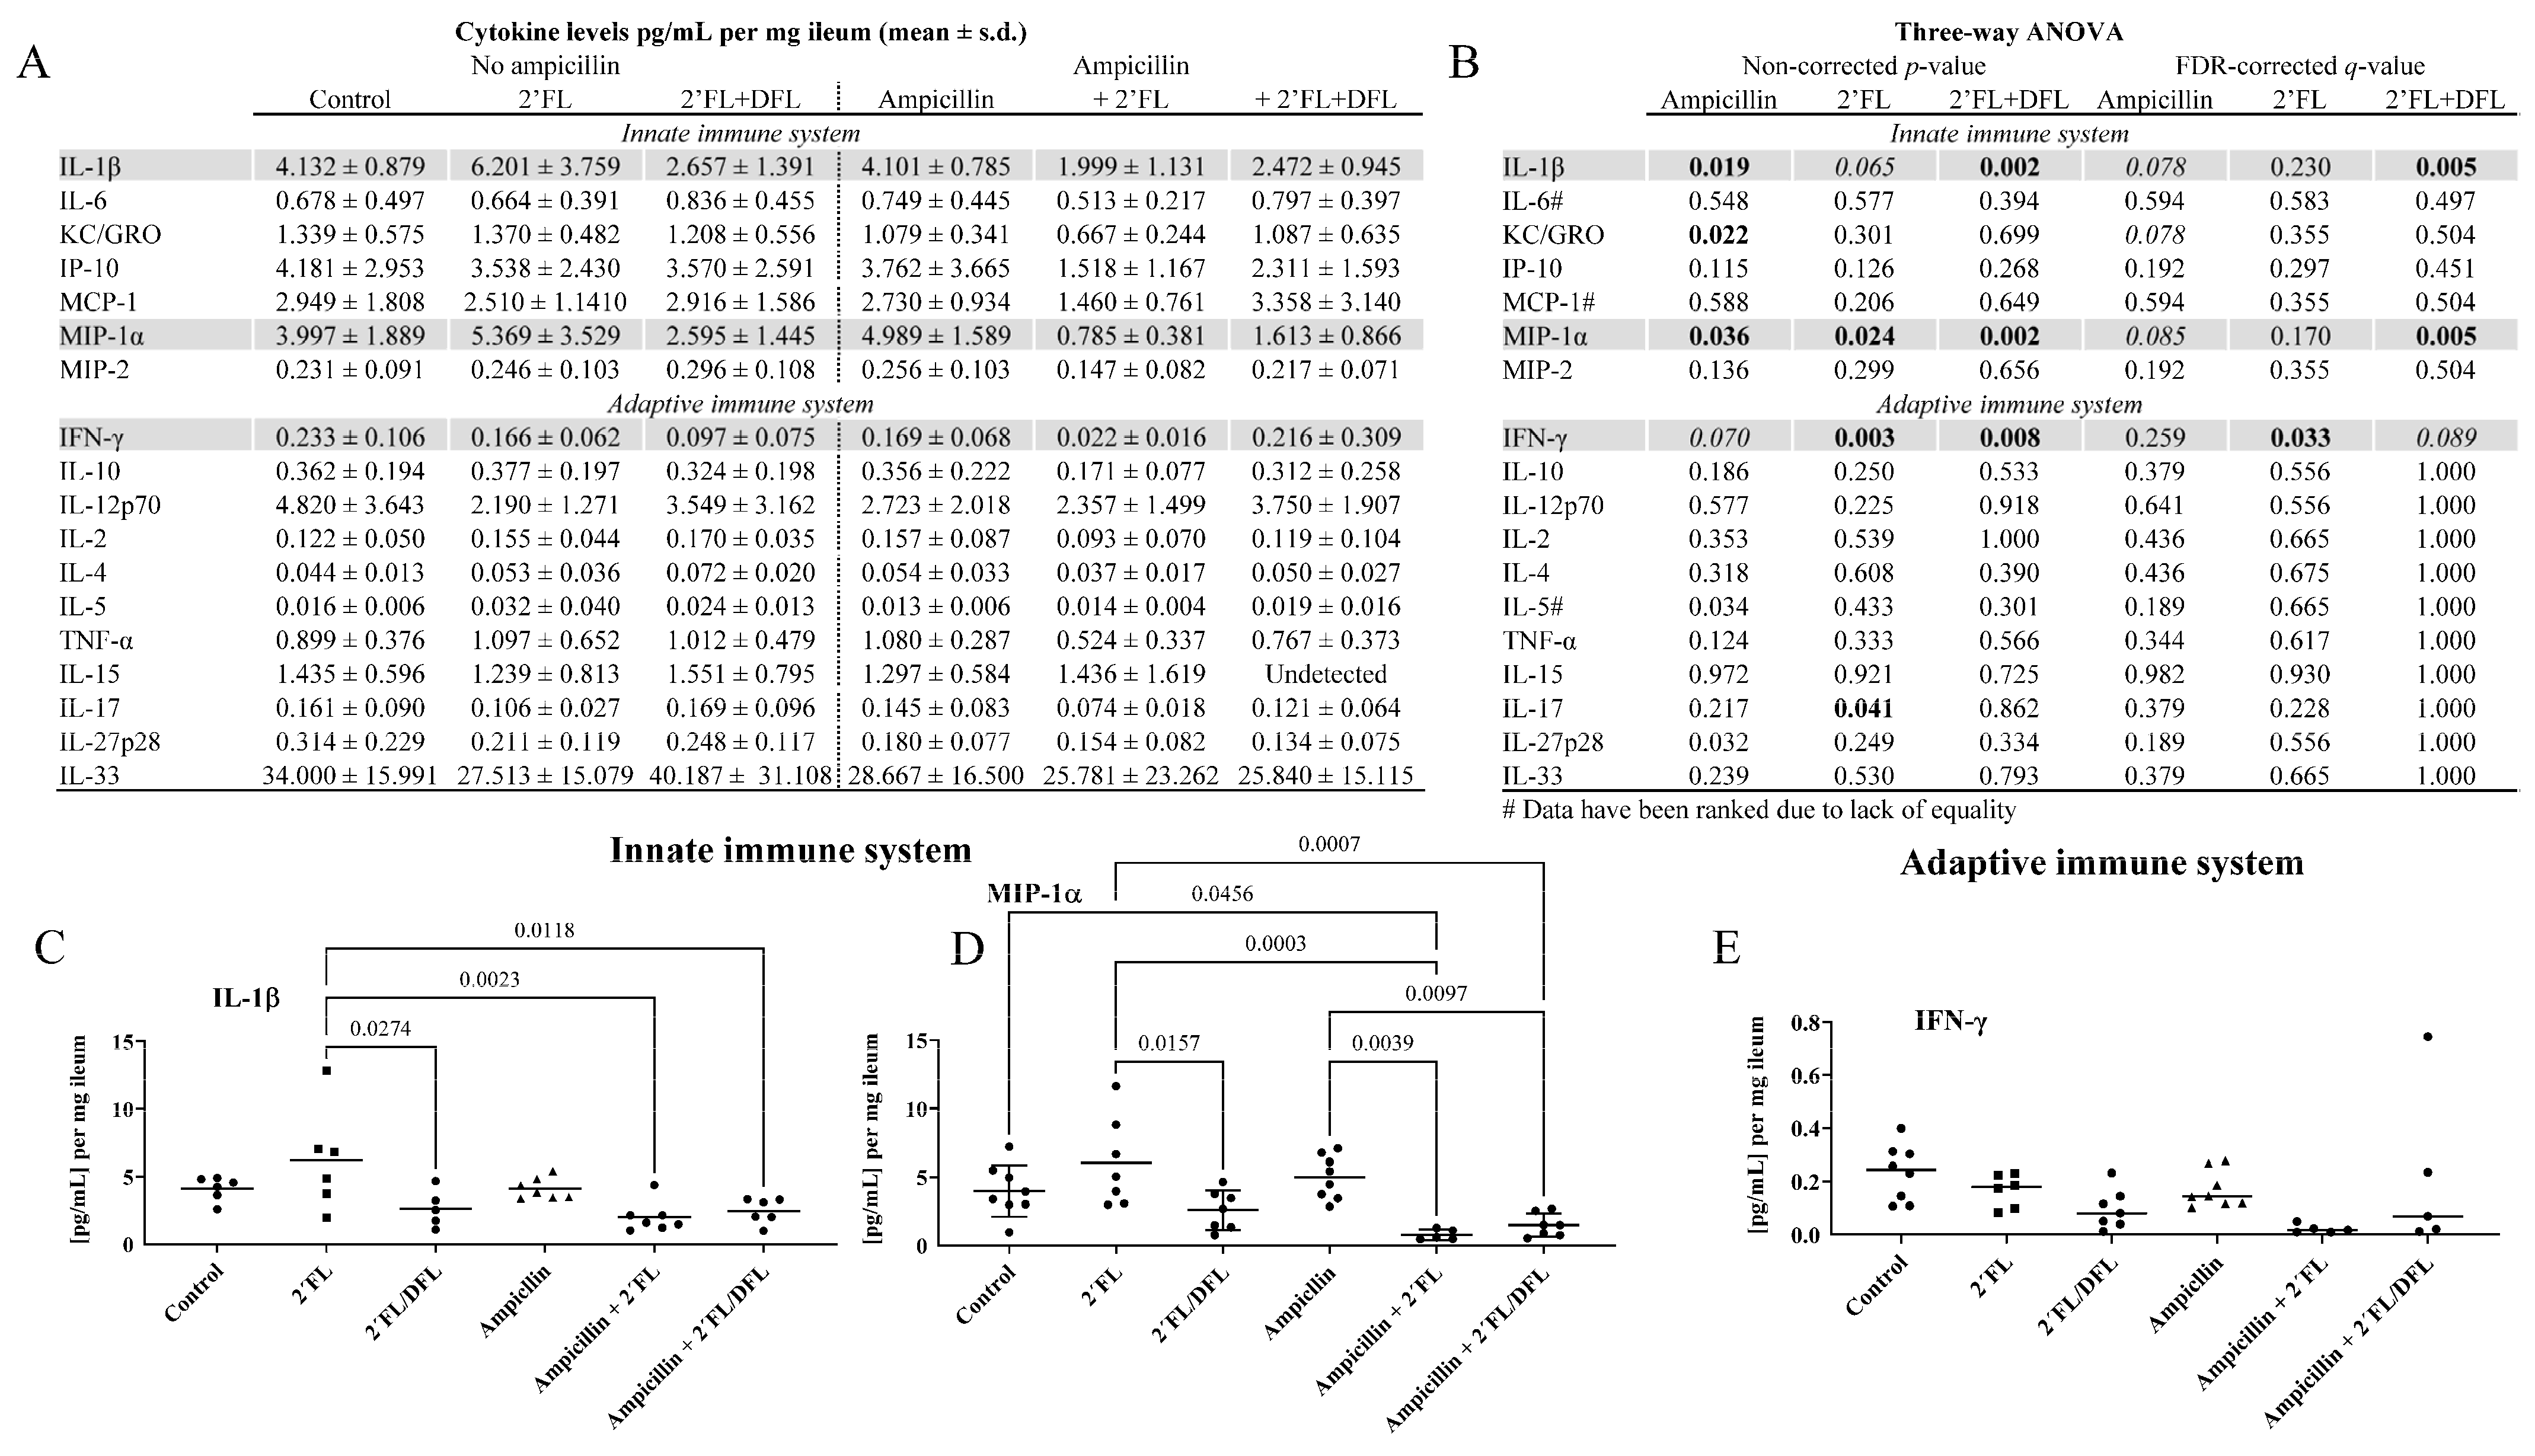
2. Results
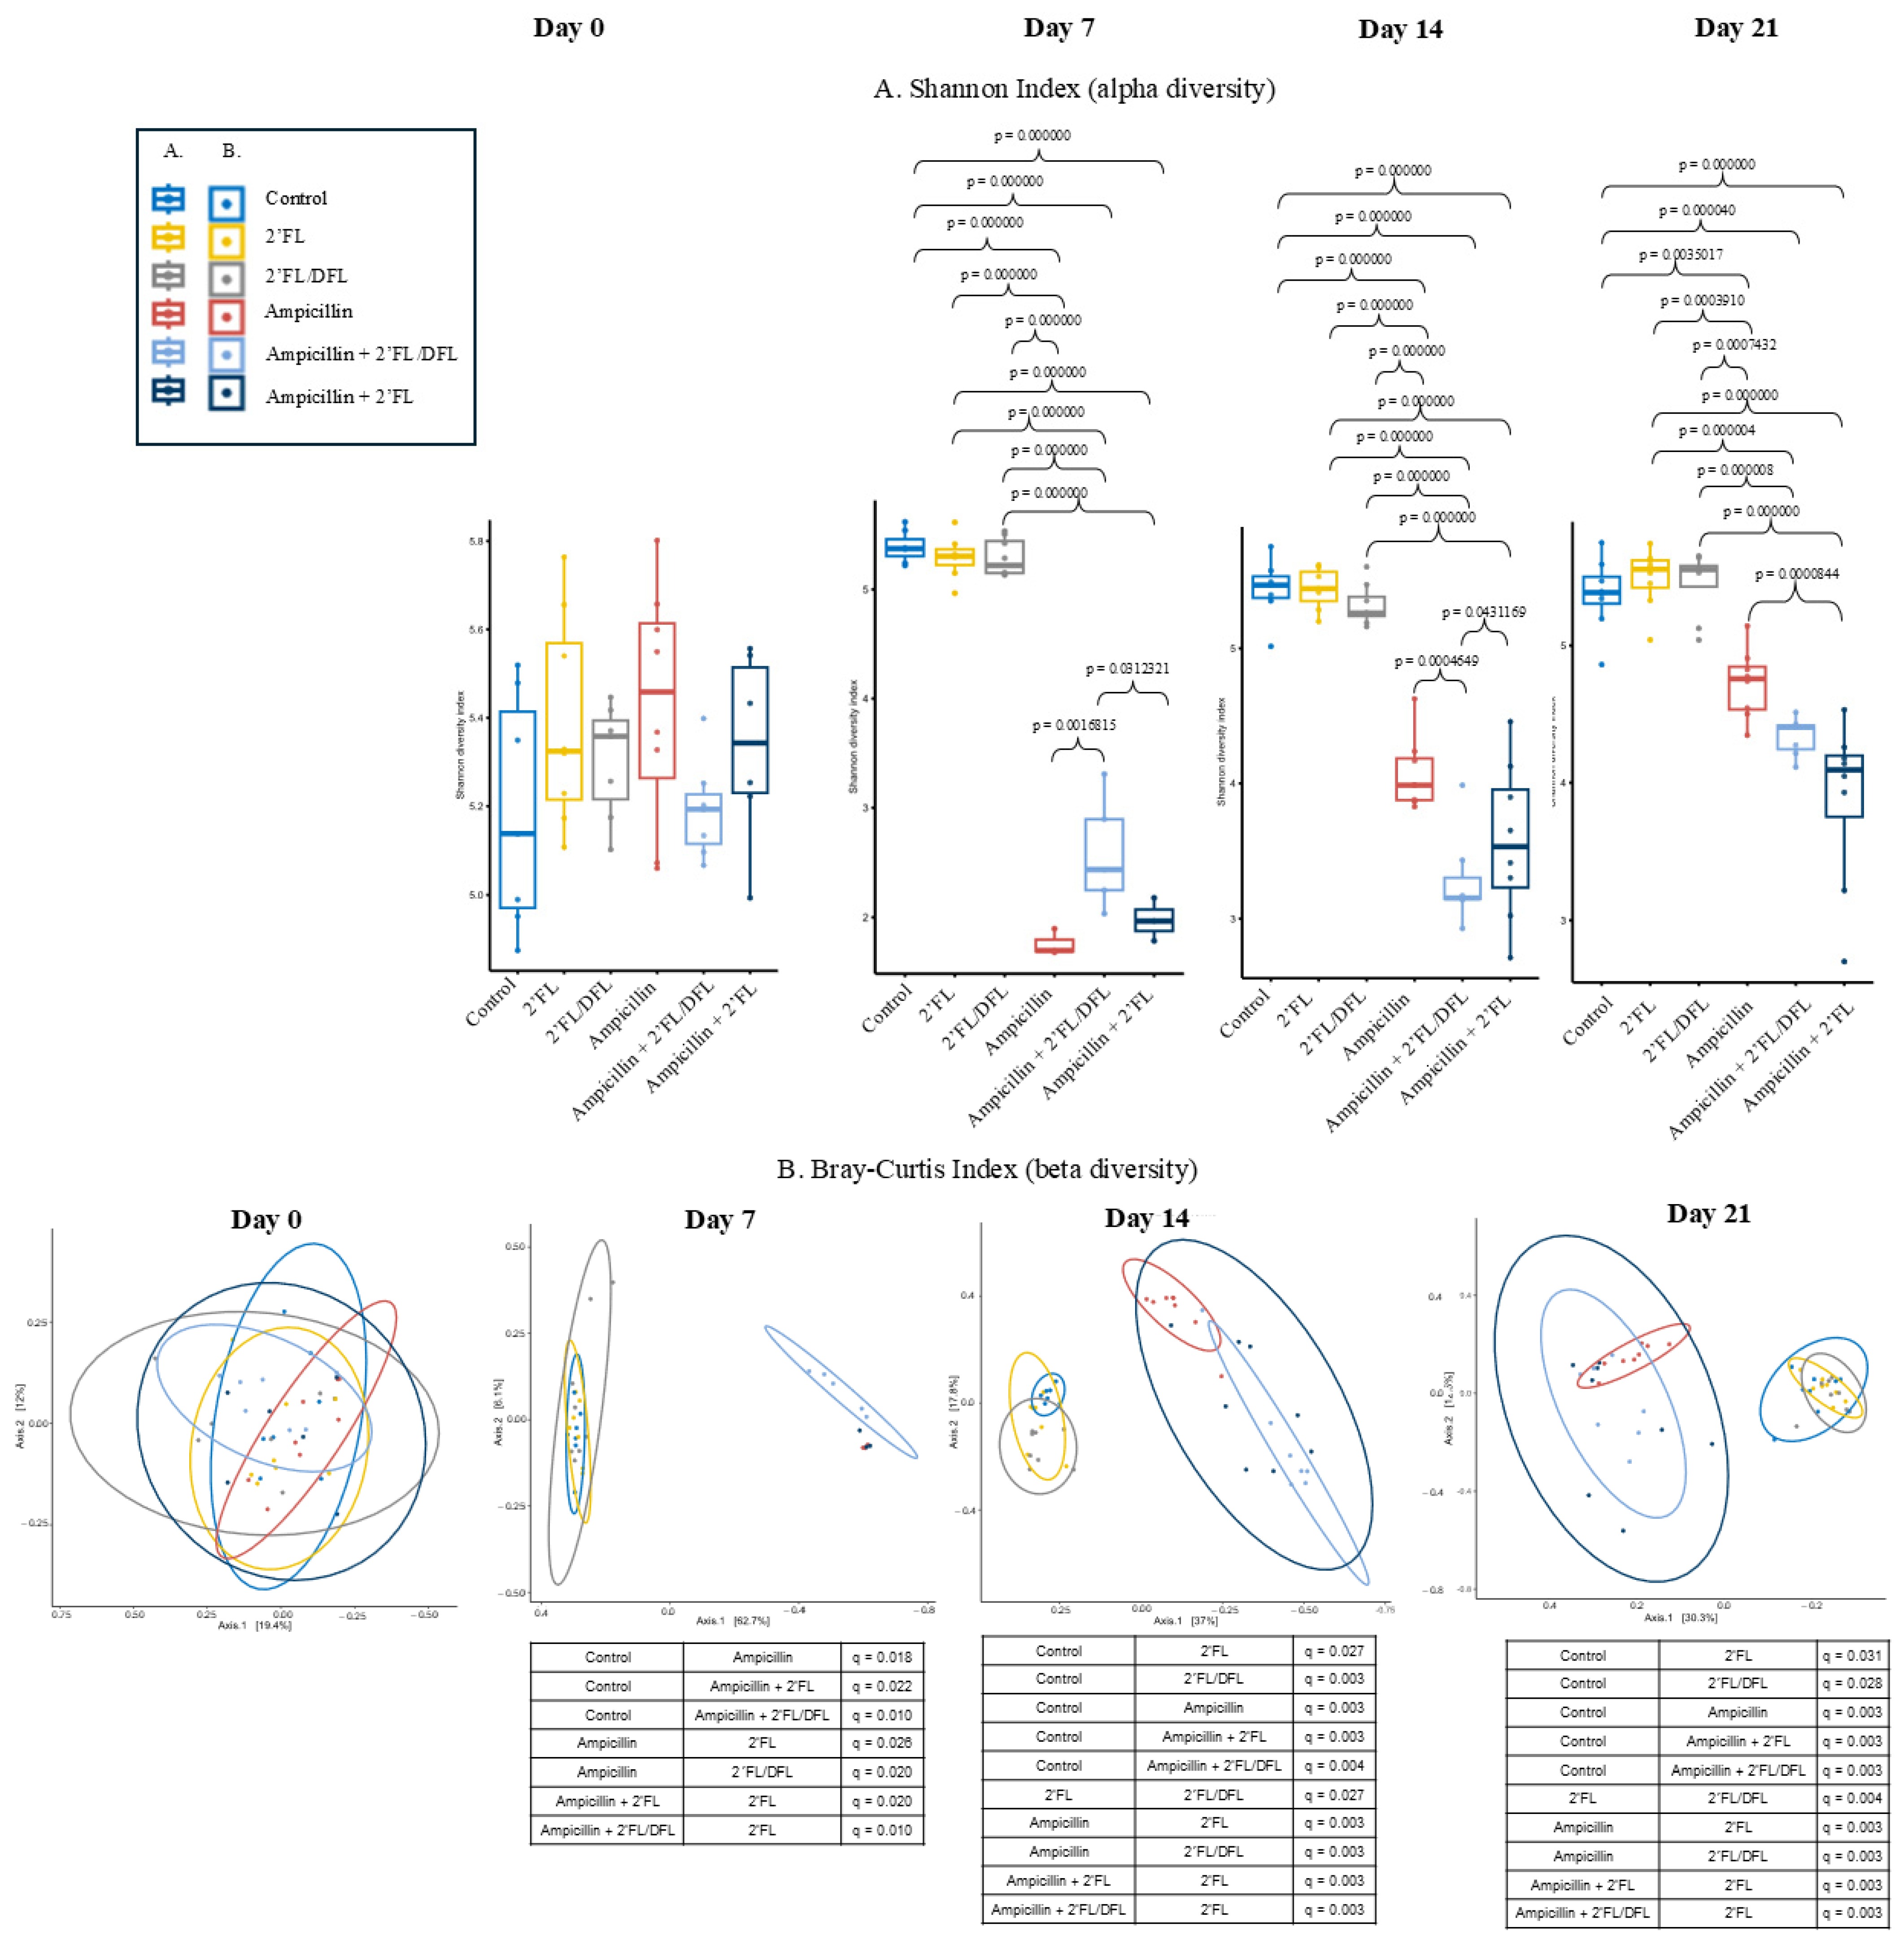
2.1. Ampicillin Reduced the Microbiota Diversity
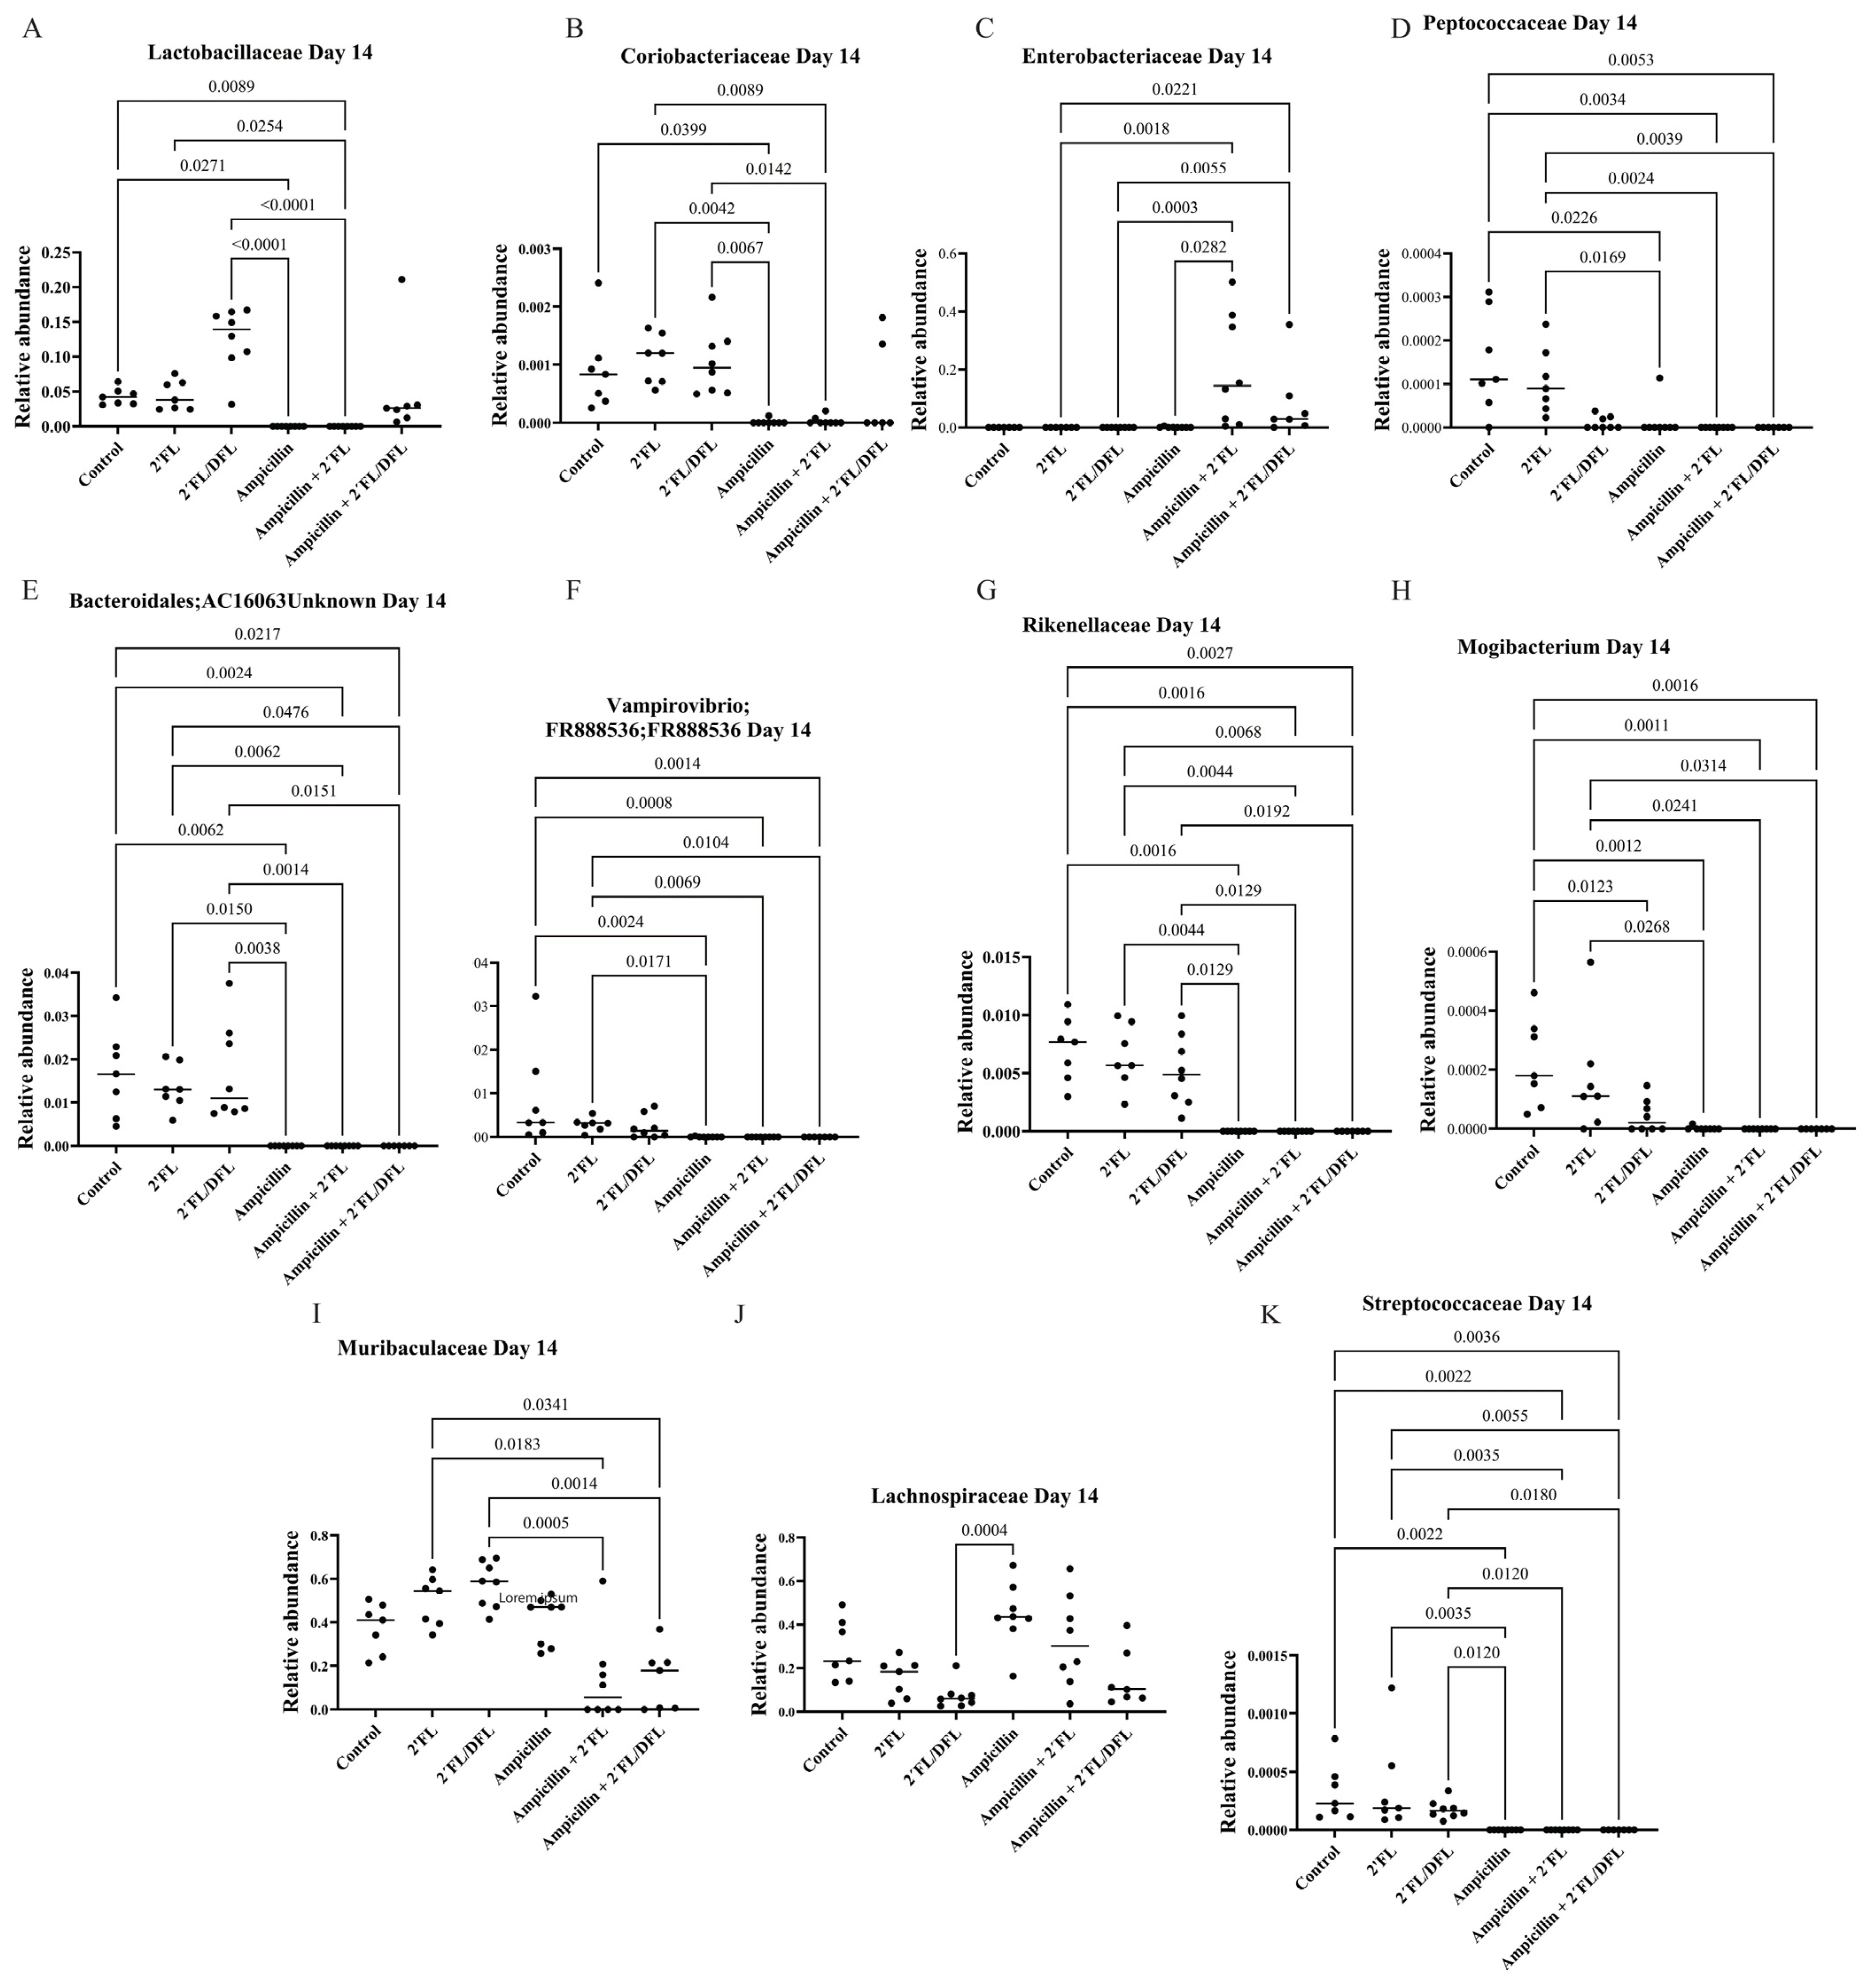
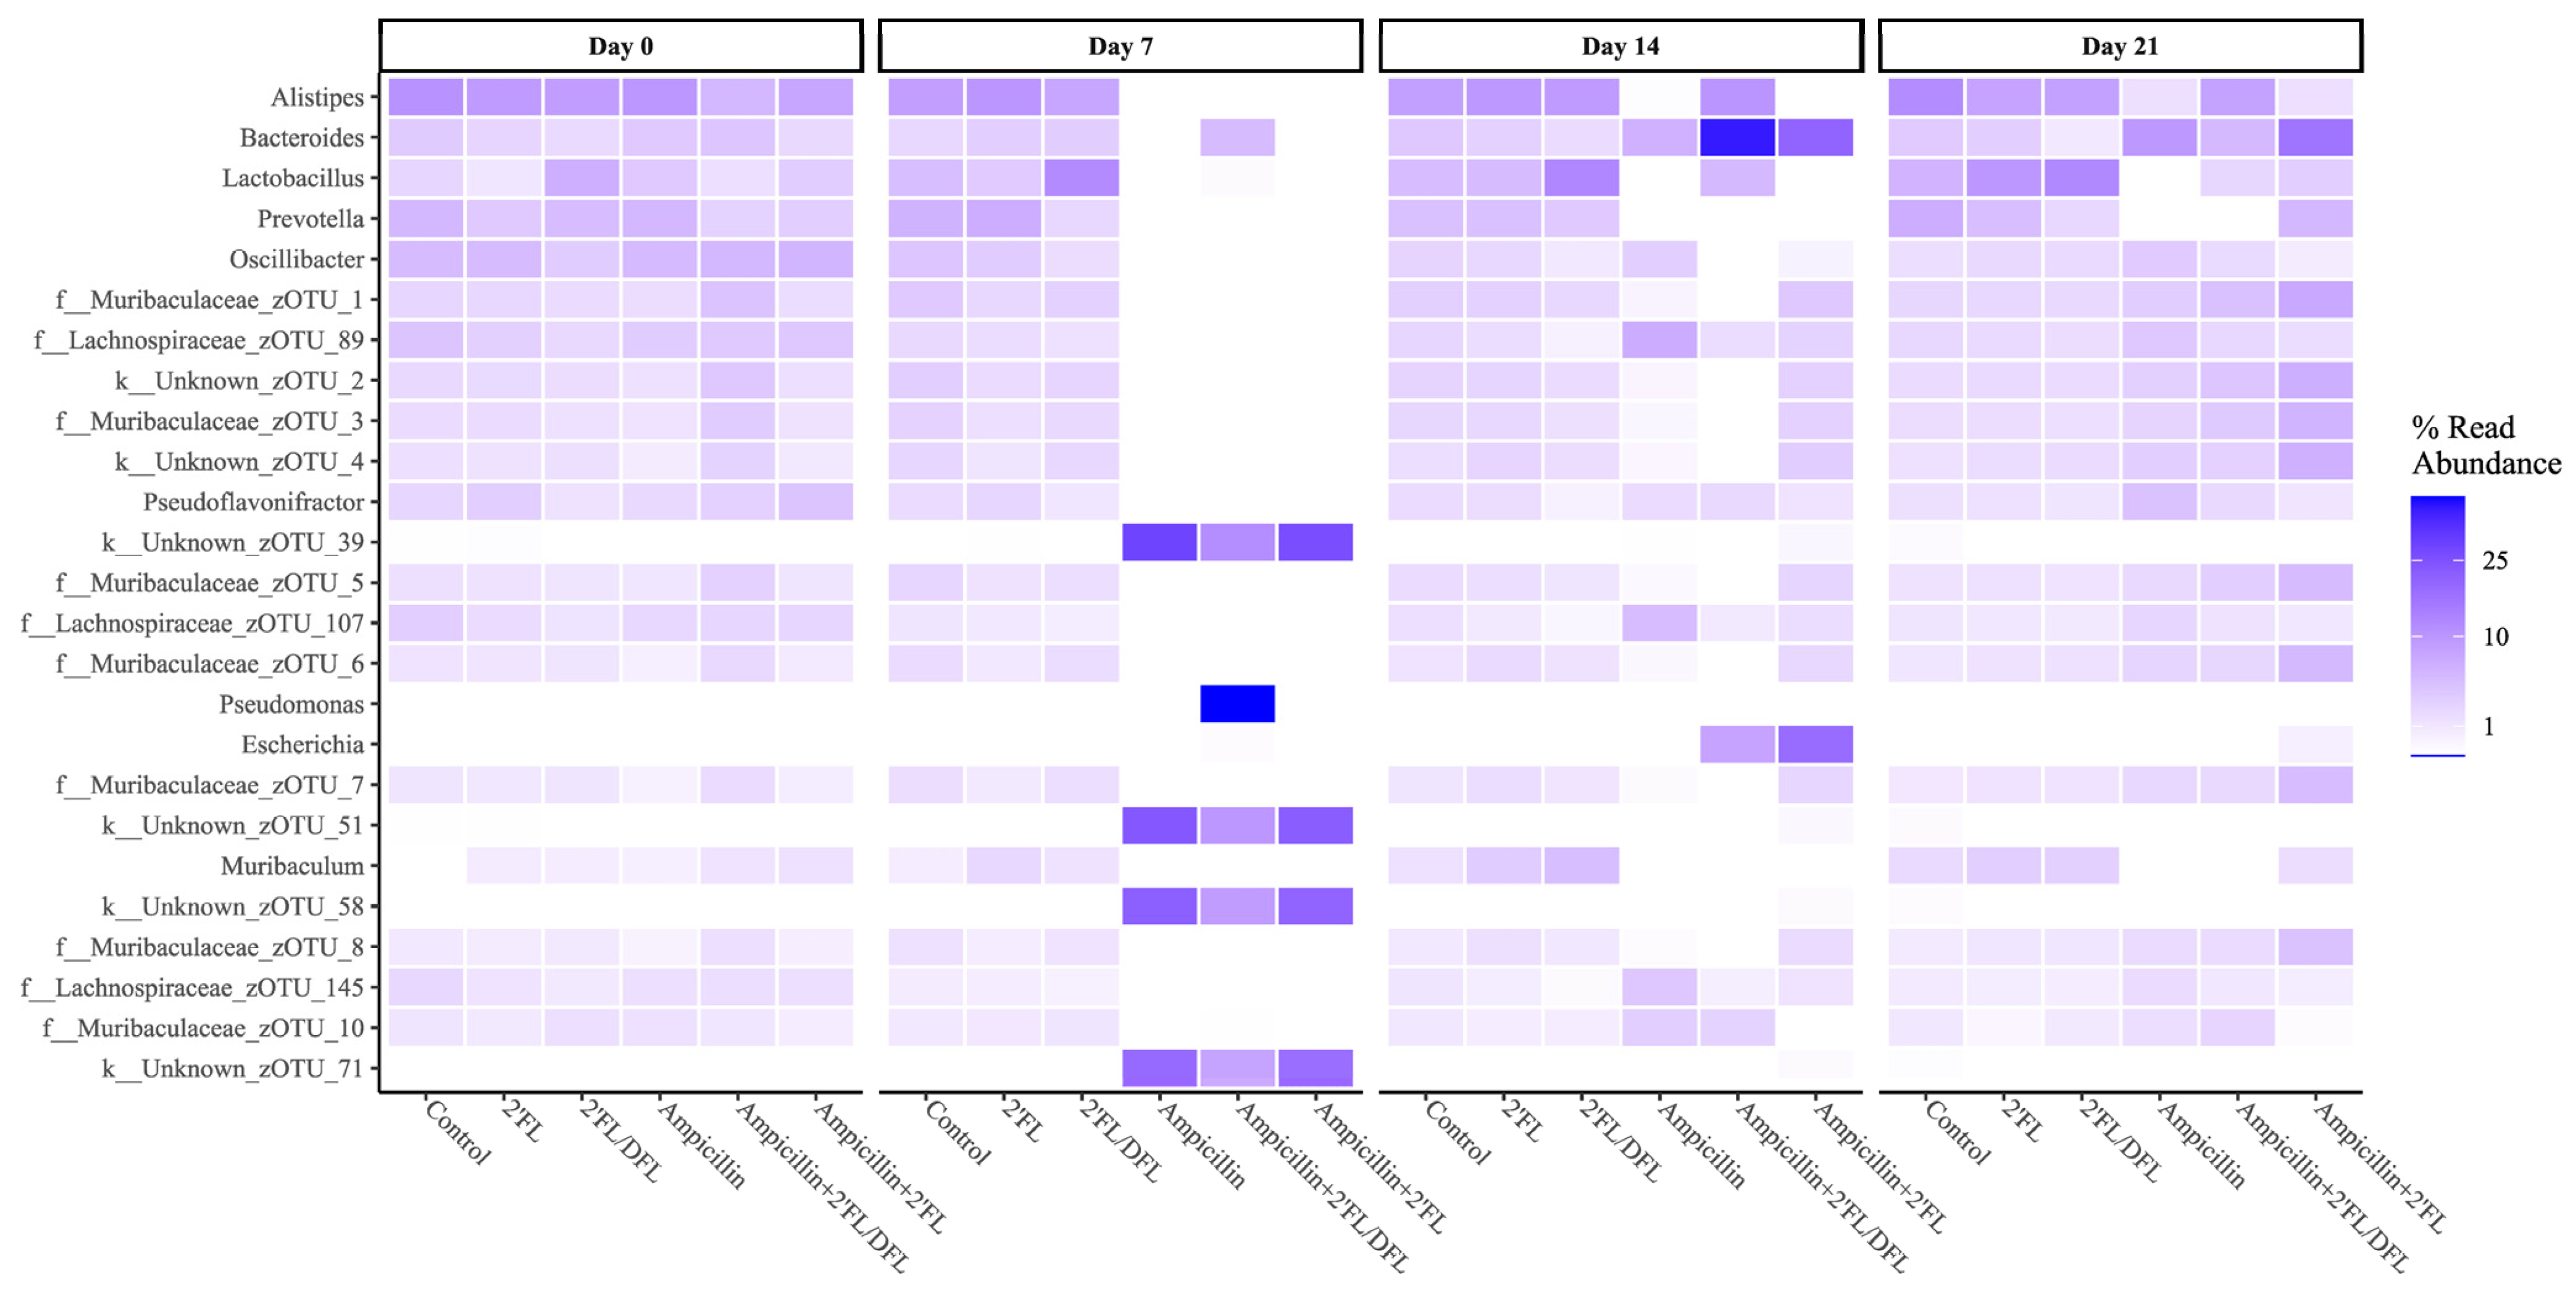
2.2. Ampicillin Significantly Reduced the Abundance of a Range of Bacteria, Which for Some Specific Bacteria Was Counteracted by HMOs
2.3. The 2′FL + DFL Mixture Reduced Adaptive and Innate Inflammation
2.4. Cecal Propionate Levels Were Reduced by Ampicillin and Increased by the 2′FL/DFL Mixture
2.5. Ampicillin Downregulated Ileal Gzmb and Upregulated Ileal Reg3a
2.6. Ampicillin Reduced the Growth of the Mice
3. Discussion
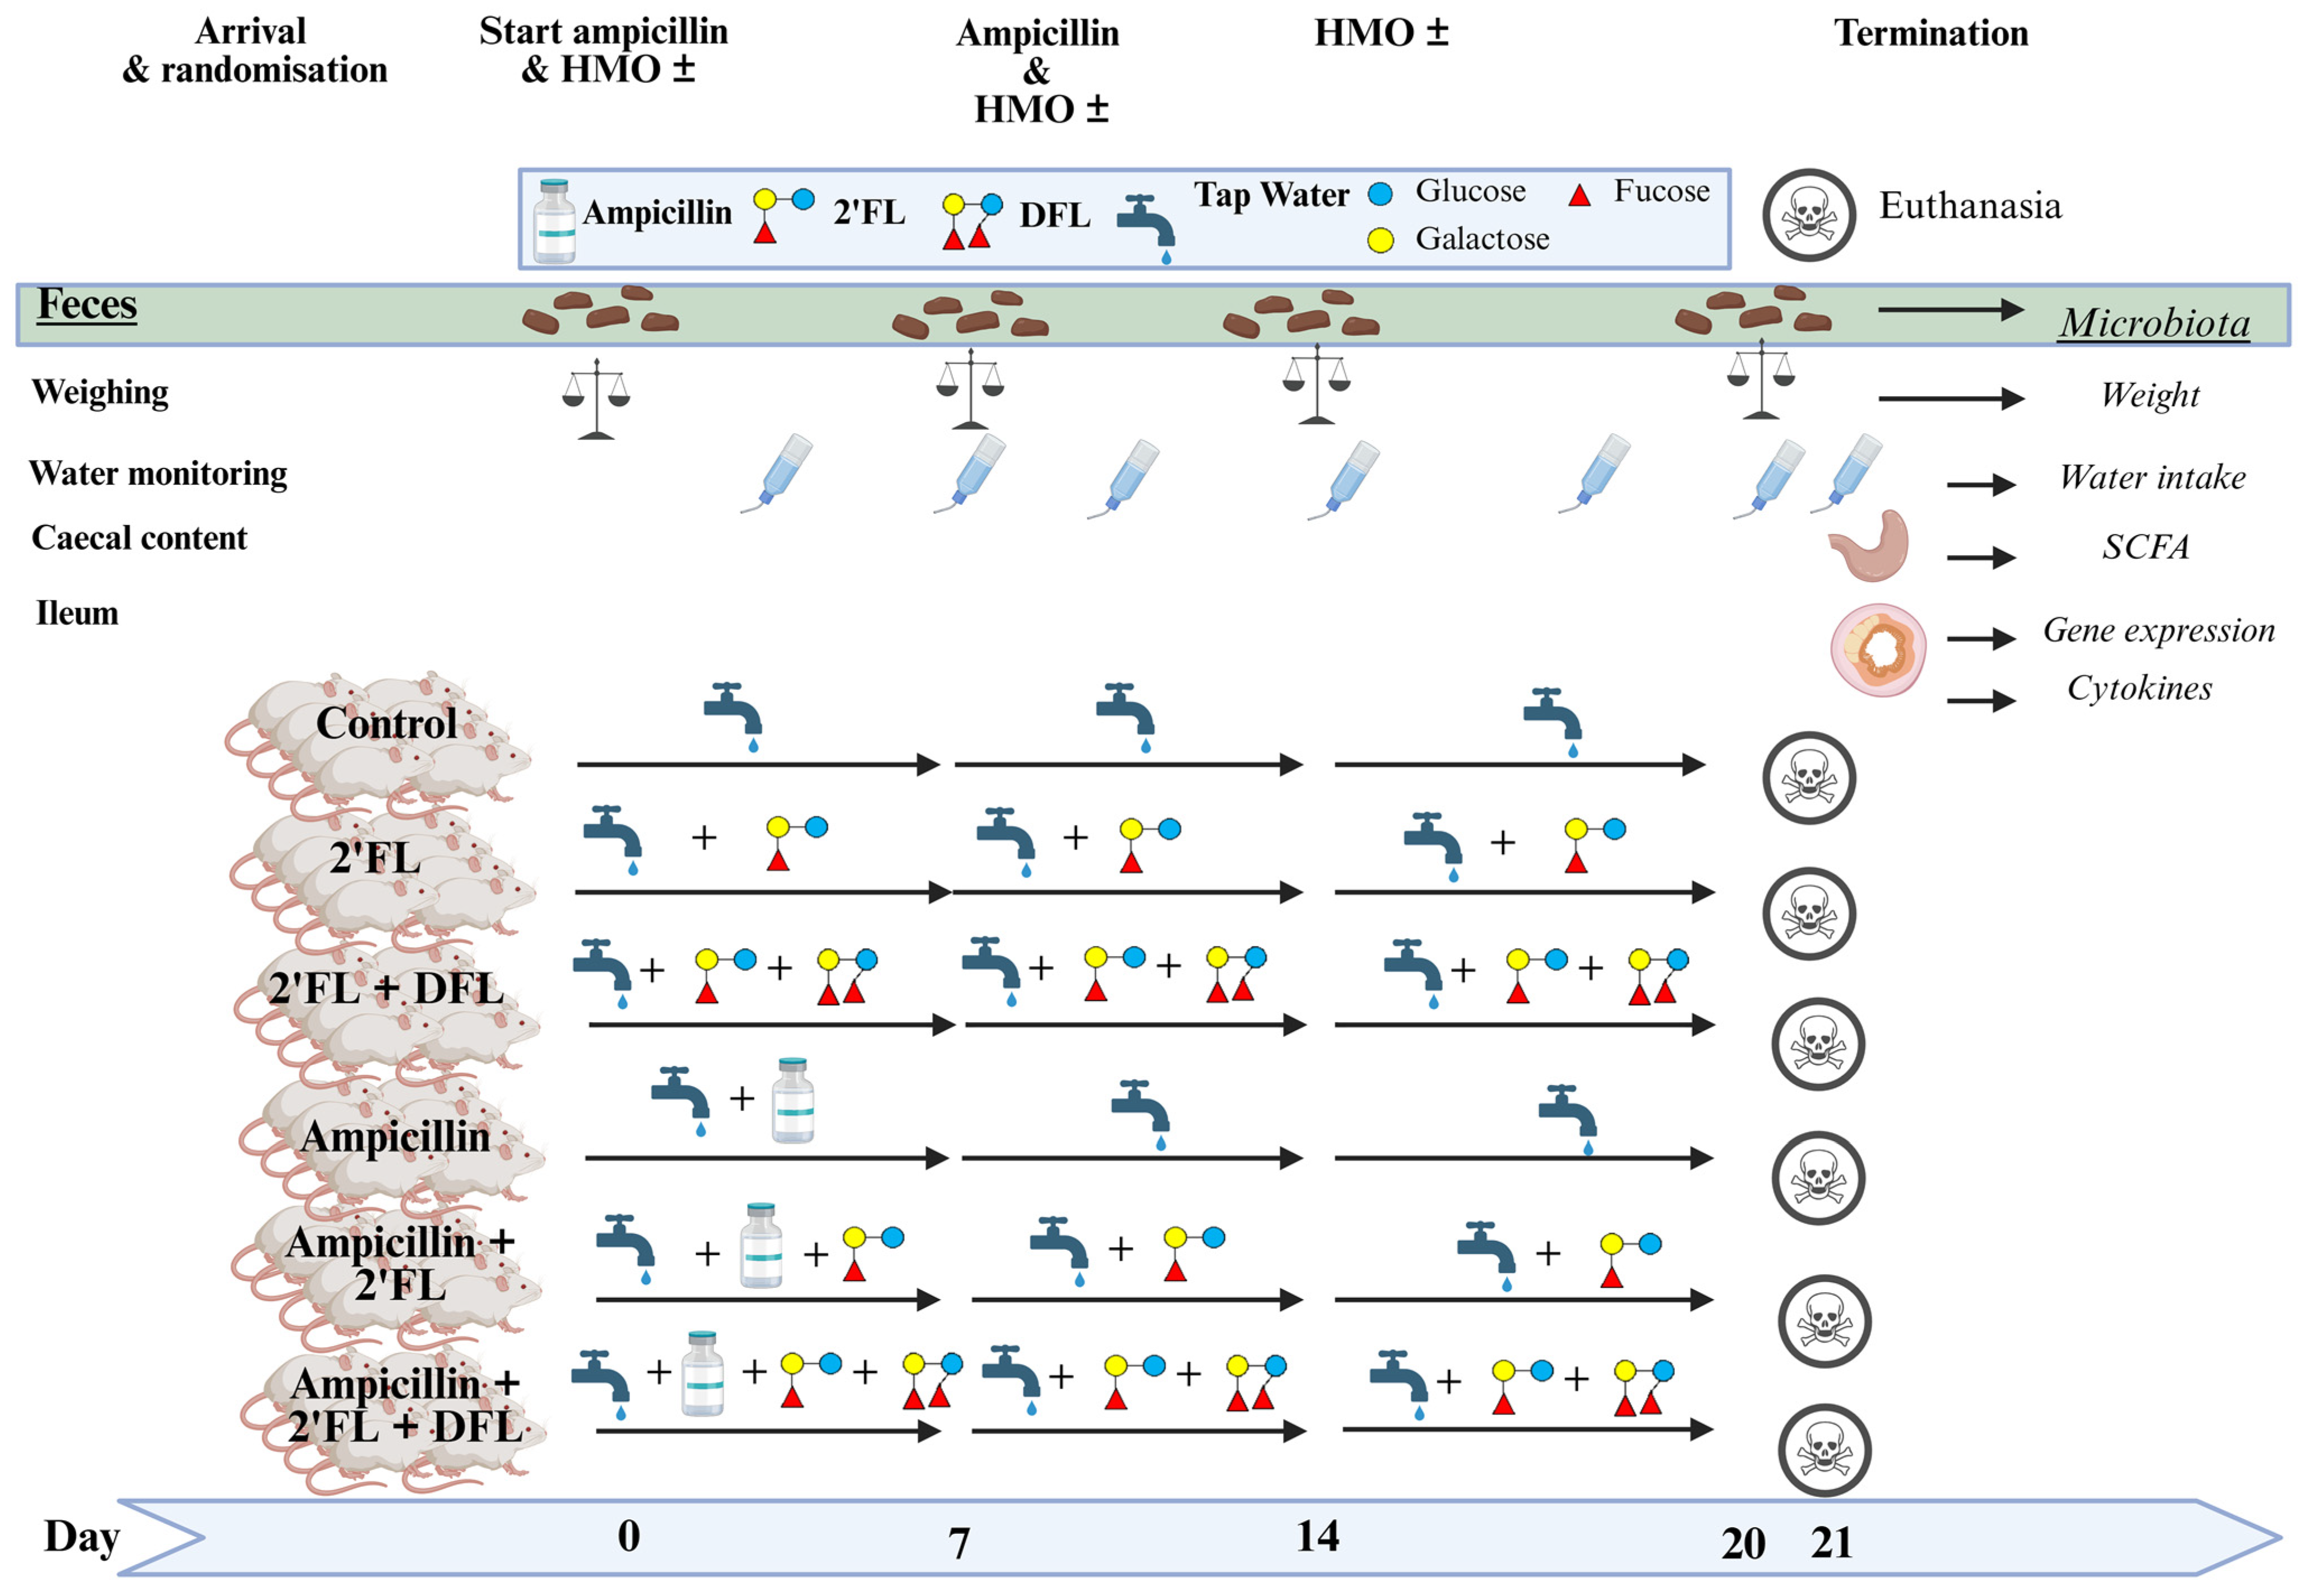
4. Materials and Methods
4.1. Animals
4.2. Study Setup
4.3. Microbiota Characterization
4.4. Cytokines
4.5. Proton (1H) NMR Spectroscopic Analysis of Short-Chain Fatty Acids (SCFAs)
4.6. Fluidigm Biomark High-Throughput Gene Expression Analysis
4.7. Statistics
5. Conclusions
Supplementary Materials
Author Contributions
Funding
Institutional Review Board Statement
Informed Consent Statement
Data Availability Statement
Acknowledgments
Conflicts of Interest
Abbreviations
| 2′FL | 2′-fucosyl-lactose |
| AAALAC | Association for Assessment and Accreditation of Laboratory Animal Care International |
| ANOVA | analysis of variance |
| AUC | area under the curve |
| DFL | difucosyl-lactose |
| FDR | false discovery rate |
| HMO | human milk oligosaccharides |
| min | minutes |
| PBS | phosphate-buffered saline |
| qPCR | quantitative polymerase chain reaction |
| SCFA | short-chain fatty acids |
| TLR4 | Toll-like receptor 4 |
References
- Marino, A.; Munafò, A.; Zagami, A.; Ceccarelli, M.; Di Mauro, R.; Cantarella, G.; Bernardini, R.; Nunnari, G.; Cacopardo, B. Ampicillin Plus Ceftriaxone Regimen Against Enterococcus faecalis Endocarditis: A Literature Review. J. Clin. Med. 2021, 10, 4594. [Google Scholar] [CrossRef]
- Liu, P.; Zhang, Y.; Zhang, Z.; Huang, X.; Su, X.; Yang, S.; Xie, Y. Antibiotic-Induced Dysbiosis of the Gut Microbiota Impairs Gene Expression in Gut-Liver Axis of Mice. Genes 2023, 14, 1423. [Google Scholar] [CrossRef] [PubMed]
- Uttarwar, R.G.; Mekonnen, S.A.; Van Beeck, W.; Wang, A.; Finnegan, P.; Roberts, R.F.; Merenstein, D.; Slupsky, C.M.; Marco, M.L. Effects of Bifidobacterium animalis subsp. lactis BB-12 and yogurt on mice during oral antibiotic administration. Microbiol. Res. 2024, 286, 127794. [Google Scholar] [CrossRef] [PubMed]
- Miller, A.C.; Arakkal, A.T.; Sewell, D.K.; Segre, A.M.; Tholany, J.; Polgreen, P.M.; Group, C.M.-H. Comparison of Different Antibiotics and the Risk for Community-Associated Clostridioides difficile Infection: A Case–Control Study. Open Forum Infect. Dis. 2023, 10, ofad413. [Google Scholar] [CrossRef]
- Goulding, D.R.; Myers, P.H.; Dickerson, A.B.; Comins, M.M.; Wiltshire, R.A.; Blankenship-Paris, T.L. Comparative Efficacy of Two Types of Antibiotic Mixtures in Gut Flora Depletion in Female C57BL/6 Mice. Comp. Med. 2021, 71, 203–209. [Google Scholar] [CrossRef] [PubMed]
- Castro-Mejia, J.L.; Jakesevic, M.; Fabricius, N.F.; Krych, L.; Nielsen, D.S.; Kot, W.; Bendtsen, K.M.; Vogensen, F.K.; Hansen, C.H.F.; Hansen, A.K. Gut microbiota recovery and immune response in ampicillin-treated mice. Res. Vet. Sci. 2018, 118, 357–364. [Google Scholar] [CrossRef]
- Newton, D.F.; Macfarlane, S.; Macfarlane, G.T. Effects of antibiotics on bacterial species composition and metabolic activities in chemostats containing defined populations of human gut microorganisms. Antimicrob. Agents Chemother. 2013, 57, 2016–2025. [Google Scholar] [CrossRef]
- Duysburgh, C.; Van den Abbeele, P.; Morera, M.; Marzorati, M. Lacticaseibacillus rhamnosus GG and Saccharomyces cerevisiae boulardii supplementation exert protective effects on human gut microbiome following antibiotic administration in vitro. Benef. Mirbobes 2021, 12, 365–380. [Google Scholar] [CrossRef]
- Beresford-Jones, B.S.; Forster, S.C.; Stares, M.D.; Notley, G.; Viciani, E.; Browne, H.P.; Boehmler, D.J.; Soderholm, A.T.; Kumar, N.; Vervier, K.; et al. The Mouse Gastrointestinal Bacteria Catalogue enables translation between the mouse and human gut microbiotas via functional mapping. Cell Host Microbe 2022, 30, 124–138.e8. [Google Scholar] [CrossRef]
- Rezende, R.M.; Weiner, H.L. Oral tolerance: An updated review. Immunol. Lett. 2022, 245, 29–37. [Google Scholar] [CrossRef]
- Huang, Z.; Zhu, J.; Bu, X.; Lu, S.; Luo, Y.; Liu, T.; Duan, N.; Wang, W.; Wang, Y.; Wang, X. Probiotics and prebiotics: New treatment strategies for oral potentially malignant disorders and gastrointestinal precancerous lesions. NPJ Biofilms Microbiomes 2025, 11, 55. [Google Scholar] [CrossRef]
- Gibson, G.R.; Hutkins, R.; Sanders, M.E.; Prescott, S.L.; Reimer, R.A.; Salminen, S.J.; Scott, K.; Stanton, C.; Swanson, K.S.; Cani, P.D.; et al. Expert consensus document: The International Scientific Association for Probiotics and Prebiotics (ISAPP) consensus statement on the definition and scope of prebiotics. Nat. Rev. Gastroenterol. Hepatol. 2017, 14, 491–502. [Google Scholar] [CrossRef] [PubMed]
- Belorkar, S.A.; Gupta, A.K. Oligosaccharides: A boon from nature’s desk. AMB Express 2016, 6, 82. [Google Scholar] [CrossRef] [PubMed]
- Hegar, B.; Wibowo, Y.; Basrowi, R.W.; Ranuh, R.G.; Sudarmo, S.M.; Munasir, Z.; Atthiyah, A.F.; Widodo, A.D.; Supriatmo; Kadim, M.; et al. The Role of Two Human Milk Oligosaccharides, 2′-Fucosyllactose and Lacto-N-Neotetraose, in Infant Nutrition. Pediatr. Gastroenterol. Hepatol. Nutr. 2019, 22, 330–340. [Google Scholar] [CrossRef] [PubMed]
- Xi, M.; Hao, G.; Yao, Q.; Duan, X.; Ge, W. Galactooligosaccharide Mediates NF-κB Pathway to Improve Intestinal Barrier Function and Intestinal Microbiota. Molecules 2023, 28, 7611. [Google Scholar] [CrossRef]
- Sarkar, S.R.; Mazumder, P.M.; Banerjee, S. Oligosaccharide and Flavanoid Mediated Prebiotic Interventions to Treat Gut Dysbiosis Associated Cognitive Decline. J. Neuroimmune Pharmacol. 2022, 17, 94–110. [Google Scholar] [CrossRef]
- Sun, W.; Tao, L.; Qian, C.; Xue, P.; Tong, X.; Yang, L.; Lu, F.; Wan, H.; Tao, Y. Human milk oligosaccharides and the association with microbiota in colostrum: A pilot study. Arch. Microbiol. 2024, 206, 58. [Google Scholar] [CrossRef]
- Samuel, T.M.; Binia, A.; de Castro, C.A.; Thakkar, S.K.; Billeaud, C.; Agosti, M.; Al-Jashi, I.; Costeira, M.J.; Marchini, G.; Martínez-Costa, C.; et al. Impact of maternal characteristics on human milk oligosaccharide composition over the first 4 months of lactation in a cohort of healthy European mothers. Sci. Rep. 2019, 9, 11767. [Google Scholar] [CrossRef]
- Hoeflinger, J.L.; Davis, S.R.; Chow, J.; Miller, M.J. In vitro impact of human milk oligosaccharides on Enterobacteriaceae growth. J. Agric. Food Chem. 2015, 63, 3295–3302. [Google Scholar] [CrossRef]
- Šuligoj, T.; Vigsnæs, L.K.; Abbeele, P.V.D.; Apostolou, A.; Karalis, K.; Savva, G.M.; McConnell, B.; Juge, N. Effects of Human Milk Oligosaccharides on the Adult Gut Microbiota and Barrier Function. Nutrients 2020, 12, 2808. [Google Scholar] [CrossRef]
- Boll, E.J.; Lopez, D.V.; Terne, M.; Hessing, S.; Parschat, K.; Jensen, S.R. Human milk oligosaccharides differentially support gut barrier integrity and enhance Th1 and Th17 cell effector responses in vitro. Front. Immunol. 2024, 15, 1359499. [Google Scholar] [CrossRef]
- Hanisch, F.-G.; Hansman, G.S.; Morozov, V.; Kunz, C.; Schroten, H. Avidity of α-fucose on human milk oligosaccharides and blood group–unrelated oligo/polyfucoses is essential for potent norovirus-binding targets. J. Biol. Chem. 2018, 293, 11955–11965. [Google Scholar] [CrossRef]
- Rosa, F.; Sharma, A.K.; Gurung, M.; Casero, D.; Matazel, K.; Bode, L.; Simecka, C.; Elolimy, A.A.; Tripp, P.; Randolph, C.; et al. Human Milk Oligosaccharides Impact Cellular and Inflammatory Gene Expression and Immune Response. Front. Immunol. 2022, 13, 907529. [Google Scholar] [CrossRef] [PubMed]
- Han, X.; Wang, Z.; Cao, H.; Liu, W.; Sun, L.; Xiao, Q. Dietary human milk oligosaccharides reduce allergic airway inflammation by modulating SCFAs level and ILC2 activity. Immunology 2024, 173, 562–574. [Google Scholar] [CrossRef] [PubMed]
- Cheng, Y.-J.; Yeung, C.-Y. Recent advance in infant nutrition: Human milk oligosaccharides. Pediatr. Neonatol. 2021, 62, 347–353. [Google Scholar] [CrossRef] [PubMed]
- Chen, Y.J.; Sui, X.; Wang, Y.; Zhao, Z.H.; Han, T.H.; Liu, Y.J.; Zhang, J.N.; Zhou, P.; Yang, K.; Ye, Z.H. Preparation, structural characterization, biological activity, and nutritional applications of oligosaccharides. Food Chem. X 2024, 22, 101289. [Google Scholar] [CrossRef]
- Bych, K.; Mikš, M.H.; Johanson, T.; Hederos, M.J.; Vigsnæs, L.K.; Becker, P. Production of HMOs using microbial hosts—From cell engineering to large scale production. Curr. Opin. Biotechnol. 2019, 56, 130–137. [Google Scholar] [CrossRef]
- Hansen, A.K.; Hansen, C.H.F. The microbiome and rodent models of immune mediated diseases. Mamm. Genome 2021, 32, 251–262. [Google Scholar] [CrossRef]
- Hansen, C.H.F.; Frøkiær, H.; Christensen, A.G.; Bergström, A.; Licht, T.R.; Hansen, A.K.; Metzdorff, S.B. Dietary xylooligosaccharide downregulates IFN-γ and the low-grade inflammatory cytokine IL-1β systemically in mice. J. Nutr. 2013, 143, 533–540. [Google Scholar] [CrossRef]
- Hansen, C.H.F.; Larsen, C.S.; Petersson, H.O.; Zachariassen, L.F.; Vegge, A.; Lauridsen, C.; Kot, W.; Krych, L.; Nielsen, D.S.; Hansen, A.K. Targeting gut microbiota and barrier function with prebiotics to alleviate autoimmune manifestations in NOD mice. Diabetologia 2019, 62, 1689–1700. [Google Scholar] [CrossRef]
- Laigaard, A.; Krych, L.; Zachariassen, L.F.; Ellegaard-Jensen, L.; Nielsen, D.S.; Hansen, A.K.; Hansen, C.H.F. Dietary prebiotics promote intestinal Prevotella in association with a low-responding phenotype in a murine oxazolone-induced model of atopic dermatitis. Sci. Rep. 2020, 10, 21204. [Google Scholar] [CrossRef] [PubMed]
- Liu, F.; Tol, A.J.C.; Kuipers, F.; Oosterveer, M.H.; van der Beek, E.M.; van Leeuwen, S.S. Characterization of milk oligosaccharide and sialic acid content and their influence on brain sialic acid in a lean mouse model for gestational diabetes. Heliyon 2024, 10, e24539. [Google Scholar] [CrossRef]
- Wang, L.; Pan, Y.; Zhang, X.; Ren, X. Comparative study the alleviated effects of various oligosaccharides on colitis in mice. Int. Immunopharmacol. 2024, 135, 112293. [Google Scholar] [CrossRef] [PubMed]
- Zhu, L.; Zhang, Z.; Luo, T.; Li, H.; Deng, Z.; Li, J.; Zheng, L.; Liao, J.; Wang, M.; Zhang, B. Cognitive and behavioral benefits of 2′-fucosyllactose in growing mice: The roles of 5-hydroxytryptophan and gut microbiota. Microbiome 2025, 13, 97. [Google Scholar] [CrossRef]
- Ferrier, L.; Eutamène, H.; Siegwald, L.; Marquard, A.M.; Tondereau, V.; Chevalier, J.; Jacot, G.E.; Favre, L.; Theodorou, V.; Vicario, M.; et al. Human milk oligosaccharides alleviate stress-induced visceral hypersensitivity and associated microbiota dysbiosis. J. Nutr. Biochem. 2022, 99, 108865. [Google Scholar] [CrossRef]
- Salli, K.; Hirvonen, J.; Siitonen, J.; Ahonen, I.; Anglenius, H.; Maukonen, J. Selective Utilization of the Human Milk Oligosaccharides 2′-Fucosyllactose, 3-Fucosyllactose, and Difucosyllactose by Various Probiotic and Pathogenic Bacteria. J. Agric. Food Chem. 2021, 69, 170–182. [Google Scholar] [CrossRef] [PubMed]
- Zabel, B.E.; Gerdes, S.; Evans, K.C.; Nedveck, D.; Singles, S.K.; Volk, B.; Budinoff, C. Strain-specific strategies of 2′-fucosyllactose, 3-fucosyllactose, and difucosyllactose assimilation by Bifidobacterium longum subsp. infantis Bi-26 and ATCC 15697. Sci. Rep. 2020, 10, 15919. [Google Scholar] [CrossRef]
- Bondarenko, V.; Løkke, C.R.; Dobrowolski, P.; Mentzel, C.J.; Castro-Mejía, J.L.; Hansen, C.H.F.; Sørensen, D.B.; Nielsen, D.S.; Krych, L.; Hansen, A.K. Controlling the uncontrolled variation in the diet induced obese mouse by microbiomic characterization. Sci. Rep. 2022, 12, 13767. [Google Scholar] [CrossRef]
- Xiao, J.Z.; Takahashi, S.; Nishimoto, M.; Odamaki, T.; Yaeshima, T.; Iwatsuki, K.; Kitaoka, M. Distribution of in vitro fermentation ability of lacto-N-biose I, a major building block of human milk oligosaccharides, in bifidobacterial strains. Appl. Environ. Microbiol. 2010, 76, 54–59. [Google Scholar] [CrossRef]
- O’Toole, P.W.; Marchesi, J.R.; Hill, C. Next-generation probiotics: The spectrum from probiotics to live biotherapeutics. Nat. Microbiol. 2017, 2, 17057. [Google Scholar] [CrossRef]
- Yu, Z.-T.; Chen, C.; Newburg, D.S. Utilization of major fucosylated and sialylated human milk oligosaccharides by isolated human gut microbes. Glycobiology 2013, 23, 1281–1292. [Google Scholar] [CrossRef] [PubMed]
- Marcobal, A.; Barboza, M.; Sonnenburg, E.D.; Pudlo, N.; Martens, E.C.; Desai, P.; Lebrilla, C.B.; Weimer, B.C.; Mills, D.A.; German, J.B.; et al. Bacteroides in the Infant Gut Consume Milk Oligosaccharides via Mucus-Utilization Pathways. Cell Host Microbe 2011, 10, 507–514. [Google Scholar] [CrossRef]
- Rodríguez-Díaz, J.; Rubio-del-Campo, A.; Yebra, M.J. Lactobacillus casei ferments the N-Acetylglucosamine moiety of fucosyl-α-1,3-N-acetylglucosamine and excretes L-fucose. Appl. Environ. Microbiol. 2012, 78, 4613–4619. [Google Scholar] [CrossRef] [PubMed]
- Thongaram, T.; Hoeflinger, J.L.; Chow, J.; Miller, M.J. Human milk oligosaccharide consumption by probiotic and human-associated bifidobacteria and lactobacilli. J. Dairy. Sci. 2017, 100, 7825–7833. [Google Scholar] [CrossRef]
- Schwab, C.; Gänzle, M. Lactic acid bacteria fermentation of human milk oligosaccharide components, human milk oligosaccharides and galactooligosaccharides. FEMS Microbiol. Lett. 2011, 315, 141–148. [Google Scholar] [CrossRef] [PubMed]
- Henriksen, I.W.; Mejia, J.L.C.; Mentzel, C.M.J.; Lindenberg, F.; Hansen, A.K. Oligosaccharide equine feed supplement, Immulix, has minor impact on vaccine responses in mice. Sci. Rep. 2022, 12, 582. [Google Scholar] [CrossRef]
- Lindenberg, F.C.; Lützhøft, D.O.; Krych, L.; Fielden, J.; Kot, W.; Frøkiær, H.; van Galen, G.; Nielsen, D.S.; Hansen, A.K. An Oligosaccharide Rich Diet Increases Akkermansia spp. Bacteria in the Equine Microbiota. Front. Microbiol. 2021, 12, 666039. [Google Scholar] [CrossRef]
- Perry, R.J.; Borders, C.B.; Cline, G.W.; Zhang, X.M.; Alves, T.C.; Petersen, K.F.; Rothman, D.L.; Kibbey, R.G.; Shulman, G.I. Propionate Increases Hepatic Pyruvate Cycling and Anaplerosis and Alters Mitochondrial Metabolism. J. Biol. Chem. 2016, 291, 12161–12170. [Google Scholar] [CrossRef]
- Macy, J.M.; Ljungdahl, L.G.; Gottschalk, G. Pathway of Succinate and Propionate Formation in Bacteroides fragilis. J. Bacteriol. 1978, 134, 84–91. [Google Scholar] [CrossRef]
- Jacobson, A.; Lam, L.; Rajendram, M.; Tamburini, F.; Honeycutt, J.; Pham, T.; Van Treuren, W.; Pruss, K.; Stabler, S.R.; Lugo, K.; et al. A Gut Commensal-Produced Metabolite Mediates Colonization Resistance to Salmonella Infection. Cell Host Microbe 2018, 24, 296–307.e7. [Google Scholar] [CrossRef]
- Wang, J.; Chen, C.; Yu, Z.; He, Y.; Yong, Q.; Newburg, D.S. Relative fermentation of oligosaccharides from human milk and plants by gut microbes. Eur. Food Res. Technol. 2017, 243, 133–146. [Google Scholar] [CrossRef]
- Eriguchi, Y.; Nakamura, K.; Yokoi, Y.; Sugimoto, R.; Takahashi, S.; Hashimoto, D.; Teshima, T.; Ayabe, T.; Selsted, M.E.; Ouellette, A.J. Essential role of IFN-γ in T cell–associated intestinal inflammation. JCI Insight 2018, 3, e121886. [Google Scholar] [CrossRef] [PubMed]
- Yaseen, M.M.; Abuharfeil, N.M.; Darmani, H. The role of IL-1β during human immunodeficiency virus type 1 infection. Rev. Med. Virol. 2023, 33, e2400. [Google Scholar] [CrossRef]
- Suzuki, T.; Hashimoto, S.; Toyoda, N.; Nagai, S.; Yamazaki, N.; Dong, H.Y.; Sakai, J.; Yamashita, T.; Nukiwa, T.; Matsushima, K. Comprehensive gene expression profile of LPS-stimulated human monocytes by SAGE. Blood 2000, 96, 2584–2591. [Google Scholar] [CrossRef] [PubMed]
- Li, J.; Chen, Y.; Li, R.; Zhang, X.; Chen, T.; Mei, F.; Liu, R.; Chen, M.; Ge, Y.; Hu, H.; et al. Gut microbial metabolite hyodeoxycholic acid targets the TLR4/MD2 complex to attenuate inflammation and protect against sepsis. Mol. Ther. 2023, 31, 1017–1032. [Google Scholar] [CrossRef]
- Si, Z.L.; Wang, H.Y.; Wang, T.; Cao, Y.Z.; Li, Q.Z.; Liu, K.; Huang, Z.; Liu, H.L.; Tan, Y.J.; Wang, Y.Y.; et al. Gut Bacteroides ovatus ameliorates renal fibrosis by promoting the production of HDCA through upregulation of Clostridium scindens. Cell Rep. 2024, 43, 114830. [Google Scholar] [CrossRef]
- Wang, Y.; Zou, Y.; Wang, J.; Ma, H.; Zhang, B.; Wang, S. The Protective Effects of 2′-Fucosyllactose against E. coli O157 Infection Are Mediated by the Regulation of Gut Microbiota and the Inhibition of Pathogen Adhesion. Nutrients 2020, 12, 1284. [Google Scholar] [CrossRef]
- Hiroyasu, S.; Hiroyasu, A.; Granville, D.J.; Tsuruta, D. Pathological functions of granzyme B in inflammatory skin diseases. J. Dermatol. Sci. 2021, 104, 76–82. [Google Scholar] [CrossRef]
- Shresta, S.; Heusel, J.W.; Macivor, D.M.; Wesselschmidt, R.L.; Russell, J.H.; Ley, T.J. Granzyme B plays a critical role in cytotoxic lymphocyte-induced apoptosis. Immunol. Rev. 1995, 146, 211–221. [Google Scholar] [CrossRef]
- Turner, C.T.; Zeglinski, M.R.; Richardson, K.C.; Santacruz, S.; Hiroyasu, S.; Wang, C.; Zhao, H.; Shen, Y.; Sehmi, R.; Lima, H.; et al. Granzyme B Contributes to Barrier Dysfunction in Oxazolone-Induced Skin Inflammation through E-Cadherin and FLG Cleavage. J. Invest. Dermatol. 2021, 141, 36–47. [Google Scholar] [CrossRef]
- Wang, Y.; Jacovetti, C.; Li, B.; Siddique, T.; Xiong, X.; Yin, H.; Wang, M.; Zhao, H.; Liu, J.L. Coordinated age-dependent and pancreatic-specific expression of mouse Reg2Reg3α, and Reg3β genes. Growth Factors 2011, 29, 72–81. [Google Scholar] [CrossRef]
- Cash, H.L.; Whitham, C.V.; Behrendt, C.L.; Hooper, L.V. Symbiotic bacteria direct expression of an intestinal bactericidal lectin. Science 2006, 313, 1126–1130. [Google Scholar] [CrossRef]
- Lidster, K.; Owen, K.; Browne, W.J.; Prescott, M.J. Cage aggression in group-housed laboratory male mice: An international data crowdsourcing project. Sci. Rep. 2019, 9, 15211. [Google Scholar] [CrossRef] [PubMed]
- Hansen, A.K.; Krych, L.; Nielsen, D.S.; Hansen, C.H. A Review of Applied Aspects of Dealing with Gut Microbiota Impact on Rodent Models. ILAR J. 2015, 56, 250–264. [Google Scholar] [CrossRef] [PubMed]
- Hau, J.; Poulsen, O.M. Doses for Laboratory Animals based on Metabolic Rate. Scand. J. Lab. Anim. Sci. 1988, 15, 81–83. [Google Scholar] [CrossRef]
- Vandenplas, Y.; Berger, B.; Carnielli, V.P.; Ksiazyk, J.; Lagström, H.; Sanchez Luna, M.; Migacheva, N.; Mosselmans, J.M.; Picaud, J.C.; Possner, M.; et al. Human Milk Oligosaccharides: 2′-Fucosyllactose (2′FL) and Lacto-N-Neotetraose (LNnT) in Infant Formula. Nutrients 2018, 10, 1161. [Google Scholar] [CrossRef]
- Rios-Leyvraz, M.; Yao, Q. The Volume of Breast Milk Intake in Infants and Young Children: A Systematic Review and Meta-Analysis. Breastfeed. Med. 2023, 18, 188–197. [Google Scholar] [CrossRef] [PubMed]
- Chen, X.; Yang, F.; Bai, T.; Wu, Y.; Zheng, S.; Tong, P.; Chen, H.; Li, X. 2′FL in Dairy Matrices Attenuates Allergic Symptoms in Mice by Reducing BLG Hypersensitivity and Modulating Gut Microecology. J. Agric. Food Chem. 2025, 73, 9606–9617. [Google Scholar] [CrossRef]
- Nilsen, T.; Snipen, L.-G.; Angell, I.L.; Keeley, N.B.; Majaneva, S.; Pettersen, R.; Rudi, K. Swarm and UNOISE outperform DADA2 and Deblur for denoising high-diversity marine seafloor samples. ISME Commun. 2024, 4, ycae071. [Google Scholar] [CrossRef]
- Edgar, R.C. SINTAX: A simple non-Bayesian taxonomy classifier for 16S and ITS sequences. bioRxiv 2016. [Google Scholar] [CrossRef]
- Kim, O.S.; Cho, Y.J.; Lee, K.; Yoon, S.H.; Kim, M.; Na, H.; Park, S.C.; Jeon, Y.S.; Lee, J.H.; Yi, H.; et al. Introducing EzTaxon-e: A prokaryotic 16S rRNA gene sequence database with phylotypes that represent uncultured species. Int. J. Syst. Evol. Microbiol. 2012, 62, 716–721. [Google Scholar] [CrossRef] [PubMed]
- Paulson, J.N.; Stine, O.C.; Bravo, H.C.; Pop, M. Differential abundance analysis for microbial marker-gene surveys. Nat. Methods 2013, 10, 1200–1202. [Google Scholar] [CrossRef] [PubMed]
- McMurdie, P.J.; Holmes, S. phyloseq: An R Package for Reproducible Interactive Analysis and Graphics of Microbiome Census Data. PLoS ONE 2013, 8, e61217. [Google Scholar] [CrossRef]
- Dixon, P. VEGAN, a package of R functions for community ecology. J. Veg. Sci. 2003, 14, 927–930. [Google Scholar] [CrossRef]
- Love, M.I.; Huber, W.; Anders, S. Moderated estimation of fold change and dispersion for RNA-seq data with DESeq2. Genome Biol. 2014, 15, 550. [Google Scholar] [CrossRef] [PubMed]
- Andersen, K.S.; Kirkegaard, R.H.; Karst, S.M.; Albertsen, M. ampvis2: An R package to analyse and visualise 16S rRNA amplicon data. bioRxiv 2018. [Google Scholar] [CrossRef]
- Kassambara, A. Machine Learning Essentials: Practical Guide in R; Sthda: Marseille, France, 2018. [Google Scholar]
- Wickham, H. ggplot2. WIREs Comput. Stat. 2011, 3, 180–185. [Google Scholar] [CrossRef]
- Rasmussen, T.S.; Mentzel, C.M.J.; Kot, W.; Castro-Mejía, J.L.; Zuffa, S.; Swann, J.R.; Hansen, L.H.; Vogensen, F.K.; Hansen, A.K.; Nielsen, D.S. Faecal virome transplantation decreases symptoms of type 2 diabetes and obesity in a murine model. Gut 2020, 69, 2122–2130. [Google Scholar] [CrossRef]
- Koressaar, T.; Remm, M. Enhancements and modifications of primer design program Primer3. Bioinformatics 2007, 23, 1289–1291. [Google Scholar] [CrossRef]
- Ye, J.; Coulouris, G.; Zaretskaya, I.; Cutcutache, I.; Rozen, S.; Madden, T.L. Primer-BLAST: A tool to design target-specific primers for polymerase chain reaction. BMC Bioinform. 2012, 13, 134. [Google Scholar] [CrossRef]
- Mentzel, C.M.J.; Cardoso, T.F.; Pipper, C.B.; Jacobsen, M.J.; Jørgensen, C.B.; Cirera, S.; Fredholm, M. Deregulation of obesity-relevant genes is associated with progression in BMI and the amount of adipose tissue in pigs. Mol. Genet. Genom. 2018, 293, 129–136. [Google Scholar] [CrossRef] [PubMed]
- Vandesompele, J.a. Accurate normalization of real-time quantitative RT-PCR data by geometric averaging of multiple internal control genes. Genome Biol. 2002, 3, RESEARCH0034. [Google Scholar] [CrossRef] [PubMed]
- Andersen, C.L.; Jensen, J.L.; Orntoft, T.F. Normalization of real-time quantitative reverse transcription-PCR data: A model-based variance estimation approach to identify genes suited for normalization, applied to bladder and colon cancer data sets. Cancer Res. 2004, 64, 5245–5250. [Google Scholar] [CrossRef]
- Benjamini, Y.; Krieger, A.M.; Yekutieli, D. Adaptive linear step-up procedures that control the false discovery rate. Biometrika 2006, 93, 491–507. [Google Scholar] [CrossRef]
- Mahler, M.; Berard, M.; Feinstein, R.; Gallagher, A.; Illgen-Wilcke, B.; Pritchett-Corning, K.; Raspa, M. FELASA recommendations for the health monitoring of mouse, rat, hamster, guinea pig and rabbit colonies in breeding and experimental units. Lab. Anim. 2014, 48, 178–192. [Google Scholar] [CrossRef]
- Smith, A.J.; Clutton, R.E.; Lilley, E.; Hansen, K.E.A.; Brattelid, T. PREPARE: Guidelines for planning animal research and testing. Lab. Anim. 2018, 52, 135–141. [Google Scholar] [CrossRef]
- Percie du Sert, N.; Hurst, V.; Ahluwalia, A.; Alam, S.; Avey, M.T.; Baker, M.; Browne, W.J.; Clark, A.; Cuthill, I.C.; Dirnagl, U.; et al. The ARRIVE guidelines 2.0: Updated guidelines for reporting animal research. PLoS Biol. 2020, 18, e3000410. [Google Scholar] [CrossRef]


| No Ampicillin | Ampicillin | q-Values | |||||||
|---|---|---|---|---|---|---|---|---|---|
| Day 7 | Control | 2′FL | 2′FL/DFL | Ampicillin | +.2′FL | +.2′FL/DFL | Ampicillin | 2′FL | 2′FL/DFL |
| Actinobacteria; Coriobacteriia; Coriobacteriales; Coriobacteriaceae | 0.0010774 | 0.002086 | 0.001267 | 0 | 0 | 0.0000435 | 0.032 | 0.952 | 0.603 |
| Bacteroidetes; Bacteroidia; Bacteroidales; Muribaculaceae | 0.395128 | 0.407864 | 0.483105 | 0.0003331 | 0.0021549 | 0.0178059 | 0.000 | 0.952 | 0.382 |
| Bacteroidetes; Bacteroidia; Bacteroidales; Rikenellaceae | 0.0859869 | 0.098791 | 0.074076 | 0.0002203 | 0.0002487 | 0.0006518 | 0.028 | 0.952 | 0.129 |
| Cyanobacteria; Vampirovibrio; FR888536; FR888536 | 0.0017606 | 0.000361 | 0.00032 | 0 | 0 | 0 | 0.000 | 0.952 | 0.437 |
| Firmicutes; Bacilli; Lactobacillales; Streptococcaceae | 0.0004335 | 0.000424 | 0.000158 | 0.000057 | 0 | 0.0000121 | 0.096 | 0.952 | 0.000 |
| Firmicutes; Clostridia; Clostridiales; | 0.0000972 | 0.000076 | 0.000134 | 0 | 0 | 0 | 0.017 | 0.952 | 0.057 |
| Firmicutes; Clostridia; Clostridiales; Mogibacterium | 0.0001579 | 0.000209 | 0.000113 | 0 | 0 | 0 | 0.007 | 0.952 | 0.382 |
| Firmicutes; Erysipelotrichi; Erysipelotrichales; Erysipelotrichaceae | 0.000253 | 0.000271 | 0.000353 | 0 | 0 | 0.0001831 | 0.000 | 0.952 | 0.057 |
| Proteobacteria; Gammaproteobacteria; Enterobacterales; Enterobacteriaceae | 0.0002524 | 0.000115 | 0.000465 | 0.000057 | 0.000388 | 0.0017591 | 0.028 | 0.952 | 0.449 |
| Day 14 | |||||||||
| Actinobacteria; Coriobacteriia; Coriobacteriales; Coriobacteriaceae | 0.000918 | 0.001082 | 0.0010444 | 0.0000151 | 0.0000356 | 0.0004526 | 0.000 | 0.619 | 0.284 |
| Bacteroidetes; Bacteroidia; Bacteroidales; AC16063Unknown | 0.01686 | 0.013505 | 0.0166571 | 0.0000033 | 0 | 0.0000054 | 0.000 | 0.798 | 0.664 |
| Bacteroidetes; Bacteroidia; Bacteroidales; Muribaculaceae | 0.375628 | 0.498902 | 0.572867 | 0.410043 | 0.133806 | 0.14136 | 0.433 | 0.000 | 0.202 |
| Bacteroidetes; Bacteroidia; Bacteroidales; Rikenellaceae | 0.083308 | 0.095564 | 0.0898889 | 0.0015447 | 0.0000106 | 0.105484 | 0.046 | 0.619 | 0.202 |
| Cyanobacteria; Vampirovibrio; FR888536; FR888536 | 0.000882 | 0.00029 | 0.000229 | 0.0000033 | 0 | 0 | 0.021 | 0.652 | 0.277 |
| Firmicutes; Bacilli; Lactobacillales; Lactobacillaceae | 0.043107 | 0.044722 | 0.125749 | 0.0000103 | 0.0000029 | 0.0487264 | 0.004 | 0.619 | 0.000 |
| Firmicutes; Bacilli; Lactobacillales; Streptococcaceae | 0.000322 | 0.000367 | 0.0001771 | 0 | 0 | 0 | 0.000 | 0.619 | 0.205 |
| Firmicutes; Clostridia; Clostridiales; Lachnospiraceae | 0.284822 | 0.154822 | 0.0736786 | 0.445336 | 0.325295 | 0.151596 | 0.002 | 0.176 | 0.016 |
| Firmicutes; Clostridia; Clostridiales; Mogibacterium | 0.000224 | 0.000167 | 0.0000435 | 0.0000022 | 0 | 0 | 0.000 | 0.619 | 0.065 |
| Firmicutes; Clostridia; Clostridiales; Peptococcaceae | 0.00015 | 0.000107 | 0.0000104 | 0.0000143 | 0 | 0 | 0.002 | 0.619 | 0.016 |
| Proteobacteria; Gammaproteobacteria; Enterobacterales; Enterobacteriaceae | 0.000166 | 4.28 × 10⁻⁵ | 0.0000684 | 0.0008475 | 0.196246 | 0.082846 | 0.550 | 0.008 | 0.205 |
| Day 21 | |||||||||
| Bacteroidetes; Bacteroidia; Bacteroidales; AC16063Unknown | 0.0198385 | 0.0155954 | 0.0136087 | 0.0000043 | 0.0000537 | 0 | 0.000 | 0.813 | 0.632 |
| Bacteroidetes; Bacteroidia; Bacteroidales; Bacteroidaceae | 0.0294528 | 0.0253085 | 0.0085189 | 0.0954284 | 0.165391 | 0.0475824 | 0.044 | 0.221 | 0.034 |
| Bacteroidetes; Bacteroidia; Bacteroidales; Rikenellaceae | 0.117293 | 0.078363 | 0.081423 | 0.0128481 | 0.0146536 | 0.0796541 | 0.003 | 0.414 | 0.507 |
| Firmicutes; Bacilli; Lactobacillales; Lactobacillaceae | 0.0550488 | 0.0971074 | 0.125959 | 0.0000263 | 0.0260096 | 0.0193837 | 0.003 | 0.813 | 0.507 |
| Firmicutes; Clostridia; Clostridiales | 0.0000553 | 0.0002943 | 0.0002156 | 0.0000234 | 0.0000111 | 0.0000502 | 0.044 | 0.813 | 0.637 |
| Firmicutes; Clostridia; Clostridiales; Lachnospiraceae | 0.185813 | 0.17024 | 0.149844 | 0.337789 | 0.174787 | 0.17705 | 0.000 | 0.008 | 0.750 |
| Firmicutes; Clostridia; Clostridiales; Peptococcaceae | 0.0001432 | 0.0000541 | 0.0000536 | 0.0002975 | 0 | 0 | 0.044 | 0.019 | 0.750 |
| Firmicutes; Clostridia; Clostridiales; Ruminococcaceae | 0.0565782 | 0.0509838 | 0.0472314 | 0.0920033 | 0.0277662 | 0.0477612 | 0.008 | 0.000 | 0.750 |
| Firmicutes; Erysipelotrichi; Erysipelotrichales; Erysipelotrichaceae | 0.0001714 | 0.0001399 | 0.0002673 | 0.0004117 | 0.0031187 | 0.0011978 | 0.751 | 0.019 | 0.507 |
Disclaimer/Publisher’s Note: The statements, opinions and data contained in all publications are solely those of the individual author(s) and contributor(s) and not of MDPI and/or the editor(s). MDPI and/or the editor(s) disclaim responsibility for any injury to people or property resulting from any ideas, methods, instructions or products referred to in the content. |
© 2025 by the authors. Licensee MDPI, Basel, Switzerland. This article is an open access article distributed under the terms and conditions of the Creative Commons Attribution (CC BY) license (https://creativecommons.org/licenses/by/4.0/).
Share and Cite
Christensen, K.R.; Rasmussen, T.S.; Mentzel, C.M.J.; Lanng, S.K.; Meloni, E.T.G.; Bertram, H.C.; Hansen, C.H.F.; Hansen, A.K. The Impact of Human Milk Oligosaccharides on Antibiotic-Induced Microbial Dysbiosis and Gut Inflammation in Mice. Antibiotics 2025, 14, 488. https://doi.org/10.3390/antibiotics14050488
Christensen KR, Rasmussen TS, Mentzel CMJ, Lanng SK, Meloni ETG, Bertram HC, Hansen CHF, Hansen AK. The Impact of Human Milk Oligosaccharides on Antibiotic-Induced Microbial Dysbiosis and Gut Inflammation in Mice. Antibiotics. 2025; 14(5):488. https://doi.org/10.3390/antibiotics14050488
Chicago/Turabian StyleChristensen, Kristine Rothaus, Torben Sølbeck Rasmussen, Caroline M. Junker Mentzel, Sofie Kaas Lanng, Elena Tina Gabriella Meloni, Hanne Christine Bertram, Camilla Hartmann Friis Hansen, and Axel Kornerup Hansen. 2025. "The Impact of Human Milk Oligosaccharides on Antibiotic-Induced Microbial Dysbiosis and Gut Inflammation in Mice" Antibiotics 14, no. 5: 488. https://doi.org/10.3390/antibiotics14050488
APA StyleChristensen, K. R., Rasmussen, T. S., Mentzel, C. M. J., Lanng, S. K., Meloni, E. T. G., Bertram, H. C., Hansen, C. H. F., & Hansen, A. K. (2025). The Impact of Human Milk Oligosaccharides on Antibiotic-Induced Microbial Dysbiosis and Gut Inflammation in Mice. Antibiotics, 14(5), 488. https://doi.org/10.3390/antibiotics14050488