Abstract
Background: Escherichia coli is one of the most studied bacteria worldwide due to its genetic plasticity. Recently, in addition to characterizing its pathogenic potential, research has focused on understanding its resistance profile to inhibitory agents, whether these be antibiotics or sanitizers. Objectives: The present study aimed to investigate six of the main serogroups of foodborne infection (O26, O45, O103, O111, O121, and O157) and to understand the dynamics of heterogeneity in resistance to sanitizers derived from quaternary ammonium compounds (QACs) and peracetic acid (PAA) using whole-genome sequencing (WGS). Methods: Twenty-four E. coli strains with varied resistance profiles to QACs and PAA were analyzed by WGS using NovaSeq6000 (150 bp Paired End reads). Bioinformatic analyses included genome assembly (Shovill), annotation via Prokka, antimicrobial resistance gene identification using Abricate, and core-genome analysis using Roary. A multifactorial multiple correspondence analysis (MCA) was conducted to explore gene–sanitizer relationships. In addition, a large-scale analysis utilizing the NCBI Pathogen Detection database involved a 2 × 2 chi-square test to examine associations between the presence of qac and stx genes. Results: The isolates exhibited varying antimicrobial resistance profiles, with O45 and O157 being the most resistant serogroups. In addition, the qac gene was identified in only one strain (S22), while four other strains carried the stx gene. Through multifactorial multiple correspondence analysis, the results obtained indicated that strains harboring genes encoding Shiga toxin (stx) presented profiles that were more likely to be sensitive to QACs. To further confirm these results, we analyzed 393,216 E. coli genomes from the NCBI Pathogen Detection database. Our results revealed a significant association (p < 0.001) between the presence of qac genes and the absence of stx1, stx2, or both toxin genes. Conclusion: Our findings highlight the complexity of bacterial resistance mechanisms and suggest that non-pathogenic strains may exhibit greater tolerance to QAC sanitizer than those carrying pathogenicity genes, particularly Shiga toxin genes.
1. Introduction
With the increase in the human population, there is a growing demand for food. This encourages not only increased food production but also improvements in product quality to minimize losses due to contamination by pathogens [1]. In addition to causing economic losses, products contaminated with foodborne pathogens lead to serious health problems, ranging from impacts on consumer well-being to overburdening public health systems, driven by the care required for gastrointestinal illnesses [1]. An emerging pathogen that has particularly concerned the meat industry is Shiga toxin-producing Escherichia coli (STEC), which has been associated with foodborne outbreaks leading to serious infections [2]. This infection is largely caused by the production of Shiga toxins mediated by stx1 or stx2 genes, which can lead to cell destruction by interfering with ribosomes and inhibiting protein synthesis [3].
The main STEC serogroups associated with foodborne outbreaks include O26, O45, O103, O111, O121, and O145, which along with O157 are commonly classified as the “top seven” serogroups [4]. Although other serogroups exist, these seven are the most frequently identified in severe disease cases worldwide [5]. In addition to concerns about virulence, antibiotic resistance is also a growing global problem which is exacerbated by the inappropriate use of drugs [6]. Antimicrobial use generates a selective pressure which favors the emergence of resistant strains. This scenario is particularly worrying because the use of antibiotics in the treatment of STEC infections is debated, as sublethal doses of antibiotics may increase the release of Shiga toxins and enhance the severity of the infection [7].
Accordingly, the best overall strategy for STEC is likely to minimize food contamination, since human disease can be serious, and antibiotic treatments may be ineffective. In the food industry, the use of sanitizers has increasingly been adopted as a preventive measure to eliminate these pathogens [8]. However, similarly to antibiotic resistance, the genetic plasticity inherent in bacteria can also lead to resistance to sanitizers. A clear example is the emergence of genes that confer resistance to quaternary ammonium chlorides (QACs), compounds widely used in the food industry to eliminate pathogens [9]. Several studies have warned of increasing tolerance to QACs [10,11]. With this increasing resistance, there may be a need to raise the concentrations of QACs used to kill bacteria. However, higher doses would require more thorough rinsing and would increase the risk of toxic QAC residues contacting food.
In response to QAC toxicity, food processors have increased the use of organic compounds that have low or no toxicity, such as peracetic acid (PAA) [12]. However, increased resistance to organic acids has also been noted, and several genes contributing to acid resistance have been identified [13]. One hypothesis investigated in several studies [14,15] is that bacteria often form biofilms which function as a protective and adhesive network. The use of sanitizers without an efficient mechanical biofilm disruption step may inactivate only the outer layer of the biofilm, leaving viable bacteria in the inner layers which are exposed to sublethal doses of the sanitizer and subsequently develop greater resistance [16].
Furthermore, the presence of different bacterial species within a heterogeneous biofilm further increases resistance to antimicrobial compounds. Strains with resistance to antimicrobials may also enhance the survival of pathogens in a biofilm which lack this resistance [17], and these resistant strains may comprise the outer layers of the biofilm [15]. However, some E. coli strains with high resistance to heat and other stresses have been found to be exclusively non-pathogenic. This phenomenon was observed by Zhang and Yang [18], where 706 E. coli strains present in the NCBI database were found to have the locus of stress tolerance (tLST), and none of these strains also had stx1 or stx2. Furthermore, several other studies have demonstrated that although commensal strains do not cause direct harm to human health, they can serve as a vector for the dissemination of resistance [19,20,21]. In a study performed by Massella et al. [22], it was found that commensal strains of E. coli had great genomic variability, which suggests that the commensal flora could serve as a reservoir of virulence and resistance genes for opportunistic pathogens. Therefore, our hypothesis is that strains which are highly resistant to cellular stress may be less pathogenic as there is a trade-off between virulence and the tolerance of E. coli to sanitizers and other stressors.
Based on this hypothesis, the present study investigated the heterogeneity in values of resistance to QACs and PAA in E. coli strains isolated from cattle, as obtained in our previous study [23]. Using genomic sequencing tools, we analyzed a group of strains with heterogeneity in resistance to these compounds which belonged to six (O26, O45, O103, O111, O121, and O157) of the “top seven” STEC serogroups.
2. Results and Discussion
2.1. Determination of Serotype, Antimicrobial Resistance, and Presence of stx and Biofilm Genes
Initial evaluations began with the analysis of the agreement between the serologies determined by PCR and in silico serology using the EcOH database. There was an agreement of 87.5% (21/24) between the results obtained by PCR and whole-genome sequencing (WGS) in the determination of the serogroup (Table 1). This level of agreement can be considered high, especially if compared to some previous studies, which indicated greater heterogeneity between the serogroup detection techniques. The inconsistencies observed in other studies can be attributed to several factors, such as differences in the methodology used, genetic variability in the strains analyzed, and, in some cases, limitations in the available databases. An accurate determination of the serogroup has been important for the diagnosis and monitoring of pathogenic strains of E. coli. However, the literature has shown that methods such as PCR can also be susceptible to misclassification [24]. In the present study, three strains presented discrepancies between the PCR and WGS results, two of which were related to serogroup O26 and one to O157. This information is important because these two serogroups are frequently implicated in foodborne outbreaks, making correct identification critical for epidemiological investigations.

Table 1.
Strains used in this study and their quaternary ammonium compound (QAC) and peracetic acid (PAA) resistance.
Although these discrepancies have been observed, the use of PCR remains a viable alternative for initial serogroup characterization, especially in contexts where speed and cost are limiting factors. However, WGS has a significant advantage in accuracy, especially in contexts where typing and detailing the virulence and resistance characteristics of strains are essential to optimize their control [25].
In addition to serology, although all 24 sequenced strains harbored incomplete or fragmented phages related to stx gene encoding, WGS in the present study determined that only four isolates were positive for stx1, despite the serogroups evaluated being traditionally associated with STEC. This low presence of the gene encoding Shiga toxin can be explained by a phenomenon already described in previous studies, which report the loss of stx-encoding phages during recultivation [26]. Additionally, Castro et al. [24] demonstrated that phages carrying stx1 may have undergone excision from the bacterial genome, leading to the absence of stx in some strains, even though they present other factors frequently associated with STEC. In addition, a study conducted by Senthakumaran et al. [27] investigated the loss of the stx-encoding gene and confirmed that stx genes can be lost both in vitro and in vivo. The authors emphasized that this loss may be related to genomic rearrangements, though the exact cause remains unclear. This loss of virulence may be directly related to environmental conditions and phage dynamics, suggesting that these factors could also influence other characteristics, such as resistance to sanitizers. Also, PCR analyses of Shiga toxins for these isolates were conducted prior to their exposure to sanitizers in our previous study [23] which may have also affected results.
Subsequently, all strains were analyzed for the presence of genes related to sanitizer resistance using ResFinder (using the desinFinder database), and only the S22 strain presented a gene related to QAC resistance (Table 1). The sanitizer resistance phenotypes of these strains had previously been studied by our group [23], but it is important to emphasize that although there was variation in MIC values among the different strains, QACs and PAA remained effective as the highest resistance values noted were 12.5 and 25 µg/mL, respectively (Table 1). Previous studies have reported a resistance value to QACs of 256 µg/mL [28] and up to 2310 ppm for PAA [29]. However, the variation in resistance profiles in strains collected from the same production environment aroused our interest in further investigating resistance to QACs and PAA.
In addition to characteristics related to the presence of stx1 and the serotype, we also evaluated antimicrobial resistance in the strains (Figure 1). We observed that strains of O103, O111, and O121 presented a low-resistance profile, having only the mdf(a) gene. However, although only one gene was detected, it is worth highlighting that mdf(a) is responsible for encoding multidrug efflux pump A, which means that it has no specific effect on a molecule itself but acts by expelling a wide range of toxic compounds from the cell, thus conferring broad-spectrum resistance [30,31].
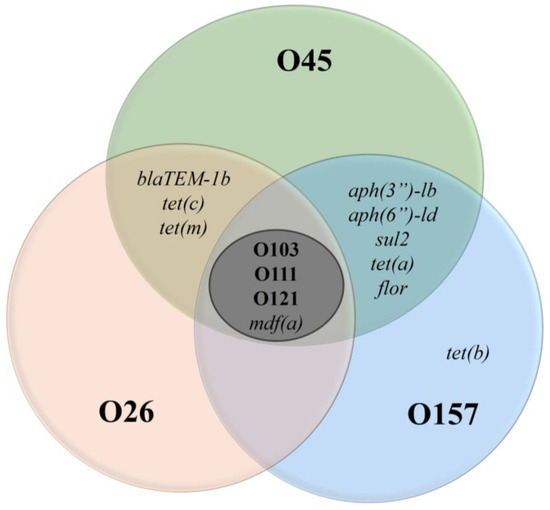
Figure 1.
Antimicrobial resistance genes in E. coli for six serogroups. Legend: The Venn diagram illustrates the distribution of antimicrobial resistance genes among E. coli serogroups O45, O26, O157, O103, O111, and O121. Each circle represents a specific serogroup, and the overlapping areas indicate genes shared between serogroups. The central region (O103, O111, O121) highlights the presence of the mdf(a) gene, while the outer regions show unique resistance genes, such as tet(b) in O157.
An important point is that mdf(a) was identified in all serogroups analyzed, suggesting broad genetic sharing. This dissemination can be explained by its ancient origin [31]. In addition to mdf(a), isolates from serogroups O26, O45, and O157 also had other resistance genes, as illustrated in Figure 1. These additional resistance genes indicate a potential for multidrug resistance and may serve as a warning for possibly difficult-to-treat infections. It is important to highlight that the administration of ineffective drugs can increase the production of Shiga toxin, worsening the clinical condition of patients [32].
Furthermore, it is essential to identify factors promoting the increase in this selective pressure on antimicrobial resistance in specific serogroups. This scenario also reinforces the idea of heterogeneity among serogroups, even when originating from similar sources. Although most studies associate antimicrobial resistance with exposure to antibiotic agents in a set of strains of similar origin, it is still unclear why some serogroups tend to have greater antimicrobial resistance than others. Recent studies suggest that in addition to exposure to antimicrobials, specific genetic factors may be correlated with the development of resistance in each serogroup [33].
As part of the investigation of the relationships between the isolates, we created a phylogenetic tree to assess genetic proximity and cross-reference information for each strain (Figure 2). The phylogenetic tree allowed us to observe that factors related to antimicrobial resistance or phenotypic characteristics, such as the MIC for sanitizers or D value (heat resistance), did not directly influence the genetic proximity between the isolates.
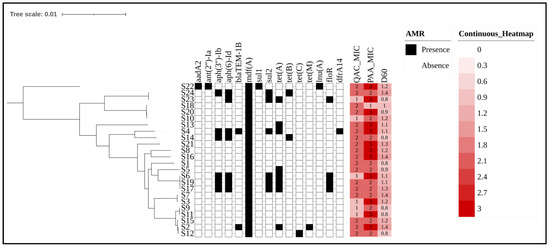
Figure 2.
Phylogenetic tree and antimicrobial resistance gene profiles of E. coli strains with sanitizer resistance indicators. Legend: The phylogenetic tree illustrates the genetic relationships among E. coli isolates from cattle production environments, with branches representing different sequencing strains. The presence or absence of antimicrobial resistance genes is represented by black (present) and white (absent) blocks. Sanitizer resistance levels for QACs and PAA are depicted using a heatmap, where increasing red intensity corresponds to higher resistance. Also, the number inside each block indicates the MIC range for each compound for each strain, with values of 1 (6.25 ppm) 2 (12.50 ppm), and 3 (25 ppm). Finally, D60 represents the bacterial load inactivated after exposure to 60 °C for 1 min and was previously tested in a related study [23]. A lower intensity of color for D60 indicates greater resistance to heat. The numbers inside the blocks represent the logarithmic inactivation load after exposure to heat. The phylogenetic tree was edited using the ITOL website: https://itol.embl.de/ (accessed on 5 February 2025). The Newick tree from core-genome alignment was uploaded, and the metadata were included in binary format (AMR presence/absence) and as a heatmap (sanitizer or D60 value).
Although phenotypic profiles can vary considerably, genetic relationships transcend small, specific variations in resistance genes. In turn, the phylogenetic tree groups strains with the same serotypes into close clades, regardless of differences in resistance to agents such as QACs or PAA. For example, strains S9 and S11 belong to the same phylogenetic clade, despite presenting distinct profiles for QACs and PAA. This suggests that the genetic relationship between the isolates goes beyond specific phenotypic characteristics, indicating that there is a more conserved genetic basis among the serogroups. Furthermore, factors related to the different seasons of the year when these isolates were collected also did not influence the construction of the phylogenetic tree. However, it is important to highlight that Figure 2 shows the separation of two clusters, which are divided based on the map reference sequence used (EDL-933).
2.2. Correlation Between Target Genes and Multiple Correspondence Analysis
Based on the presence and absence of genes among the isolates from the core-genome alignment by Roary, we selected sixteen main target genes related to resistance modulation, biofilm formation, and virulence in which at least one strain differed from the others. The antimicrobial resistance genes were aph(3)-Ib, aph(6)-Id, blaTEM-1b, sul, tet(a), tet(b), tet(c), tet(m), and flor. Other selected genes were related to metabolism and virulence: dfra14, colrnaI, gadA, gadB, emrE, cbtA, and stx. In addition, phenotypic values related to factors such as the D value (heat resistance), biofilm formation, and isolation season of each strain (cold or hot climate) were included (results of previous analyses by Castro et al. [23]). The genes listed above were individually compared in terms of their correlation with QAC and PAA resistance values, and significant relationships are shown in Table 2.
Table 2.
Correlation between genes and sanitizers.
It is worth noting that stx and cbtA genes presented distinct behaviors, with stx, when present, being correlated with lower QAC resistance values, while the presence of cbtA was associated with higher PAA tolerance values. Historically, the presence of genes encoding Shiga toxin was originally described in strains of Shigella dysenteriae [34]. Furthermore, some studies have shown that lysogenic phages encoding several genes including stx led to the evolution and appearance of the first E. coli with Shiga toxin [34]. As the inclusion of Shiga toxin genes is mediated by mobile genetic elements, the insertion of stx is not conserved. On the contrary, it is a factor amenable to change.
In recent years, several studies have investigated strains of E. coli with the inclusion of the locus of stress tolerance (tLST). Furthermore, in a study performed by Zhang and Yang [18], the authors evaluated 18,959 E. coli present in the NCBI database for the presence of this locus, and 706 sequences presented an ORF (open reading frame) for tLST or its variants. However, none of the strains evaluated by Zhang and Yang [18] carried a Shiga toxin gene when tLST was present. Possibly, mobile genetic elements may have to compete to occupy restricted spaces in areas where ORFs are present, and these mobile genetic elements may be easily excised by the cell.
One point to be highlighted is that for adaptation to acids, as in the case of PAA, E. coli has several mechanisms, such as the gad and rpoS genes [23,35,36]. Adaptation to acid may be related to the need for strains to remain viable even in adverse environments such as the gastrointestinal tract of cattle. Thus, the presence of the stx toxin would have no effect on resistance or sensitivity to a PAA-based sanitizer.
In addition to the negative correlation between stx and QACs, the results listed in Table 2 demonstrate a positive relationship between cbtA and PAA resistance. The cbtA gene is responsible for a toxin–antitoxin system [37]. The cbtA toxin interferes with cellular structure and affects microtubules and actin filaments, with a consequent impact on cell division [37]. In a review by Yamaguchi and Inouye [38], the authors discussed the effects of toxin–antitoxin (TA) systems in E. coli on the regulation of cell growth and death. An important point is that TA systems have been suggested to be involved in cellular dormancy systems (decrease in cell metabolism) in addition to roles in the modification of cell elongation dynamics. Thus, since PAA is an oxidant of cell walls, proteins, and DNA, it is possible that the cbtA gene, when present, may affect cellular survival by modifying the shape of the cell wall, or by decreasing the metabolic response to the sanitizer, potentially implying that PAA has less of an effect in the absence of a cellular response. Accordingly, in a study performed by Tan et al. [39], an overexpression of cbtA resulted in a cell growth defect and a loss of rod shape, which, according to our theory, could make the cell even more susceptible to PAA attack. However, more studies need to be performed to clarify the role of cbtA in the survival of E. coli exposed to a variety of stressors.
Although this study found a moderate correlation between the presence of two genes and sanitizer resistance, it is known that the effects of individual genes may not be enough to completely explain observed phenotypes. Therefore, we performed a multivariate analysis of genes and phenotypic results to explore associations between multiple variables to understand which groups of genes could collectively influence sanitizer resistance factors. We identified the impact of stx presence (based on the correlation data) as a key point to perform multiple correspondence analysis (MCA), and it was possible to group the categories (correlated genes and phenotypes) into two distinct groups (Figure 3).
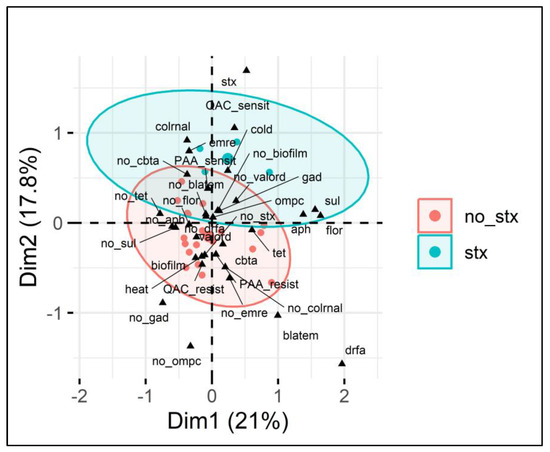
Figure 3.
Multiple correspondence analysis (MCA) of E. coli sanitizer sensitivity in relation to gene presence. Legend: MCA plot visualizing the relationship between categorical variables (genes and phenotypes) associated with E. coli isolates and the presence or absence of the stx1 gene (indicated by red circles for no_stx and blue circles for stx). The two dimensions (Dim1 and Dim2) explain 21% and 17.8% of the variance, respectively. The ellipses show clustering based on the presence (blue) or absence (red) of the stx gene, highlighting associations between various antimicrobial resistance genes (e.g., blaTEM, sul, tet), sanitizer resistance (PAA and QAC), and other phenotypic traits such as biofilm formation and heat resistance. Key variables such as the presence of cbtA and biofilm formation are present within the stx-negative group, while the stx-positive group shows stronger associations with QAC sensitivity, colrnaI, and cold adaptation.
From Figure 3, it is possible to verify the presence of two separate ellipses categorized based on the presence or absence of the stx1 gene (no stx and stx), indicating the contribution of different variables present. Furthermore, the two dimensions (Dim1 and Dim2) explain 21% and 17.8% of the variance, respectively, totaling 38.8%, in the categorical variables analyzed, which is relevant given the complex context of the microbial genome. Similarly to in the analysis of individual genes, the presence of stx1 was associated with lower QAC resistance, and it also grouped with other genes, such as colRNA (controlling colicin production) and emrE (encoding efflux pumps). Furthermore, the absence of stx1 demonstrated that in addition to the positive correlation with the presence of cbtA shown in Table 2, the lack of stx1 grouped with resistance to QAC and PAA in a single cluster, which implies that the presence of the stx1 gene may make it difficult for a strain to also include tolerance to these sanitizers in its genome.
To increase focus on the relationship between variables, Figure 4 clearly demonstrates the clustering of the analyzed variables that were most closely associated (grouped together) and presents the contribution values in both main dimensions. Thus, the presence of stx1 was directly associated with a QAC-sensitive phenotype and was clustered with the presence of emrE and colRNA. Furthermore, resistance to PAA was directly related to several genes, such as cbtA (as shown in Table 2), the strain isolation season, gad [23], the D value, and the presence of ompC and dfrA.
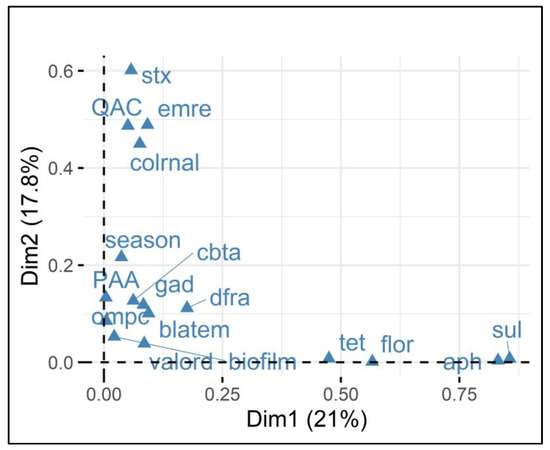
Figure 4.
Multiple correspondence analysis (MCA) of E. coli resistance and gene presence in relation to sanitizer sensitivity. Legend: The Variable Factor Map demonstrates the grouping (associations) of the analyzed variables associated with E. coli isolates and the presence or absence of the stx1 gene. The two dimensions (Dim1 and Dim2) explain 21% and 17.8% of the variance, respectively. The closer together the points are grouped, the stronger the relationship between the variables. For example, stx1 and QAC sensitivity, and emrE and colRNAl.
Therefore, MCA, when applied to QAC and PAA data, corroborated the information obtained by correlation and provided new insights into the dynamics of resistance to QACs and PAA. Regarding QACs, in addition to the presence of the stx1 gene conferring greater QAC sensitivity, the grouping showed that the presence of the emrE and colRNAl genes contributed to reducing sensitivity to QACs. Regarding emrE, it is responsible for encoding a multidrug efflux pump that is especially useful for a range of molecules [40]. Therefore, emrE may have acted in pumping QACs to the exterior of the cell, attenuating QAC effects on cellular proteins. Colicins coded by colRNAI are toxins expressed to suppress competing bacteria and are mediated under stress conditions. Although colicin presence has been attributed to lower resistance to QACs, its participation in QAC resistance is yet undetermined and requires further study.
Regarding PAA resistance, Castro et al. [23] suggested that gad genes may have a direct effect on acid resistance. Furthermore, cbtA was also present in E. coli with increased resistance to PAA. It is worth mentioning that although this relationship between cbtA presence and PAA resistance has been observed, there is no mention in the literature of the expression of this gene in response to PAA. Further studies are needed to elucidate the expression of cbtA during PAA exposure.
Other genes were grouped nearby, such as ompC (a porin that regulates the flow of molecules into the cell [41]). Thus, this regulation may directly limit the permeability of the cell wall to compounds such as PAA, which would make the bacteria more resistant to PAA. Finally, although dfrA and blaTEM were grouped together with PAA resistance, their effects are related to antimicrobial resistance, such as dihydrofolate reductase inhibition (action of dfrA in response to the antibiotic trimethoprim [42]), and the production of beta-lactamases to prevent the action of beta-lactams that act on the cell wall. Therefore, our hypothesis would be that these two genes, although grouped with PAA, more likely represent strains that are capable of greater responses to stress. In fact, PAA tolerance and multidrug resistance were associated in a recent study by Rebelo et al. [43]. The findings demonstrated that Salmonella and Enterococcus faecium exhibited greater tolerance to sanitizer when they were more resistant to antimicrobials. Similarly, the phenotypic effects, such as higher D values and biofilm formation potentials, observed in the present study indicate a high metabolic response of these isolates, which also had greater resistance to PAA.
2.3. Large-Scale Genomic Association Between Presence of qac with stx1, stx2, or Both stx Genes from NCBI Pathogen Detection Database
To expand our findings beyond our sample set and also evaluate the impacts of stx2, we analyzed the global NCBI Pathogen Detection database for the presence of qac and stx genes. A total of 449,235 genomes were detected when only E. coli/Shigella species were selected. After the “Scientific name” filter was used and only E. coli strains were selected, the total number of genomes selected decreased to 393,216.
Subsequently, we filtered the genotypes to identify complete qac genes and their variants. A total of 104,016 gene matches were verified; however, 4743 genomes contained two or more qac variants within a single genome. As a result, 99,269 genomes (25.25% of the all-E. coli database) were identified as carrying one or more qac genes. Among these, the most frequently detected variants, in decreasing order, were as follows: qacEdelta1 (85.93%; 85,302/99,269), qacL (16.26%; 16,143/99,269), qacE (1.61%; 1602/99,269), qacG2 (0.82%; 816/99,269), qacF (0.12%; 121/99,269), and qacC (0.012%; 12/99,269). Also, less frequent variants included qacH (9), qacG (6), qacK (2), qacB (1), qacR (1), and qacZ (1), each representing less than 0.01% of the total.
Regarding the presence of stx1 and its variants, 70,622 genomes were identified within the dataset, representing 17.96% of all E. coli genomes (70,622/393,216). However, only 3155 genomes (3.18%) contained both stx1 and a qac gene, suggesting limited co-occurrence between these resistance and virulence determinants.
In addition, for the stx2 toxin-encoding gene, our analysis identified its presence in 17.11% (67,262/393,216) of the E. coli genomes. When assessing the co-occurrence of stx2 with a qac gene, we found that only 4.94% (4907/99,269) of the genomes carried both genes. In addition, when evaluating the simultaneous presence of both Shiga toxin-encoding genes (stx1 and stx2) alongside a qac gene, we found that 8.12% (8062/99,269) of the genomes contained all three genes. Finally, the presence of stx1, stx2, or both was observed in 63.95% (251,347/393,216) of the available E. coli genomes in the database.
Therefore, to assess whether the distribution of qac genes was significantly associated with the presence or absence of stx1 and stx2, we performed chi-square tests comparing qac-positive and qac-negative genomes across three groups: (i) stx1-positive and stx1-negative, (ii) stx2-positive and stx2-negative, and (iii) genomes carrying both stx1 and stx2 (Table 3).
Table 3.
Analysis of genomes present in the NCBI Pathogen Detection database for the co-occurrence of qac and stx genes.
Statistical analyses confirmed a significant association between qac genes and the absence of stx1, stx2, and both genes combined (p < 0.0001 for all comparisons; Table 3). These observed distributions suggest that the relationship between qac and stx toxin genes is not random.
Furthermore, to better understand this association and assess the relative risk between the presence of qac and Shiga toxin-encoding genes, we performed an Odds Ratio (OR) analysis. The results showed that the simultaneous presence of stx1 and qac is least likely, with a qac-positive genome being approximately 89% less likely to carry stx1 (OR = 0.11) compared to stx1-positive isolates without the qac gene (Table 3). This finding corroborates our newly sequenced dataset, which also demonstrated a weak association between qac and stx1 genes.
Finally, the phi (φ) coefficient was used to measure the strength of an association between categorical variables. As shown in Table 3, the strongest observed association was between qac and stx1 + stx2 genes (φ = 0.25), followed by stx1 and qac (φ = 0.22), and stx2 and qac (φ = 0.19). Although the chi-square test statistically confirmed these associations, the phi values suggest only a weak-to-moderate correlation between these variables. However, considering the biological context and the large sample size analyzed (393,216 genomes), these results remain relevant. This observed pattern between qac and stx gene distribution suggests distinct evolutionary pressures, indicating that when qac is present, there may be selective pressure against stx genes, or vice versa, potentially favoring isolates with reduced virulence but increased sanitizer resistance. Furthermore, the statistical results from our broad database analyses reinforce our hypothesis of a delicate balance between virulence and resistance factors within the same isolate.
2.4. Analysis of Phage Insertion and Genome Synteny
After determining that stx1 affected QAC resistance phenotypes, we performed a genetic alignment between the 24 newly sequenced strains using the position of stx1 in the genome and the site of phage insertion in the DNA, as well as the presence of the QAC gene in strain S22. It has already been established [44] that the inclusion of stx1 genes in E. coli was evolutionarily mediated by encoding phages, especially in their lysogenic cycle. Therefore, it is expected that the stx1 gene would be in a region with low conservation and a high rate of genetic exchange. Furthermore, although the presence of genes associated with QAC resistance has always been attributed to plasmids and mobile genetic elements, some studies [45,46] have demonstrated the presence of these genes in chromosomal integrons integrated into bacterial DNA.
Thus, stx1 and qac genes were found to be present at similar locations on the genome that were also categorized by their high genetic variability (Figure 5), suggesting that the relationship between stx presence and decreased QAC tolerance in the correlation and multiple correspondence analyses may be due to the high cost to the bacteria of maintaining both genes. Accordingly, E. coli likely substitutes genes at these loci based on which type of genetic information will provide the greatest fitness advantage.
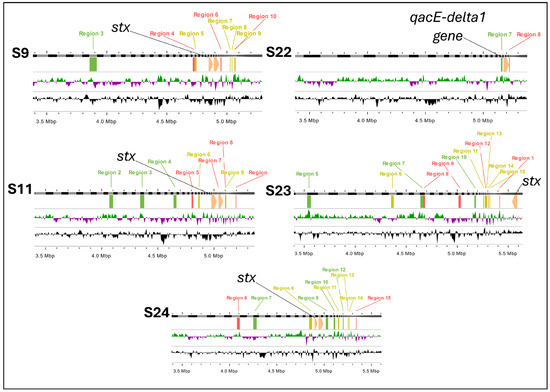
Figure 5.
Phage and gene insertion sites in E. coli strains: stx1 and qac gene localization. Legend: These genomic maps illustrate the insertion sites of phages and key genes (stx1 and qacE-delta1) in five E. coli strains (S9, S11, S22, S23, and S24). Each panel represents the genome of a strain, highlighting phage insertion regions (labeled in green, red and purple) and the presence of the stx1 gene (indicated in yellow) and qacE-delta1 gene (indicated in black). Regions 1 through 15 mark specific phage insertion sites. The presence of the stx1 gene correlates with multiple insertion regions, particularly in strains S9, S11, S23, and S24, while the qacE-delta1 gene is uniquely identified in strain S22.
Previously, we analyzed the impact of phage variability, and the presence of stx genes after the recultivation of E. coli [23]. We observed that the high potential for genomic rearrangement derived from the processes of the excision and insertion of phage-encoded regions makes the bacteria susceptible to genetic exchanges, probably influenced by environmental effects. These exchanges can facilitate the acquisition of new genes, including those that confer resistance to disinfectants, such as QACs.
A noteworthy point is that in most studies, resistance to QACs has been associated with genes located on plasmids, as is widely documented [10,11,47]. However, the inclusion of these genes in chromosomal DNA, rather than plasmid DNA, may possibly be mediated by mobile elements, such as chromosomal integrons. These elements are known to facilitate the incorporation of resistance genes into the bacterial chromosome [45,46].
In Figure 5, we present evidence that in strain S22, the QAC resistance gene was located on chromosomal DNA rather than on a plasmid. Genome filtering using the plasmidSPAdes tool confirmed the absence of plasmid-associated regions, indicating that QAC resistance for strain S22 was likely acquired through chromosomal integration. This finding suggests that phage- and mobile-element-mediated genotyping may allow the replacement or occupation of sites previously reserved for stx genes by QAC resistance genes, conferring an adaptive advantage to bacterial strains in environments where they are exposed to these disinfectants. These results reinforce the idea that although resistance to QACs is predominantly plasmid-borne, the incorporation of these genes into the bacterial chromosome is possible and may be associated with environmental selective pressures, as well as the genomic plasticity induced by mobile elements, such as integrons and transposons.
Finally, to analyze more precisely the presence of stx (S9, S11, S23 and S24) or qacEdelta1 (S22) genes, we determined their inclusions in the genome and observed their arrangement in a linear image (Figure 6).
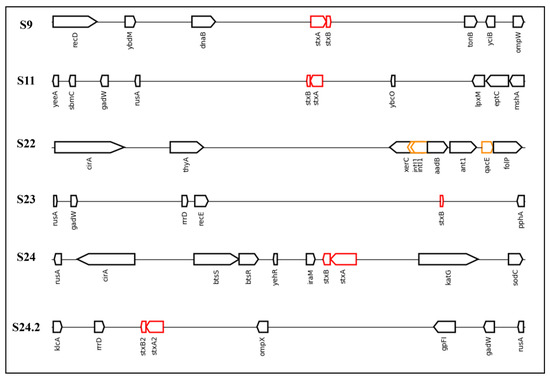
Figure 6.
Linear DNA sequences found to possess stx or qac genes in the present study and the associated neighbor genes. Legend: The sequences analyzed in the present study were S9, S11, S22, S23, S24, and S24.2. The red rectangles represent Shiga toxin genes (stx1 or stx2), while the yellow rectangles represent genes resistant to quaternary ammonium compounds (qacEdelta1) or the integron-integrase gene (intI1). This image was created using genoPlotR (version 0.8.11) in RStudio.
The results obtained demonstrate that stx genes included in the genomes were close to rusA in four of the five sequences that contained stx genes (S11, S23, S24, and S24.2). An important point is that the presence of stx close to the genes shown in Figure 6 is atypical. However, in a study performed by Yang et al. [48], the authors demonstrated that rusA shares 37.4% identity with prophage 75/02, an stx-encoding gene. Furthermore, rusA acts as a Holliday junction resolvase and has been described as a mediator of genetic recombination and cellular repair in the E. coli K12 prophage [49]. This indicates a region with high genetic variability.
Regarding the S22 sequence, which presents the QAC gene for resistance, although there is a clear difference between the neighboring genes and those that present a Shiga toxin gene, the sequence presented two insertions of intI1, a class 1 integron-integrase. These integrons assist in the insertion and excision of gene cassettes to confer resistance to bacteria [50]. Therefore, this presence reinforces the insertion of genes related to resistance to sanitizers in E. coli genomes and highlights possible intrinsic resistance conferred by this insertion. Furthermore, intI1 has been proposed to be an indicator of antibiotic resistance in urban wastewater treatment plants [51]. An important point is that if we consider that qacEdelta1 was by far the most common QAC gene present among the E. coli sequences from NCBI, this indicates a selective pressure for this gene and genetic adaptation of the bacteria. Further in silico studies should investigate the extent to which genes encoding resistance to QACs are integrated into bacterial genomes.
3. Materials and Methods
3.1. Strain Selection and DNA Extraction and Sequencing
Twenty-four E. coli strains were selected from meat samples, animal feces, and cattle production environments. The phenotypic profile of these strains was previously evaluated by Castro et al. [23] regarding their resistance profile to QACs and PAA using a minimum inhibitory concentration (MIC) methodology. Strain selection for WGS was conducted based on serogroups, as determined by PCR, and aimed to include low (6.25 ppm)-, intermediate (12.5 ppm)-, and high (25 ppm)-resistance profiles for QACs and PAA.
Therefore, the dataset comprised five O26 (three strains with intermediate QACs + PAA; two with intermediate QACs + high PAA), five O45 (one with low QACs + high PAA; four with intermediate QACs + PAA), four O103 (one with low QACs + high PAA; one with intermediate QACs + PAA; two with intermediate QACs + high PAA), two O111 (one with low QACs + intermediate PAA; one with low QACs + high PAA), four O121 (one with low QACs + intermediate PAA; one with intermediate QACs + low PAA; two with intermediate QACs + high PAA), and four O157 strains (one with low QACs + high PAA; one with intermediate QACs + PAA; two with intermediate QACs + high PAA). Also, it is important to highlight that the strains analyzed in this study belong to a DNA dataset that was not evaluated by Castro et al. [23]. All strain details are included in Table 1.
Subsequently, DNA extraction was performed using the DNeasy Blood & Tissue extraction kit (QIAGEN, Toronto, ON, Canada), following the manufacturer’s instructions to ensure DNA integrity and purity. After extraction, DNA quality and concentration were verified using the Qubit 3.0 (Life Technologies, Carlsbad, CA, USA) and, subsequently, the NanoDrop 1000 (Thermo Fisher Scientific, Waltham, MA, USA).
Whole-genome sequencing (WGS) was performed using the Illumina NovaSeq6000 platform (150 bp PE) with a minimum coverage of 300× to ensure data quality. Data quality was assessed using FASTQC (version 0.12.1), and sequences were processed and assembled using Shovill software (SPAdes, version 1.1.0). An additional check was performed to determine the presence of plasmids using plasdmidSPAdes (version 3.15.5). A linear visualization of the genomes was obtained using Matplotlib with the genoPlotR (version 0.8.11) package in biopython, with the data annotated by Prokka (version 1.14.6). All tools were used with the default settings. In addition, all sequences have been deposited in NCBI under BioProject PRJNA1166229.
3.2. Characterization of Serogroups, Virulence Genes, and Antimicrobial Resistance and Phylogenetic Analysis
The identification of serogroups was performed using two approaches: data from conventional PCR [23] and in silico typing based on WGS data, using Abricate (version 1.0.1) and the EcOH database. The concordance between the results of the two techniques was evaluated. Furthermore, other virulence genes were analyzed using ResFinder 4.6.0 (database: 22 March 2024) and DesinFinder (database: 31 May 2023) to detect genes related to resistance to sanitizers and antibiotics.
Phylogenetic analysis was performed on annotated WGS data using Prokka (version 1.14.6). The gff-format files were used to perform both core-genome (minimum 95% identity and 90% of isolates having the gene needed to be classified as core) and accessory gene alignment using Roary (version 3.13.0). The phylogenetic tree was constructed using the core-genome alignment output in Newick format from Roary. Furthermore, the phylogenetic tree was constructed using IQ-tree (version 2.3.6) and an ultrafast bootstrap parameter of 1000 replicates. Images were edited using the website ITOL: https://itol.embl.de/ (accessed on 5 February 2025).
For multiple correspondence analyses, we used accessory genes obtained from Roary output to filter for genes of interest for inclusion in correlation. For this filtering, we selected genes present in less than 50% of all sequences to enhance the chances of elucidating heterogeneous MIC values. Also, we screened the genes related to acidity tolerance or antimicrobial resistance from these accessory genes. Therefore, the genes used were aph(3)-Ib, aph(6)-Id, blatem-1b, sul, tet(a), tet(b), tet(c), tet(m), flor, dfra14, colrnaI, gadA, gadB, emrE, cbtA, and stx. In addition, the phenotypic results included QAC and PAA MIC values, the D 60 °C value, and the season of isolation.
Finally, the investigation of the contribution of phages resident in the genome was performed using the Phastest.ca website, employing deep mode and disabling the option to use pre-computed results. For this purpose, the sequences used were first aligned using the ClustalW alignment tool (version 2.1), using the IUB method to generate the DNA matrix for a complete alignment. With this methodology, we ensured that the phage insertion sites obeyed a specific order and could be compared through the insertion sites of the previously characterized stx and qacE-delta 1 genes.
3.3. Comparison of Presence of qac with stx1, stx2, or stx1 and stx2 Using the NCBI Pathogen Detection Database
To expand our observations to a global level, we used the NCBI Pathogen Detection system: https://www.ncbi.nlm.nih.gov/pathogens/ (accessed on 4 February 2025). We selected E. coli/Shigella as the species. Subsequently, we applied the “Scientific name” filter and filtered only for those described as E. coli. After this, using the “Stress genotypes” filter, we filtered for sequences that included the complete presence of QAC genes and variants. Using the set of sequences mentioned above, we applied the “Virulence genotypes” filter and selected all genomes that presented at least one complete gene for stx1, stx2, or stx1 and stx2. Finally, we also compiled the values for the presence of genomes with the inclusion of the stx1, stx2, or stx1 and stx2 genes or variants without the insertion of any qac gene.
3.4. Statistical Analysis of Data
Statistical analyses were conducted using R® version 4.1.3 (10 March 2022) (R Foundation for Statistical Computing, Vienna, Austria) [52] to examine correlations and multiple correspondences between the presence of virulence and resistance genes and phenotypic data, such as MIC values for QACs and PAA. Spearman’s correlation coefficient was applied to assess the relationship between the presence of specific genes, such as stx1 and cbtA, and the MIC values obtained.
In addition, a multivariate multiple correspondence analysis (MCA) [53,54] was performed to explore the associations between the presence of resistance genes, and virulence, phenotypic, and environmental variables, such as the sanitizer resistance, biofilm formation capacity, and seasonality of the samples. The MCA results were represented graphically, allowing a clear visualization of the contributions of each variable in the different dimensions analyzed. The R® libraries used to perform MCA were “FactoMiner” [55] and “factoextra” [56].
Finally, to assess the association between the presence of QAC and the stx1, stx2, or stx1 and stx2 genes in E. coli genomes from the NCBI Pathogen Detection database, we applied three chi-square (χ2) tests using a 2 × 2 contingency table (1. qac-positive/qac-negative and stx1-positive/stx1-negative; 2. qac-positive/qac-negative and stx2-positive/stx2-negative; 3. qac-positive/qac-negative and stx1- and stx2-positive/stx1- and stx2-negative). Also, the Odds Ratio (OR) with a 95% confidence interval and the phi (φ) coefficients were utilized to determine the strength of an association. All analyses were performed using R® version 4.1.3 (10 March 2022).
4. Conclusions
The present study explored the differences between the resistance profiles of twenty-four E. coli strains to two sanitizers frequently used in the food industry (quaternary ammonium and peracetic acid). Our initial findings revealed a negative correlation between the presence of stx1 and resistance to QAC-based sanitizer, suggesting that strains carrying stx1 tend to be more sensitive to QACs. In contrast, the presence of the cbtA gene (inhibiting cell elongation and division function) showed a positive correlation with resistance to PAA acid. Though multiple correspondence analysis, these data reinforced that the presence of the stx1 gene was associated with a sensitive QAC profile. This information led us to expand our investigation to the interaction between qac and the stx1 + stx2 genes. For this purpose, we conducted a global assessment, analyzing 393,216 genomes from the NCBI Pathogen Detection database. This analysis confirmed a statistically significant pattern of low co-occurrence between qac genes and stx1, stx2, or both genes, again corroborating our initial results.
Moreover, synteny and phage inclusion analysis indicated that the stx1 and qacE-delta1 genes may occupy similar positions in the genome in non-conserved regions, suggesting that genomic rearrangements may be involved in the exchange of these genes, with the choice being “either/or” instead of “and”. This observation aligns with our hypothesis that strains with increased pathogenicity tend to lack resistance to sanitizers. For instance, in a biofilm environment, minimally pathogenic or non-pathogenic guardian bacteria in the outermost layers may act as a shield, while more pathogenic strains which are susceptible to sanitizers remain protected in the deeper layers, evading the effects of these agents. Further studies are required to investigate the application of sanitizers in mixed biofilms (non-pathogenic and pathogenic E. coli) and compare survival rates between groups. In addition, we highlight that while the present study provides valuable insights into sanitizer exposure and virulence genome arrangements, further validation is needed. Specifically, the modification of the genome of a generic strain of E. coli using stx and qac genes in combination with sanitizer exposure would be necessary to fully understand the behavior and underlying mechanisms of this genetic arrangement.
Finally, serogroups O26, O45, and O157 exhibited a multidrug resistance profile compared to O111, O121, and O103, reinforcing the relevance of additional studies to better understand the interactions among serogroup and antimicrobial resistance dynamics.
Author Contributions
Conceptualization, V.S.C., Y.D.P. and K.S.; methodology, V.S.C., Y.D.P., X.Y. and K.S.; formal analysis, V.S.C. and Y.D.P.; investigation, V.S.C., X.Y. and K.S.; resources, X.Y., C.A.C.J., E.E.d.S.F. and K.S; data curation, V.S.C., Y.D.P. and X.Y.; writing—original draft preparation, V.S.C., Y.D.P. and C.A.C.J.; writing—review and editing, X.Y., E.E.d.S.F., C.A.C.J. and K.S.; supervision, K.S.; project administration, K.S.; funding acquisition, X.Y., K.S. and C.A.C.J. All authors have read and agreed to the published version of the manuscript.
Funding
The funding provided by Results-Driven Agricultural Research (RDAR) under grant number 2021R014R is gratefully acknowledged. In addition, we are grateful for Conselho Nacional de Desenvolvimento Científico e Tecnológico (CNPq)/Brazil (Process code: 310181/2021-6) and FUNADESP/Brazil. Y.D.P. also acknowledges the Mato Grosso State Department of Economic Development (Secretaria de Estado de Desenvolvimento Econômico de Mato Grosso—SEDEC-PRO-2022/02316; project number 3.008.004). V.S.C. expresses his gratitude for the scholarship (88887.848129/2023-00) awarded by Coordenação de Aperfeiçoamento de Pessoal de Nível Superior (CAPES). E.E.d.S.F. acknowledges Coordenação Apoio a Pessoal de Ensino Superior—CAPES and Fundação de Apoio a Pesquisa de Mato Grosso—FAPEMAT under the process code PDPGCENTROESTE3084571P.
Institutional Review Board Statement
Not applicable.
Informed Consent Statement
Not applicable.
Data Availability Statement
All sequences have been deposited in NCBI under BioProject PRJNA1166229.
Conflicts of Interest
The authors declare no conflicts of interest.
References
- Lebelo, K.; Malebo, N.; Mochane, M.J.; Masinde, M. Chemical contamination pathways and the food safety implications along the various stages of food production: A review. Int. J. Environ. Res. Public Health 2021, 18, 5795. [Google Scholar] [CrossRef] [PubMed]
- de Assis, D.C.S.; da Silva, T.M.L.; Brito, R.F.; da Silva, L.C.G.; Lima, W.G.; Brito, J.C.M. Shiga toxin-producing Escherichia coli (STEC) in bovine meat and meat products over the last 15 years in Brazil: A systematic review and meta-analysis. Meat Sci. 2021, 173, 108394. [Google Scholar] [CrossRef] [PubMed]
- Castro, V.S.; Carvalho, R.C.T.; Conte-Junior, C.A.; Figuiredo, E.E.S. Shiga-toxin producing Escherichia coli: Pathogenicity, supershedding, diagnostic methods, occurrence, and foodborne outbreaks. Compr. Rev. Food Sci. Food Saf. 2017, 16, 1269–1280. [Google Scholar] [CrossRef] [PubMed]
- Luna-Gierke, R.E.; Griffin, P.M.; Gould, L.H.; Herman, K.; Bopp, C.A.; Strockbine, N.; Mody, R.K. Outbreaks of non-O157 Shiga toxin-producing Escherichia coli infection: USA. Epidemiol. Infect. 2014, 142, 2270–2280. [Google Scholar] [CrossRef]
- Ludwig, J.B.; Shi, X.; Shridhar, P.B.; Roberts, E.L.; DebRoy, C.; Phebus, R.K.; Bai, J.; Nagaraja, T.G. Multiplex PCR assays for the detection of one hundred and thirty-seven serogroups of shiga toxin-producing Escherichia coli associated with cattle. Front. Cell. Infect. Microbiol. 2020, 10, 378. [Google Scholar] [CrossRef]
- Elmonir, W.; Shalaan, S.; Tahoun, A.; Mahmoud, S.F.; Remela, E.M.A.; Eissa, R.; El-Sharkawy, H.; Shukry, M.; Zahran, R.N. Prevalence, antimicrobial resistance, and genotyping of Shiga toxin-producing Escherichia coli in foods of cattle origin, diarrheic cattle, and diarrheic humans in Egypt. Gut Pathog. 2021, 13, 8. [Google Scholar] [CrossRef]
- Tarr, P.I.; Freedman, S.B. Why antibiotics should not be used to treat Shiga toxin-producing Escherichia coli infections. Curr. Opin. Gastroenterol. 2022, 38, 30–38. [Google Scholar] [CrossRef]
- Fraser, A.M.; Anderson, J.; Goncalves, J.; Black, E.; Starobin, A.; Buckley, D.; Grinstead, D.; Manuel, C.; Hollingsworth, J. Sanitizers and Disinfectants: A Retail Food and Foodservice Perspective. Food Prot. Trends 2021, 41, 358–367. [Google Scholar] [CrossRef]
- Sundheim, G.; Langsrud, S.; Heir, E.; Holck, A.L. Bacterial resistance to disinfectants containing quaternary ammonium compounds. Int. Biodeterior. Biodegrad. 1998, 41, 235–239. [Google Scholar] [CrossRef]
- Boyce, J.M. Quaternary ammonium disinfectants and antiseptics: Tolerance, resistance and potential impact on antibiotic resistance. Antimicrob. Resist. Infect. Control 2023, 12, 32. [Google Scholar] [CrossRef]
- Buffet-Bataillon, S.; Tattevin, P.; Bonnaure-Mallet, M.; Jolivet-Gougeon, A. Emergence of resistance to antibacterial agents: The role of quaternary ammonium compounds—A critical review. Int. J. Antimicrob. Agents 2012, 39, 381–389. [Google Scholar] [CrossRef] [PubMed]
- Castro, V.S.; Mutz, Y.d.S.; Rosario, D.K.A.; Cunha-Neto, A.; Figueiredo, E.E.d.S.; Conte-Junior, C.A. Inactivation of multi-drug resistant non-typhoidal Salmonella and wild-type Escherichia coli STEC using organic acids: A potential alternative to the food industry. Pathogens 2020, 9, 849. [Google Scholar] [CrossRef] [PubMed]
- Kumar, G.D.; Krishnaprabha; Oguadinma, I.C.; Mishra, A.; Suh, J.H.; Singh, M. Influence of antibiotic-resistance and exudate on peroxyacetic acid tolerance in O157 and non-O157 Shiga toxin producing E. coli. Int. J. Food Microbiol. 2023, 391–393, 110144. [Google Scholar] [CrossRef]
- Ovchinnikov, V.; Stone, T.A.; Deber, C.M.; Kaplus, M. Structure of the EmrE multidrug resistance efflux transporter and its use for inhibitor peptide design. Proc. Natl. Acad. Sci. USA 2018, 115, E7932–E7941. [Google Scholar] [CrossRef] [PubMed]
- Zhou, F.; Wang, D.; Hu, J.; Zhang, Y.; Tan, B.K.; Lin, S. Control Measurements of Escherichia coli Biofilm: A Review. Foods 2022, 11, 2469. [Google Scholar] [CrossRef]
- Cadena, M.; Kelman, T.; Marco, M.L.; Pitesky, M. Understanding Antimicrobial Resistance (AMR) profiles of Salmonella biofilm and planktonic bacteria challenged with disinfectants commonly used during poultry processing. Foods 2019, 8, 275. [Google Scholar] [CrossRef]
- Wicaksono, W.A.; Erschen, S.; Krause, R.; Müller, H.; Cernava, T.; Berg, G. Enhanced survival of multi-species biofilms under stress is promoted by low-abundant but antimicrobial-resistant keystone species. J. Hazard. Mater. 2022, 422, 126836. [Google Scholar] [CrossRef]
- Zhang, P.; Yang, X. Genetic Characteristics of the transmissible locus of stress tolerance (tLST) and tLST harboring Escherichia coli as revealed by large-scale genomic analysis. Appl. Environ. Microbiol. 2022, 88, e0218521. [Google Scholar] [CrossRef]
- Shin, H.-H.; Cho, S.-H. Prevalence of Antimicrobial Resistance in Escherichia coli Strains Isolated from Fishery Workers. Osong Public Health Res. Perspect. 2013, 4, 72–75. [Google Scholar] [CrossRef][Green Version]
- Saini, P.; Bandsode, V.; Singh, A.; Mendem, S.K.; Semmler, T.; Alam, M.; Ahmed, N. Genomic insights into virulence, antimicrobial resistance, and adaptation acumen of Escherichia coli isolated from an urban environment. mBio 2024, 15, e0354523. [Google Scholar] [CrossRef]
- Nji, E.; Kazibwe, J.; Hambridge, T.; Joko, C.A.; Larbi, A.A.; Damptey, L.A.O.; Nkansa-Gyamfi, N.A.; Lundborg, C.S.; Lien, L.T.Q. High prevalence of antibiotic resistance in commensal Escherichia coli from healthy human sources in community settings. Sci. Rep. 2021, 11, 3372. [Google Scholar] [CrossRef]
- Massella, E.; Giacometti, F.; Bonilauri, P.; Reid, C.J.; Djordjevic, S.P.; Merialdi, G.; Bacci, C.; Fiorentini, L.; Massi, P.; Bardasi, L.; et al. Antimicrobial Resistance Profile and ExPEC Virulence Potential in Commensal Escherichia coli of Multiple Sources. Antibiotics 2021, 10, 351. [Google Scholar] [CrossRef] [PubMed]
- Castro, V.S.; Fang, Y.; Yang, X.; Stanford, K. Association of resistance to quaternary ammonium compounds and organic acids with genetic markers and their relationship to Escherichia coli serogroup. Food Microbiol. 2023, 113, 104267. [Google Scholar] [CrossRef] [PubMed]
- Castro, V.S.; Polo, R.O.; Figueiredo, E.E.d.S.; Bumunange, E.W.; McAllister, T.; King, R.; Conte-Junior, C.A.; Stanford, K. Inconsistent PCR detection of Shiga toxin-producing Escherichia coli: Insights from whole genome sequence analyses. PLoS ONE 2021, 16, e0257168. [Google Scholar] [CrossRef] [PubMed]
- Uelze, L.; Grützke, J.; Borowiak, M.; Hammerl, J.A.; Juraschek, K.; Deneke, C.; Tausch, S.H.; Malorny, B. Typing methods based on whole genome sequencing data. One Health Outlook 2020, 2, 3. [Google Scholar] [CrossRef]
- Joris, M.-A.; Verstraete, K.; De Reu, K.; De Zutter, L. Loss of vtx genes after the first subcultivation step of verocytotoxigenic Escherichia coli O157 and Non-O157 during isolation from naturally contaminated fecal samples. Toxins 2011, 3, 672–677. [Google Scholar] [CrossRef]
- Senthakumaran, T.; Brandal, L.T.; Lindstedt, B.-A.; Jørgensen, S.B.; Charnock, C.; Tunsjø, H.S. Implications of stx loss for clinical diagnostics of Shiga toxin-producing Escherichia coli. Eur. J. Clin. Microbiol. Infect. Dis. 2018, 37, 2361–2370. [Google Scholar] [CrossRef]
- Puangseree, J.; Jeamsripong, S.; Prathan, R.; Pungpian, C.; Chuanchuen, R. Resistance to widely-used disinfectants and heavy metals and cross resistance to antibiotics in Escherichia coli isolated from pigs, pork and pig carcass. Food Control 2021, 124, 107892. [Google Scholar] [CrossRef]
- Kampf, G.; Kampf, G. Antiseptic Stewardship for Surface Disinfectants. In Antiseptic Stewardship: Biocide Resistance and Clinical Implications; Springer International Publishing: Cham, Switzerland, 2018; pp. 661–669. [Google Scholar]
- Li, Y.; Ge, X. Role of Berberine as a potential efflux pump inhibitor against MdfA from Escherichia coli: In Vitro and In Silico studies. Microbiol. Spectr. 2023, 11, e0332422. [Google Scholar] [CrossRef]
- Edgar, R.; Bibi, E. MdfA, an Escherichia coli multidrug resistance protein with an extraordinarily broad spectrum of drug recognition. J. Bacteriol. 1997, 179, 2274–2280. [Google Scholar] [CrossRef]
- Liu, Y.; Hatim, T.; Chunyan, W.; Zhonggao, X.; Min, D. Diagnosis and treatment for Shiga toxin-producing Escherichia coli associated hemolytic uremic syndrome. Toxins. 2022, 15, 10. [Google Scholar] [CrossRef] [PubMed]
- Dong, H.-J.; Lee, S.; Kim, W.; An, J.-U.; Kim, J.; Kim, D.; Cho, S. Prevalence, virulence potential, and pulsed-field gel electrophoresis profiling of Shiga toxin-producing Escherichia coli strains from cattle. Gut Pathog. 2017, 9, 22. [Google Scholar] [CrossRef] [PubMed]
- Johannes, L.; Römer, W. Shiga toxins—From cell biology to biomedical applications. Nat. Rev. Microbiol. 2010, 8, 105–116. [Google Scholar] [CrossRef]
- Schellhorn, H.E. Function, Evolution, and Composition of the RpoS Regulon in Escherichia coli. Front. Microbiol. 2020, 11, 560099. [Google Scholar] [CrossRef] [PubMed]
- Sapountzis, P.; Segura, A.; Desvaux, M.; Forano, E. An overview of the elusive passenger in the gastrointestinal tract of cattle: The shiga toxin producing Escherichia coli. Microorganisms 2020, 8, 877. [Google Scholar] [CrossRef]
- Heller, D.M.; Tavag, M.; Hochschild, A. CbtA toxin of Escherichia coli inhibits cell division and cell elongation via direct and independent interactions with FtsZ and MreB. PLoS Genet. 2017, 13, e1007007. [Google Scholar] [CrossRef]
- Yamaguchi, Y.; Park, J.-H.; Inouye, M. Toxin-Antitoxin Systems in Bacteria and Archaea. Annu. Rev. Genet. 2011, 45, 61–79. [Google Scholar] [CrossRef]
- Tan, Q.; Awano, N.; Inouye, M. YeeV is an Escherichia coli toxin that inhibits cell division by targeting the cytoskeleton proteins, FtsZ and MreB. Mol. Microbiol. 2011, 79, 109–118. [Google Scholar] [CrossRef]
- Mohapatra, S.; Yutao, L.; Goh, S.G.; Ng, C.; Luhua, Y.; Tran, N.H.; Gin, K.Y.H. Quaternary ammonium compounds of emerging concern: Classification, occurrence, fate, toxicity and antimicrobial resistance. J. Hazard. Mater. 2023, 445, p.130393. [Google Scholar] [CrossRef]
- Belousov, M.V.; Kosolapova, A.O.; Fayoud, H.; Sulatsky, M.I.; Sulatskaya, A.I.; Romanenko, M.N.; Bobylev, A.G.; Antonets, K.S.; Nizhnikov, A.A. OmpC and OmpF outer membrane proteins of Escherichia coli and Salmonella enterica form bona fide amyloids. Int. J. Mol. Sci. 2023, 24, 15522. [Google Scholar] [CrossRef]
- Ambrose, S.J.; Hall, R.M. dfrA trimethoprim resistance genes found in Gram-negative bacteria: Compilation and unambiguous numbering. J. Antimicrob. Chemother. 2021, 76, 2748–2756. [Google Scholar] [CrossRef] [PubMed]
- Rebelo, A.; Duarte, B.; Freitas, A.R.; Peixe, L.; Antunes, P.; Novais, C. Exploring Peracetic Acid and Acidic pH Tolerance of Antibiotic-Resistant Non-Typhoidal Salmonella and Enterococcus faecium from Diverse Epidemiological and Genetic Backgrounds. Microorganisms 2023, 11, 2330. [Google Scholar] [CrossRef] [PubMed]
- Krüger, A.; Lucchesi, P.M.A. Shiga toxins and stx phages: Highly diverse entities. Microbiology 2015, 161, 451–462. [Google Scholar] [CrossRef] [PubMed]
- Ghaly, T.M.; Gillings, M.R.; Penesyan, A.; Qi, Q.; Rajabal, V.; Tetu, S.G. The natural history of integrons. Microorganisms 2021, 9, 2212. [Google Scholar] [CrossRef]
- Bhat, B.A.; Mir, R.A.; Qadri, H.; Dhiman, R.; Almilaibary, A.; Alkhanani, M.; Mir, M.A. Integrons in the development of antimicrobial resistance: Critical review and perspectives. Front. Microbiol. 2023, 14, 1231938. [Google Scholar] [CrossRef]
- Bragg, R.; Jansen, A.; Coetzee, M.; van der Westhuizen, W.; Boucher, C. Bacterial resistance to quaternary ammonium compounds (QAC) disinfectants. In Proceedings of the Infectious Diseases and Nanomedicine II: First International Conference (ICIDN–2012), Kathmandu, Nepal, 15–18 December 2012; Springer: New Delhi, India, 2014; pp. 1–13. [Google Scholar]
- Yang, M.; Xia, Q.; Du, S.; Zhang, Z.; Qin, F.; Zhao, Y. Genomic characterization and distribution pattern of a novel marine OM43 phage. Front. Microbiol. 2021, 12, 651326. [Google Scholar] [CrossRef]
- Nautiyal, A.; Thakur, M. Prokaryotic DNA crossroads: Holliday junction formation and resolution. ACS omega 2024, 9, 12515–12538. [Google Scholar] [CrossRef]
- Fonseca, É.L.; Vicente, A.C. Integron functionality and genome innovation: An update on the subtle and smart strategy of integrase and gene cassette expression regulation. Microorganisms 2022, 10, 224. [Google Scholar] [CrossRef]
- Zheng, W.; Huyan, J.; Tian, Z.; Zhang, Y.; Wen, X. Clinical class 1 integron-integrase gene—A promising indicator to monitor the abundance and elimination of antibiotic resistance genes in an urban wastewater treatment plant. Environ. Int. 2020, 135, 105372. [Google Scholar] [CrossRef]
- R Core Team. R: A Language and Environment for Statistical Computing; R Foundation for Statistical Computing: Vienna, Austria, 2023; Available online: https://www.R-project.org/ (accessed on 11 December 2023).
- Di Franco, G. Multiple correspondence analysis: One only or several techniques? Qual. Quant. 2016, 50, 1299–1315. [Google Scholar] [CrossRef]
- Greenacre, Z.A.; Terlemez, L.; Sentürk, S. Usage as Complementary Correspondence Analysis and Logistic Regression in a Scientific Survey on Self-Healing Methods. Open J. Stat. 2014, 04, 912–920. [Google Scholar] [CrossRef]
- Lê, S.; Josse, J.; Husson, F. FactoMineR: An R Package for Multivariate Analysis. J. Stat. Softw. 2008, 25, 1–18. [Google Scholar] [CrossRef]
- Kassambara, A.; Mundt, F. Factoextra: Extract and Visualize the Results of Multivariate Data Analyses. CRAN: Contributed Packages, v. 1.0.7. 2016. Available online: https://doi.org/10.32614/cran.package.factoextra (accessed on 25 February 2025).
Disclaimer/Publisher’s Note: The statements, opinions and data contained in all publications are solely those of the individual author(s) and contributor(s) and not of MDPI and/or the editor(s). MDPI and/or the editor(s) disclaim responsibility for any injury to people or property resulting from any ideas, methods, instructions or products referred to in the content. |
© 2025 by the authors. Licensee MDPI, Basel, Switzerland. This article is an open access article distributed under the terms and conditions of the Creative Commons Attribution (CC BY) license (https://creativecommons.org/licenses/by/4.0/).