Article

Cerebrospinal Pharmacokinetic Modeling and Pharmacodynamic Simulation of High-Dose Cefazolin for Meningitis Caused by Methicillin-Susceptible Staphylococcus aureus

1
Department of Pharmacy, Shimane University Hospital, 89-1 Enya-cho, Izumo 693-8501, Japan
2
Department of Clinical Pharmacotherapy, Hiroshima University, 1-2-3 Kasumi, Minami-ku, Hiroshima 734-8551, Japan
*
Author to whom correspondence should be addressed.
Antibiotics 2025, 14(10), 1008; https://doi.org/10.3390/antibiotics14101008 (registering DOI)
Submission received: 25 August 2025 / Revised: 5 October 2025 / Accepted: 9 October 2025 / Published: 11 October 2025

Abstract

Background: Cefazolin is being increasingly used to treat central nervous system infections caused by methicillin-susceptible Staphylococcus aureus (MSSA) to mitigate the side effects of existing anti-Staphylococcal drugs. This study aims to develop a cerebrospinal pharmacokinetic (PK) model to predict the cefazolin concentration in cerebrospinal fluid (CSF) and to individualize the dosing regimen for MSSA meningitis. Methods: A cerebrospinal PK model was developed based on the existing literature and used to estimate the probability of attaining PK/ pharmacodynamic (PD) targets. These targets were set as 100% time above the minimum inhibitory concentration (T > MIC) in CSF. The cerebrospinal PK/PD breakpoint was defined as the highest MIC at which target attainment probability in CSF was ≥90%. The mean CSF/serum ratio estimated from the literature was 0.0525 after a dose of 1–3 g (sampling time: 1–9 h after dose) in adult patients with suspected meningitis. This ratio was incorporated into this PK model based on a hybrid approach. Results: For patients with creatinine clearance (CLcr) = 90 mL/min, the cerebrospinal PK/PD breakpoint MICs of continuous infusion regimens (6–12 g/day) reached 0.5 µg/mL, which can inhibit the growth of 90% of the MSSA population (MIC90). Furthermore, for patients with renal dysfunction (CLcr = 30 mL/min), a dose reduction (4 g/day) may be required to avoid excessive drug exposure. Conclusions: High-dose continuous infusion of cefazolin may be appropriate for MSSA meningitis in patients with normal renal function, while dose adjustments are needed for those with renal impairment.

1. Introduction

Central nervous system (CNS) infections caused by bacteria are life-threatening conditions with a high mortality rate worldwide. Methicillin-susceptible Staphylococcus aureus (MSSA) is one of the most common bacterial pathogens causing CNS infections such as shunt-related meningitis [1]. Nafcillin and oxacillin are anti-staphylococcal penicillin-like antibiotics that are used as the first-line treatment for MSSA-mediated shunt-related meningitis [1,2,3]. However, these antibiotics are associated with toxicity (e.g., fluid retention, elevated liver enzymes, interstitial nephritis) and are unavailable in some countries, including Japan [4]. Cefazolin, a first-generation cephalosporin antibiotic, has excellent activity against MSSA and has frequently been used to treat MSSA infections [5,6,7,8,9]. Still, it is not recommended for treating CNS infections due to its low penetration into the CNS [10]. However, several recent reports have suggested that high-dose regimens of cefazolin are effective against MSSA meningitis [11,12,13,14], suggesting that the use of cefazolin for CNS infections should be reconsidered.
Pharmacokinetic (PK)/pharmacodynamic (PD) theory has previously been used to optimize antimicrobial treatment [15]. The antimicrobial activity of β-lactam antibiotics such as cefazolin is generally dependent on the exposure time during which the drug concentrations remain above the minimum inhibitory concentration for the bacteria (T > MIC) [16,17]. Although there are reports that simply measured the cefazolin concentrations in CSF [11,12], none of the previous reports has described cerebrospinal PK or assessed site-specific PK/PD with mathematical modeling and stochastic simulation. Furthermore, the previously reported data [11,12,13] on cefazolin CSF concentrations were observed in patients with normal renal function, and there are no data for patients with impaired renal function. Therefore, a mathematical model for predicting CSF concentrations can be valuable. To verify the appropriateness of high-dose regimens, a stochastic PK/PD evaluation is required from a quantitative perspective. Therefore, this study aims to develop a cerebrospinal PK model that predicts the cefazolin concentration in CSF using existing data, and to optimize the dosing regimen considering the sensitivity of MSSA to cefazolin and patient backgrounds.

2. Results

2.1. Model Validation

All final model parameters (ηKPCSF, ηQCSF and ηVCSF) were estimated to be within the 95% confidence intervals based on sampling importance resampling algorithm. Figure 1 shows the goodness-of-fit plots of the plasma and cerebrospinal fluid (CSF) concentrations. Scatter plots of the observed concentration (DV) vs. population-predicted concentration (PRED) or individual-predicted values (IPRED), and conditional weighted residuals (CWRES) vs. PRED in plasma and CSF indicated some bias.
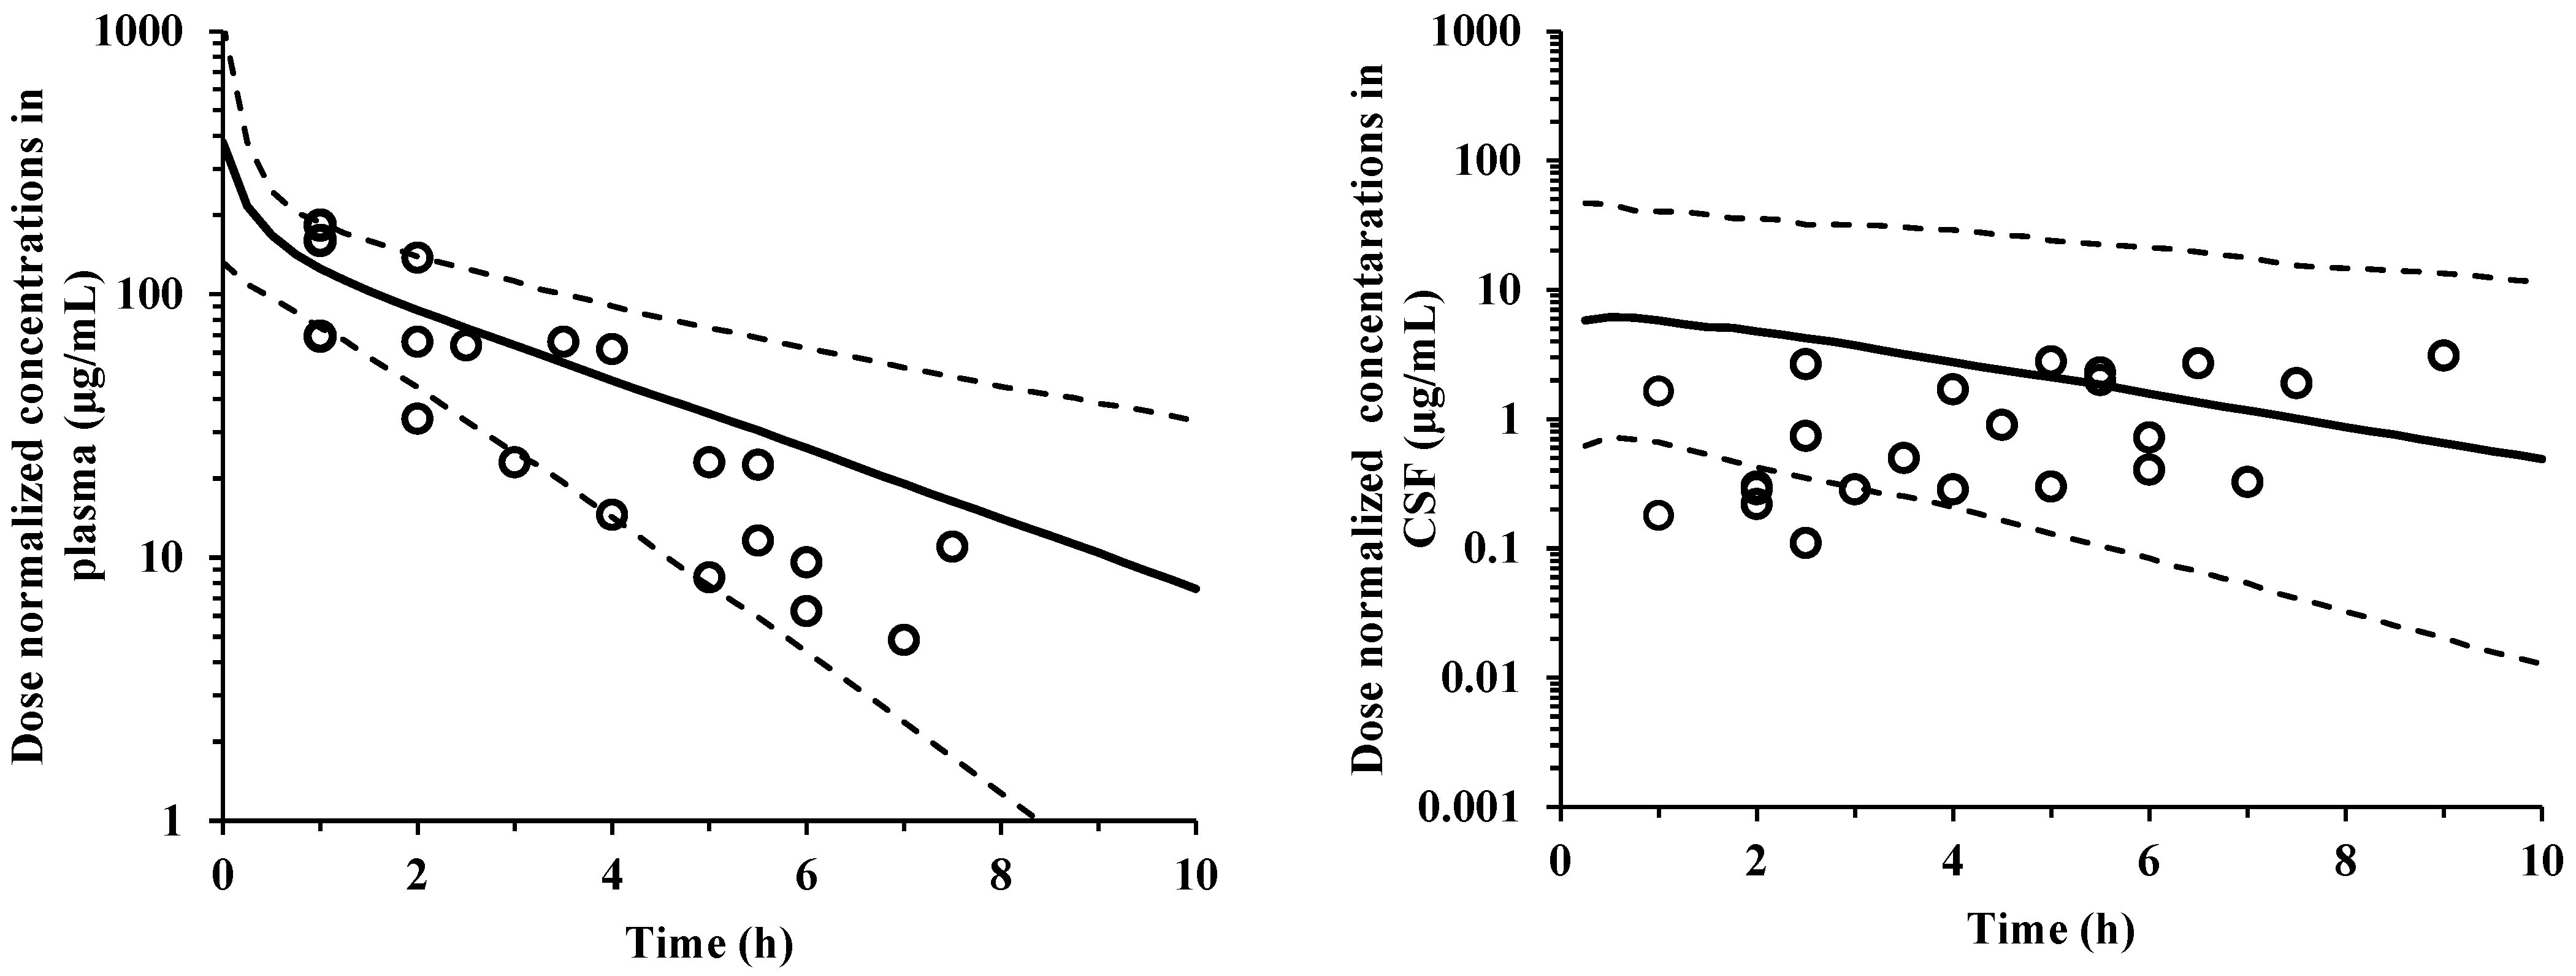
Furthermore, dose-normalized visual predictive checks were performed for the observed and predicted concentrations in plasma and CSF vs. the time curves of cefazolin (Figure 2). Most of the observed values were within the predicted 95% confidence intervals for the 2.5th, 50th, and 97.5th percentile points.

2.2. PK/PD Evaluation

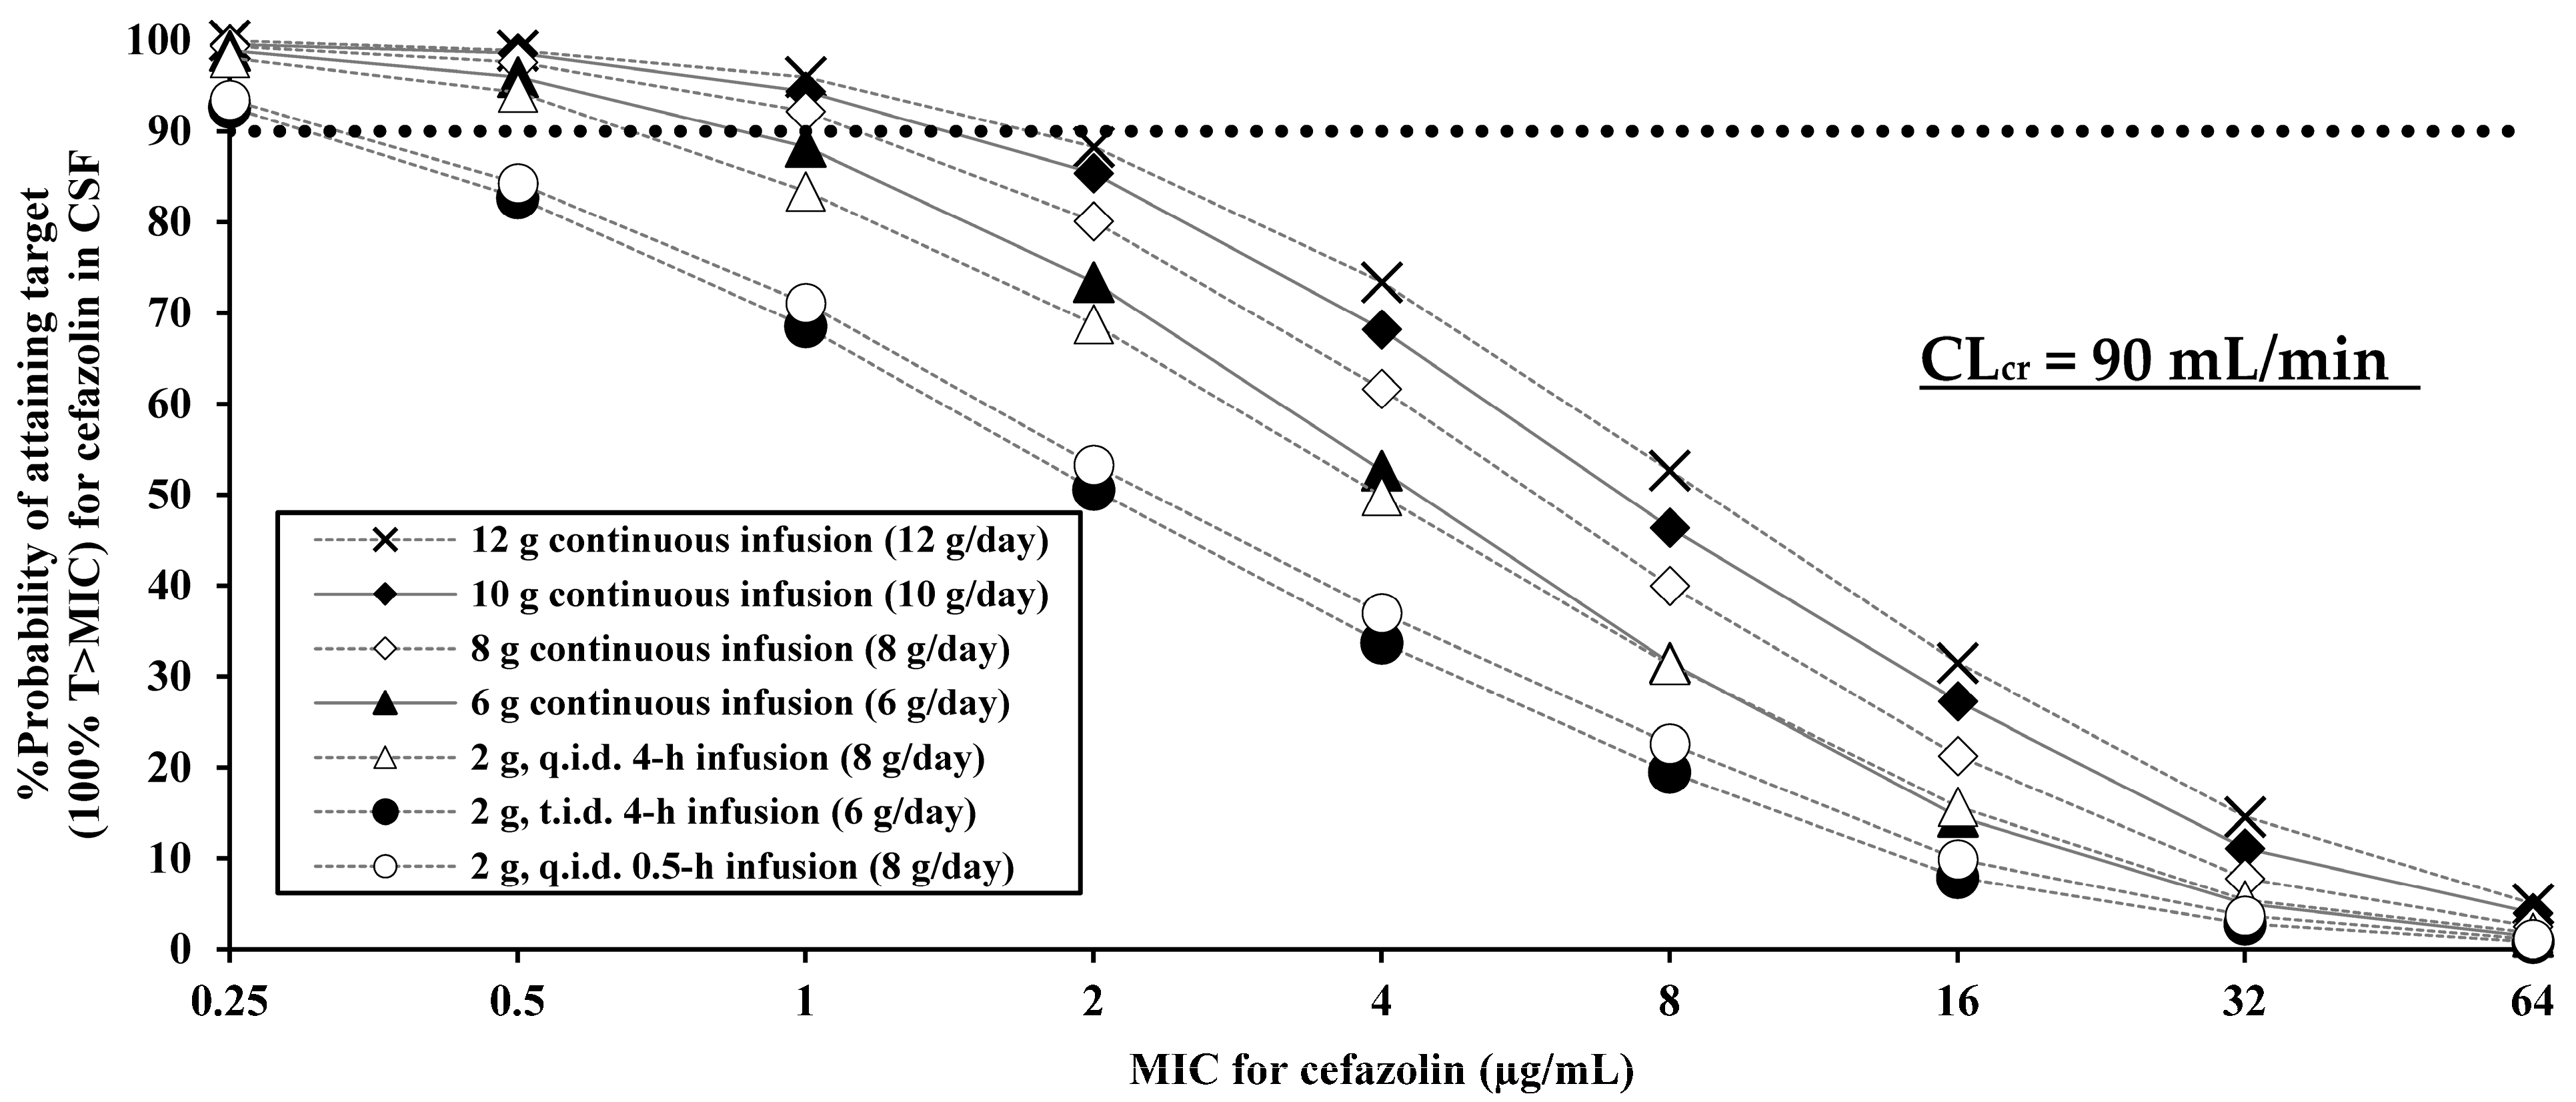
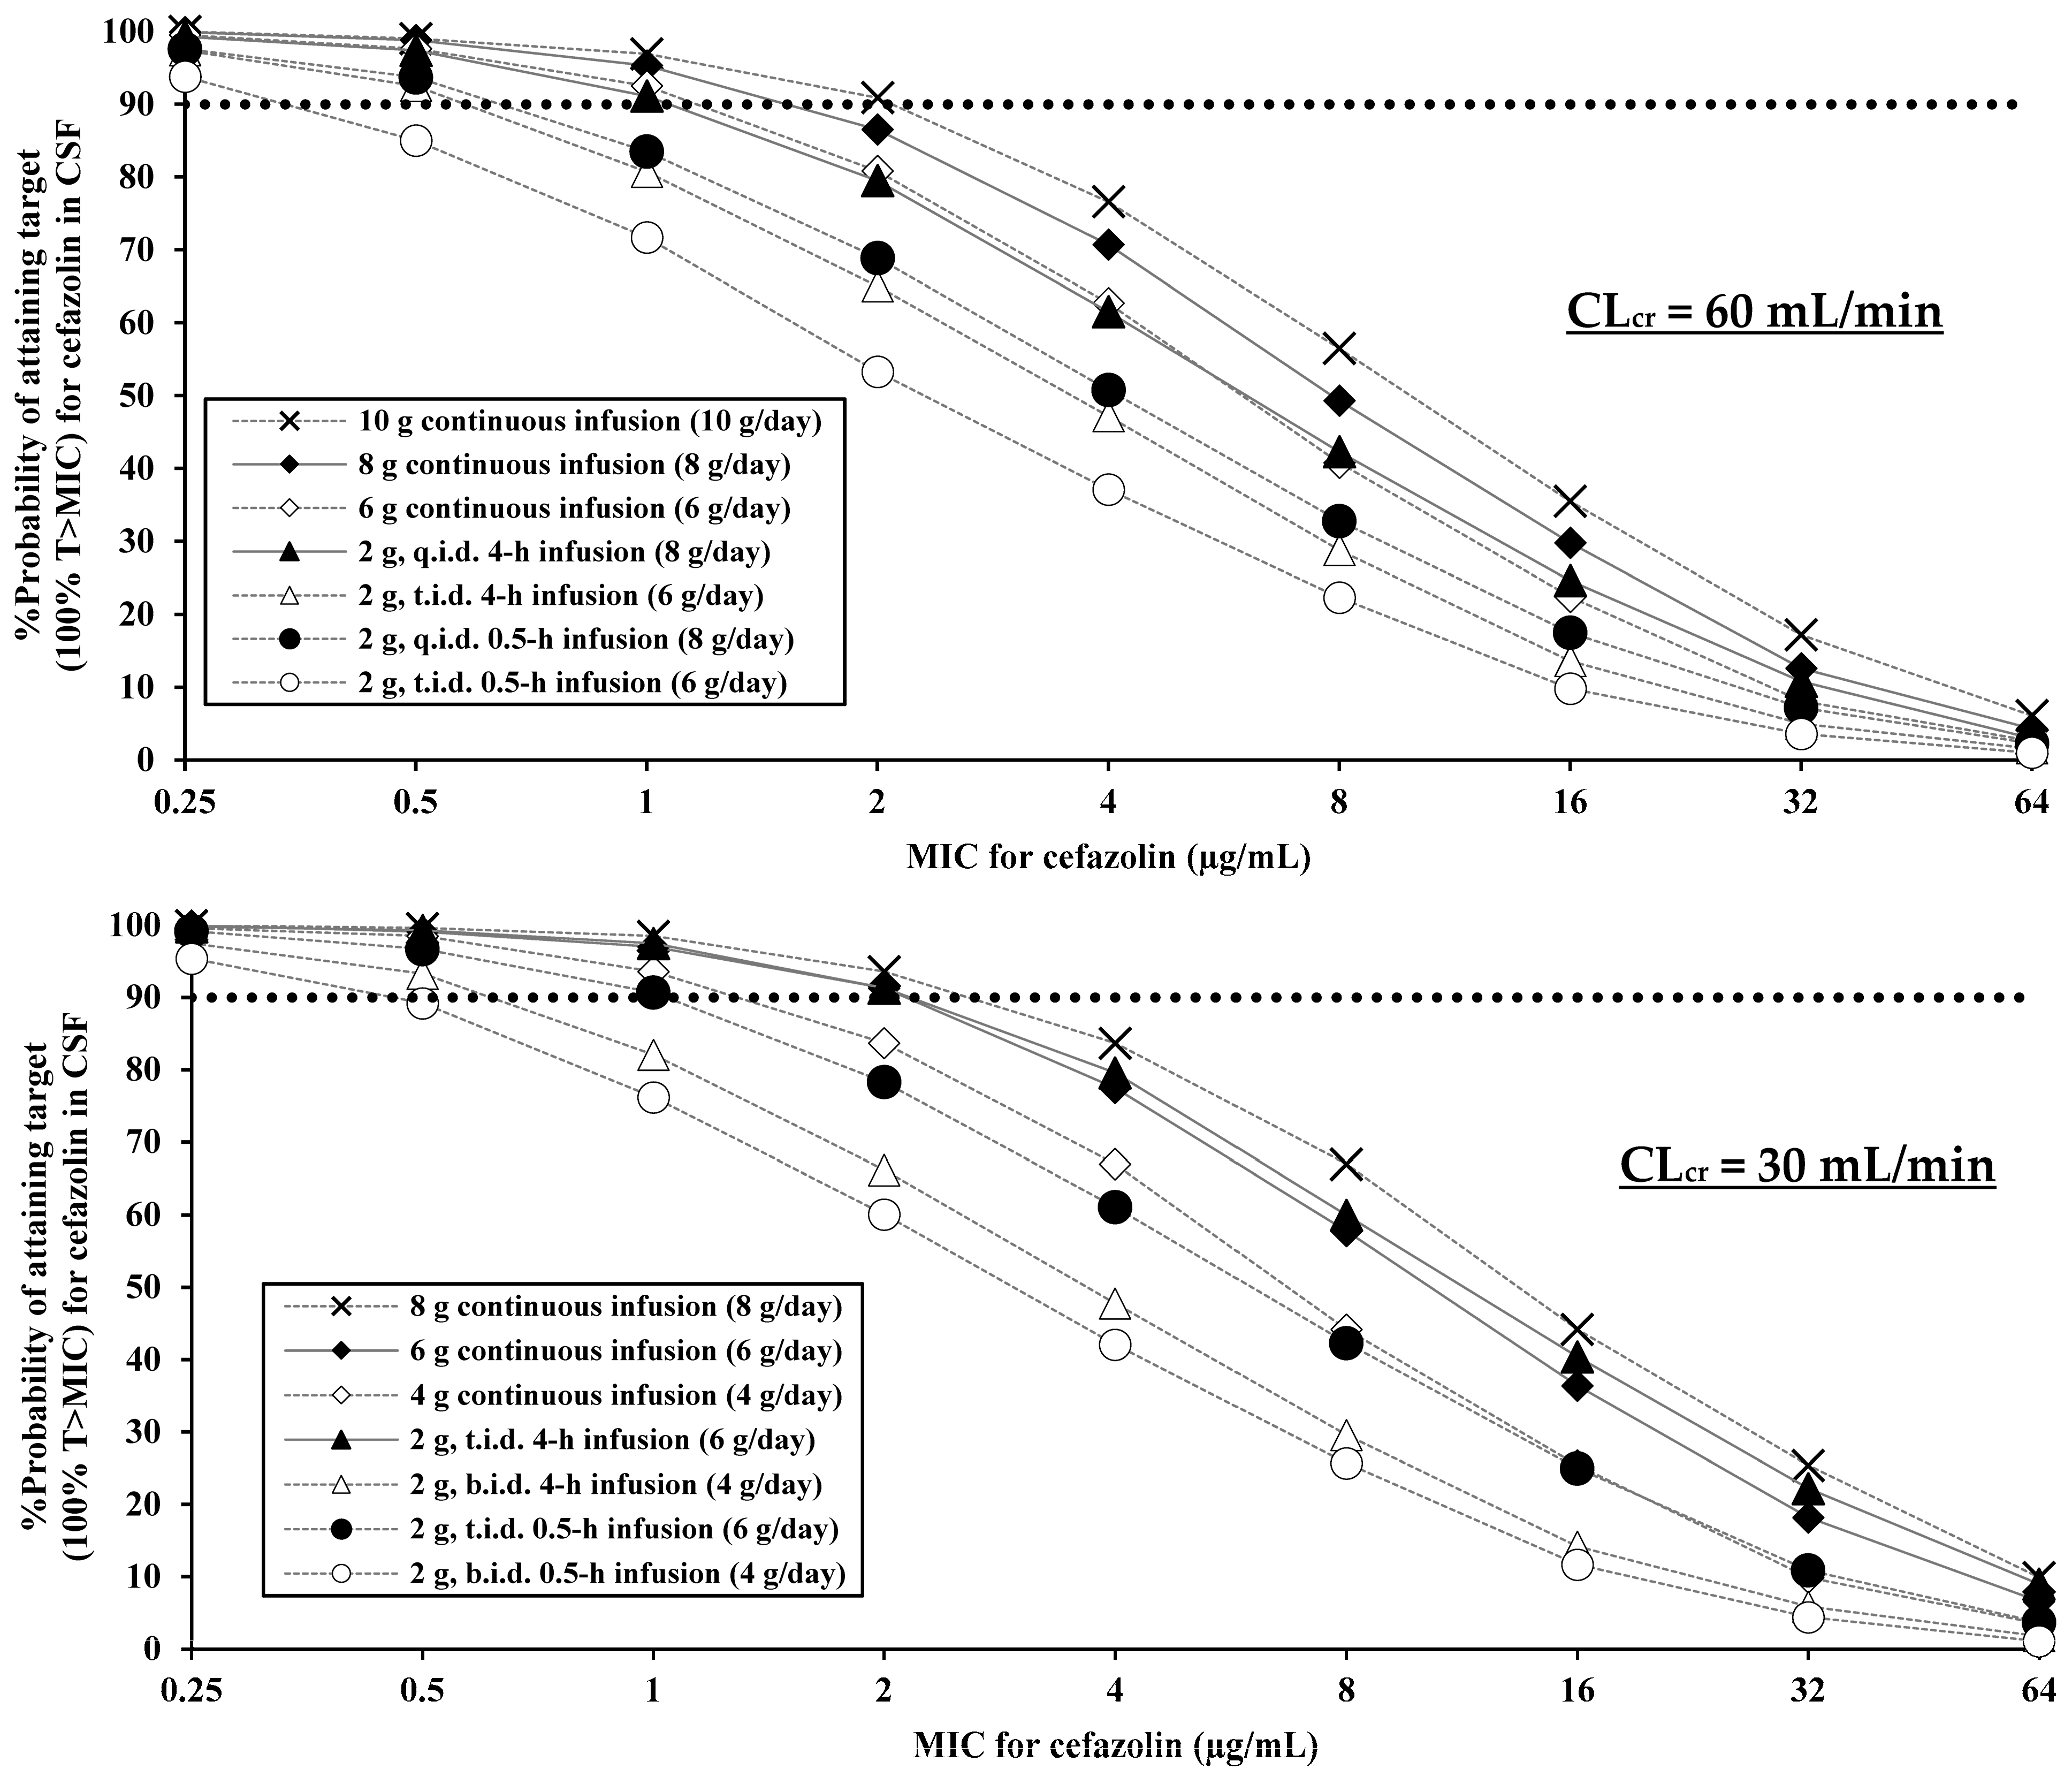
We estimated the probabilities of target attainment in the CSF based on the final model using different dosing regimens (Figure 3). For 100% time above the minimum inhibitory concentration (T > MIC), the cerebrospinal pharmacokinetic/pharmacodynamic (PK/PD) breakpoints were defined as the highest MIC at which the target attainment probability in CSF was >90% (Table 1).
For typical patients with creatinine clearance (CLcr) = 90 mL/min, the cerebrospinal PK/PD breakpoint MICs were as follows: 0.25 μg/mL for 2 g four times daily (0.5 h infusion) and 2 g three times daily (4 h infusion); 0.5 μg/mL for 2 g four times daily (4 h infusion) and 6 g continuous infusion; 1 μg/mL for 8 g, 10 g, and 12 g, each as a continuous infusion.
For typical patients with CLcr = 60 mL/min, the cerebrospinal PK/PD breakpoint MICs were as follows: 0.25 μg/mL for 2 g three times daily (0.5 h infusion); 0.5 μg/mL for 2 g four times daily (0.5 h infusion) and 2 g three times daily (4 h infusion); 1 μg/mL for 2 g four times daily (4 h infusion), 6 g and 8 g as continuous infusions; 2 μg/mL for 10 g continuous infusion.
For typical patients with CLcr = 30 mL/min, the cerebrospinal PK/PD breakpoint MICs were as follows: 0.25 μg/mL for 2 g twice daily (0.5 h infusion); 0.5 μg/mL for 2 g twice daily (4 h infusion); 1 μg/mL for 2 g three times daily (0.5 h infusion) and 4 g continuous infusion; 2 μg/mL for 2 g three times daily (4 h infusion), 6 g and 8 g as continuous infusions.

3. Discussion

The efficacy and feasibility of high-dose regimens for MSSA associated meningitis have not been evaluated from a quantitative perspective or optimized based on the patient’s renal function. In this study, a cerebrospinal PK model of cefazolin was developed, integrating existing data. The PD for high-dose regimens of cefazolin in patients with MSSA meningitis was also evaluated, considering renal function.
In the cerebrospinal PK model, KPCSF was calculated based on the observed serum and CSF concentrations, as described by Ikuno H et al. [18]. The mean CSF/serum ratio estimated from their report was 0.0525 after a 1–3 g dose (sampling time: 1–9 h after dose) in adult patients with suspected meningitis. A previous review article of Antosz K. et al. reported a CSF/plasma concentration ratio ranging from 0.03 to 0.12 (inflamed) [14]. The current results are within the previous report and reasonable. The previously reported data used to calculate KPCSF in this study included two and six patients with CSF protein levels over 300 mg/dL and under 100 mg/dL, respectively. The CSF/serum concentration ratio in patients with CSF protein levels over 300 mg/dL tended to be higher than in those with CSF protein levels under 100 mg/dL. However, quantitative incorporation of CSF protein levels into KPCSF as a covariate was difficult due to the small sample size. In cases where inflammation has decreased since the start of treatment, higher doses may be required.
A CSF PK model for cefazolin was generated using hybrid modeling by leveraging previously reported PK parameters and incorporating physiological parameters. Since the specific CSF flow clearance of a drug depends mainly on its physiological factor, the system-to-CSF and CSF-to-system clearance values were supposed to be the same, and hence were set as the CSF flow in the hybrid modeling. All final model parameters (ηKPCSF, ηQCSF and ηVCSF) were estimated to be within the 95% confidence intervals based on the sampling importance resampling algorithm. For the goodness-of-fit plots (Figure 1), the trend line indicated some bias which raised concerns about the validity of the model. However, we comprehensively judged that the goodness-of-fit plots distribution were generally uniform across the diagonal line, that most of the observed values in the dose-normalized visual predictive check results (Figure 2) were within the 95% confidence interval. Furthermore, the uncertainty in model validation may be due to the small number of CSF samples. These are considered as a limitation of this study.
Regarding the cerebrospinal PD evaluation, the PK/PD breakpoints (100% T > MIC) in CSF of dosing regimens with continuous infusion in typical patients with CLcr = 90 mL/min reached 0.5 µg/mL for MIC90 = MSSA (Table 1). Meanwhile, since these breakpoints were lower for 0.5 h infusion regimens in typical patients (maximum 0.25 μg/mL), these regimens are not recommended. The PD simulation results demonstrated the appropriateness of high-dose administration, especially in cases with good renal function. As for the appropriateness of PD simulation, Grégoire M et al. reported that the mean total cefazolin concentrations in CSF after continuous infusion of 8 g daily in a case report with normal renal function (glomerular filtration rate: 60 to 106 mL/min per 1.73 m2 after six weeks) was 6.1 µg/mL [11]. Le Turnier P et al. reported that median CSF concentrations after mainly continuous infusions of 8 g daily in subjects with normal renal function (the median glomerular filtration: 136 mL/min) was 2.8 µg/mL (ranging from 2.1 to 5.2 µg/mL) [12]. The median concentration of our simulation for continuous infusion of 8 g daily in typical patients with CLcr = 90 mL/min was 5.7 µg/mL (95% confidence intervals: 0.5 to 62.4 µg/mL) and covered the values of these reports. Furthermore, Novak AR et al. reported that the median trough CSF concentration for 2 g three times daily (6 g/day) in subjects with normal renal function (median CLcr: 115 mL/min) was 1.59 µg/mL (ranging from 0.7 to 2.2 µg/mL) [13]. The median concentration of our simulation for the same dosing regimen in patients with CLcr = 90 mL/min was 1.2 µg/mL (95% confidence intervals: 0.05–25.1 µg/mL), which was similar to the previous values. (Supplementary Table S1) Furthermore, Pitcock C et al. reported that the probability attaining of 100% T > MIC in CSF was more than 90% for 6–12 g/day continuous infusion of cefazolin at 0.5 µg/mL in patients with mean creatinine clearance of 115 mL/min [19]. Comparison with these reported values indicates that our PD simulations are generally reasonable. Therefore, concerns about our model could be resolved with comprehensive judgment from a viewpoint of this external PD validation. Notably, all the values reported above [11,12,13] were from patients with good renal function, and the recommendation of high-dose regimens is limited to them, because high exposure to cefazolin, especially in patients with impaired renal function, has been reported to cause seizures [20]. In fact, the safety simulation to avoid cefazolin-related neurotoxicity showed that even in patients with impaired renal function, dose reduction could reduce the probability of exceeding the neurotoxicity related concentration (64 µg/mL) to less than 10% (Supplementary Table S2). Because a target value for toxicity (e.g., neurotoxicity, nephrotoxicity, or seizures) was not established, the median of cefazolin CSF concentrations (64 µg/mL) in three cases with generalized seizures [20] was used as a reference concentration for safety simulation of cefazolin regimens. Therefore, it is important to adjust, in order to avoid excessive drug exposure, the dose based on the renal function of the patient by referring to the PK/PD breakpoints.
This study mainly has four limitations. First, the population included patients with suspected, and not confirmed meningitis, and hence, the CSF/serum concentration ratio might be underestimated for patients diagnosed with bacterial meningitis. However, since CSF sample collection is challenging and the number of individual cefazolin CSF concentrations previously reported was very low, the inclusion of these populations was considered acceptable. Second, this cerebrospinal model of cefazolin was developed using a PK model in blood and CSF concentration data in an adult population. Therefore, the model cannot be applied to a pediatric population. Third, there are no reports demonstrating the clinical efficacy of cefazolin for meningitis in patients with renal dysfunction, and the appropriateness of dosing regimens proposed in this study has not yet been clinically verified. Therefore, clinical confirmation of the proposed regimens is necessary in patients with impaired renal function. Fourth, this study did not consider the protein binding in CSF due to lack of the detailed data. However, the free cefazolin concentration in CSF (n = 5), the total and free concentrations were similar [11], which suggested dosing regimens in this study may be appropriate.

4. Materials and Methods

4.1. Cerebrospinal PK Modeling

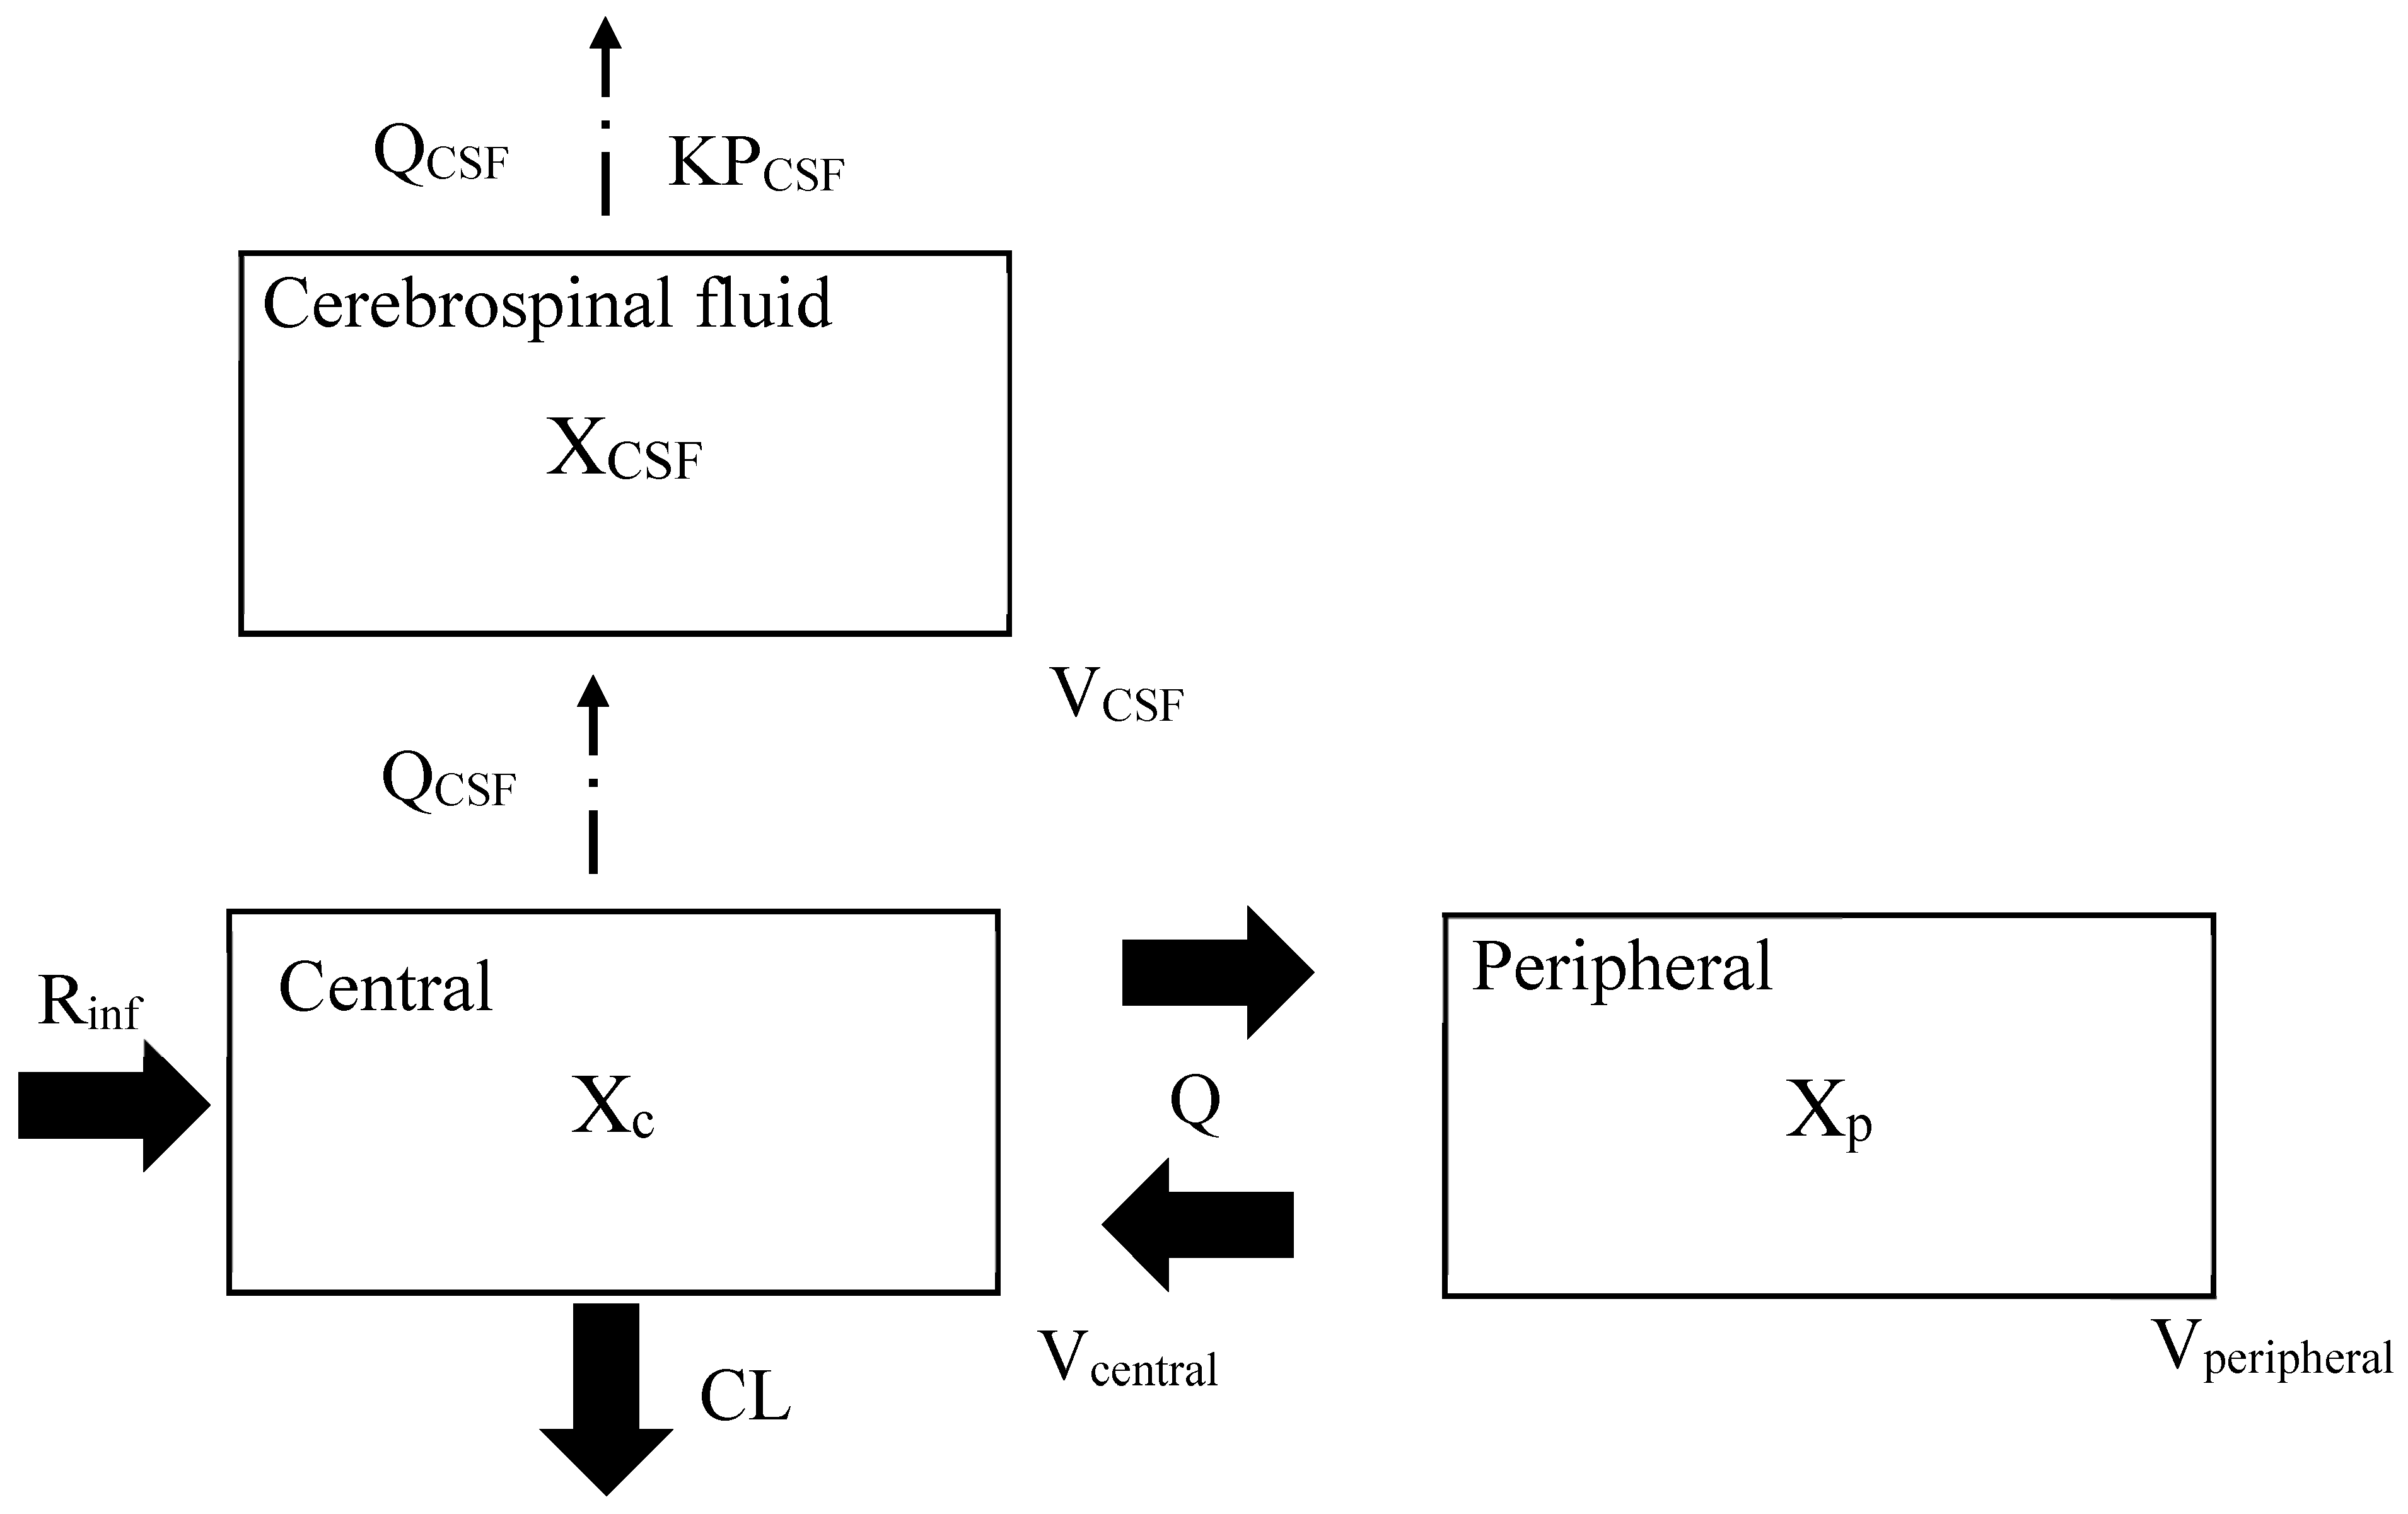
The cerebrospinal pharmacokinetics of cefazolin were described using the following hybrid model (Figure 4), which includes several physiological parameters, such as body fluid flow and volume. This model is partially connected to the conventional PK model and was therefore utilized for the site-specific PK/PD analysis [21,22,23,24].
In the modeling, previously reported PK parameters were leveraged and physiological parameters were incorporated because the observed concentration data in both CSF and plasma were very limited and too small for full modeling. Thus, PK models predicting blood concentrations were systematically searched using the keywords “cefazolin” and “population pharmacokinetics”. The PK model used in the hybrid model to predict plasma concentrations should be simpler (not dealing with protein-unbound concentrations or concentrations in tissue or fluid) and should not be for special populations. Therefore, the following exclusion criteria were set: (1) in animals or combined with other drugs; (2) population PK analysis methods other than nonlinear mixed effects modeling; (3) special populations (pediatric, pregnant women, dialysis, etc.); (4) predicting drug concentrations in tissues and body fluids, and (5) predicting free drug concentrations. Through this defined process, the PK model reported by Lanoiselée J. et al. [25] was selected as the model predicting plasma concentration. As the next step, reported QCSF (CSF flow in L/h) and VCSF (CSF volume in L), as physiological parameters [26], and KPCSF (CSF-to-plasma partition coefficient) estimated from a previous report [18], were connected to the PK model [25]. Thus, the hybrid model is composed of three compartments. The CSF PK model was based on the following equation.
dX(central)/dt = Rinf − (CL/Vcentral + Q/Vcentral)∗X(central) + Q∗X(peripheral)/Vperipheral
dX(peripheral)/dt = Q∗X(central)/Vcentral − Q∗X(peripheral)/Vperipheral
dX(CSF)/dt = QCSF∗X(central)/Vcentral − QCSF∗X(CSF)/VCSF/KPCSF
In the formulas, X(central), X(peripheral), and X(CSF) are the amounts of the drug (mg) in the central, peripheral, and CSF compartments, respectively; Rinf is the rate of infusion (mg/h); CL is the clearance (L/h) from the central compartment; Vcentral and Vperipheral are the volumes of distribution (L) of the central and peripheral compartments, respectively; and Q is the central–peripheral intercompartmental clearance (L/h). The model parameters are listed in Table 2. In the blood compartments, the fixed-effects parameters (θCL, θVcentral, θQ, and θVperipheral) and the interindividual variability (ηCL, ηVcentral, ηQ, and ηVperipheral) were obtained from cefazolin population PK parameters [25]. The fixed-effects parameters were ascertained as follows: CL = 2.86 (L/h) (CLcr, which was calculated by the CKD-EPI formula, was incorporated as a covariate), Vcentral = 5.2 (L), Q = 10.9 (L/h), and Vperipheral = 4.56 (L). QCSF (CSF flow in L/h) and VCSF (CSF volume in L) were used as physiological fixed-effects parameters, were fixed as follows: QCSF = 0.021 (L/h), and VCSF = 0.092 (L) [26]. The CSF/serum concentration ratio at the same sampling points of serum and CSF estimated from literature values incorporated into KPCSF (CSF-to-plasma partition coefficient) [18]. The demographic information from the literature data quoted in this study is represented in the Supplementary Materials (Supplementary Table S3). As bioanalytical methods for the measurement, a liquid chromatography system was used for blood concentrations in the PK parameters [25] and a bioassay was used for CSF concentrations [18]. The structure of the PK model for predicting blood concentration was a two-compartment model. For covariate analysis of this PK model, age, total body weight, body mass index, lean body weight, and CLcr (mL/min) according to the Cockcroft-Gault formula and the Chronic Kidney Disease-Epidemiology Collaboration (CKD-EPI) formula were tested with stepwise procedure, CLcr according to CKD-EPI formula was incorporated as the only covariate for CL in the final model [25]. Additionally, to improve the robustness of the final model, we performed a $PRIOR subroutine analysis [27]. Using $PRIOR NWPRI, we assigned prior information to $THETAP by referencing the RSEs of previous studies [18,25,26] used to develop the model. As a result, the parameters (ηKPCSF, ηQCSF, ηVCSF) analyzed with prior were similar to those without prior, and the RSEs of KPCSF were reduced from 203% to 18%. The results of the sampling importance resampling algorithm showed that estimates were within the 95% CI for the model without priors, but were outside the range for the model with priors. Therefore, referring to Marshall et al.’s approach [28] and the results of the sampling importance resampling algorithm, this type of hybrid model building without priors was adopted (Supplementary Figure S1). The PK model predicting CSF concentrations was developed using the NONMEM (version 7.4; ICON Public Limited Company, Dublin, Ireland).

4.2. Estimation of CSF/Serum Concentration Ratio

Cefazolin concentration data for paired serum and CSF were obtained from 8 adult patients with suspected meningitis, of which 19 serum samples were from 7 patients and 24 CSF samples were from 8 patients [18]. To assess the penetration into the CSF, the CSF/serum concentration ratio was estimated from the serum and CSF at the same sampling points and the times after administration were investigated from the literature data. Mean CSF/serum concentration ratio at the same sampling point was 0.0525 (Standard error: 0.0548) after a 1–3 g dose (sampling time: 1–9 h after dose). Regarding the CSF findings, the CSF protein levels exceeded 300 mg/dL (with inflammation) in two patients, and the mean CSF/serum concentration ratio was 0.081, while six patients had levels below 100 mg/dL (without inflammation), with a mean CSF/serum concentration ratio of 0.038. Regarding to the comparison between sexes, the mean CSF/serum concentration ratio at the same sampling points for males (n = 4) and females (n = 4) was 0.0611 and 0.0457, respectively, and there were no significant differences.

4.3. Model Validation

The robustness of the parameters was tested using a sampling importance resampling algorithm applicable when the analysis population is small with the Perl-speaks-NONMEM software 5.4.0 [29]. The 95% confidence intervals of the parameters from this algorithm (sampling: n = 1000 and resampling n = 1000) were compared with the estimates of the final population model. The final model was validated using goodness-of-fit plots, which included observations versus predictions, CWRES versus prediction, and dose-normalized visual predictive checks. The 95% prediction interval of the drug concentration time course was obtained using the values from the 2.5% point to the 97.5% point of concentrations at each time point by performing 1000 simulations with the final parameter estimates.

4.4. PK/PD Simulation

We randomly generated 1000 cases of the seven fixed-effects parameters θi (CL, Vcentral, Q, Vperipheral, KPCSF, QCSF, VCSF) using the $SIMULATION command in NONMEM according to each mean estimate and the interindividual variance in the final model. Model equations were generated using these seven θi values to estimate the CSF concentrations of cefazolin at steady state for different dosing regimens (0.5 h, 4 h and continuous infusion). The time point at which the CSF concentration coincided with a specific MIC value (0.25–64 μg/mL) was determined, and the drug exposure time above the MIC (T > MIC) was calculated as the cumulative percentage during 24 h for different dosing regimens. The probability of target attainment (%) at a specific MIC was defined as the proportion that achieved 100% T > MIC as the PK/PD target. The total CSF concentration was not adjusted for the free fraction because the protein binding of cefazolin in CSF is currently unknown. Antimicrobial susceptibility of MSSA was derived using surveillance results in 2018 from the Four Academic Societies Joint Antimicrobial Susceptibility Surveillance Program (MIC50 = 0.5 µg/mL, MIC90 = 0.5 µg/mL) [30].

5. Conclusions

In this study, a cerebrospinal PK model of cefazolin was developed. The modeling and simulation analyses suggested that high-dose continuous infusion regimens (6–12 g/day continuous infusion) may achieve the CSF concentrations required for treating MSSA meningitis in adult patients with normal renal function. The findings also suggest that with appropriate dose adjustments based on renal function, cefazolin can be an effective therapeutic option for MSSA meningitis, particularly in cases where traditional anti-staphylococcal agents are contraindicated or nafcillin/oxacillin is available but should be avoided because of their toxic risk.

Supplementary Materials

The following supporting information can be downloaded at: https://www.mdpi.com/article/10.3390/antibiotics14101008/s1, Table S1: External PD validation of high-dose cefazolin. Table S2: Probabilities of exceeding a neurotoxicity-related cefazolin concentration (Cmin > 64 µg/mL [20]) in CSF. The neurotoxicity-related CSF concentration value was set using the median of cefazolin CSF concentrations in three cases of generalized seizures. Table S3: Demographic information of literature data used in this study. Figure S1: Hybrid model building using $PRIOR subroutine.

Author Contributions

Conceptualization: T.O., K.I., N.I., H.T. and T.Y.; methodology, T.O., K.I., N.I., H.T. and T.Y.; validation, T.O., K.I., N.I., H.T. and T.Y.; formal analysis, T.O. and K.I.; investigation, T.O. and K.I.; resources T.O., K.I., N.I., H.T. and T.Y.; data curation, T.O., K.I., N.I., H.T. and T.Y.; writing—original draft preparation, T.O., K.I., N.I., H.T. and T.Y.; writing—review and editing, T.O., K.I., N.I., H.T. and T.Y.; visualization, T.O., K.I., N.I., H.T. and T.Y.; supervision, T.O., K.I., N.I., H.T. and T.Y.; project administration, T.O., K.I., N.I., H.T. and T.Y. All authors have read and agreed to the published version of the manuscript.

Funding

This work was supported in part by the JSPS KAKENHI Grant Numbers 25K18652 and 25K13462.

Institutional Review Board Statement

Not applicable.

Informed Consent Statement

Not applicable.

Data Availability Statement

Data supporting the findings of this study were derived from the resources available in the public domain.

Conflicts of Interest

The authors declare no conflicts of interest.

Abbreviations

The following abbreviations are used in this manuscript:
CNSCentral nervous system
CSFCerebrospinal fluid
CLcrCreatinine clearance
PREDPopulation-predicted concentration
CWRESConditional weighted residuals
MSSAMethicillin-susceptible Staphylococcus aureus
PKPharmacokinetic
PDPharmacodynamic
MICMinimum inhibitory concentration
KPCSFCSF-to-plasma partition coefficient
QCSFCSF flow
VCSFCSF volume
CLClearance
VcentralVolumes of distribution volumes of the central
Qcentral–peripheral intercompartmental clearance
VperipheralVolumes of distribution volumes of the peripheral

References

  1. Gilbert, D.N.; Chambers, H.F.; Saag, M.S.; Pavia, A.T.; Boucher, H.W. The Sanford Guide to Antimicrobial Therapy, 51st ed.; Sanford Guide: Sperryville, VA, USA, 2021. [Google Scholar]
  2. Tunkel, A.R.; Hasbun, R.; Bhimraj, A.; Byers, K.; Kaplan, S.L.; Scheld, W.M.; van de Beek, D.; Bleck, T.P.; Garton, H.J.L.; Zunt, J.R. 2017 Infectious Diseases Society of America’s Clinical Practice Guidelines for Healthcare-Associated Ventriculitis and Meningitis. Clin. Infect. Dis. 2017, 64, e34–e65. [Google Scholar]
  3. Tunkel, A.R.; Hartman, B.J.; Kaplan, S.L.; Kaufman, B.A.; Roos, K.L.; Scheld, W.M.; Whitley, R.J. Practice guidelines for the management of bacterial meningitis. Clin. Infect. Dis. 2004, 39, 1267–1284. [Google Scholar] [CrossRef]
  4. Nafcillin; Package Insert; Baxter Healthcare Corporation: Deerfield, IL, USA, 2007.
  5. Li, J.; Echevarria, K.L.; Hughes, D.W.; Cadena, J.A.; Bowling, J.E.; Lewis, J.S., 2nd. Comparison of cefazolin versus oxacillin for treatment of complicated bacteremia caused by methicillin-susceptible Staphylococcus aureus. Antimicrob. Agents Chemother. 2014, 58, 5117–5124. [Google Scholar] [CrossRef]
  6. McDanel, J.S.; Roghmann, M.C.; Perencevich, E.N.; Ohl, M.E.; Goto, M.; Livorsi, D.J.; Jones, M.; Albertson, J.P.; Nair, R.; O’Shea, A.M.J.; et al. Comparative Effectiveness of Cefazolin Versus Nafcillin or Oxacillin for Treatment of Methicillin-Susceptible Staphylococcus aureus Infections Complicated by Bacteremia: A Nationwide Cohort Study. Clin. Infect. Dis. 2017, 65, 100–106. [Google Scholar] [CrossRef] [PubMed]
  7. Loubet, P.; Burdet, C.; Vindrios, W.; Grall, N.; Wolff, M.; Yazdanpanah, Y.; Andremont, A.; Duval, X.; Lescure, F.X. Cefazolin versus anti-staphylococcal penicillins for treatment of methicillin-susceptible Staphylococcus aureus bacteraemia: A narrative review. Clin. Microbiol. Infect. 2018, 24, 125–132. [Google Scholar] [CrossRef] [PubMed]
  8. Shi, C.; Xiao, Y.; Zhang, Q.; Li, Q.; Wang, F.; Wu, J.; Lin, N. Efficacy and safety of cefazolin versus antistaphylococcal penicillins for the treatment of methicillin-susceptible Staphylococcus aureus bacteremia: A systematic review and meta-analysis. BMC Infect. Dis. 2018, 18, 508. [Google Scholar] [CrossRef] [PubMed]
  9. Weis, S.; Kesselmeier, M.; Davis, J.S.; Morris, A.M.; Lee, S.; Scherag, A.; Hagel, S.; Pletz, M.W. Cefazolin versus anti-staphylococcal penicillins for the treatment of patients with Staphylococcus aureus bacteraemia. Clin. Microbiol. Infect. 2019, 25, 818–827. [Google Scholar] [CrossRef]
  10. Thys, J.P.; Vanderkelen, B.; Klastersky, J. Pharmacological study of cefazolin during intermittent and continuous infusion: A crossover investigation in humans. Antimicrob. Agents Chemother. 1976, 10, 395–398. [Google Scholar] [CrossRef]
  11. Grégoire, M.; Gaborit, B.; Deschanvres, C.; Lecomte, R.; Deslandes, G.; Dailly, É.; Ambrosi, X.; Bellouard, R.; Asseray, N.; Lakhal, K.; et al. High-Dosage Cefazolin Achieves Sufficient Cerebrospinal Diffusion to Treat an External Ventricular Drainage-Related Staphylococcus aureus Ventriculitis. Antimicrob. Agents Chemother. 2019, 63, e01844-18. [Google Scholar]
  12. Le Turnier, P.; Gregoire, M.; Deslandes, G.; Lakhal, K.; Deschanvres, C.; Lecomte, R.; Talarmin, J.P.; Dubée, V.; Bellouard, R.; Boutoille, D.; et al. NAMAP study group. Should we reconsider cefazolin for treating staphylococcal meningitis? A retrospective analysis of cefazolin and cloxacillin cerebrospinal fluid levels in patients treated for staphylococcal meningitis. Clin. Microbiol. Infect. 2020, 26, 1415.e1–1415.e4. [Google Scholar]
  13. Novak, A.R.; Krsak, M.; Kiser, T.H.; Neumann, R.T.; Cava Prado, L.; Molina, K.C.; Mueller, S.W. Pharmacokinetic Evaluation of Cefazolin in the Cerebrospinal Fluid of Critically Ill Patients. Open Forum Infect. Dis. 2021, 9, ofab649. [Google Scholar] [CrossRef] [PubMed]
  14. Antosz, K.; Battle, S.; Chang, J.; Scheetz, M.H.; Al-Hasan, M.; Bookstaver, P.B. Cefazolin in the treatment of central nervous system infections: A narrative review and recommendation. Pharmacotherapy 2023, 43, 85–95. [Google Scholar]
  15. Onita, T.; Ishihara, N.; Yano, T. PK/PD-Guided Strategies for Appropriate Antibiotic Use in the Era of Antimicrobial Resistance. Antibiotics 2025, 14, 92. [Google Scholar]
  16. Craig, W.A. Pharmacokinetic/pharmacodynamic parameters: Rationale for antibacterial dosing of mice and men. Clin. Infect. Dis. 1998, 26, 1–10. [Google Scholar] [CrossRef]
  17. Craig, W.A. Does the dose matter? Clin. Infect. Dis. 2001, 33, S233–S237. [Google Scholar] [CrossRef]
  18. Ikuno, H.; Nin, K.; Nishimura, S. Penetration of cefazolin into cerebrospinal fluid and brain tissue. Med. Consult. New Remedies 1977, 14, 457–464. [Google Scholar]
  19. Pitcock, C.; Burgess, D.S.; Olney, K.B. Optimizing cefazolin dosing for central nervous system infections: Insights from population pharmacokinetics and Monte Carlo simulations. Antimicrob. Agents Chemother. 2025, 69, e0185724. [Google Scholar] [CrossRef] [PubMed]
  20. Bechtel, T.P.; Slaughter, R.L.; Moore, T.D. Seizures associated with high cerebrospinal fluid concentrations of cefazolin. Am. J. Hosp. Pharm. 1980, 37, 271–273. [Google Scholar] [PubMed]
  21. Ohata, Y.; Tomita, Y.; Sunakawa, K.; Drusano, G.L.; Tanigawara, Y. Cerebrospinal pharmacokinetic and pharmacodynamic analysis of efficacy of meropenem in paediatric patients with bacterial meningitis. Int. J. Antimicrob. Agents 2019, 54, 292–300. [Google Scholar] [CrossRef]
  22. Onita, T.; Ikawa, K.; Nakamura, K.; Nishikawa, G.; Kobayashi, I.; Ishihara, N.; Tamaki, H.; Yano, T.; Naora, K.; Morikawa, N. Prostatic Pharmacokinetic/Pharmacodynamic Evaluation of Ampicillin-Sulbactam for Bacterial Prostatitis and Preoperative Prophylaxis. J. Clin. Pharmacol. 2021, 61, 820–831. [Google Scholar] [CrossRef]
  23. Onita, T.; Ikawa, K.; Ishihara, N.; Tamaki, H.; Yano, T.; Naora, K.; Morikawa, N. Pulmonary Pharmacokinetic and Pharmacodynamic Evaluation of Ampicillin/Sulbactam Regimens for Pneumonia Caused by Various Bacteria, including Acinetobacter baumannii. Antibiotics 2023, 12, 303. [Google Scholar] [CrossRef] [PubMed]
  24. Onita, T.; Nakamura, K.; Nishikawa, G.; Ishihara, N.; Tamaki, H.; Yano, T.; Naora, K.; Morikawa, N.; Ikawa, K. Prostatic Pharmacokinetic and Pharmacodynamic Analysis of Ceftazidime: Dosing Strategy for Bacterial Prostatitis. J. Clin. Pharmacol. 2025, 65, 121–131. [Google Scholar] [CrossRef] [PubMed]
  25. Lanoiselée, J.; Chaux, R.; Hodin, S.; Bourayou, S.; Gibert, A.; Philippot, R.; Molliex, S.; Zufferey, P.J.; Delavenne, X.; Ollier, E. Population pharmacokinetic model of cefazolin in total hip arthroplasty. Sci. Rep. 2021, 11, 19763. [Google Scholar] [CrossRef]
  26. Cutler, R.W.P.; Page, L.; Galicich, J.; Watters, G.V. Formation and absorption of cerebrospinal fluid in man. Brain 1968, 91, 707–720. [Google Scholar] [CrossRef]
  27. Chan Kwong, A.H.P.; Calvier, E.A.M.; Fabre, D.; Gattacceca, F.; Khier, S. Prior information for population pharmacokinetic and pharmacokinetic/pharmacodynamic analysis: Overview and guidance with a focus on the NONMEM PRIOR subroutine. J. Pharmacokinet. Pharmacodyn. 2020, 47, 431–446. [Google Scholar] [CrossRef]
  28. Marshall, S.; Macintyre, F.; James, I.; Krams, M.; Jonsson, N.E. Role of mechanistically-based pharmacokinetic/pharmacodynamic models in drug development: A case study of a therapeutic protein. Clin. Pharmacokinet. 2006, 45, 177–197. [Google Scholar]
  29. Lindbom, L.; Ribbing, J.; Jonsson, E.N. Perl-speaks-NONMEM (PsN)—A Perl module for NONMEM related programming. Comput. Methods Programs Biomed. 2004, 75, 85–94. [Google Scholar] [PubMed]
  30. Four Academic Societies Joint Antimicrobial Susceptibility Surveillance Program. Available online: https://www.3ssp.jp/database/surgical/mic-5090/ (accessed on 12 February 2025).
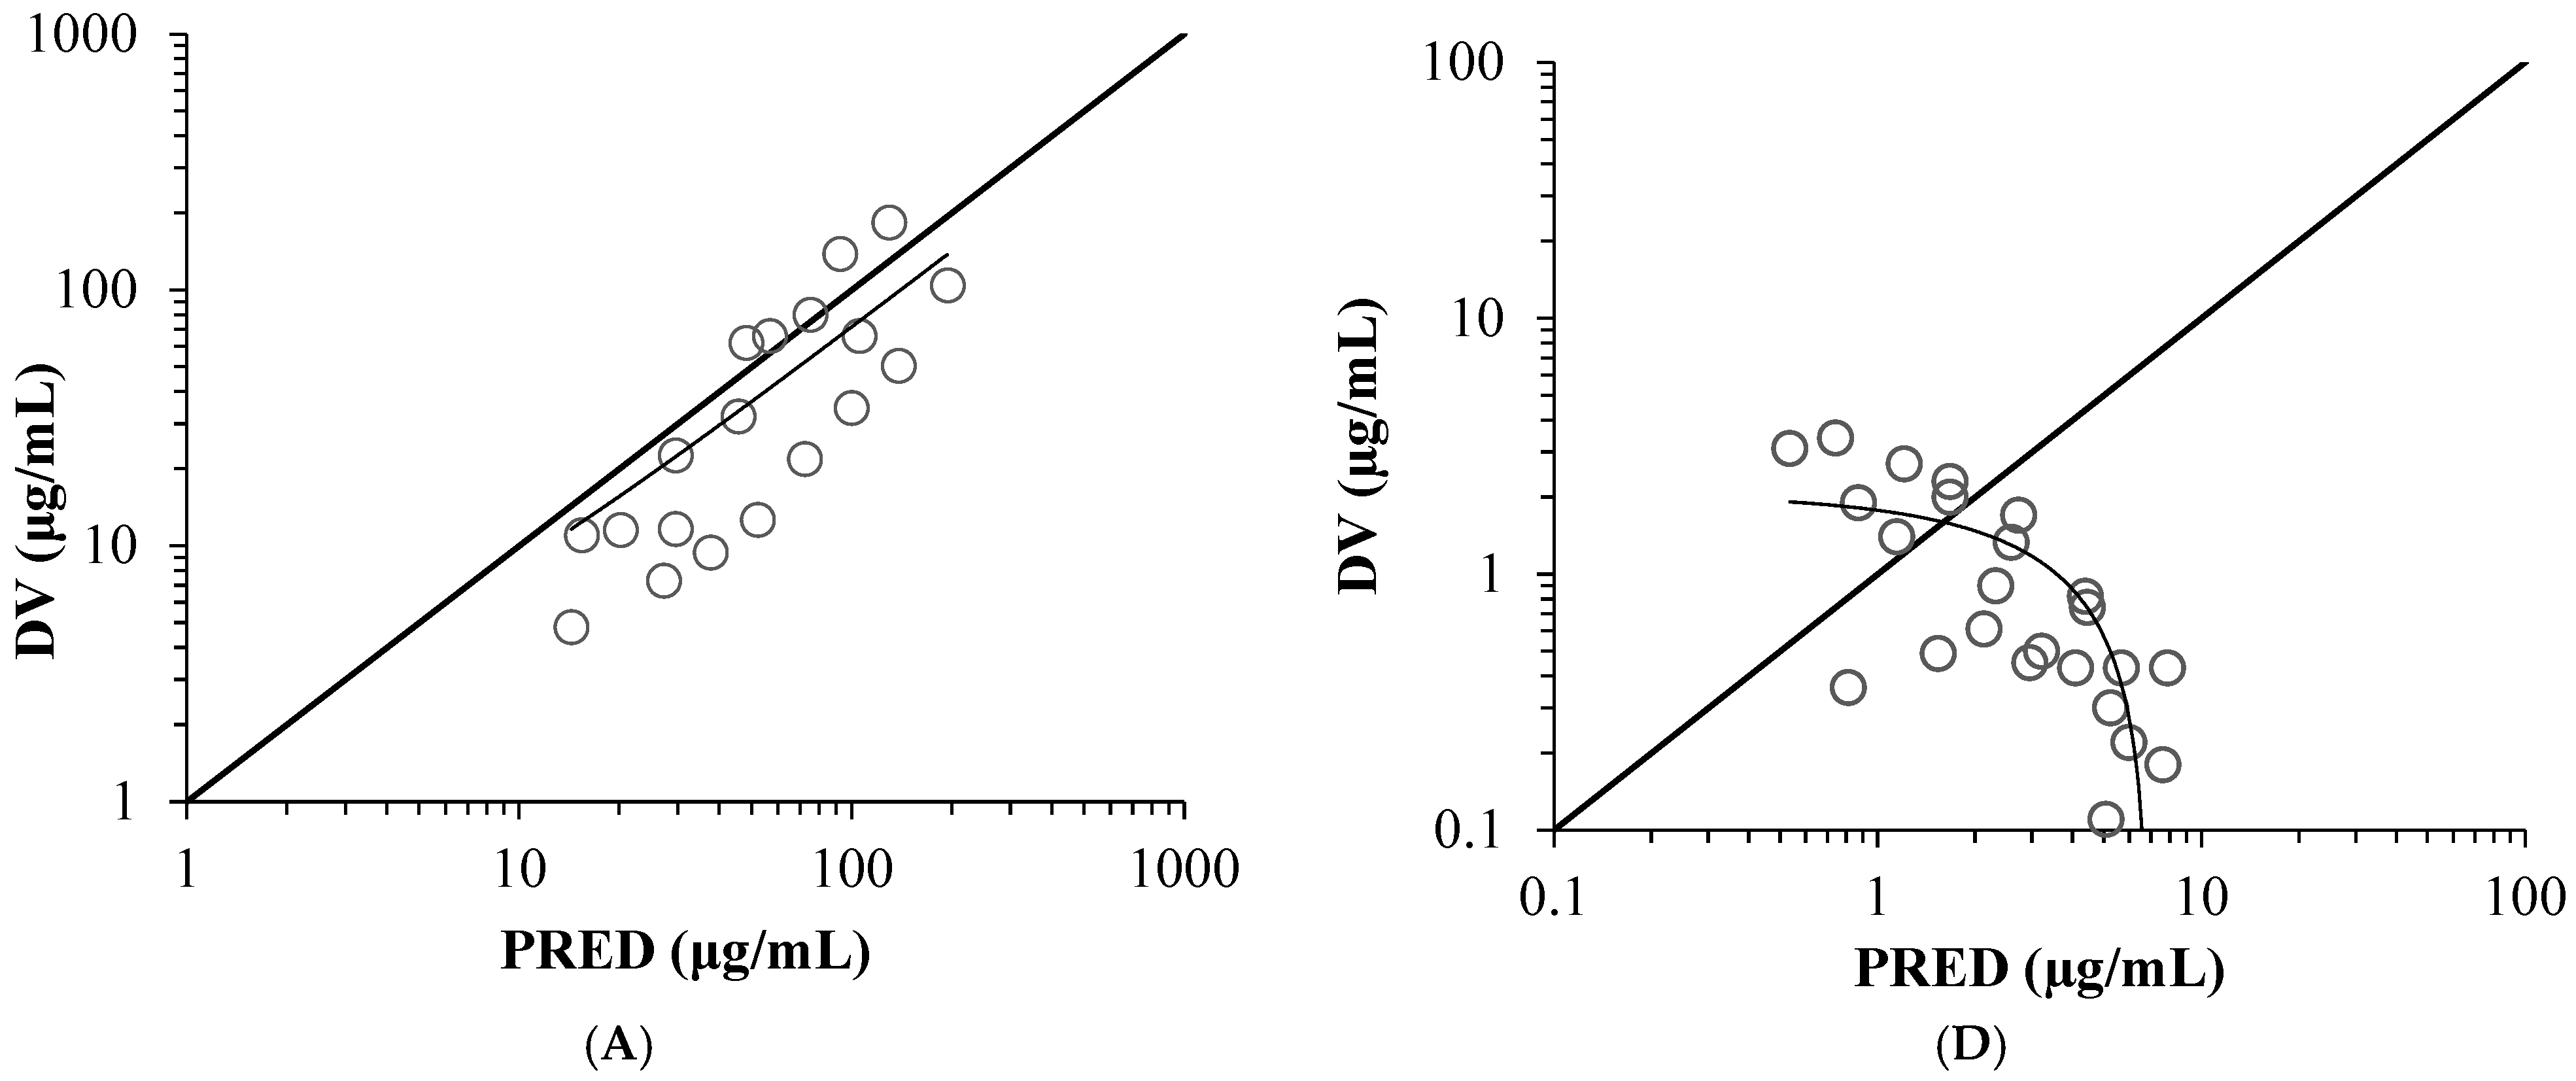
Figure 1. Scatter plots of the final population PK model of cefazolin. Observed values (DV) versus population-predicted values (PRED) (A) or individual-predicted values (IPRED) (B) in plasma, conditional weighted residual (CWRES) versus population-predicted values in plasma (C), observed concentrations versus population-predicted values (PRED) (D) or individual-predicted values (IPRED) (E) in cerebrospinal fluid, and CWRES versus population-predicted values in cerebrospinal fluid (F).
Antibiotics 14 01008 g001aAntibiotics 14 01008 g001b
Figure 2. Dose-normalized visual predictive check plots representing observed plasma and cerebrospinal fluid (CSF) concentrations (open circles) normalized to 2 g of cefazolin. For each graph, the dotted line represents the predicted 95% confidence interval (from 2.5th to 97.5th percentiles) and the solid line represents the 50th percentile.
Antibiotics 14 01008 g002
Figure 3. Probabilities of attaining pharmacokinetic/pharmacodynamic target (100% T > MIC) in cerebrospinal fluid for cefazolin at specific MICs using twice-daily (b.i.d.), three-times-daily (t.i.d.), four-times-daily (q.i.d.) regimens and continuous infusions. The dotted lines represent 90% probability. CLcr; Creatinine clearance, T > MIC; time above minimum inhibitory concentration.
Antibiotics 14 01008 g003aAntibiotics 14 01008 g003b
Figure 4. Cerebrospinal pharmacokinetic model of cefazolin Xc, Xp and XCSF are the amount of cefazolin (mg) in the central, peripheral and cerebrospinal fluid (CSF) compartments; Rinf, the drug infusion rate (mg/h); CL, clearances (L/h); Vcentral, Vpheripheral and VCSF, distribution volumes of the central, peripheral and cerebrospinal fluid compartments (L); Q, central–peripheral intercompartmental clearance (L/h); QCSF, CSF flow (L/h); KPCSF, CSF to plasma partition coefficient.
Antibiotics 14 01008 g004
Table 1. Pharmacokinetic/pharmacodynamic breakpoints (100% T > MIC) of cefazolin in cerebrospinal fluid.
Cefazolin RegimenPK/PD Breakpoint (100% T > MIC)
CLcr = 90 mL/min
2 g q.i.d. 0.5 h infusion (8 g/day)0.25
2 g t.i.d. 4 h infusion (6 g/day)0.25
2 g q.i.d. 4 h infusion (8 g/day)0.5
6 g continuous infusion (6 g/day)0.5
8 g continuous infusion (8 g/day)1
10 g continuous infusion (10 g/day)1
12 g continuous infusion (12 g/day)1
CLcr = 60 mL/min
2 g t.i.d. 0.5 h infusion (6 g/day)0.25
2 g q.i.d. 0.5 h infusion (8 g/day)0.5
2 g t.i.d. 4 h infusion (6 g/day)0.5
2 g q.i.d. 4 h infusion (8 g/day)1
6 g continuous infusion (6 g/day)1
8 g continuous infusion (8 g/day)1
10 g continuous infusion (10 g/day)2
CLcr = 30 mL/min
2 g b.i.d. 0.5 h infusion (4 g/day)0.25
2 g t.i.d. 0.5 h infusion (6 g/day)1
2 g b.i.d. 4 h infusion (4 g/day)0.5
2 g t.i.d. 4 h infusion (6 g/day)2
4 g continuous infusion (4 g/day)1
6 g continuous infusion (6 g/day)2
8 g continuous infusion (8 g/day)2
Pharmacokinetic/pharmacodynamic breakpoints are defined as the largest MIC attaining more than 90% probability. CLcr; Creatinine clearance, T > MIC; time above minimum inhibitory concentration.
Table 2. Population pharmacokinetic parameters.
Estimate(RSE %)95%CI
Fix effects parameter
CL(L/h) a = θCL × (CLcr/80)θCLcr on CL
θCL(L/h)2.86 Fixed--
θCLcr on CL0.79 Fixed--
Vcentral (L) a = θVc5.2 Fixed--
Q (L/h) a = θQ10.9 Fixed--
Vperipheral (L) a = θVp4.56 Fixed--
KPCSF b = θKPCSF0.0525 Fixed--
QCSF (L/h) c = θQCSF0.021 Fixed--
VCSF (L) c = θVCSF0.092 Fixed--
Interindividual variability (exponential error model)
ηCL a0.102 Fixed--
ηVcentral a0.325 Fixed--
ηQ a0.437 Fixed--
ηVperipheral a0.01 Fixed--
ηKPCSF1.39(203.0)0.0188–43.6
ηQCSF c1.22(0.75)0.00245–172.7
ηVCSF c1.22(0.38)0.00443–178.4
Residual variability (proportion error model)
εproportional a0.0144 Fixed--
a, parameters derived from [25]; b, parameter derived from CSF/serum ratio estimated from literature data [18]; c, parameter derived from [26] CI, confidence interval determined from sampling importance resampling algorithm (sampling: n = 1000 and resampling n = 1000); RSE, relative standard error; θ, population mean value; η, random variable which is normally distributed with a mean of zero and variance; ε, random error which is normally distributed with a mean of zero and variance; Vc and Vp, distribution volumes of the central and peripheral compartments (L); VCSF, CSF volume (L); Q, central-peripheral intercompartmental clearances (L/h); QCSF, CSF flow (L/h); KPCSF, CSF-to-plasma partition coefficient.
Disclaimer/Publisher’s Note: The statements, opinions and data contained in all publications are solely those of the individual author(s) and contributor(s) and not of MDPI and/or the editor(s). MDPI and/or the editor(s) disclaim responsibility for any injury to people or property resulting from any ideas, methods, instructions or products referred to in the content.