


Chemometric Methods—A Valuable Tool for Investigating the Interactions Between Antifungal Drugs (Including Antifungal Antibiotics) and Food


Abstract
1. Introduction
2. Results
2.1. Drugs Under Analysis
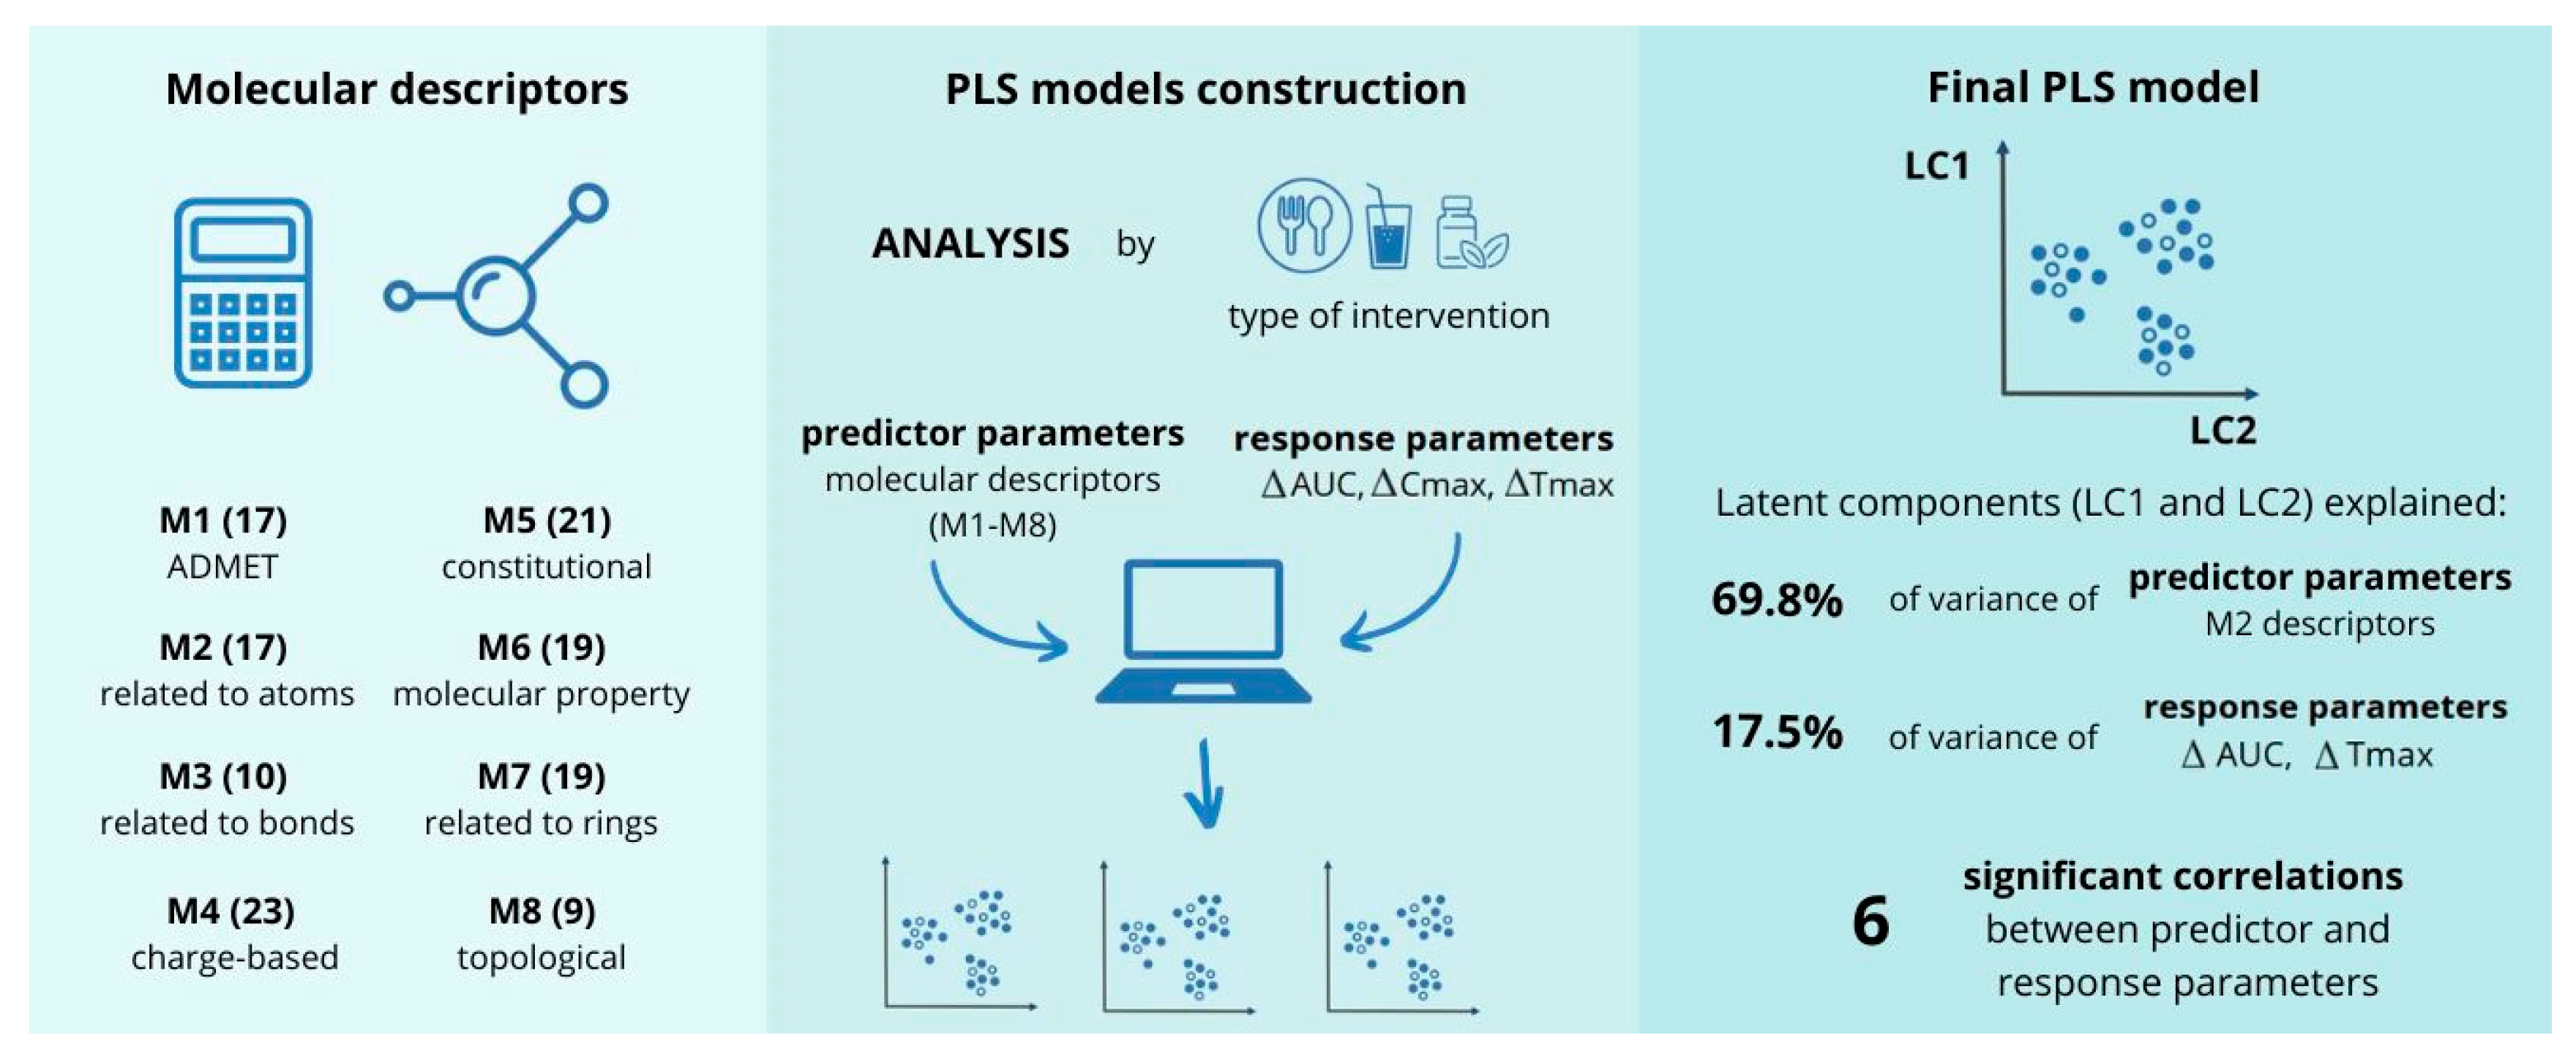
2.2. Molecular Descriptors Included in the Analysis
2.3. Analysis Involving Food
2.4. Analyses Involving Antacids/Supplements and Beverages
3. Discussion
3.1. Benefits from the Use of Chemometric Methods
3.2. Interpretation of Correlations
3.3. Limitations of This Study
3.3.1. Quality and Heterogeneity of Input Data
3.3.2. Chemometric Analysis
4. Materials and Methods
4.1. Data Collection and Preparation
4.1.1. Drugs Selected for the Analysis
- Azoles (8)—albaconazole, fluconazole, isavuconazole, itraconazole, ketoconazole, oteseconazole, posaconazole, and voriconazole;
- Antifungal antibiotics (4)—amphotericin B, griseofulvin, hachimycin (trichomycin), and nystatin;
- Antifungal antimetabolites (1)—flucytosine;
- Squalene epoxidase inhibitors (1)—terbinafine;
- Glucan synthase inhibitors (1)—ibrexafungerp.
4.1.2. Data from Clinical Trials
4.1.3. Data from Chemical Records
4.1.4. Molecular Descriptors
- M1: ADMET descriptors: address pharmacokinetic properties such as absorption, distribution, metabolism (e.g., CYP enzymes, glycoprotein P, or OATP substrates and inhibitors), excretion, and toxicity;
- M2: descriptors related to atoms: represent the number of specific types of atoms in a drug molecule;
- M3: descriptors related to bonds: indicate the number and types of bonds within a drug molecule;
- M4: charge-based descriptors: capture the distribution of molecular charges;
- M5: constitutional descriptors: reflect the fundamental chemical composition and various aspects of molecular size;
- M6: molecular property descriptors: relate to the basic physicochemical properties of the drug molecule;
- M7: descriptors related to rings: count and classify different types of rings in the molecular structure;
- M8: topological descriptors: describe the molecular shape, branching patterns, and internal atomic arrangement.
4.2. Chemometric Analysis
5. Conclusions
Supplementary Materials
Author Contributions
Funding
Institutional Review Board Statement
Informed Consent Statement
Data Availability Statement
Conflicts of Interest
Appendix A

| M1—ADMET Descriptors (17) | ||
|---|---|---|
| Molecular Descriptor Name | Explanation | Software |
| CYP1A2(inh) | Probability of being CYP inhibitor | admetlab2.0 |
| CYP1A2(s) | Probability of being CYP substrate | admetlab2.0 |
| CYP2C19(inh) | Probability of being CYP inhibitor | admetlab2.0 |
| CYP2C19(s) | Probability of being CYP substrate | admetlab2.0 |
| CYP2C9(inh) | Probability of being CYP inhibitor | admetlab2.0 |
| CYP2C9(s) | Probability of being CYP substrate | admetlab2.0 |
| CYP2D6(inh) | Probability of being CYP inhibitor | admetlab2.0 |
| CYP2D6(s) | Probability of being CYP substrate | admetlab2.0 |
| CYP3A4(inh) | Probability of being CYP inhibitor | admetlab2.0 |
| CYP3A4(s) | Probability of being CYP substrate | admetlab2.0 |
| Abs | Predicted qualitative human oral absorption: 1, 2, or 3 for low, medium, or high | Qikprop (Schrodinger 2024-4) |
| OATP1B1(inh) | Probability of being OATP1B1 inhibitor | admetsar2 |
| OATP1B3(inh) | Probability of being OATP1B3 inhibitor | admetsar2 |
| OATP2B1(inh) | Probability of being OATP2B1 inhibitor | admetsar2 |
| %Abs | Predicted human oral absorption on 0 to 100% scale | Qikprop (Schrodinger 2024-4) |
| Pgp(inh) | Probability of being Pgp-inhibitor | admetlab2.0 |
| Pgp(s) | Probability of being Pgp-substrate | admetlab2.0 |
| M2—descriptors related to atoms (17) | ||
| nAromAt | Number of aromatic atoms | PaDEL-Descriptor v2.21 |
| nAt | Number of atoms | PaDEL-Descriptor v2.21 |
| nAtLAC | Number of atoms in the longest aliphatic chain | PaDEL-Descriptor v2.21 |
| nAtLC | Number of atoms in the largest chain | PaDEL-Descriptor v2.21 |
| nAtPi | Number of atoms in the largest pi system | PaDEL-Descriptor v2.21 |
| nC | Number of carbon atoms | PaDEL-Descriptor v2.21 |
| nCl | Number of chlorine atoms | PaDEL-Descriptor v2.21 |
| nF | Number of fluorine atoms | PaDEL-Descriptor v2.21 |
| nH | Number of hydrogen atoms | PaDEL-Descriptor v2.21 |
| nHBA | Number of hydrogen bond acceptors (using Lipinski’s definition: any nitrogen; any oxygen) | rdkit.Chem.Descriptors |
| nHBD | Number of hydrogen bond donors (using Lipinski’s definition: Any OH or NH. Each available hydrogen atom is counted as one hydrogen bond donor) | rdkit.Chem.Descriptors |
| nHeavyAt | Number of heavy atoms (i.e., not hydrogen) | PaDEL-Descriptor v2.21 |
| nN | Number of nitrogen atoms | PaDEL-Descriptor v2.21 |
| nO | Number of oxygen atoms | PaDEL-Descriptor v2.21 |
| nNOCount | Number of nitrogen and oxygen atoms | rdkit.Chem.Descriptors |
| nX | Number of halogen atoms (F, Cl, Br, I, At, and Uus) | PaDEL-Descriptor v2.21 |
| nHetero | Number of heteroatoms | rdkit.Chem.Descriptors |
| M3—descriptors related to bonds (10) | ||
| nAromBond | Number of aromatic bonds | PaDEL-Descriptor v2.21 |
| nBonds | Number of bonds (excluding bonds with hydrogen) | PaDEL-Descriptor v2.21 |
| nBonds2 | Total number of bonds (including bonds to hydrogens) | PaDEL-Descriptor v2.21 |
| nBondD | Number of double bonds | PaDEL-Descriptor v2.21 |
| nBondM | Total number of bonds that have bond order greater than one (aromatic bonds have bond order 1.5) | PaDEL-Descriptor v2.21 |
| BondS | Number of single bonds (including bonds with hydrogen) | PaDEL-Descriptor v2.21 |
| nRotBond | Number of rotatable bonds, excluding terminal bonds | PaDEL-Descriptor v2.21 |
| nRotBondT | Number of rotatable bonds, including terminal bonds | PaDEL-Descriptor v2.21 |
| RotBondFrac | Fraction of rotatable bonds, excluding terminal bonds | PaDEL-Descriptor v2.21 |
| RotBondTFrac | Fraction of rotatable bonds, including terminal bonds | PaDEL-Descriptor v2.21 |
| M4—charge-based descriptors (23) | ||
| Mac | Mean of absolute charges | chemopy1.0 |
| Mnc | Mean of negative charges | chemopy1.0 |
| Mpc | Mean of positive charges | chemopy1.0 |
| Qass | Sum of squares of charges on all atoms | chemopy1.0 |
| QCmax | Most positive charge on C atom | chemopy1.0 |
| QCmin | Most negative charge on C atom | chemopy1.0 |
| QCss | Sum of squares of charges on C atom | chemopy1.0 |
| QHmax | Most positive charge on H atom | chemopy1.0 |
| QHmin | Most negative charge on H atom | chemopy1.0 |
| QHss | Sum of squares of charges on H atom | chemopy1.0 |
| Qmax | Most positive charge in a molecule | chemopy1.0 |
| Qmin | Most negative charge in a molecule | chemopy1.0 |
| QNmax | Most positive charge on N atom | chemopy1.0 |
| QNmin | Most negative charge on N atom | chemopy1.0 |
| QNss | Sum of squares of charges on N atom | chemopy1.0 |
| Qomax | Most positive charge on O atom | chemopy1.0 |
| Qomin | Most negative charge on O atom | chemopy1.0 |
| QOss | Sum of squares of charges on O atom | chemopy1.0 |
| Rnc | Relative negative charge | chemopy1.0 |
| Rpc | Relative positive charge | chemopy1.0 |
| Tac | Total of absolute charges | chemopy1.0 |
| Tnc | Total of negative charges | chemopy1.0 |
| Tpc | Total of positive charges | chemopy1.0 |
| M5—constitutional descriptors (21) | ||
| fr_aniline | Number of anilines | rdkit.Chem.Descriptors |
| fr_Ar_N | Number of aromaticnitrogens | rdkit.Chem.Descriptors |
| fr_benzene | Number of benzene rings | rdkit.Chem.Descriptors |
| fr_bicyclic | Bicyclic | rdkit.Chem.Descriptors |
| fr_C_O | Number of carbonyl O | rdkit.Chem.Descriptors |
| fr_ether | Number of ether oxygens (including phenoxy) | rdkit.Chem.Descriptors |
| fr_halogen | Number of halogens | rdkit.Chem.Descriptors |
| fr_NH0 | Number of Tertiary amines | rdkit.Chem.Descriptors |
| FractionCSP3 | Fraction of C atoms that are sp3-hybridized | rdkit.Chem.Descriptors |
| HybRatio | Fraction of sp3 carbons to sp2 carbons | PaDEL-Descriptor v2.21 |
| Mp | Mean atomic polarizabilities (scaled on carbon atom) | PaDEL-Descriptor v2.21 |
| Mpe | Mean atomic Pauling electronegativities (scaled on carbon atom) | PaDEL-Descriptor v2.21 |
| Mv | Mean atomic van der Waals volumes (scaled on carbon atom) | PaDEL-Descriptor v2.21 |
| NHOHCount | Number of NHs or OHs | rdkit.Chem.Descriptors |
| nAliphCarbocycles | Number of aliphatic (containing at least one non-aromatic bond) carbocycles | rdkit.Chem.Descriptors |
| nAliphHeterocycles | Number of aliphatic (containing at least one non-aromatic bond) heterocycles | rdkit.Chem.Descriptors |
| nAromCarbocycles | Number of aromatic carbocycles | rdkit.Chem.Descriptors |
| nAromHeterocycles | Number of aromatic heterocycles | rdkit.Chem.Descriptors |
| nSatHeterocycles | Number of saturated heterocycles | rdkit.Chem.Descriptors |
| Spe | Sum of atomic Pauling electronegativities (scaled on carbon atom) | PaDEL-Descriptor v2.21 |
| Sv | Sum of atomic van der Waals volumes (scaled on carbon atom) | PaDEL-Descriptor v2.21 |
| M6—molecular property descriptors (19) | ||
| AtinRings | Number of atoms in rings | Qikprop (Schrodinger 2024-4) |
| AMW | Average molecular weight (Molecular weight/Total number of atoms) | PaDEL-Descriptor v2.21 |
| AtPolariz | Sum of the atomic polarizabilities (including implicit hydrogens) | PaDEL-Descriptor v2.21 |
| Hy | Hydrophilic index | chemopy1.0 |
| LogS | Logarithm of aqueous solubility value | admetlab2.0 |
| LogP | Logarithm of partition coefficient | Marvin 20.19 |
| ProtBind | % of protein binding | literature data |
| MaxRing | Number of atoms in the biggest ring | admetlab2.0 |
| MolReact | Molar refractivity | chemopy1.0 |
| MW | Molecular weight | PaDEL-Descriptor v2.21 |
| nAcid | Number of acidic groups | PaDEL-Descriptor v2.21 |
| nBase | Number of basic groups | PaDEL-Descriptor v2.21 |
| nRigBonds | Number of rigid bonds | admetlab2.0 |
| nStereo | Stereo centers | admetlab2.0 |
| RuleOfFive | Number of violations of Lipinski’s rule of five | Quikprop (Schrodinger 2024-4) |
| RuleOfThree | Number of violations of Jorgensen’s rule of three | Quikprop (Schrodinger 2024-4) |
| pKa | Negative base-10 logarithm of acid dissociation constant | admetsar2.0 |
| Polariz | Predicted polarizability in cubic angstroms | Qikprop (Schrodinger 2024-4) |
| UnsatI | Unsaturation index | chemopy1.0 |
| M7—descriptors related to rings (19) | ||
| n5HeteroRing | Number of 5-membered rings containing heteroatoms (N, O, P, S, or halogens) | PaDEL-Descriptor v2.21 |
| n5Ring | Number of 5-membered rings | PaDEL-Descriptor v2.21 |
| n6HeteroRing | Number of 6-membered rings containing heteroatoms (N, O, P, S, or halogens) | PaDEL-Descriptor v2.21 |
| n6Ring | Number of 6-membered rings | PaDEL-Descriptor v2.21 |
| nF10Ring | Number of 10-membered fused rings | PaDEL-Descriptor v2.21 |
| nFG12HeteroRing | Number of >12-membered fused rings containing heteroatoms (N, O, P, S, or halogens) | PaDEL-Descriptor v2.21 |
| nFG12Ring | Number of >12-membered fused rings | PaDEL-Descriptor v2.21 |
| nFRing | Number of fused rings | PaDEL-Descriptor v2.21 |
| nHeteroRing | Number of rings containing heteroatoms (N, O, P, S, or halogens) | PaDEL-Descriptor v2.21 |
| nRing | Number of rings | PaDEL-Descriptor v2.21 |
| nT10Ring | Number of 10-membered rings (includes counts from fused rings) | PaDEL-Descriptor v2.21 |
| nT5HeteroRing | Number of 5-membered rings (includes counts from fused rings) containing heteroatoms (N, O, P, S, or halogens) | PaDEL-Descriptor v2.21 |
| nT5Ring | Number of 5-membered rings (includes counts from fused rings) | PaDEL-Descriptor v2.21 |
| nT6HeteroRing | Number of 6-membered rings (includes counts from fused rings) containing heteroatoms (N, O, P, S, or halogens) | PaDEL-Descriptor v2.21 |
| nT6Ring | Number of 6-membered rings (includes counts from fused rings) | PaDEL-Descriptor v2.21 |
| nTRing | Number of rings (includes counts from fused rings) | PaDEL-Descriptor v2.21 |
| nAliphRing | Number of aliphatic (containing at least one non-aromatic bond) rings | rdkit.Chem.Descriptors |
| nAromRing | Number of aromatic rings | rdkit.Chem.Descriptors |
| nSatRing | Number of saturated rings | rdkit.Chem.Descriptors |
| M8—topological descriptors (9) | ||
| Arto | Arithmetic topological index by Narumi | chemopy1.0 |
| diametert | Largest value in the distance matrix | chemopy1.0 |
| radiust | Radius based on topology | chemopy1.0 |
| TPSA | Topological polar surface area. Sum of tabulated surface contributions of polar fragments | admetlab2.0 |
| VABC | Van der Waals volume calculated using the method proposed in [Zhao, Yuan H. and Abraham, Michael H. and Zissimos, Andreas M., Fast Calculation of van der Waals Volume as a Sum of Atomic and Bond Contributions and Its Application to Drug Compounds, The Journal of Organic Chemistry, 2003, 68:7368−7373] | PaDEL-Descriptor v2.21 |
| WPATH | Weiner path number | PaDEL-Descriptor v2.21 |
| WPOL | Weiner polarity number | PaDEL-Descriptor v2.21 |
| ZM1 | Zagreb index with order 1–2 | chemopy1.0 |
| ZM2 | Zagreb index with order 1–2 | chemopy1.0 |
| Study ID | Reference | Investigated Drugs | Source | Number of Participants | Study Design | Risk of Bias | Gender Specified? | Race Specified? | Meal Type Specified? | Qualitative Composition Specified? | Quantitative Composition Specified? |
|---|---|---|---|---|---|---|---|---|---|---|---|
| Chen 2023 | [46] | fluconazole | Article | 36 | non-randomized, open-label, parallel | moderate | yes, males and females | yes | yes | no | yes |
| Li 2020 | [47] | fluconazole | Article | 52 | non-randomized, open-label, parallel | high | yes, males and females | yes | yes | no | yes |
| Zimmermann 1994 | [48] | fluconazole, itraconazole | Article | 12 | randomized, open-label, cross-over | moderate | yes, males and females | no | yes | yes | yes |
| Ahmed 2008 | [49] | griseofulvin | Article | 9 | non-randomized, open-label, longitudinal | high | yes, all males | no | yes | yes | yes |
| Aoyagi 1982 | [50] | griseofulvin | Article | 4 | non-randomized, open-label, cross-over | high | yes, all males | no | yes | yes | no |
| None | [51] | ibrexafungerp | SmPC * | NS ** | NS | NA # | no | no | yes | no | yes |
| Schmitt-Hoffmann 2016 | [52] | isavuconazole | Article | 26 | randomized, open-label, cross-over | low | yes, all males | no | yes | no | yes |
| 10850703 study | [53] | itraconazole | Unpublished study | 36 | randomized, open-label, cross-over | NA | no | no | no | no | no |
| Barone 1993 | [54] | itraconazole | Article | 27 | randomized, open-label, cross-over | moderate | yes, all males | no | yes | yes | no |
| Barone 1998 | [55] | itraconazole | Article | 27 | randomized, open-label, cross-over | moderate | yes, all males | yes | yes | yes | no |
| HGN007 | [56] | itraconazole | Unpublished study | NS | non-randomized, open-label, cross-over | high | no | no | yes | no | no |
| Kapsi 2001 | [57] | itraconazole | Article | 12 | non-randomized, open-label, otherwise not specified | NA | no | no | no | no | no |
| Lindsay 2018 | [58] | itraconazole | Article | 20 | randomized, open-label, cross-over | moderate | no | no | yes | no | no |
| MPG017 | [59] | itraconazole | Unpublished study | 24 | randomized, open-label, cross-over | moderate | yes, males and females | no | yes | yes | yes |
| None | [60] | itraconazole | SmPC | 18 | randomized, open-label, cross-over | NA | yes, males and females | no | yes | yes | yes |
| Oguma 2009 | [61] | itraconazole | Article | 10 | non-randomized, open-label, longitudinal | high | yes, all males | yes | yes | yes | no |
| Rauseo 2021 | [62] | itraconazole | Article | 52 | randomized, open-label, cross-over | moderate | yes, males and females | yes, AA † included | yes | no | yes |
| Tei 2006 | [63] | itraconazole | Article | 8 | non-randomized, single-blinded, cross-over | high | yes, all males | yes | no | no | no |
| VandeVelde 2016 | [64] | itraconazole | Article | 12 | randomized, open-label, cross-over | moderate | yes, males and females | no | yes | yes | no |
| VanPeer 1989 | [65] | itraconazole | Article | 6 | randomized, open-label, cross-over | moderate | yes, all males | no | yes | yes | no |
| Woo 2008 | [66] | itraconazole | Article | 8 | randomized, open-label, longitudinal | high | yes, all males | yes | yes | yes | yes |
| Yun 2006-1 | [67] | itraconazole | Article | 40 | randomized, open-label, parallel | moderate | yes, all males | yes | yes | yes | no |
| Yun 2006-2 | [67] | itraconazole | Article | 80 | randomized, open-label, parallel | moderate | yes, all males | yes | yes | yes | no |
| Yun 2006-3 | [67] | itraconazole | Article | 24 | randomized, open-label, cross-over | moderate | yes, males and females | yes | yes | yes | no |
| Daneshmend 1984 | [68] | ketoconazole | Article | 8 | randomized, open-label, cross-over | moderate | yes, males and females | no | yes | yes | yes |
| Männistö 1982 | [69] | ketoconazole | Article | 10 | randomized, open-label, cross-over | moderate | yes, males and females | no | yes | no | yes |
| None | [70] | oteseconazole | SmPC | NS | NS | NA | no | no | yes | no | yes |
| Courtney 2003 | [30] | posaconazole | Article | 20 | randomized, open-label, cross-over | moderate | yes, all males | no | yes | no | yes |
| Courtney 2004 | [71] | posaconazole | Article | 12 | randomized, open-label, cross-over | moderate | yes, all males | yes, AA included | yes | yes | yes |
| Dayan 2023 | [72] | posaconazole | Article | 36 | randomized, open-label, cross-over | low | no | no | yes | yes | no |
| Dogterom 2014-1 | [73] | posaconazole | Conference abstract | NS | NS | NA | no | no | yes | no | no |
| Dogterom 2014-2 | [73] | posaconazole | Conference abstract | NS | NS | NA | no | no | yes | no | no |
| Hens 2016 | [74] | posaconazole | Article | 5 | non-randomized, open-label, cross-over | high | yes, males and females | no | yes | yes | no |
| Kersemaekers 2015 | [75] | posaconazole | Article | 18 | randomized, open-label, cross-over | high | yes, males and females | yes, AA included | yes | yes | yes |
| Krishna 2008 | [76] | posaconazole | Article | 12 | randomized, open-label, cross-over | moderate | yes, males and females | yes | yes | no | yes |
| Krishna 2012 | [77] | posaconazole | Article | 16 | non-randomized, open-label, longitudinal | low | yes, males and females | yes, AA included | yes | no | yes |
| Li 2019 | [78] | posaconazole | Article | 18 | randomized, open-label, cross-over | low | yes, males and females | yes | yes | yes | yes |
| Lin 2013 | [79] | posaconazole | Article | 16 | randomized, open-label, cross-over | high | yes, all males | yes | yes | no | yes |
| None | [80] | posaconazole | SmPC | 30 | NS | NA | no | no | yes | no | yes |
| Xu 2013 | [81] | posaconazole | Article | 12 | randomized, open-label, cross-over | moderate | no | yes | yes | yes | yes |
| Nedelman 1997 | [82] | terbinafine | Article | 30 | randomized, open-label, cross-over | moderate | yes, all males | yes, AA included | no | no | no |
| None | [83] | voriconazole | SmPC | NS | NS | NA | no | no | yes | no | no |
| Purkins 2003 | [84] | voriconazole | Article | 12 | randomized, open-label, cross-over | moderate | yes, all males | no | yes | no | yes |
References
- EClinicalMedicine. Antimicrobial resistance: A top ten global public health threat. eClinicalMedicine 2021, 41, 101221. [Google Scholar] [CrossRef] [PubMed]
- Fisher, M.C.; Hawkins, N.J.; Sanglard, D.; Gurr, S.J. Worldwide emergence of resistance to antifungal drugs challenges human health and food security. Science 2018, 360, 739–742. [Google Scholar] [CrossRef] [PubMed]
- Niu, X.; Al-Hatmi, A.M.S.; Vitale, R.G.; Lackner, M.; Ahmed, S.A.; Verweij, P.E.; Kang, Y.; de Hoog, S. Evolutionary trends in antifungal resistance: A meta-analysis. Microbiol. Spectr. 2024, 12, e02127-23. [Google Scholar] [CrossRef] [PubMed]
- Ben-Ami, R.; Kontoyiannis, D.P. Resistance to Antifungal Drugs. Infect. Dis. Clin. N. Am. 2021, 35, 279–311. [Google Scholar] [CrossRef] [PubMed]
- van Rhijn, N.; Arikan-Akdagli, S.; Beardsley, J.; Bongomin, F.; Chakrabarti, A.; Chen, S.C.A.; Chiller, T.; Lopes Colombo, A.; Govender, N.P.; Alastruey-Izquierdo, A.; et al. Beyond bacteria: The growing threat of antifungal resistance. Lancet 2024, 404, 1017–1018. [Google Scholar] [CrossRef]
- Bassetti, M.; Giacobbe, D.R.; Berruti, M.; Del Puente, F.; Vena, A. Adequate duration of therapy in severe fungal infections. Curr. Opin. Crit. Care 2020, 26, 466–472. [Google Scholar] [CrossRef] [PubMed]
- Vena, A.; Bovis, F.; Tutino, S.; Santagostino Barbone, A.; Mezzogori, L.; Ponzano, M.; Taramasso, L.; Baldi, F.; Dettori, S.; Labate, L.; et al. Short course of antifungal therapy in patients with uncomplicated Candida bloodstream infection: Another case of less is more in the clinical setting? Open Forum Infect. Dis. 2023, 10, ofac656. [Google Scholar] [CrossRef]
- Vitiello, A.; Ferrara, F.; Boccellino, M.; Ponzo, A.; Cimmino, C.; Comberiati, E.; Zovi, A.; Clemente, S.; Sabbatucci, M. Antifungal Drug Resistance: An Emergent Health Threat. Biomedicines 2023, 11, 1063. [Google Scholar] [CrossRef] [PubMed]
- Ginsburg, C.M.; McCracken, G.H., Jr.; Petruska, M.; Olsen, K. Clinical and laboratory observations. Effect of feeding on bioavailability of griseofulvin in children. J. Pediatr. 1983, 102, 309–311. [Google Scholar] [CrossRef]
- Jaruratanasirikul, S.; Kleepkaew, A. Influence of an acidic beverage (Coca-Cola) on the absorption of itraconazole. Eur. J. Clin. Pharmacol. 1997, 52, 235–237. [Google Scholar] [CrossRef]
- Lange, D.; Pavao, J.H.; Wu, J.; Klausner, M. Effect of a cola beverage on the bioavailability of itraconazole in the presence of H2 blockers. J. Clin. Pharmacol. 1997, 37, 535–540. [Google Scholar] [CrossRef] [PubMed]
- Chin, T.W.F.; Loeb, M.; Fong, I.W. Effects of an acidic beverage (Coca-Cola) on absorption of ketoconazole. Antimicrob. Agents Chemother. 1995, 39, 1671–1675. [Google Scholar] [CrossRef]
- Krishna, G.; Moton, A.; Ma, L.; Medlock, M.M.; McLeod, J. Pharmacokinetics and absorption of posaconazole oral suspension under various gastric conditions in healthy volunteers. Antimicrob. Agents Chemother. 2009, 53, 958–966. [Google Scholar] [CrossRef]
- Walravens, J.; Brouwers, J.; Spriet, I.; Tack, J.; Annaert, P.; Augustijns, P. Effect of pH and comedication on gastrointestinal absorption of posaconazole: Monitoring of intraluminal and plasma drug concentrations. Clin. Pharmacokinet. 2011, 50, 725–734. [Google Scholar] [CrossRef] [PubMed]
- Kawakami, M.; Suzuki, K.; Ishizuka, T.; Hidaka, T.; Matsuki, Y.; Nakamura, H. Effect of grapefruit juice on pharmacokinetics of itraconazole in healthy subjects. Int. J. Clin. Pharmacol. Ther. 1998, 36, 306–308. [Google Scholar]
- Lohitnavy, M.; Lohitnavy, O.; Thangkeattiyanon, O.; Srichai, W. Reduced oral itraconazole bioavailability by antacid suspension. J. Clin. Pharm. Ther. 2005, 30, 201–206. [Google Scholar] [CrossRef] [PubMed]
- Brass, C.; Galgiani, J.N.; Blaschke, T.F.; Defelice, R.; O’Reilly, R.A.; Stevens, D.A. Disposition of ketoconazole, an oral antifungal, in humans. Antimicrob. Agents Chemother. 1982, 21, 151–158. [Google Scholar] [CrossRef] [PubMed]
- Krishna, G.; Ma, L.; Vickery, D.; Yu, X.; Wu, I.; Power, E.; Beresford, E.; Komjathy, S. Effect of varying amounts of a liquid nutritional supplement on the pharmacokinetics of posaconazole in healthy volunteers. Antimicrob. Agents Chemother. 2009, 53, 4749–4752. [Google Scholar] [CrossRef]
- Sansone-Parsons, A.; Krishna, G.; Calzetta, A.; Wexler, D.; Kantesaria, B.; Rosenberg, M.A.; Saltzman, M.A. Effect of a nutritional supplement on posaconazole pharmacokinetics following oral administration to healthy volunteers. Antimicrob. Agents Chemother. 2006, 50, 1881–1883. [Google Scholar] [CrossRef]
- Wiesner, A.; Skrońska, M.; Gawlik, G.; Marcinkowska, M.; Zagrodzki, P.; Paśko, P. Interactions of antiretroviral drugs with food, beverages, dietary supplements, and alcohol: A systematic review and meta-analyses. AIDS Behav. 2023, 27, 1441–1468. [Google Scholar] [CrossRef]
- Wu, C.Y.; Benet, L.Z. Predicting drug disposition via application of BCS: Transport/absorption/elimination interplay and development of a biopharmaceutics drug disposition classification system. Pharm. Res. 2005, 22, 11–23. [Google Scholar] [CrossRef] [PubMed]
- Gu, C.H.; Li, H.; Levons, J.; Lentz, K.; Gandhi, R.B.; Raghavan, K.; Smith, R.L. Predicting effect of food on extent of drug absorption based on physicochemical properties. Pharm. Res. 2007, 24, 1118–1130. [Google Scholar] [CrossRef] [PubMed]
- Wiesner, A.; Zagrodzki, P.; Jamrozik, M.; Korchowiec, J.; Marcinkowska, M.; Paśko, P. Chemometrics as a valuable tool for evaluating interactions between antiretroviral drugs and food. Br. J. Clin. Pharmacol. 2023, 89, 2977–2991. [Google Scholar] [CrossRef] [PubMed]
- Brereton, R.G.; Jansen, J.; Lopes, J.; Marini, F.; Pomerantsev, A.; Rodionova, O.; Roger, J.M.; Walczak, B.; Tauler, R. Chemometrics in analytical chemistry—Part I: History, experimental design and data analysis tools. Anal. Bioanal. Chem. 2017, 409, 5891–5899. [Google Scholar] [CrossRef]
- Abdi, H.; Williams, L.J. Partial least squares methods: Partial least squares correlation and partial least square regression. In Alternatives to Laboratory Animals: ATLA; Springer: Berlin/Heidelberg, Germany, 2013; Volume 27, pp. 549–579. ISBN 978-1-62703-058-8. [Google Scholar]
- Białek, A.; Zagrodzki, P.; Tokarz, A. Chemometric analysis of the interactions among different parameters describing health conditions, breast cancer risk and fatty acids profile in serum of rats supplemented with conjugated linoleic acids. Prostaglandins Leukot. Essent. Fat. Acids 2016, 106, 1–10. [Google Scholar] [CrossRef]
- Naumann, K. How Chlorine in Molecules Affects Biological Activity; Euro Chlor: Brussels, Belgium, 2003; pp. 1–37. [Google Scholar]
- Hsieh, S.H.; Brock, M. Lipid components of bile increase the protective effect of conjugated bile salts against antifungal drugs. Fungal Biol. 2017, 121, 929–938. [Google Scholar] [CrossRef]
- Hsieh, S.H.; Brunke, S.; Brock, M. Encapsulation of antifungals in micelles protects Candida albicans during gall-bladder infection. Front. Microbiol. 2017, 8, 117. [Google Scholar] [CrossRef]
- Courtney, R.; Wexler, D.; Radwanski, E.; Lim, J.; Laughlin, M. Effect of food on the relative bioavailability of two oral formulations of posaconazole in healthy adults. Br. J. Clin. Pharmacol. 2003, 57, 218–222. [Google Scholar] [CrossRef]
- Reuter, L.; Lüchow, A. Real space electron delocalization, resonance, and aromaticity in chemistry. Nat. Commun. 2021, 12, 4820. [Google Scholar] [CrossRef]
- Bunally, S.B.; Luscombe, C.N.; Young, R.J. Using Physicochemical Measurements to Influence Better Compound Design. SLAS Discov. 2019, 24, 791–801. [Google Scholar] [CrossRef] [PubMed]
- Coimbra, J.T.S.; Feghali, R.; Ribeiro, R.P.; Ramos, M.J.; Fernandes, P.A. The importance of intramolecular hydrogen bonds on the translocation of the small drug piracetam through a lipid bilayer. RSC Adv. 2020, 11, 899–908. [Google Scholar] [CrossRef] [PubMed]
- Serrano, D.R.; Lalatsa, A. Oral amphotericin B: The journey from bench to market. J. Drug Deliv. Sci. Technol. 2017, 42, 75–83. [Google Scholar] [CrossRef]
- Sousa, F.; Nascimento, C.; Ferreira, D.; Reis, S.; Costa, P. Reviving the interest in the versatile drug nystatin: A multitude of strategies to increase its potential as an effective and safe antifungal agent. Adv. Drug Deliv. Rev. 2023, 199, 114969. [Google Scholar] [CrossRef]
- Viecceli, C.; Mattos, A.C.V.; Costa, M.C.B.; de Melo, R.B.; Rodrigues, T.d.C.; Czepielewski, M.A. Evaluation of ketoconazole as a treatment for Cushing’s disease in a retrospective cohort. Front. Endocrinol. 2022, 13, 1017331. [Google Scholar] [CrossRef]
- FDA. FDA Drug Safety Communication: FDA Warns that Prescribing of Nizoral (Ketoconazole) Oral Tablets for Unapproved Uses Including Skin and Nail Infections Continues; Linked to Patient Death. Available online: http://www.fda.gov/Drugs/DrugSafety/ucm500597.htm (accessed on 6 January 2025).
- Sterne, J.A.C.; Savović, J.; Page, M.J.; Elbers, R.G.; Blencowe, N.S.; Boutron, I.; Cates, C.J.; Cheng, H.-Y.; Corbett, M.S.; Eldridge, S.M.; et al. RoB 2: A revised tool for assessing risk of bias in randomised trials. BMJ 2019, 366, l4898. [Google Scholar] [CrossRef]
- Higgins, J.P.T.; Li, T.; Sterne, J.A.C. Revised Cochrane risk of bias tool for randomized trials (RoB 2.0): Additional considerations for cross-over trials. Cochrane Methods 2021, 1–6. [Google Scholar]
- NIH Study Quality Assessment Tools. Available online: https://www.nihlibrary.nih.gov/services/systematic-review-service/tools-resources (accessed on 26 November 2024).
- Xiong, G.; Wu, Z.; Yi, J.; Fu, L.; Yang, Z.; Hsieh, C.; Yin, M.; Zeng, X.; Wu, C.; Lu, A.; et al. ADMETlab 2.0: An integrated online platform for accurate and comprehensive predictions of ADMET properties. Nucleic Acids Res. 2021, 49, W5–W14. [Google Scholar] [CrossRef]
- Cao, D.S.; Xu, Q.S.; Hu, Q.N.; Liang, Y.Z. ChemoPy: Freely available python package for computational biology and chemoinformatics. Bioinformatics 2013, 29, 1092–1094. [Google Scholar] [CrossRef]
- Yap, C.W. PaDEL-descriptor: An open source software to calculate molecular descriptors and fingerprints. J. Comput. Chem. 2011, 32, 1466–1474. [Google Scholar] [CrossRef]
- Schrödinger Inc. Qikprop, v11.15.0; Schrödinger, LLC: New York, NY, USA, 2021. [Google Scholar]
- RDKit: Open-Source Cheminformatics. Available online: https://www.rdkit.org (accessed on 25 October 2024).
- Chen, N.; He, Q.; Ma, Y.; Liu, S.; Wei, H.; Peng, A. Pharmacokinetics and Bioequivalence of Fluconazole Capsules Manufactured in France and China in Healthy Chinese Participants: Open-Label, Randomized, Single-Dose, 2-Way, Cross-over Bioequivalence Study Under Fasted and Fed Conditions. Clin. Pharmacol. Drug Dev. 2023, 12, 572–578. [Google Scholar] [CrossRef] [PubMed]
- Li, Z.; Liu, J.; Qiu, W.; Chen, H. Bioequivalence of fluconazole capsules in healthy Chinese subjects. Chin. J. Clin. Pharmacol. Ther. 2020, 25, 910–915. [Google Scholar] [CrossRef]
- Zimmermann, T.; Yeates, R.A.; Laufen, H.; Pfaff, G.; Wildfeuer, A. Influence of concomitant food intake on the oral absorption of two triazole antifungal agents, itraconazole and fluconazole. Eur. J. Clin. Pharmacol. 1994, 46, 147–150. [Google Scholar] [CrossRef] [PubMed]
- Ahmed, I.S.; Aboul-Einien, M.H.; Mohamed, O.H.; Farid, S.F. Relative bioavailability of griseofulvin lyophilized dry emulsion tablet vs. immediate release tablet: A single-dose, randomized, open-label, six-period, cross-over study in healthy adult volunteers in the fasted and fed states. Eur. J. Pharm. Sci. 2008, 35, 219–225. [Google Scholar] [CrossRef] [PubMed]
- Aoyagi, N.; Ogata, H.; Kaniwa, N.; Ejima, A. Effect of food on the bioavailability of griseofulvin from microsize and PEG ultramicrosize (GRIS-PEG) plain tablets. J. Pharmacobiodyn. 1982, 5, 120–124. [Google Scholar] [CrossRef]
- Brexafemme (Scynexis). Available online: https://www.accessdata.fda.gov/drugsatfda_docs/label/2022/214900s002lbl.pdf (accessed on 12 August 2024).
- Schmitt-Hoffmann, A.; Desai, A.; Kowalski, D.; Pearlman, H.; Yamazaki, T.; Townsend, R. Isavuconazole absorption following oral administration in healthy subjects is comparable to intravenous dosing, and is not affected by food, or drugs that alter stomach pH. Int. J. Clin. Pharmacol. Ther. 2016, 54, 572–580. [Google Scholar] [CrossRef]
- Abuhelwa, A.Y.; Foster, D.J.R.; Mudge, S.; Hayes, D.; Upton, R.N. Population pharmacokinetic modeling of itraconazole and hydroxyitraconazole for oral SUBA-itraconazole and sporanox capsule formulations in healthy subjects in fed and fasted states. Antimicrob. Agents Chemother. 2015, 59, 5681–5696. [Google Scholar] [CrossRef]
- Barone, J.A.; Koh, J.G.; Bierman, R.H.; Colaizzi, J.L.; Swanson, K.A.; Gaffar, M.C.; Moskovitz, B.L.; Mechlinski, W.; Van de Velde, V. Food interaction and steady-state pharmacokinetics of itraconazole capsules in healthy male volunteers. Antimicrob. Agents Chemother. 1993, 37, 778–784. [Google Scholar] [CrossRef]
- Barone, J.A.; Moskovitz, B.L.; Guarnieri, J.; Hassell, A.E.; Colaizzi, J.L.; Bierman, R.H.; Jessen, L. Food interaction and steady-state pharmacokinetics of itraconazole oral solution in healthy volunteers. Pharmacotherapy 1998, 18, 295–301. [Google Scholar] [CrossRef]
- Medicines and Healthcare Products Regulatory Agency HGN007 Study—A Single-Dose, Four-Way Cross-Over, Relative Bioavailability Study to Compare the Pharmacokinetics of the Test Product Lozanoc 50 mg Hard Capsules versus the Reference Product Sporanox 100 mg Capsules in Healthy Adult Volunteers Under Fed and Fasted Conditions. Available online: https://mhraproducts4853.blob.core.windows.net/docs/c86c25a27a87210e71b30f469ae86a729f4cb575 (accessed on 11 August 2024).
- Kapsi, S.G.; Ayres, J.W. Processing factors in development of solid solution formulation of itraconazole for enhancement of drug dissolution and bioavailability. Int. J. Pharm. 2001, 229, 193–203. [Google Scholar] [CrossRef]
- Lindsay, J.; Mudge, S. Novel formulation suba-itraconazole in fed and fasted healthy volunteers: Expanding the clinical utility of the established mold active agent. Open Forum Infect. Dis. 2018, 5, S414–S415. [Google Scholar] [CrossRef]
- Center for Drug Evaluation and Research MPG017 Study—TOLSURA Capsules 130 mg [2 × 65 mg] Administered Under Fed and Fasted Conditions in 24 Healthy Volunteers; 2018. Available online: https://www.accessdata.fda.gov/drugsatfda_docs/nda/2018/208901Orig1s000MultidisciplineR.pdf (accessed on 11 August 2024).
- Tradename (Sanico). Available online: https://www.accessdata.fda.gov/drugsatfda_docs/label/2010/022484s000lbl.pdf (accessed on 12 August 2024).
- Oguma, T.; Tabata, H.; Aihara, K.; Matsumoto, M.; Kagioka, H.; Nagano, M.; Fukui, M. Influence of black vinegar on itraconazole absorption. Kansenshogaku Zasshi. 2009, 83, 369–374. [Google Scholar] [CrossRef] [PubMed]
- Rauseo, A.M.; Mazi, P.; Lewis, P.; Burnett, B.; Mudge, S.; Spec, A. Bioavailability of Single-Dose SUBA-Itraconazole Compared to Conventional Itraconazole under Fasted and Fed Conditions. Antimicrob. Agents Chemother. 2021, 65, e0013421. [Google Scholar] [CrossRef] [PubMed]
- Tei, M.; Yamamoto, M.; Inoue, K.; Torii, S. Single- and multiple-dose pharmacokinetics of intraconazole oral solution in healthy men. Jpn. J. Chemother. 2006, 54, 6–17. [Google Scholar]
- Van de Velde, V.J.; Van Peer, A.P.; Heykants, J.J.; Woestenborghs, R.J.; Van Rooy, P.; De Beule, K.L.; Cauwenbergh, G.F. Effect of food on the pharmacokinetics of a new hydroxypropyl-beta-cyclodextrin formulation of itraconazole. Pharmacotherapy 1996, 16, 424–428. [Google Scholar] [CrossRef]
- Van Peer, A.; Woestenborghs, R.; Heykants, J.; Gasparini, R.; Gauwenbergh, G. The effects of food and dose on the oral systemic availability of itraconazole in healthy subjects. Eur. J. Clin. Pharmacol. 1989, 36, 423–426. [Google Scholar] [CrossRef]
- Woo, J.S.; Song, Y.-K.; Hong, J.-Y.; Lim, S.-J.; Kim, C.-K. Reduced food-effect and enhanced bioavailability of a self-microemulsifying formulation of itraconazole in healthy volunteers. Eur. J. Pharm. Sci. 2008, 33, 159–165. [Google Scholar] [CrossRef]
- Yun, H.; Baek, M.S.; Park, I.S.; Choi, B.K.; Kwon, K. Comparative analysis of the effects of rice and bread meals on bioavailability of itraconazole using NONMEM in healthy volunteers. Eur. J. Clin. Pharmacol. 2006, 62, 1033–1039. [Google Scholar] [CrossRef]
- Daneshmend, T.K.; Warnock, D.W.; Ene, M.D.; Johnson, E.M.; Potten, M.R.; Richardson, M.D.; Williamson, P.J. Influence of food on the pharmacokinetics of ketoconazole. Antimicrob. Agents Chemother. 1984, 25, 1–3. [Google Scholar] [CrossRef]
- Männistö, P.T.; Mäntylä, R.; Nykänen, S.; Lamminsivu, U.; Ottoila, P. Impairing effect of food on ketoconazole absorption. Antimicrob. Agents Chemother. 1982, 21, 730–733. [Google Scholar] [CrossRef]
- Vivjoa (Mycovia Pharmaceuticals). Available online: https://www.accessdata.fda.gov/drugsatfda_docs/label/2022/215888s000lbl.pdf (accessed on 12 August 2024).
- Courtney, R.; Radwanski, E.; Lim, J.; Laughlin, M. Pharmacokinetics of posaconazole coadministered with antacid in fasting or nonfasting healthy men. Antimicrob. Agents Chemother. 2004, 48, 804–808. [Google Scholar] [CrossRef] [PubMed]
- Dayan, N.; Oğralı, E.; Kirişçioğlu, C.; Dude, U.K.; Erşahin, R. Single-Dose Cross-over Comparative Bioavailability Study of Two Different Posaconazole 100 mg Gastro-Resistant Tablets Under Fasted and Fed Conditions in Healthy Volunteers. Infect. Dis. Clin. Microbiol. 2023, 5, 341–352. [Google Scholar] [CrossRef] [PubMed]
- Dogterom, P.; Van Iersel, M.; Xu, J.; Waskin, H.; Kersemaekers, W. The effect of food on the posaconazole pharmacokinetics investigated during the development of a new tablet formulation. Clin. Pharmacol. Ther. 2014, 95, S42. [Google Scholar] [CrossRef]
- Hens, B.; Corsetti, M.; Brouwers, J.; Augustijns, P. Gastrointestinal and Systemic Monitoring of Posaconazole in Humans After Fasted and Fed State Administration of a Solid Dispersion. J. Pharm. Sci. 2016, 105, 2904–2912. [Google Scholar] [CrossRef]
- Kersemaekers, W.M.; Dogterom, P.; Xu, J.; Marcantonio, E.E.; de Greef, R.; Waskin, H.; van Iersel, M.L.P.S. Effect of a high-fat meal on the pharmacokinetics of 300-milligram posaconazole in a solid oral tablet formulation. Antimicrob. Agents Chemother. 2015, 59, 3385–3389. [Google Scholar] [CrossRef]
- Krishna, G.; AbuTarif, M.; Xuan, F.; Martinho, M.; Angulo, D.; Cornely, O.A. Pharmacokinetics of oral posaconazole in neutropenic patients receiving chemotherapy for acute myelogenous leukemia or myelodysplastic syndrome. Pharmacotherapy 2008, 28, 1223–1232. [Google Scholar] [CrossRef]
- Krishna, G.; Ma, L.; Martinho, M.; O’Mara, E. Single-dose phase I study to evaluate the pharmacokinetics of posaconazole in new tablet and capsule formulations relative to oral suspension. Antimicrob. Agents Chemother. 2012, 56, 4196–4201. [Google Scholar] [CrossRef]
- Li, H.; Wei, Y.; Zhang, S.; Xu, L.; Jiang, J.; Qiu, Y.; Mangin, E.; Zhao, X.M.; Xie, S. Pharmacokinetics and Safety of Posaconazole Administered by Intravenous Solution and Oral Tablet in Healthy Chinese Subjects and Effect of Food on Tablet Bioavailability. Clin. Drug Investig. 2019, 39, 1109–1116. [Google Scholar] [CrossRef]
- Lin, T.-Y.; Yang, M.-H.; Chang, F.-Y. A randomized, phase I, 3-way cross-over study to examine the effects of food on the pharmacokinetics of single doses of 400 mg posaconazole oral suspension in healthy male Taiwanese subjects. Ther. Drug Monit. 2013, 35, 223–227. [Google Scholar] [CrossRef]
- Noxafil (Merck & Co.). Available online: https://www.accessdata.fda.gov/drugsatfda_docs/label/2014/205053s1lbl.pdf (accessed on 12 August 2024).
- Xu, H.R.; Chu, N.N.; Chen, W.L.; Wang, Z.D.; Li, X.N. Liquid chromatography-mass spectrometry method for the quantification of posaconazole in human plasma: Application to pharmacokinetics following single-dose administration in the fasted state and with a high-fat meal. Pharmazie 2013, 68, 173–177. [Google Scholar]
- Nedelman, J.; Cramer, J.A.; Robbins, B.; Gibiansky, E.; Chang, C.T.; Gareffa, S.; Cohen, A.; Meligeni, J. The effect of food on the pharmacokinetics of multiple-dose terbinafine in young and elderly healthy subjects. Biopharm. Drug Dispos. 1997, 18, 127–138. [Google Scholar] [CrossRef]
- Vfend (Pfizer). Available online: https://www.accessdata.fda.gov/drugsatfda_docs/label/2019/021266s039,021267s050,021630s029lbl.pdf (accessed on 12 August 2024).
- Purkins, L.; Wood, N.; Kleinermans, D.; Greenhalgh, K.; Nichols, D. Effect of food on the pharmacokinetics of multiple-dose oral voriconazole. Br. J. Clin. Pharmacol. 2003, 56 (Suppl. S1), 17–23. [Google Scholar] [CrossRef]
| Drug | BCS | Log p |
|---|---|---|
| Albaconazole | NS | 2.82 |
| Amphotericin B | IV | −0.04 |
| Fluconazole | I | 0.56 |
| Flucytosine | III | −1.04 |
| Griseofulvin | II | 2.17 |
| Hachimycin (trichomycin) | NS | 2.39 |
| Ibrexafungerp | IV | 7.16 |
| Isavuconazole | II | 4.14 |
| Itraconazole | II | 7.31 |
| Ketoconazole | II | 4.19 |
| Nystatin | IV | 0.33 |
| Oteseconazole | II | 4.69 |
| Posaconazole | II | 5.41 |
| Terbinafine | II | 5.53 |
| Voriconazole | II | 1.82 |
| PLS Model Predictor Parameters—Molecular Descriptors Related to Atoms (M2) Response Parameters—Postprandial ∆AUC and ∆Tmax | ||
|---|---|---|
| Pairs of Correlated Parameters | Correlation Coefficient | |
| nAromAt | nN | 1.000 |
| nAt | nC | 1.000 |
| nO | nHBD | 0.999 |
| nC | nH | 0.991 |
| nAt | nH | 0.987 |
| nAt | nHeavyAt | 0.982 |
| nC | nHeavyAt | 0.978 |
| nCl | ∆Tmax | 0.967 |
| nAtPi | nHBD | 0.965 |
| nAtPi | nO | 0.956 |
| nH | nHeavyAt | 0.941 |
| nAtPi | nH | 0.938 |
| nAtPi | nC | 0.882 |
| nAt | nAtPi | 0.872 |
| nN | ∆Tmax | 0.844 |
| nAromAt | ∆Tmax | 0.835 |
| nAtPi | nHeavyAt | 0.765 |
| nCl | nN | 0.679 |
| nAromAt | nCl | 0.666 |
| nAromAt | nAtPi | −0.299 |
| nAtPi | nN | −0.316 |
| nAromAt | nHBD | −0.539 |
| nN | nHBD | −0.553 |
| nAromAt | nO | −0.566 |
| nN | nO | −0.579 |
| nAtPi | ∆Tmax | −0.775 |
| nAtPi | nCl | −0.911 |
| nHBD | ∆Tmax | −0.914 |
| nO | ∆Tmax | −0.926 |
| nCl | nHBD | −0.987 |
| nCl | nO | −0.992 |
Disclaimer/Publisher’s Note: The statements, opinions and data contained in all publications are solely those of the individual author(s) and contributor(s) and not of MDPI and/or the editor(s). MDPI and/or the editor(s) disclaim responsibility for any injury to people or property resulting from any ideas, methods, instructions or products referred to in the content. |
© 2025 by the authors. Licensee MDPI, Basel, Switzerland. This article is an open access article distributed under the terms and conditions of the Creative Commons Attribution (CC BY) license (https://creativecommons.org/licenses/by/4.0/).
Share and Cite
Wiesner-Kiełczewska, A.; Zagrodzki, P.; Gawalska, A.; Paśko, P. Chemometric Methods—A Valuable Tool for Investigating the Interactions Between Antifungal Drugs (Including Antifungal Antibiotics) and Food. Antibiotics 2025, 14, 70. https://doi.org/10.3390/antibiotics14010070
Wiesner-Kiełczewska A, Zagrodzki P, Gawalska A, Paśko P. Chemometric Methods—A Valuable Tool for Investigating the Interactions Between Antifungal Drugs (Including Antifungal Antibiotics) and Food. Antibiotics. 2025; 14(1):70. https://doi.org/10.3390/antibiotics14010070
Chicago/Turabian StyleWiesner-Kiełczewska, Agnieszka, Paweł Zagrodzki, Alicja Gawalska, and Paweł Paśko. 2025. "Chemometric Methods—A Valuable Tool for Investigating the Interactions Between Antifungal Drugs (Including Antifungal Antibiotics) and Food" Antibiotics 14, no. 1: 70. https://doi.org/10.3390/antibiotics14010070
APA StyleWiesner-Kiełczewska, A., Zagrodzki, P., Gawalska, A., & Paśko, P. (2025). Chemometric Methods—A Valuable Tool for Investigating the Interactions Between Antifungal Drugs (Including Antifungal Antibiotics) and Food. Antibiotics, 14(1), 70. https://doi.org/10.3390/antibiotics14010070