Article

Diverse Role of blaCTX-M and Porins in Mediating Ertapenem Resistance among Carbapenem-Resistant Enterobacterales

1
College of Pharmacy, The University of Texas at Austin, Austin, TX 78712, USA
2
Joe R. and Teresa Lozano Long School of Medicine, The University of Texas Health Science Center at San Antonio, San Antonio, TX 78229, USA
3
Department of Pathology and Laboratory Medicine, The University of Texas Health Science Center at San Antonio, San Antonio, TX 78229, USA
4
University Health System, San Antonio, TX 78229, USA
5
College of Pharmacy, Western University of Health Sciences, Pomona, CA 91766, USA
6
Veterans Administration Research Center for AIDS and HIV-1 Infection and Center for Personalized Medicine, South Texas Veterans Health Care System, San Antonio, TX 78229, USA
*
Author to whom correspondence should be addressed.
Antibiotics 2024, 13(2), 185; https://doi.org/10.3390/antibiotics13020185
Submission received: 27 December 2023 / Revised: 7 February 2024 / Accepted: 9 February 2024 / Published: 13 February 2024

Abstract

:
Among carbapenem-resistant Enterobacterales (CRE) are diverse mechanisms, including those that are resistant to meropenem but susceptible to ertapenem, adding further complexity to the clinical landscape. This study investigates the emergence of ertapenem-resistant, meropenem-susceptible (ErMs) Escherichia coli and Klebsiella pneumoniae CRE across five hospitals in San Antonio, Texas, USA, from 2012 to 2018. The majority of the CRE isolates were non-carbapenemase producers (NCP; 54%; 41/76); 56% of all NCP isolates had an ErMs phenotype. Among ErMs strains, E. coli comprised the majority (72%). ErMs strains carrying blaCTX-M had, on average, 9-fold higher copies of blaCTX-M than CP-ErMs strains as well as approximately 4-fold more copies than blaCTX-M-positive but ertapenem- and meropenem-susceptible (EsMs) strains (3.7 vs. 0.9, p < 0.001). Notably, carbapenem hydrolysis was observed to be mediated by strains harboring blaCTX-M with and without a carbapenemase(s). ErMs also carried more mobile genetic elements, particularly IS26 composite transposons, than EsMs (37 vs. 0.2, p < 0.0001). MGE- ISVsa5 was uniquely more abundant in ErMs than either EsMs or ErMr strains, with over 30 more average ISVsa5 counts than both phenotype groups (p < 0.0001). Immunoblot analysis demonstrated the absence of OmpC expression in NCP-ErMs E. coli, with 92% of strains lacking full contig coverage of ompC. Overall, our findings characterize both collaborative and independent efforts between blaCTX-M and OmpC in ErMs strains, indicating the need to reappraise the term “non-carbapenemase (NCP)”, particularly for strains highly expressing blaCTX-M. To improve outcomes for CRE-infected patients, future efforts should focus on mechanisms underlying the emerging ErMs subphenotype of CRE strains to develop technologies for its rapid detection and provide targeted therapeutic strategies.

1. Introduction

Carbapenem resistance in the Enterobacterales family poses a growing and pervasive threat to human health worldwide [1]. Despite advances in treatment strategies, these organisms continue to adapt, rendering them resistant to last-line antibiotics via a complex interplay of anti-carbapenem mechanisms [2,3]. While the mechanisms driving carbapenem resistance vary from region to region, the most measured and recognized mechanism is carbapenemase production, including serine carbapenemases (e.g., blaKPC) as well as metallo-β-lactamases (MBLs), such as New Delhi metallo-β-lactamase (blaNDM) [4].
However, the implications of carbapenem resistance occurring in strains that lack a carbapenemase (NCP) have been less studied. NCP-related infections have exhibited similar infection-related mortality and healthcare utilization as CPE-related infections [5]. While carbapenemase-producing Enterobacterales (CPE) is the predominant global driver of CRE, NCPE predominance has been emerging in some regions, including South Texas, with rates as high as 61% [6,7]. While an increasing rate of clinical laboratories have the capability to detect strains that harbor carbapenemases using currently available molecular rapid diagnostic tests, there is no such test to rapidly detect NCPE strains. This presents a major challenge for the timely diagnosis of a CRE infection, leading to delayed targeted treatment, overprescribing of antimicrobials, transmission, and poor outcomes. Moreover, NCPE is attributable to its diverse underlying mechanisms, which most frequently are combinatorial and concerted and cannot be detected by the presence/absence of a specific gene. It is suspected that higher production of cephalosporinases including extended-spectrum β-lactamase (ESBL) enzymes, like blaCTX-M, Ambler class C (e.g., blaAmpC), and certain variants of blaSHV contribute to carbapenem resistance among NCP-CRE (4,5). However, additional concerted anti-carbapenem resistance mechanisms with cephalosporinase production, such as loss or altered outer membrane protein (Omp) impacting intracellular carbapenem concentration and rate of hydrolysis (level of activity of cephalosporinases) have been implicated and requires further investigation [5].
Moreover, among NCPEs are diverse mechanisms, including those that are resistant to either meropenem or imipenem–cilastatin but susceptible to ertapenem, adding further complexity to the clinical landscape. The clinical relevance is underscored as the Infectious Diseases Society of America (IDSA) treatment guidelines for Gram-negative infections provide specific recommendations for CRE infections that are resistant to ertapenem (MICs ≥ 2 mcg/mL) but susceptible to meropenem (MICs ≤ 1 mcg/mL) (ertapenem-resistant, meropenem-susceptible; ErMs) [8]. Mutations for ertapenem resistance have been shown to provide the genetic background for non-carbapenemase meropenem resistance [9]. However, investigations into the molecular and clinical profiles underlying the ErMs phenotype have been limited. Previous studies have demonstrated that high levels of ESBL-associated transposon insertional mutagenesis occur in ertapenem-resistant K. pneumoniae and ST-131 E. coli clinical strains, contributing to the evolution of meropenem resistance [9,10]. Consequently, clinicians rely on susceptibility testing results, which can take 3–5 days, before optimizing antibiotics. Herein, we report on mechanisms underlying the phenotypic emergence of ErMs E. coli and K. pneumoniae, with a particular focus on NCPE.

2. Results

2.1. ErMs Predominantly Harbor blaCTX-M among NCPE

As previously reported, 99 CRE isolates from unique patients were collected from five hospitals in South Texas, United States, between 2011 and 2019 [7]. Of these, E. coli and K. pneumoniae comprised the majority (77%; 76/99), consisting of 47 K. pneumoniae and 29 E. coli. Antimicrobial susceptibility results for E. coli and K. pneumoniae isolates are shown in Table 1. Resistance to either ertapenem and/or meropenem was confirmed phenotypically. Overall, 38% (29) had an ErMs phenotype, while 62% (47) were ertapenem- and meropenem-resistant (ErMr). E.coli isolates had an ErMs phenotype more frequently than K. pneumoniae (72% vs. 17%; p < 0.001). Meropenem susceptibility was maintained by 44% of the CRE isolates. Piperacillin–tazobactam susceptibility was 19% and 35% overall and among ErMs CRE, respectively. Among other common antibiotics active against CRE, susceptibility rates were 77% (ceftazidime–avibactam), 98% (tigecyclin), 16% (levofloxacin), 23% (trimethoprim–sulfamethoxazole), 91% (amikacin), 95% (polymyxins), and 98% (imipenem–relebactam). Two K. pneumoniae (one NCP-ErMs and one CP-ErMS) and one NCP-E. coli were polymyxin B-resistant.
Short-read, whole genome sequence (WGS) analysis was used to annotate known resistance genes among all 76 E. coli and K. pneumoniae isolates (Table 2). Overall, 54% of CRE lacked a carbapenemase gene (NCPE), and 46% (35/76) were CPE. E. coli was more frequently NCPE than K. pneumoniae (76% vs. 40%; p = 0.01). Contrastingly, K. pneumoniae were more than twice as likely to harbor a carbapenemase gene than E. coli (Table 2), which predominantly comprised blaKPC (23/28). K. pneumoniae also harbored a penicillinase blaTEM and/or blaSHV more frequently than E. coli (89% vs. 62%; p = 0.01). The ErMs vs. ErMr phenotype were more likely to be NCPE (83% vs. 36%, p < 0.001) and enriched for carrying blaCTX-M (83% vs. 49%, respectively; p = 0.01). While CPE was more likely to be ErMr, 5 (14%) of CPE isolates were ErMs; four harboring blaKPC and one blaNDM. Contrastingly, ErMr isolates were more commonly CPE than ErMs (64% vs. 17%, p < 0.001), with blaKPC making up the majority of carbapenemase genes among this phenotype (51% vs. 14%, p = 0.002). In addition, CP strains carried blaOXA-1 or blaOXA-9 more frequently than NCPE strains (60% vs. 29%, p = 0.01).
The distribution of MBLs, oxacillinases, AmpC cephalosporinases, and ESBL genes was similar between E. coli and K. pneumoniae, with the exception that blaSHV-12 ESBL genes were solely carried by seven K. pneumoniae isolates. In total, 5 isolates harbored an MBL carbapenemase gene (2 blaNDM-1, 2 blaNDM-5, and 1 blaVIM-27), 28 harbored a blaKPC gene (18 blaKPC-2 and 10 blaKPC-3), two harbored a blaOXA-232 carbapenemase gene, 33 harbored a narrow spectrum oxacillinase blaOXA-1 or blaOXA-9 gene (22 blaOXA-1 and 12 blaOXA-9), 52 harbored an ESBL, of which blaCTX-M-15 made up the majority (43 blaCTX-M-15, 3 blaCTX-M-14, 1 blaCTX-M-27, 7 blaSHV-12, and 1 blaSHV-105). blaOXA-1 or blaOXA-9 was co-harbored with blaCTX-M-15 in 27 (36%) of isolates (11 E. coli and 16 K. pneumoniae). Among blaKPC harboring isolates, blaOXA-1 or blaOXA-9 was co-harbored in 14 (18%) of isolates (3 E. coli and 11 K. pneumoniae). Sixty (79%) of E. coli and K. pneumoniae carried a penicillinase gene (blaTEM or blaSHV). Twelve (16%) E. coli and K. pneumoniae carried a class C cephalosporinase gene, with plasmid-mediated blaCMY variants making up the majority (11/12).

2.2. ErMs E. coli Associates with Mobile Genetic Elements Interposed by blaCTX-M

Mobile genetic elements (MGEs), including insertion sequences (ISs), composite transposons, and other transposable elements, are associated with the mobilization of antibiotic resistance genes, including β-lactamases. We aimed to investigate the association between ISs and blaCTX-M genes, particularly their genetic context among ErMs E. coli. To gain insight into MGEs total abundance and their associations with blaCTX-M amplification and mobilization across three distinct carbapenem phenotypes, we annotated MGEs for five ErMs E. coli (EC-4, 6, 13, 30, and 35) and four ErMr E. coli (EC-5, 23, 67, and 68) using MobileElementFinder (https://cge.food.dtu.dk/services/MobileElementFinder/, accessed on 29 June 2023). For reference, five blaCTX-M-positive ertapenem- and meropenem-susceptible (EsMs) E. coli FASTA sequences (Accessions: GCA_032120475.1, GCA_032120375.1, GCA_032122895.1, GCA_032329675.1, GCA_031776215.1) were obtained from NCBI Isolates Browser (https://www.ncbi.nlm.nih.gov/pathogens/isolates, accessed on 29 June 2023). ErMs and ErMr were selected from our collection to match the various host sources of the EsMs (e.g., urine, blood, and sputum). To determine blaCTX-M associated MGEs, our evaluation included MGEs that met two criteria on the same contig: (i) either interposed blaCTX-M or (ii) were immediately upstream of blaCTX-M.
ErMs E. coli had higher global mean MGE counts than EsMs (9.4 vs. 0.5, p < 0.001), but similar to ErMr strains (Figure 1A, Supplemental Data S1). A total of seven blaCTX-M associated MGEs (i.e., MGE annotations interposed by composite transposons or upstream from blaCTX-M) were identified, including IS26, IS26 composite transposon (IS26 inverted repeat flanked unit), ISVsa5 (= IS10R), ISEc9, Tn801, IS102, and ISAs17 (Figure 1B). When evaluating MGE Log2-transformed count differences between ErMs vs. EsMs (Figure 1C), five of these seven blaCTX-M-associated MGEs were significantly higher, including IS26 composite transposon (mean count difference 36.8, p < 0.0001), ISVsa5 (31.8, p < 0.0001), IS26 (25.2, p = 0.0006), Tn801 (23, p = 0.002), and ISEc9 (17.2, p = 0.03). Across phenotype groups, a stepwise pattern of increasing blaCTX-M associated MGE counts were observed from EsMs to ErMs to ErMr (Figure 1B). Notably, MGE- ISVsa5 was uniquely more abundant in ErMs than either EsMs or ErMr strains, with over 30 more average ISVsa5 counts than both phenotype groups (p < 0.0001) (Figure 1B,C). Comparing ErMs to ErMr showed a wide range of distinct MGEs more abundant in each phenotype (Supplemental Data S1 and S2, Figure S1).

2.3. Carbapenemase and blaCTX-M Hastens Meropenem Hydrolysis in CPE and NCPE

To determine the effect of various β-lactamase profiles on carbapenem hydrolysis rates, intracellular meropenem concentrations were measured via parent molecule quantification over time using liquid chromatography–tandem mass spectrometry (LC-MS/MS). Nine representative isolates with diverse profiles were evaluated, including blaNDM and blaKPC harboring E. coli and K. pneumoniae, and blaCTX-M-15, blaOXA-1, blaTEM harboring non-carbapenemase-producing E. coli isolates. Vaborbactam served as a secondary internal standard across all LC-MS/MS assays. The concentration of meropenem or vaborbactam (ng/mL) was compared at three time points (1, 2, and 18 h). Hydrolysis rates were determined using the formula, p a r e n t t , and reported as ng/mL-hour in Table 3. Of the nine isolates, three harbored blaNDM (EC22, EC23, and KP26), three harbored blaKPC (EC74, KP15, and KP56), and three were NCPE (EC68, EC5, and EC201).
Distinct rates of meropenem hydrolysis were observed. Isolates harboring blaCTX-M displayed higher rates of meropenem hydrolysis across NCPE and CPE isolates (Table 3). Those harboring blaNDM showed a rapid loss of meropenem; two isolates (EC22 and KP26) rapidly fell below the lower limit of quantitation (LLQ) within one hour, while the other isolate (EC23) displayed a rapid rate of meropenem hydrolysis over the over the 18 h experimental period (−2.8 ng/mL-hour). Among the blaKPC harboring isolates (KP56, EC74, and KP15), meropenem hydrolysis was 1.7 times faster, on average, when blaCTX-M was present (Table 3). Among the NCP isolates tested (EC5, EC68, and EC201), the two isolates that harbored blaCTX-M-15 displayed 1.8 times faster rates of meropenem hydrolysis than the non-blaCTX-M-15 isolate (EC68). Correspondingly, the rate of meropenem hydrolysis among the blaCTX-M-15 positive NCP isolates ranged between −0.5 to −1.0, including cases where an NCP (EC201) strain had rates similar to those of blaKPC-producing isolates KP56 (ATCC 1705) and EC74. Overall, meropenem hydrolysis was observed among CP and NCP isolates. Rates were highest among CP with the presence of the ESBL blaCTX-M-15.
Vaborbactam concentrations remained relatively constant over hours 1 to 18 with an average t2 − t1 concentration of +0.75 (±1.1) ng/mL. No vaborbactam hydrolysis was observed other than minor loss (−0.1 ng/mL) in EC68 (NCPE) over 18 h (Table 3, Supplement Data S2, Tables S1 and S2, and Supplement Data S3).

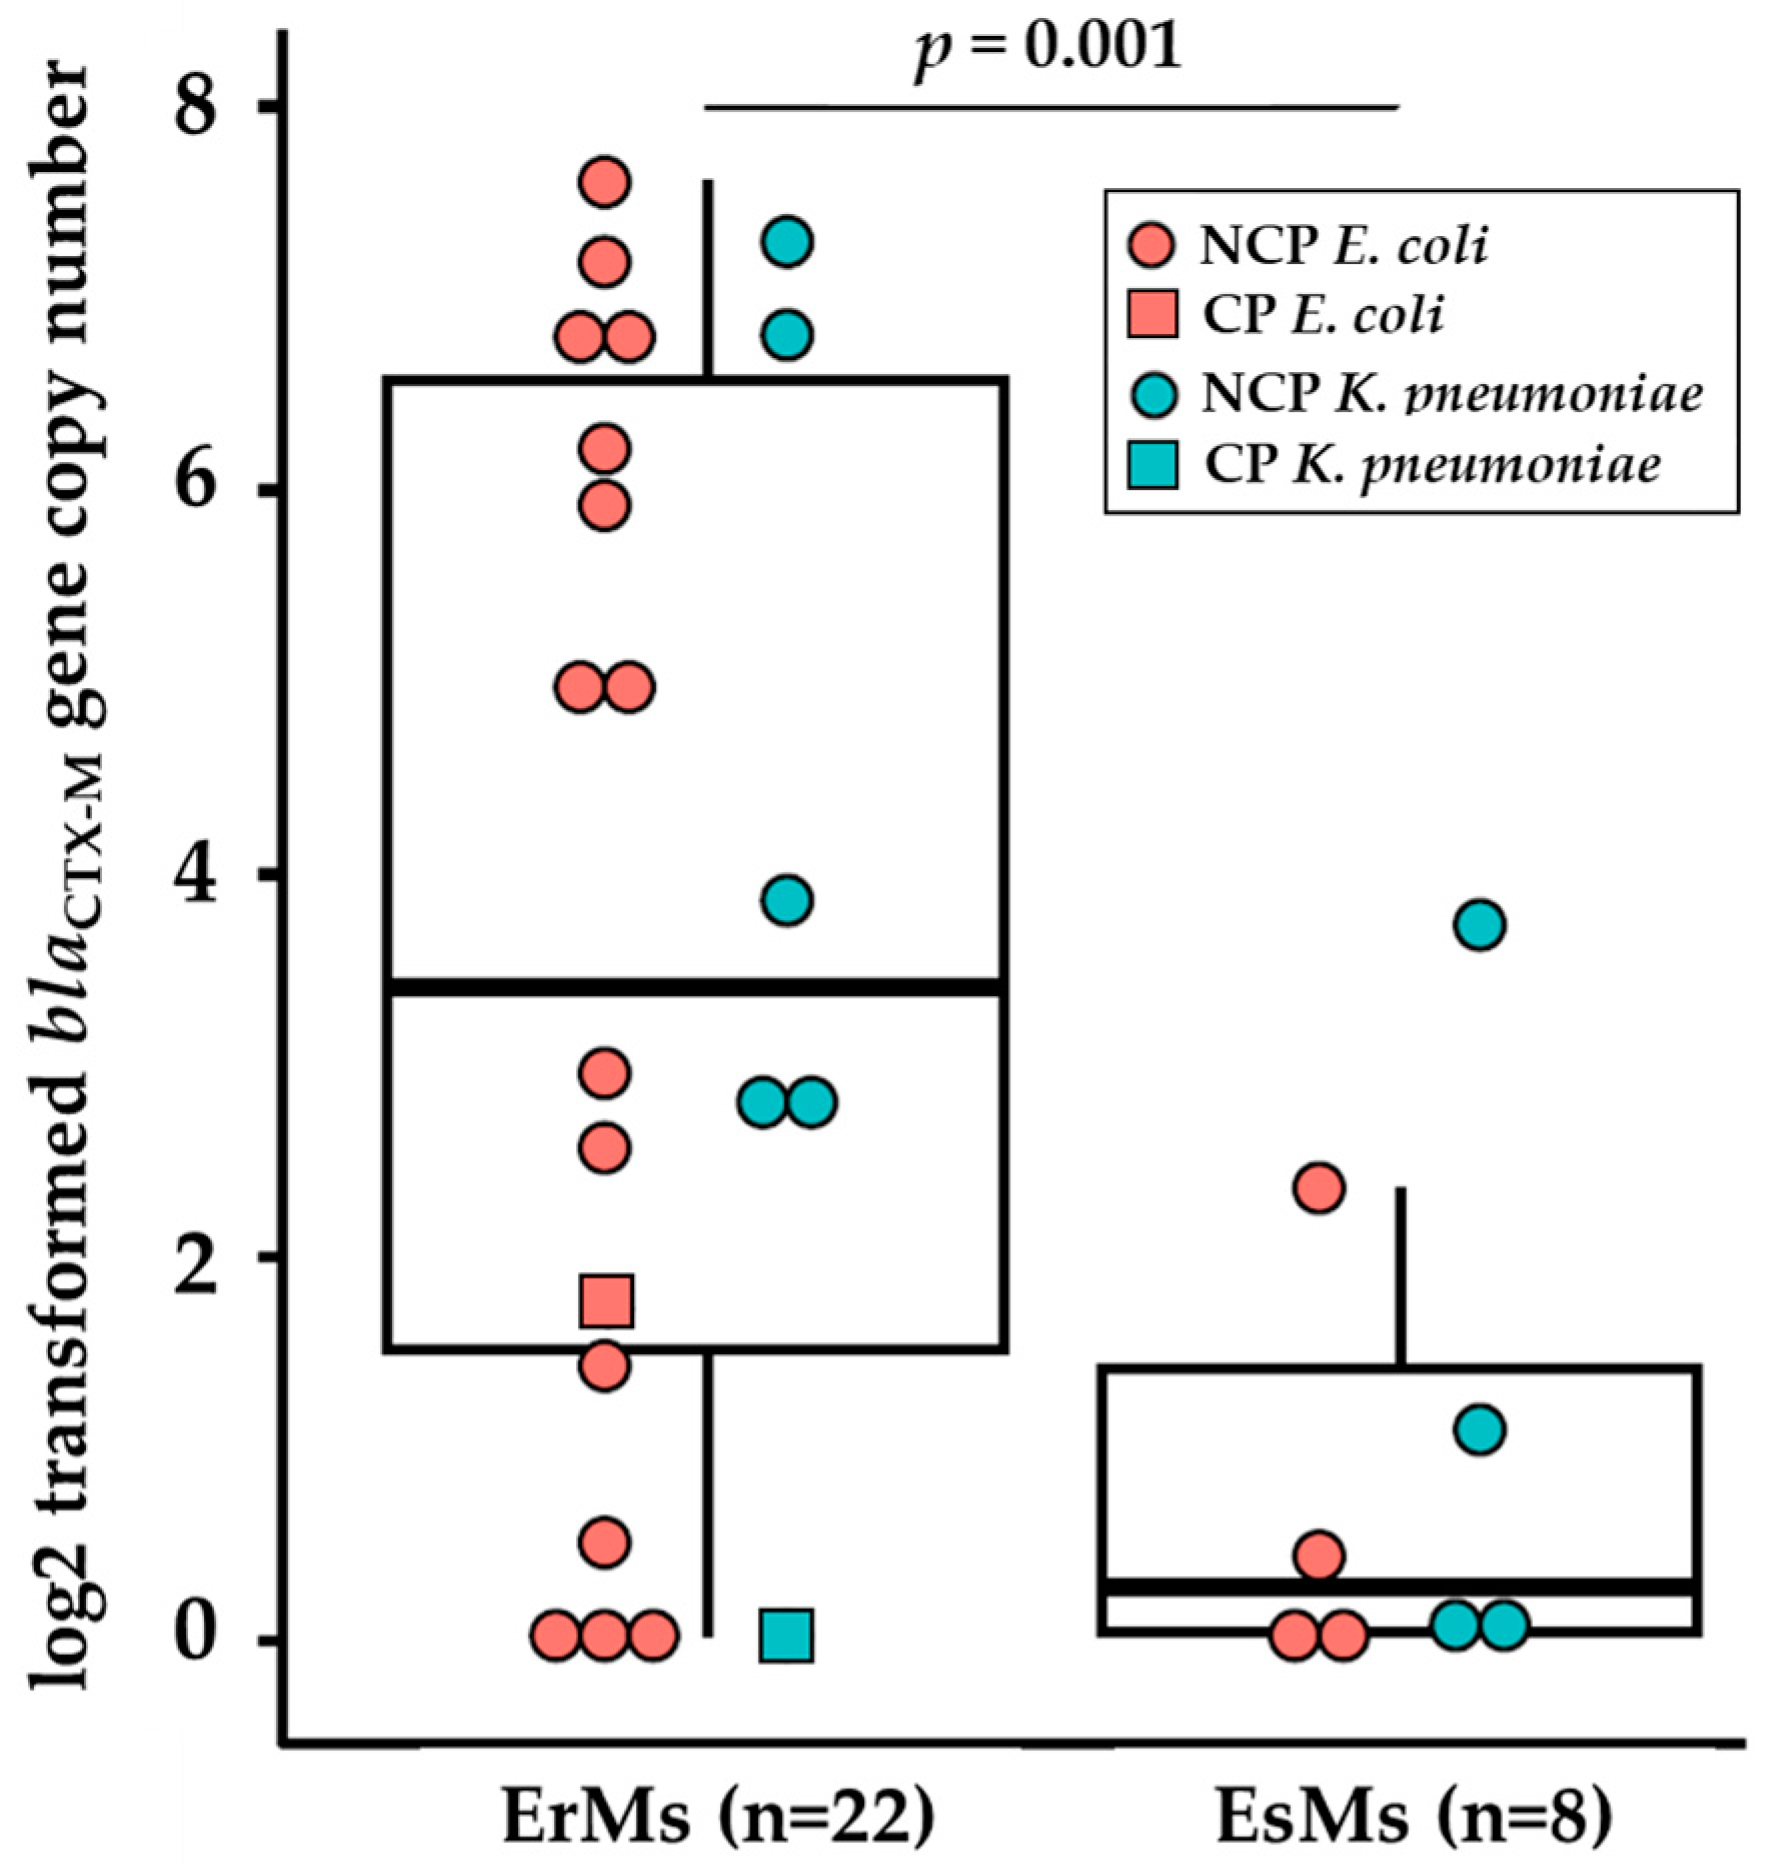
2.4. Ertapenem-Resistant E. coli and K. pneumoniae Carry Elevated Copies of blaCTX-M Genes

The relative copy number (ΔCt) of blaCTX-M, blaOXA-1/9, blaSHV, blaTEM, blaCMY, and blaKPC genes were quantified in a subset of eight E. coli and K. pneumoniae ErMs (EC12, EC30, EC31, EC35; KP10, KP38, KP45, and KP54) and eight ceftriaxone-resistant ESBL clinical strains which were ertapenem- and meropenem-susceptible (EsMs) (EC87, EC88, EC89, EC92; KP85, KP86, KP90, and KP91) (Table 4; Supplemental Data S2, Table S4) using quantitative polymerase chain reaction (qPCR). A species-specific primer for the rpsL gene was used as the control gene in both ErMs and EsMs strains. Fold copies were calculated with the formula ΔCt = 2(CTrpsL − CTtarget) relative to rpsL of the same isolate. Overall, the largest copy number difference between the two phenotypes was in blaCTX-M, with a mean difference of 12-fold more log2-transformed copies in ErMs (17.1 vs. 4.8; see Table 4). The mean differences between all other targeted genes were within one log2-transformed fold. All blaCTX-M-positive ErMs E. coli (4/4) and K. pneumoniae (3/4) co-harbored blaOXA-1, blaSHV, and/or blaTEM. All ErMs harbored blaTEM, regardless of species. This is in contrast to EsMs, where the majority (5/8) were blaTEM negative. blaSHV was solely harbored by K. pneumoniae, regardless of phenotype. blaCMY was detected in one ErMs and two EsMs. blaKPC was detected in two ErMs, EC12, a clinical strain, and KP54, an ATCC strain with a distinct subpopulation of KPC producers (Klebsiella pneumoniae (Schroeter) Trevisan BAA-1903; https://www.atcc.org/api/pdf/product-sheet?id=BAA-1903, accessed on 29 June 2023).
Based on these data, we quantified the log2-transformed ΔΔCt of blaCTX-M among a larger set of ErMs, using the formula ΔΔCt = 2(ΔCTcontrol − ΔCTtarget). The EsMs E. coli isolate EC87 was used as the blaCTX-M control strain as it harbored a single copy of blaCTX-M relative to rpsL with a log2 ΔΔCt of zero. We examined sixteen ErMs E. coli (Figure 2), six ErMs K. pneumoniae, four EsMs E. coli, and four EsMs K. pneumoniae. Overall, 82% (18) of the 22 ErMs harbored blaCTX-M-15 or blaCTX-M-14, while the four remaining ErMs had no detectable blaCTX-M (Figure 2). Furthermore, ErMs isolates harboring blaCTX-M carried 4-fold more log2-transformed copies of blaCTX-M than ceftriaxone-resistant EsMs (3.7 vs. 0.9, p < 0.001) across both species and carbapenemase status. Interestingly, NCP-ErMs had 3-fold more blaCTX-M copies than CP-ErMs (4.0 vs. 0.8) (Figure 2).

2.5. Porin Alterations Are Frequent among Ertapenem-Resistant NCPE E. coli

Porin and efflux genes of E. coli (ompC, ompF, and tolC) and K. pneumoniae (ompK35, ompK36, and oqxA) were identified and quantified using qPCR relative to rpsL across the same eight ErMs and eight EsMs (Table 4). Porin genes were detected in all strains except two K. pneumoniae EsMs, which had no detectable ompK35 (KP86 and KP91). Across all tested strains, there were 0.7-fold more log2-transformed fold copies of porin genes relative to rpsL, ranging from 0.0 to 1.8-fold. Comparing ΔCt of all porins regardless of species, ErMs had more log2-transformed fold copies than EsMs (0.89× vs. 0.51×; p = 0.001). No porin copy number difference was identified when stratified by species alone. The chromosomal efflux gene of E. coli (tolC) and the plasmid efflux gene of K. pneumoniae (oqxA) were also examined with qPCR. All isolates had detectable efflux genes except KP85. The mean log2-transformed copies of efflux genes were 0.97, ranging from undetectable to 1.9-fold higher than rpsL. The overall strength of the relationship between ΔCt of ompC and blaCTX-M among all eight isolates was moderately positive (R2 = 0.4), with ertapenem-resistant strains showing less correlation (EsMs vs. ErMs; 0.8 vs. 0.3), particularly at blaCTX-M ΔCt > 10 (Table 4; Supplemental Data S2, Figure S5).
The above analysis indicates that minimal differences in porin gene copy numbers were observed between ErMs vs. EsMs; we next evaluated sequence mutations outside of the qPCR primer sequence that may be present at different rates. In order to examine this, we aligned short-read sequences to a reference genome, E. coli str. K-12 substr. MG1655 (GenBank Accession: U00096) and K. pneumoniae CP000647. Porin gene alterations were then translated and categorized into three major amino acid variant categories, including (1) insertions and/or deletions, (2) frameshifts, or (3) premature stops.
Amino acid variants in ompF-like (ompF/ompK35) and ompC-like (ompC/ompK36) porin genes in CP-ErMr and NCP-ErMs E. coli and K. pneumoniae isolates are summarized in Table 5. Results were stratified by species as distinct porin alteration rates occur between E. coli vs. K. pneumoniae. All eight (100%) of ErMs K. pneumoniae were NCP, while 76% (16/21) of the E. coli ErMs were NCP, and 24% (5/21) of E. coli ErMs harbored blaKPC-2, blaKPC-3, or blaNDM-5.
Overall, porin variants were not detected in any of the CP-ErMr E. coli and in only 3.6% of the CP-ErMr K. pneumoniae. A translated amino acid alteration from either ompC or ompF sequences was significantly more frequent in NCP-ErMs E. coli than CP-ErMr E. coli (p = 0.002). Contrastingly, translated porin gene alterations were both more frequent and similar in alteration type (insertion/deletion, frameshift, and premature stop) in NCP-ErMs vs. CP-ErMr K. pneumoniae isolates, regardless of porin gene type (ompK35 or ompK36).
In K. pneumoniae, premature stop codons in ompK35 or ompK36 genes occurred in 89% and 100% of CP-ErMr and NCP-ErMs isolates, respectively, with similar rates in individual porin genes. The most frequent premature stop codon positions in ompK35 porin genes were p213* and p89*, occurring in 30% and 26%, respectively. In ompK36 genes, p271* was the most frequent position of a premature stop codon. Concurrent ompK35 and ompK36 premature stop codons occurred in 57% (27/47) of all K. pneumoniae isolates. In addition, insertion/deletion (indel) and frameshift alterations occurred at similar rates in ompK36 genes, regardless of carbapenemase status and phenotype. This is in contrast to ompK35, which was free of any indels or frameshifts among CP-ErMr and NCP-ErMs K. pneumoniae (Table 5).
All NCP-ErMs E. coli contained frameshift alterations, whereas these were not observed in either of the two CP-ErMr E. coli isolates (100% vs. 0%; p = 0.002; Table 5). Frameshifts were detected in ompC or ompF in 88% and 50% of NCP-ErMs E. coli, respectively. Similarly, ompC or ompF indels occurred in 63% of NCP-ErMs E. coli and none of the CP-ErMr E. coli. A premature stop codon was detected in one E. coli, which occurred in the ompC gene of an NCP-ErMs isolate.
In addition to these major translated porin gene alterations (indel, frameshift, and premature stop), translated missense amino acid changes were mapped to the protein databank (PDB) coordinate files of OmpF, OmpC, OmpK35, and OmpK36 (PDB: 4GCS, 7JZ3, 5o77, and 6RD3). The non-synonymous residue alterations predominantly related to external facing vestibular loops, including Loop 3, within OmpC/OmpK36 and OmpF/OmpK35 (Supplemental Data S2, Figure S2). In addition, frameshift mutations occurred most frequently within the Loop 4-β8-Loop 5 extracellular facing vestibule region, primarily in NCPE isolates. Of note, a GG, PT, or the previously reported GGD insertion within the conserved Loop 3 region (amino acid positions 133–136) of OmpK36 occurred solely among the K. pneumoniae clones 258 and 307, while E. coli Loop 3 nucleotides contained various missense changes only.
Overall, the frequency and type of translated porin alterations among ErMr and ErMs K. pneumoniae were not different. In contrast, ertapenem resistance seems to be related to ompC alterations among NCP-ErMs E. coli. Next, the coverage of the ompC gene was assessed in 26 E. coli (20 NCP, 6 CP) by viewing the mapped reads coverage and annotating low coverage areas, defined as areas where coverage falls below two standard deviations from the mean coverage (Table 6, Supplemental Data S2, Figure S4, and Supplemental Data S4). Of the E. coli genomes visualized, 62% (16/26) had a no-to-low read coverage region within the ompC gene averaging 103 ± 61 bp long, ranging from 7 bp to 173 bp in length across all visualized genomes. MG1655 K12 E. coli was used as mapping reference; accession: U00096 (Nucleotide [Internet]. Bethesda (MD): National Library of Medicine (US), National Center for Biotechnology Information; [1988]—[accessed on 11 November 2023]. Available from: https://www.ncbi.nlm.nih.gov/nuccore/U00096.2, accessed on 11 November 2023).
Table 6. Summary of ErMs E. coli blaCTX-M copy number, ompC contig coverage, and OmpC status.
IDCarbapenemase
Status
blaCTX-M Δ∆Ct AContig Coverage B at
K12 ompC
OmpC
Band C
EC12CP
(blaKPC)
+1.7No gap
(Full coverage)
Detected
EC14CP
(blaKPC)
+0.5No gap
(Low at c.539–c.545)
Detected
EC13CP
(blaKPC)
+5.0No gap
(Full coverage)
ND
EC75CP
(blaKPC)
NDNo gap
(Full coverage)
Detected
EC30NCP+6.2149 bp gap
(c.424—c.531)
ND
EC31NCP+2.929 bp gap
(c.544–c.531)
ND
EC35NCP+5.9144 bp gap
(c.429–c.531)
ND
EC2NCP+4.9149 bp gap
(c.424–c.531)
ND
EC3NCP+6.6173 bp gap
(c.416–c.515)
ND
EC32NCP+1.4150 bp gap
(c.424–c.530)
ND
EC33NCP+7.5149 bp gap
(c.424–c.530)
ND
EC34NCPND139 bp gap D
(c.434–c.531)
ND
EC36NCP+7.1140 bp gap
(c.434–c.530)
ND
EC4NCP+6.8No gap
(Full coverage)
ND
EC6NCP+2.5141 bp gap
(c.431–c.532)
ND
EC66NCPND149 bp gap
(c.424–c.531)
ND
Summary of ErMs E. coli blaCTX-M copy number variations, ompC mapped reads coverage, and OmpC expression status. A Δ∆Ct = 2(CTcontrol−CTtarget) was used to calculate copy number, using rpsL gene as the control gene and EC87 (a ceftriaxone-resistant but ertapenem- and meropenem-susceptible (EsMs) strain) as the control strain. B Contigs were de novo assembled, dissolved, and mapped to K12 (accession: U00096). If multiple gaps were detected, the largest was reported. C Total protein was prepared as a lysate, normalized, electrophoretically separated on a 4–15% gel, and detected with anti-OmpC rabbit antibodies (Figure 3a). D In addition to the noted ompC gap, EC34 had a 5570 bp gap spanning from c.343 of ompC to adjacent genes downstream. Abbreviations: BP: base pair; CP: carbapenemase-producing; NCP: non-carbapenemase-producing; ND: not detected.
Figure 3. Immunodetection of OmpC and OmpF in ertapenem-resistant E. coli clinical strains. Total proteins were resolved by 4–15% SDS-PAGE. The proteins were electro-transferred to nitrocellulose membrane and immunodetected with polyclonal antibodies directed against denatured OmpC and/or OmpF porins. Only the relevant part of the blot is shown. (a) Immunodetection of OmpC in ertapenem-resistant, meropenem-susceptible (ErMs) E. coli clinical strains (n = 16). Isolates EC87*, EC88*, EC89*, and EC92* are ertapenem-susceptible, ceftriaxone-resistant (EsMs) E. coli clinical isolates. ATCC 2340 was used as positive control. Thick black arrows indicate molecular weights, and thin black arrows indicate the region of OmpC. (b) Immunodetection of OmpF and OmpC in ErMs E. coli clinical strains (n = 9). Thick black arrows indicate molecular weight, and thin black arrows indicate the region of OmpF.
Antibiotics 13 00185 g003
ompC lesions were highly similar among all strains, spanning from c.416 to c.554, with c.531 occurring at the terminal end of the gap in 50% of sequences. NCP-E. coli represented 77% (20/26) of the visualized sequences and made up 94% (15/16) of the sequences with ompC coverage gaps (Table 6). ErMs and ErMr made up 81% (13/16) and 19% (3/16) of these ompC lesioned strains, respectively. Despite this, the frequency of ompC alignment gaps among ErMs (13/21) vs. ErMr (3/5) E. coli was not significantly different. Of the 10 strains that had complete ompC coverage (no hits on the low coverage annotation track; EC-4, 12, 13, 14, 22, 23, 29, 67, 69, and 75), the majority were CP (60%) comprising one CP-ErMr (EC23) and five CP-ErMs (EC-12, 13, 14, 22, and 75). No ompC lesions were noted in four NCP E. coli (EC-4, 29, 67, and 69). Overall, this highlights a distinct ompC genomic structure among CP vs. NCP E. coli. The lack of ompC lesions among visualized CP-E. coli, regardless of blaKPC or blaNDM, is contrasted with their occurrence in the majority of NCP-E. coli isolates (0% vs. 80%, respectively; p < 0.001), indicating an important role of ompC genetic disruption among NCP E. coli.

2.6. Ertapenem-Resistant E. coli Lack OmpC Outer Membrane Protein

Although ompC genetic lesions seem to be related to E. coli’s non-carbapenemase-producing status rather than carbapenem phenotype (i.e., ErMs vs. ErMr), the level of OmpC protein expression among ErMs is unknown. To examine OmpC outer membrane protein abundance among ErMs, we used sodium dodecyl sulfate–polyacrylamide gel electrophoresis (SDS-PAGE) and immunodetection with anti-OmpC and anti-OmpF primary antibodies (ThermoFisher). Major porin OmpC presence/absence was evaluated in a subset of 16 representative ErMs E. coli isolates with four EsMs E. coli as OmpC control strains (EC87, 88, 89, and 92). These EsMs clinical strains were used as controls as they carried qPCR-confirmed blaCTX-M yet remained ertapenem-susceptible. Overall, 4 of the ErMs isolates were CP-ErMs E. coli (3 blaKPC-2 and 1 blaKPC-3), while 12 were NCP-ErMs E. coli. See Table 6 for a summary of genomic and immunodetection results.
All four control EsMs had detectable OmpC bands (Figure 3a). OmpC was not detected in 81% (13/16) of tested ErMs E. coli. The three lanes in which OmpC was detected were loaded with EC12, EC14, and EC75, which are all blaKPC-producing ErMs E. coli. In fact, 75% (3/4) of the electrophoretically separated CP-ErMs E. coli lysates had a detectable OmpC band. Furthermore, the one CP-ErMs that did not have a detectable OmpC band (EC13) had 5-fold more genetic copies of blaCTX-M-15 than the EsMs control (Table 6). NCP-ErMs E. coli made up 75% (12/16) of the samples tested for OmpC separation (EC-2, 3, 4, 6, 30, 31, 32, 33, 34, 35, 36, and 66). No OmpC band was detected in any of these samples.
A combination of anti-OmpF and anti-OmpC primary antibodies (multiplexed) were used on representative ErMs E. coli isolates and ATCC 2340 (Figure 3b). It is evident that a band below OmpC (40 kDa) and around 37 kDa was visible in 6/9 of the isolates (EC2, EC13, EC30, EC31, EC32, and EC33). However, the other three isolates (ATCC 2340, EC12, EC22, and EC69) had very strong signals despite protein concentration normalization, making the OmpC/F distinction difficult to interpret.

3. Discussion

To thwart the potential mistreatment of patients inflicted with NCPE and/or ErMs CRE infections, more insight into the anti-carbapenem resistance mechanisms employed by these nefarious pathogens is urgently needed. This is especially true for infectious diseases caused by ErMs—a phenotype with significant clinical implications.
This study revealed that ErMs E. coli genomes contain more total MGEs counts than EsMs (Figure 1A), particularly blaCTX-M associated MGEs, including IS26, IS26 composite transposon, ISVsa5 (=IS10R), ISEc9, and Tn801 (Figure 1B,C). These MGEs were found to be either interposed by or directly adjacent to blaCTX-M in ErMs E. coli. IS26 is recognized for its frequent mobilization of antimicrobial resistance genes as “translocatable units,” inserting them adjacent to other IS26 copies in Gram-negative bacteria. The blaCTX-M genes are often associated with IS26-interrupted transposable elements positioned upstream from ISVsa5, synonymous with IS10R, the active element in the plasmid-associated transposon Tn10 [14]. Moreover, IS10R has demonstrated internal promoter regions in previous work [14]. As ISVsa5 was uniquely significantly more abundant among ErMs than either EsMs or ErMr strains, this insertion sequence may be playing a significant role in regulating blaCTX-M expression in ErMs E. coli. Additionally, qualitative results of blaCTX-M (presence/absence) in patient samples may be insufficient—rather, it is necessary to quantify the number of copies harbored by E. coli and K. pneumoniae as elevated copies can relate to ertapenem resistance (Figure 2). This is in contrast to carbapenemases, where determining the presence/absence of the gene seems to be sufficient to relate to ertapenem resistance, as single copies were able to produce ertapenem and meropenem resistance efficiently.
In conjunction with blaCTX-M expression, OmpC loss is evidently critical for the development of the ErMs phenotype among E. coli, as 75% of ErMr and 100% of EsMs but none of the ErMs isolates maintained OmpC (Figure 3a). Additionally, all blaKPC producers with a single blaCTX-M copy had detectable OmpC bands, but when multiple blaCTX-M copies were detected (5-fold more than EsMs), no OmpC was detected in one isolate (EC13) (Figure 3a, Table 6). Taken together, this provides evidence that a collaborative effort between blaCTX-M and OmpC occurs to result in ertapenem but not meropenem resistance and NCP E. coli (Figure 4).
As blaCTX-M seems to be a less efficient carbapenem hydrolyzing enzyme than blaKPC and blaNDM (Table 4), insertion sequence disruption or other events may be triggered to disrupt OmpC expression. As ompC genomic lesions were more associated with NCP status than with ertapenem phenotype (i.e., ErMs vs. ErMr), it is more likely that the ErMs phenotype is an outcome of transcriptional or translational regulation. Another related potential cause of OmpC loss among the ErMs E. coli immunoblotted (Figure 3) is that 50% (8/16) of the isolates came from urinary sources (Supplement Data S2, Table S3), and seven out of those eight (88%) had no detectable OmpC. The previous literature has demonstrated that high osmolarity can cause the transcriptional downregulation of outer membrane proteins via the envZ/OmpR system [15,16]. However, in these environments, OmpF tends to be more labile than OmpC. Loss of OmpF seems to be less critical for the development of ErMs E. coli as the majority maintained a visible OmpF band (Figure 3b).
Within this CRE collection, E. coli was NCPE and/or had an ErMs phenotype more frequently than K. pneumoniae (Table 2). The fact that 72% (21/29) of the collected E. coli displayed an ErMs phenotype has important implications for current practice, as ertapenem susceptibility is selectively “suppressed” or not reported on microbiological reports coinciding with antimicrobial stewardship efforts to reduce ertapenem use in some hospitals [17]. Not reporting the ertapenem phenotype may lead to mistreatment of patients infected with this CRE subtype. As ESBL-producing Enterobacterales (ESBL-E) are on the rise in our area and globally, it may be prudent to test and report ertapenem results along with reducing the use of cephalosporins, like ceftriaxone, to possibly foil the rise of blaCTX-M copy number variant ErMs strains.
K. pneumoniae was more commonly carbapenemase-producing, with blaKPC being the most prevalent carbapenemase among the species (Table 2). In addition, blaSHV and blaTEM genes were amidst K. pneumoniae genomes more frequently than E. coli genomes. blaOXA-1/9 genes were also more commonly associated with CPE than NCPE. These co-harbored β-lactamase genes have been reported previously and seem to mobilize on modular genomic elements regularly [18,19]. In addition, blaOXA-1/9 has been previously associated with piperacillin–tazobactam resistance [10,19], which was reflected in this collection. Specifically, 10/12 (83%) of the blaOXA-1/9 positive ErMs were piperacillin–tazobactam-resistant. All blaOXA-1/9 positive ErMs co-harbored blaCTX-M-15.
These data also provide insight into the enzymatic efficiency of β-lactamases across the Ambler classes. A pattern of increased hydrolysis was measured in pathogens harboring blaCTX-M, blaKPC, and blaNDM. Excluding isolates that co-harbored any two of these three enzymes, an average meropenem hydrolysis rate was (−0.9 ng/mL-hour) for blaCTX-M positive isolates and (−1.2 ng/mL-hour) for blaKPC positive isolates; a 1.3 times increase in hydrolysis in blaKPC vs. blaCTX-M carrying isolates. All blaNDM positive isolates co-harbored blaCTX-M, with two of these isolates achieving loss of meropenem below the lower limit of quantitation (LLQ) within the first hour. Examining the three NCPE-tested isolates, a 1.8 times increase of meropenem hydrolysis was measured in blaCTX-M (EC5 and EC201) vs. non-blaCTX-M (EC68) carrying isolate(s). These data suggest that the canonical attribution of “non-carbapenemase” to be reconsidered for blaCTX-M positive isolates, as blaCTX-M copy number variant strains can result in carbapenem hydrolysis and resistance.
In order to apply these findings to future work, it is important to consider the limitations associated with this study. Although we hypothesize that OmpC loss seems to be driven by genetic lesions which result in coverage gaps within the mid-range of the gene, this phenomenon can occur from many biological or environmental mechanisms, including mobile genetic element mediated disruption of ompC [10] and osmolarity. In addition, depending on the reference genome used to map contigs against, different coverage scores could be seen. When reviewing the multiplexed immunoblot (Figure 3b), the primary antibodies used may have some cross-reactivity due to the similarity of epitopes; however, when used alone (Figure 3a), the molecular weights aid in qualitative analysis of the bands. In terms of LC-MS/MS assays, β-lactams are very labile chemicals as they are prone to hydrolyzation unless stringent protocols are followed. Because of this, meropenem hydrolysis results may have been susceptible to non-β-lactamase degradation. It was attempted to control for by nulling out baseline hydrolysis of the parent molecule. Also, the contribution of a single β-lactamase is difficult in clinical isolates, which harbor multiple classes of β-lactamases without working with isogenic strains. Also, since the β-lactamase copy number was not calculated in these nine isolates, it is unclear if increased copies of these genes affected the meropenem hydrolysis rates, although most studies do not determine copy number variation in β-lactamase genes. In terms of clinically relevant limitations, the fact that a large portion of the collected CRE was from urinary sources makes extrapolation to non-urinary infections difficult. Moreover, there may be host and epidemiological features that predispose certain individuals [20,21,22] as well as unique vs. shared factors associated with specific sub-phenotypes of CRE that were beyond the scope of assessment [7,23,24]. Finally, we applied a wide array of techniques, including short-read, whole genomic data in conjunction with LC-MS/MS, qPCR, and Western blotting techniques to provide molecular characterization of ErMs E. coli and K. pneumoniae. However, there is a pressing need for the development of rapid and efficient diagnostic platforms that can be seamlessly integrated into clinical practice to enhance outcomes associated with these resistant pathogens [25,26].
In conclusion, the ErMs phenotype seems to be related to elevated gene copies of blaCTX-M-14 and blaCTX-M-15, especially when concurrently present with ompC genetic lesions and loss of OmpC production. Future efforts to characterize the molecular mechanisms that promote OmpC loss and quantification of blaCTX-M among CRE will potentially improve patient care and mitigate further expansion of ertapenem resistance among patients afflicted with E. coli and/or K. pneumoniae infections.

4. Materials and Methods

4.1. Bacterial Isolates and Antimicrobial Susceptibility Testing

Carbapenem-resistant E. coli (n = 29) and K. pneumoniae (n = 47) isolates were examined from a previously collected biorepository of 99 CRE from 85 unique patients admitted to five different hospitals in South Texas, USA, between 2011 and 2019. Clinical isolates were stored at the time of carbapenem resistance discovery following Clinical and Laboratory Standards Institute (CLSI) standards and clinical laboratory procedures (e.g., positive Modified Hodge test, rapid antimicrobial resistance gene detection) (CLSI M100-ED33:2023 Performance Standards for Antimicrobial Susceptibility Testing, 33rd Edition). All isolates were initially speciated via biochemical assays and/or mass spectrometry at the clinical laboratory. Repeat confirmatory speciation was determined via WGS-KMER analysis. Abiding by current CDC definitions, CRE in this study was defined as Enterobacterales isolates resistant to any carbapenem or determined to be carbapenemase positive. The in vivo sources of the isolates varied (Supplement Data S2, Table S3). MICs of the isolates at the time of patient hospitalization were abstracted from electronic medical records and confirmed with microdilution susceptibility testing using the Sensititre™ Gram-Negative GNX2F AST Plate. Discrepancies in phenotypes were present among a small number of isolates (~2%), which were primarily K. pneumoniae and were interpreted as ErMs in the medical chart but ErMr upon repeat testing. These isolates were annotated as ErMr in downstream analysis. Carbapenem non-susceptibility was defined based on CLSI breakpoints: ertapenem- and meropenem-susceptible but ceftriaxone-resistant (EsMs): ertapenem ≤ 0.5 mcg/mL, meropenem MIC ≤ 1 mcg/mL and ceftriaxone MIC ≥ 4 mcg/mL; ErMs: ertapenem ≥ 1 mcg/mL and meropenem MIC ≤ 1 mcg/mL (ertapenem intermediate breakpoint annotated as resistant); ertapenem- and meropenem-resistant (ErMr): ertapenem ≥ 2 mcg/mL and meropenem MIC ≥ 4 mcg/mL (CLSI M100-ED33:2023 Performance Standards for Antimicrobial Susceptibility Testing, 33rd Edition). CRE with carbapenemase genes detected were termed CPE; those without carbapenemase genes were termed NCPE. E. coli strains ATCC 25922, and BAA-2340 were used as carbapenem-susceptible and carbapenem-resistant (blaKPC-producing) controls, respectively. K. pneumoniae strains BAA-1705, BAA-1706, and BAA-1903 were used as blaKPC-producing, non-carbapenemase-producing and ErMs controls, respectively.

4.2. Whole Genome Sequencing

For WGS, total bacterial DNA was extracted using a DNeasy PowerSoil kit (Qiagen, Redwood City, CA, USA). For qPCR, genomic and plasmidic DNA were extracted by following the CDC boil BacDNA Lysate protocol. WGS was conducted on all isolates using a NextSeq 500 sequencing instrument (Illumina Inc., San Diego, CA, USA) with 150-base paired-end reads (UT Health San Antonio, San Antonio, TX, USA), as previously described [7,27,28]. All short-read data and metadata were deposited in the NCBI BioProject (PRJNA1049776). Briefly, de novo assembly, variant analyses, and contig coverage visualization were conducted using CLC Genomics Workbench 20.1 (Qiagen, Redwood City, CA, USA) and Geneious Prime® 2023.1.2. For assigning bacterial species, multilocus sequence typing (MLST) was performed using KmerFinder Database version 3.0.2 [13,29,30] and MLST 2.0 [31,32,33,34,35,36,37]. The identification of antimicrobial resistance genes and point mutations in CRE isolates was accomplished via the use of PointFinder and ResFinder version 4.1 [11,12,13]. Core genome alignments were generated via the alignment of short-read sequences to reference genome, E. coli str. K-12 substr. MG1655 (GenBank Accession: U00096) and K. pneumoniae CP000647. OmpC, OmpF, OmpK35, and OmpK36 amino acid changes were visualized and mapped to tertiary protein databank structures (7JZ3, 4GCS, 5o77, and 6RD3) using the molecular graphics program VMD [38]. ompC coverage gaps for all 29 E. coli Illumina paired-end-read files were trimmed, merged, normalized, and de novo assembled into contigs. Assembled contig lists of all 29 E. coli resulted in an average N50 of 59,489 base pairs (bp) long and an average sum contig length of 7,355,703 bp. Other assembly features are summarized in Supplement Table S4. Contig lists were dissolved and mapped against MG1655 K12 E. coli reference genome (accession: U00096).

4.3. Immunodetection and Sample Preparation

Samples from overnight growth in CAMH broth with ertapenem (1 ug/mL) were pelleted and solubilized in 200 uL water. Cell lysis was then accomplished via three rounds of freeze–thaw cycles, sonication, and boiling at 100 °C for 8 min. Bacterial protein lysate concentrations were determined with BCA Protein Assay Kit (Pierce), and samples were normalized to 1.2 ug/mL and then separated by electrophoresis with BIO-RAD Mini-PROTEAN TGX Stain-Free Gels with 4–15% polyacrylamide for an hour at 150V. Bands were transferred onto nitrocellulose membranes at 25 V for 50 min. Membranes were then blocked with 1% gelatin in 1× transfer buffer solution with tween (TBST) and anti-OmpC or anti-OmpF antibodies (ThermoFisher) overnight at 4 °C on a shaker. The membrane was then washed three times with ddH2O and subjected to a secondary antibody reaction with the BioRad Immuno-Blot Assay Kit (Goat anti-rabbit IgG) by diluting goat anti-rabbit secondary antibodies in gelatin buffer solution and rocking at 20 °C for 60 min. Membranes were washed three times with TBST solution and developed alkaline phosphatase.
In an effort to understand osmolarity-related effects of porin band intensity on included isolates, representative CRE clinical strains were grown in three different broths, ranging in osmolarity, including high salt Luria–Bertani Miller (LB) Millers broth (highest osmolarity), cation-adjusted Mueller–Hinton (CAMH) (low-moderate osmolarity), and nutrient broth (low osmolarity). No differences were seen in OmpC or OmpF bands between media, including in the ATCC reference strains (Supplement Data S2; Figure S3). Thus, CAMH was used solely for currently reported experiments. Four ertapenem- and meropenem-susceptible (EsMs) but ceftriaxone-resistant E. coli clinical isolates collected from blood sources were used as OmpC controls (Figure 3). In addition, ATCC 2340, a meropenem-resistant, blaKPC-producing CLSI control strain, was used as the reference for porin protein bands.

4.4. qPCR of β-lactamase Genes

To determine gene copy numbers, SYBR Green qPCR was performed using primers and a microplate reader (BioRad). The copy number was calculated using the formula ∆Ct = 2(CTcontrol−CTtarget) and the mean plate Cq value for rpsL as the control gene [10,39]. Primers used for qPCR included a blaCTX-M-15 specific primer: 5′-ATGGATGAAAGGCAATACCA-3′ with an estimated amplicon size of 175 nucleotides (this study). In addition, a Group-1 blaCTX-M primer: 5′-ATGGTTAAAAAATCACTGCG-3′ and Group-9 blaCTX-M primer: 5′-ATGGTGACAAAGAGAGTGCA-3′ were used to both capture any addition blaCTX-M genes within the groups as well as blaCTX-M-14 within Group-9 [40]. A blaKPC primer was also used to screen ErMs isolates: 5′-TGTCACTGTATCGCCGTCTA-3′ (this study). Other primers included blaOXA-1: 5′- ACGTGGATGCAATTTTCTGT-3′ (this study), blaSHV: 5′-GCCGCTTGAGCAAATTAAAC-3′ (this study), blaTEM: 5′-CTGTTTTTGCTCACCCAGAA-3′ (this study), E. coli rpsL: 5′-ACCACCGATGTAGGAAGTCA-3′ (this study), and K. pneumoniae rpsL: 5′-GACCTTCACCACCGATGTAG-3′ (this study). All performed equally well, with 100% agreement with WGS data.

4.5. Sample Preparation for LC-MS/MS Analysis

The bacterial strains were grown on tryptic soy agar (TSA) with 5% sheep blood for 24 h at 37 °C. A single bacterial isolate was transferred to cation-adjusted Mueller–Hinton broth (CA-MHB). The cultures were incubated and shaken for 18 h. At the end of incubation, an (OD600) MacFarland 0.5 standard concentration was prepared with each inoculum. A meropenem–vaborbactam E-TEST strip (MEV [64/8 ug/mL]) was placed into a volume of 0.8 mL CA-MHB and then shaken for 30 min at 37 °C. Standardized inoculum was then transferred (0.2 mL) to each meropenem-vaborbactam-concentrated broth and incubated while shaken. At hours 1, 4, and 18, a 0.2 mL sample volume collection was taken from the test samples and centrifuged at 12,000 RPM at 4 °C for 10 min. At the end of the centrifugation, 100 uL volume of the resulting supernatant was collected and transferred to 300 uL ice-cold methanol and 15 uL of internal standard propranolol (IS) to a concentration of 5 ug/mL. Each tube was lightly vortexed by hand for 0.2 min and then placed on ice to incubate for 10 min. The remaining volume of the supernatant for each bacterial sample was carefully removed, and the resulting bacterial cell pellets were resuspended in 100 uL of PBS pH 7.4, sonicated for 5 min, and then were processed as were the collected 100 uL supernatant samples noted above for protein precipitation and pellet sample analysis. After ice incubation, samples were mixed and then centrifuged at 12,000× g at 4 °C for 10 min. A 100 uL volume of the supernatant was then transferred to 200 uL HPLC-grade water and mixed briefly. The sample was then transferred (150 uL) to an LC-MS/MS sample injection vial for analysis. Ertapenem and imipenem proved to be too labile to accurately detect at concentrations less than 128 mcg/mL. Meropenem remained stable at lower concentrations (<10 ng/mL). The sample analysis of the abundance of meropenem, inhibitor vaborbactam, and the selected (IS) internal standard propranolol were measured using an LC-MS/MS system comprising of a ACQUITY UPLC liquid chromatogram system and a Xevo TQD, tandem triple-quadrupole mass spectrometer by Waters corporation. Additional instrumentation parameters and analysis can be found in the Supplementary Materials.

4.6. Statistical Analyses

Student’s t test or the nonparametric Wilcoxon Rank Sum test was used for continuous variables based on distribution. The chi-square or Fisher’s Exact test was used to compare categorical variables. A two-sided p-value of less than 0.05 was considered statistically significant. All analyses were completed with R (v4.1.2).

Supplementary Materials

The following supporting information can be downloaded at https://www.mdpi.com/article/10.3390/antibiotics13020185/s1. Supplemental Data S1: annotated mobile genetic elements and counts of included ErMs and EsMs; Supplemental Data S2: ErMs vs. ErMr mobile genetic element count volcano plot; OmpC alteration sites on modeled structure; SDS-PAGE and immunodetection results; LC-MS/MS analysis concentrations at time points; Standard curve and quality control/sample preparation for LC-MS/MS analysis; in vivo sources of collected ErMs E. coli and K. pneumoniae isolates; Distribution of porin amino acid alterations among E. coli and Klebsiella spp.; Mapped reads of ErMs E. coli (EC30) with coverage gap in ompC; Correlation of ompC and blaCTX-M ∆Ct relative to rpsL across EsMs and ErMs; antimicrobial susceptibility and EsMs E. coli. Supplemental Data S3: LC-MS/MS standard curve and parent molecule concentration calculations; Supplemental Data S4: Contig details of assembled ErMs E. coli used for ompC mapping.

Author Contributions

Conceptualization, C.A.B. and G.C.L.; methodology, C.A.B., R.B., S.D.D., W.S., K.Q. and G.C.L.; formal analyses, C.A.B., R.B., W.S. and G.C.L.; resources; S.D.D. and G.G.; writing—original draft preparation, C.A.B. and G.C.L.; writing—review and editing, R.B., S.M.B., S.D.D., G.G., W.S., S.A., D.F.S., K.R.R., C.R.F., J.M.K. and A.G.M.; supervision, G.C.L.; funding acquisition, G.C.L. All authors have read and agreed to the published version of the manuscript.

Funding

This study was supported in part by Merck. Data were generated in the Genome Sequencing Facility, which is supported by UT Health San Antonio, NIH-NCI P30 CA054174 (Cancer Center at UT Health San Antonio), NIH Shared Instrument grant 1S10OD021805-01 (S10 grant), and CPRIT Core Facility Award (RP160732). C.A.B. was participating in a Translational Science Training T32 program (1T32TR004544-01) and was also partially supported by the National Center for Advancing Translational Sciences, National Institutes of Health, via Grant UL1TR002645, while he performed this work. G.C.L. was supported by the National Institutes of Aging (NIA/NIH K23-AG066933). The views expressed in this article are those of the authors and do not necessarily represent the views of Merck, the Department of Veterans Affairs, the National Institutes of Health, or the authors’ affiliated institutions.

Institutional Review Board Statement

This study was approved by the institutional review board of the University of Texas Health at San Antonio with a waiver of informed consent.

Informed Consent Statement

Informed consent was waived due to the retrospective nature of the study.

Data Availability Statement

Data supporting results have been deposited in the NCBI BioProject (PRJNA1049776).

Conflicts of Interest

Authors declare no conflicts of interest.

References

  1. World Health Organization. Implementation Manual to Prevent and Control the Spread of Carbapenem-Resistant Organisms at the National and Health Care Facility Level: Interim Practical Manual Supporting Implementation of the Guidelines for the Prevention and Control of Carbapenem-Resistant Enterobacteriaceae, Acinetobacter Baumannii and Pseudomonas Aeruginosa in Health Care Facilities; World Health Organization: Geneva, Switzerland, 2019. [Google Scholar]
  2. Lasko, M.J.; Nicolau, D.P. Carbapenem-Resistant Enterobacterales: Considerations for Treatment in the Era of New Antimicrobials and Evolving Enzymology. Curr. Infect. Dis. Rep. 2020, 22, 6. [Google Scholar] [CrossRef]
  3. Tracking CRE in the United States|HAI|CDC. Available online: https://www.cdc.gov/hai/organisms/cre/trackingcre.html (accessed on 31 January 2023).
  4. Karlsson, M.; Lutgring, J.D.; Ansari, U.; Lawsin, A.; Albrecht, V.; McAllister, G.; Daniels, J.; Lonsway, D.; McKay, S.; Beldavs, Z.; et al. Molecular Characterization of Carbapenem-Resistant Enterobacterales Collected in the United States. Microb. Drug Resist. 2022, 28, 389–397. [Google Scholar] [CrossRef]
  5. Lee, Y.Q.; Sri La Sri Ponnampalavanar, S.; Chong, C.W.; Karunakaran, R.; Vellasamy, K.M.; Abdul Jabar, K.; Kong, Z.X.; Lau, M.Y.; Teh, C.S.J. Characterisation of Non-Carbapenemase-Producing Carbapenem-Resistant Klebsiella Pneumoniae Based on Their Clinical and Molecular Profile in Malaysia. Antibiotics 2022, 11, 1670. [Google Scholar] [CrossRef]
  6. Chea, N.; Bulens, S.N.; Kongphet-Tran, T.; Lynfield, R.; Shaw, K.M.; Vagnone, P.S.; Kainer, M.A.; Muleta, D.B.; Wilson, L.; Vaeth, E.; et al. Improved Phenotype-Based Definition for Identifying Carbapenemase Producers among Carbapenem-Resistant Enterobacteriaceae. Emerg. Infect. Dis. 2015, 21, 1611–1616. [Google Scholar] [CrossRef]
  7. Black, C.A.; So, W.; Dallas, S.S.; Gawrys, G.; Benavides, R.; Aguilar, S.; Chen, C.-J.; Shurko, J.F.; Lee, G.C. Predominance of Non-Carbapenemase Producing Carbapenem-Resistant Enterobacterales in South Texas. Front. Microbiol. 2021, 11, 623574. [Google Scholar] [CrossRef] [PubMed]
  8. Tamma, P.D.; Aitken, S.L.; Bonomo, R.A.; Mathers, A.J.; van Duin, D.; Clancy, C.J. Infectious Diseases Society of America Antimicrobial-Resistant Treatment Guidance: Gram-Negative Bacterial Infections. Infectious Diseases Society of America 2023; Version 3.0. Available online: https://www.idsociety.org/practice-guideline/amr-guidance/ (accessed on 9 December 2023).
  9. Ma, P.; He, L.L.; Pironti, A.; Laibinis, H.H.; Ernst, C.M.; Manson, A.L.; Bhattacharyya, R.P.; Earl, A.M.; Livny, J.; Hung, D.T. Genetic Determinants Facilitating the Evolution of Resistance to Carbapenem Antibiotics. eLife 2021, 10, e67310. [Google Scholar] [CrossRef] [PubMed]
  10. Shropshire, W.C.; Aitken, S.L.; Pifer, R.; Kim, J.; Bhatti, M.M.; Li, X.; Kalia, A.; Galloway-Peña, J.; Sahasrabhojane, P.; Arias, C.A.; et al. IS26-Mediated Amplification of blaOXA-1 and blaCTX-M-15 with Concurrent Outer Membrane Porin Disruption Associated with de Novo Carbapenem Resistance in a Recurrent Bacteraemia Cohort. J. Antimicrob. Chemother. 2021, 76, 385–395. [Google Scholar] [CrossRef]
  11. Zankari, E.; Allesøe, R.; Joensen, K.G.; Cavaco, L.M.; Lund, O.; Aarestrup, F.M. PointFinder: A Novel Web Tool for WGS-Based Detection of Antimicrobial Resistance Associated with Chromosomal Point Mutations in Bacterial Pathogens. J. Antimicrob. Chemother. 2017, 72, 2764–2768. [Google Scholar] [CrossRef] [PubMed]
  12. Bortolaia, V.; Kaas, R.S.; Ruppe, E.; Roberts, M.C.; Schwarz, S.; Cattoir, V.; Philippon, A.; Allesoe, R.L.; Rebelo, A.R.; Florensa, A.F.; et al. ResFinder 4.0 for Predictions of Phenotypes from Genotypes. J. Antimicrob. Chemother. 2020, 75, 3491–3500. [Google Scholar] [CrossRef] [PubMed]
  13. Clausen, P.T.L.C.; Aarestrup, F.M.; Lund, O. Rapid and Precise Alignment of Raw Reads against Redundant Databases with KMA. BMC Bioinform. 2018, 19, 307. [Google Scholar] [CrossRef] [PubMed]
  14. Martínez-García, E.; Navarro-Lloréns, J.M.; Tormo, A. Identification of an Unknown Promoter, OUTIIp, within the IS10R Element. J. Bacteriol. 2003, 185, 2046–2050. [Google Scholar] [CrossRef]
  15. Pinet, E.; Franceschi, C.; Davin-Regli, A.; Zambardi, G.; Pagès, J.-M. Role of the Culture Medium in Porin Expression and Piperacillin-Tazobactam Susceptibility in Escherichia Coli. J. Med. Microbiol. 2015, 64, 1305–1314. [Google Scholar] [CrossRef]
  16. van Boxtel, R.; Wattel, A.A.; Arenas, J.; Goessens, W.H.F.; Tommassen, J. Acquisition of Carbapenem Resistance by Plasmid-Encoded-AmpC-Expressing Escherichia Coli. Antimicrob. Agents Chemother. 2017, 61, 10–1128. [Google Scholar] [CrossRef]
  17. Delgado, A.; Gawrys, G.W.; Duhon, B.M.; Koeller, J.M.; Lee, G.C. Impact of an Antimicrobial Stewardship Initiative on Ertapenem Use and Carbapenem Susceptibilities at Four Community Hospitals. J. Infect. Dis. Ther. 2017, 5, 341. [Google Scholar] [CrossRef]
  18. Shropshire, W.C.; Dinh, A.Q.; Earley, M.; Komarow, L.; Panesso, D.; Rydell, K.; Gómez-Villegas, S.I.; Miao, H.; Hill, C.; Chen, L.; et al. Accessory Genomes Drive Independent Spread of Carbapenem-Resistant Klebsiella Pneumoniae Clonal Groups 258 and 307 in Houston, TX. mBio 2022, 13, e00497-22. [Google Scholar] [CrossRef]
  19. Livermore, D.M.; Day, M.; Cleary, P.; Hopkins, K.L.; Toleman, M.A.; Wareham, D.W.; Wiuff, C.; Doumith, M.; Woodford, N. OXA-1 β-Lactamase and Non-Susceptibility to Penicillin/β-Lactamase Inhibitor Combinations among ESBL-Producing Escherichia Coli. J. Antimicrob. Chemother. 2019, 74, 326–333. [Google Scholar] [CrossRef] [PubMed]
  20. Ahuja, S.K.; Manoharan, M.S.; Lee, G.C.; McKinnon, L.R.; Meunier, J.A.; Steri, M.; Harper, N.; Fiorillo, E.; Smith, A.M.; Restrepo, M.I.; et al. Immune Resilience despite Inflammatory Stress Promotes Longevity and Favorable Health Outcomes Including Resistance to Infection. Nat. Commun. 2023, 14, 3286. [Google Scholar] [CrossRef] [PubMed]
  21. Lee, G.C.; Restrepo, M.I.; Harper, N.; Manoharan, M.S.; Smith, A.M.; Meunier, J.A.; Sanchez-Reilly, S.; Ehsan, A.; Branum, A.P.; Winter, C.; et al. Immunologic Resilience and COVID-19 Survival Advantage. J. Allergy Clin. Immunol. 2021, 148, 1176–1191. [Google Scholar] [CrossRef] [PubMed]
  22. Teshome, B.F.; Lee, G.C.; Reveles, K.R.; Attridge, R.T.; Koeller, J.; Wang, C.; Mortensen, E.M.; Frei, C.R. Application of a Methicillin-Resistant Staphylococcus Aureus Risk Score for Community-Onset Pneumonia Patients and Outcomes with Initial Treatment. BMC Infect. Dis. 2015, 15, 380. [Google Scholar] [CrossRef] [PubMed]
  23. Lee, G.C.; Lawson, K.A.; Burgess, D.S. Clinical Epidemiology of Carbapenem-Resistant Enterobacteriaceae in Community Hospitals: A Case-Case-Control Study. Ann. Pharmacother. 2013, 47, 1115–1121. [Google Scholar] [CrossRef] [PubMed]
  24. Lee, G.C.; Hall, R.G.; Boyd, N.K.; Dallas, S.D.; Du, L.C.; Treviño, L.B.; Retzloff, C.; Treviño, S.B.; Lawson, K.A.; Wilson, J.P.; et al. Predictors of Community-Associated Staphylococcus Aureus, Methicillin-Resistant and Methicillin-Susceptible Staphylococcus Aureus Skin and Soft Tissue Infections in Primary-Care Settings. Epidemiol. Infect. 2016, 144, 3198–3204. [Google Scholar] [CrossRef]
  25. Gawrys, G.W.; Tun, K.; Jackson, C.B.; Astorga, B.; Fetchick, R.J.; Septimus, E.; Lee, G.C. The Impact of Rapid Diagnostic Testing, Surveillance Software, and Clinical Pharmacist Staffing at a Large Community Hospital in the Management of Gram-Negative Bloodstream Infections. Diagn. Microbiol. Infect. Dis. 2020, 98, 115084. [Google Scholar] [CrossRef]
  26. Bandy, S.M.; Jackson, C.B.; Black, C.A.; Godinez, W.; Gawrys, G.W.; Lee, G.C. Molecular Rapid Diagnostics Improve Time to Effective Therapy and Survival in Patients with Vancomycin-Resistant Enterococcus Bloodstream Infections. Antibiotics 2023, 12, 210. [Google Scholar] [CrossRef]
  27. Lee, G.C.; Long, S.W.; Musser, J.M.; Beres, S.B.; Olsen, R.J.; Dallas, S.D.; Nunez, Y.O.; Frei, C.R. Comparative Whole Genome Sequencing of Community-Associated Methicillin-Resistant Staphylococcus Aureus Sequence Type 8 from Primary Care Clinics in a Texas Community. Pharmacother. J. Hum. Pharmacol. Drug Ther. 2015, 35, 220–228. [Google Scholar] [CrossRef]
  28. Lee, G.C.; Dallas, S.D.; Wang, Y.; Olsen, R.J.; Lawson, K.A.; Wilson, J.; Frei, C.R. Emerging Multidrug Resistance in Community-Associated Staphylococcus Aureus Involved in Skin and Soft Tissue Infections and Nasal Colonization. J. Antimicrob. Chemother. 2017, 72, 2461–2468. [Google Scholar] [CrossRef] [PubMed]
  29. Hasman, H.; Saputra, D.; Sicheritz-Ponten, T.; Lund, O.; Svendsen, C.A.; Frimodt-Møller, N.; Aarestrup, F.M. Rapid Whole-Genome Sequencing for Detection and Characterization of Microorganisms Directly from Clinical Samples. J. Clin. Microbiol. 2014, 52, 139–146. [Google Scholar] [CrossRef]
  30. Larsen, M.V.; Cosentino, S.; Lukjancenko, O.; Saputra, D.; Rasmussen, S.; Hasman, H.; Sicheritz-Pontén, T.; Aarestrup, F.M.; Ussery, D.W.; Lund, O. Benchmarking of Methods for Genomic Taxonomy. J. Clin. Microbiol. 2014, 52, 1529–1539. [Google Scholar] [CrossRef] [PubMed]
  31. Larsen, M.V.; Cosentino, S.; Rasmussen, S.; Friis, C.; Hasman, H.; Marvig, R.L.; Jelsbak, L.; Sicheritz-Pontén, T.; Ussery, D.W.; Aarestrup, F.M.; et al. Multilocus Sequence Typing of Total-Genome-Sequenced Bacteria. J. Clin. Microbiol. 2012, 50, 1355–1361. [Google Scholar] [CrossRef]
  32. Bartual, S.G.; Seifert, H.; Hippler, C.; Luzon, M.A.D.; Wisplinghoff, H.; Rodríguez-Valera, F. Development of a Multilocus Sequence Typing Scheme for Characterization of Clinical Isolates of Acinetobacter Baumannii. J. Clin. Microbiol. 2005, 43, 4382–4390. [Google Scholar] [CrossRef] [PubMed]
  33. Griffiths, D.; Fawley, W.; Kachrimanidou, M.; Bowden, R.; Crook, D.W.; Fung, R.; Golubchik, T.; Harding, R.M.; Jeffery, K.J.M.; Jolley, K.A.; et al. Multilocus Sequence Typing of Clostridium Difficile. J. Clin. Microbiol. 2010, 48, 770–778. [Google Scholar] [CrossRef]
  34. Lemee, L.; Dhalluin, A.; Pestel-Caron, M.; Lemeland, J.-F.; Pons, J.-L. Multilocus Sequence Typing Analysis of Human and Animal Clostridium Difficile Isolates of Various Toxigenic Types. J. Clin. Microbiol. 2004, 42, 2609–2617. [Google Scholar] [CrossRef]
  35. Wirth, T.; Falush, D.; Lan, R.; Colles, F.; Mensa, P.; Wieler, L.H.; Karch, H.; Reeves, P.R.; Maiden, M.C.J.; Ochman, H.; et al. Sex and Virulence in Escherichia Coli: An Evolutionary Perspective. Mol. Microbiol. 2006, 60, 1136–1151. [Google Scholar] [CrossRef]
  36. Jaureguy, F.; Landraud, L.; Passet, V.; Diancourt, L.; Frapy, E.; Guigon, G.; Carbonnelle, E.; Lortholary, O.; Clermont, O.; Denamur, E.; et al. Phylogenetic and Genomic Diversity of Human Bacteremic Escherichia Coli Strains. BMC Genom. 2008, 9, 560. [Google Scholar] [CrossRef]
  37. Camacho, C.; Coulouris, G.; Avagyan, V.; Ma, N.; Papadopoulos, J.; Bealer, K.; Madden, T.L. BLAST+: Architecture and Applications. BMC Bioinform. 2009, 10, 421. [Google Scholar] [CrossRef]
  38. Humphrey, W.; Dalke, A.; Schulten, K. VMD: Visual Molecular Dynamics. J. Mol. Graph. 1996, 14, 33–38. [Google Scholar] [CrossRef] [PubMed]
  39. Adler, M.; Anjum, M.; Andersson, D.I.; Sandegren, L. Influence of Acquired β-Lactamases on the Evolution of Spontaneous Carbapenem Resistance in Escherichia Coli. J. Antimicrob. Chemother. 2013, 68, 51–59. [Google Scholar] [CrossRef] [PubMed]
  40. Rivoarilala, O.L.; Garin, B.; Andriamahery, F.; Collard, J.M. Rapid in Vitro Detection of CTX-M Groups 1, 2, 8, 9 Resistance Genes by LAMP Assays. PLoS ONE 2018, 13, e0200421. [Google Scholar] [CrossRef] [PubMed]
Figure 1. blaCTX-M-associated mobile genetic elements (MGEs) across three carbapenem phenotypes. Five ertapenem- and meropenem-susceptible (EsMs) with blaCTX-M, five ertapenem-resistant but meropenem-susceptible (ErMs), and four ertapenem- and meropenem-resistant (ErMr) E. coli were annotated for MGEs with MobileElementFinder database v1.0.2 (https://cge.food.dtu.dk/services/MobileElementFinder/, accessed on 29 June 2023). (A) Total annotation counts were compared across all phenotypes (Supplemental Data S1). (B) MGE annotations interposed by (composite transposons) or upstream from blaCTX-M were counted and plotted across all phenotypes. (C) is a volcano plot comparing all MGE counts between EsMs and ErMs. Log2-fold count difference between ErMs and EsMs MGEs were plotted against Log10-transformed adjusted p-values (two-way ANOVA) of all MGEs between these two phenotypes. Values above 1.3 Log10 (p < 0.05; grey line) were considered statistically significant. All red MGEs are present at higher frequencies in ErMs than in EsMs E. coli.
Antibiotics 13 00185 g001
Figure 2. Mean log2-transformed blaCTX-M gene copy number by ertapenem and meropenem phenotype. ΔΔCt =2(ΔCTcontrol−ΔCTtarget) was used to calculate copy number, using rpsL gene as the control gene and EC87 (a ceftriaxone-resistant but ertapenem- and meropenem-susceptible (EsMs) strain) as the control strain (blaCTX-M ΔCt of 1.0; log2 ΔΔCt = 0.0). Abbreviations: bla: β-lactamase; EsMs: ertapenem- and meropenem-susceptible but ceftriaxone-resistant; ErMs: ertapenem-resistant, meropenem-susceptible. Performed t-test for fold change difference between ErMs and EsMs.
Antibiotics 13 00185 g002
Figure 4. Diagram depicting the balance between β-lactamase copy number, OmpC expression (present/absent), and mobile genetic element abundance among carbapenemase-producing (CP), non-carbapenemase-producing (NCP), ertapenem-resistant, meropenem-susceptible (ErMs), and ceftriaxone-resistant but ertapenem- and meropenem-susceptible (EsMs) E. coli. Black double-headed arrows represent wildtype expression or copy number of OmpC protein or β-lactamase gene; black single-headed arrows indicate up or down expression or copy number compared to wildtype; large grey arrows represent theoretical changes required among EsMs E. coli to develop an ErMs phenotype; small grey single pointed arrows represent theoretical changes required among ErMs E. coli to develop a CP or NCP genotype. As carbapenemase enzymes, like blaKPC, are harbored in E. coli, OmpC expression is maintained in the presence of carbapenem exposure. However, if blaCTX-M is present in NCP E. coli, carbapenem exposure drives an increase in blaCTX-M copies and a decrease in OmpC expression.
Antibiotics 13 00185 g004
Table 1. Antimicrobial susceptibilities of carbapenem-resistant E. coli and K. pneumoniae.
NameOverall (n 99)
(%Susceptible)
ErMs (n 29)
(%Susceptible)
Amikacin9165
Aztreonam912
Ceftazidime–avibactam7788
Ciprofloxacin912
Colistin9596
Doripenem5388
Doxycycline4438
Ertapenem40
Cefepime1623
Cefotaxime912
Gentamicin3948
Imipenem4673
Imipenem–relebactam9896
Levofloxacin160
Meropenem44100
Meropenem–vaborbactam8888
Minocycline6368
Polymyxin B9596
Piperacillin–tazobactam1935
Trimethoprim-sulfamethoxazole2315
Ceftazidime1419
Tigecycline9896
Ticarcillin–clavulanic acid1115
Tobramycin3023
Antimicrobial susceptibilities of carbapenem-resistant E. coli and K. pneumoniae with microdilution assays (ThermoFisher (Waltham, MA, USA) [GNX2F]; CLSI M100-ED33:2023 Performance Standards for Antimicrobial Susceptibility Testing, 33rd Edition).
Table 2. Distribution of β-lactamase genes by species, phenotype, and carbapenemase status.
Species Carbapenem
Phenotype
Carbapenemase
Status
n (%)Overall
(N = 76)
K. pneumoniae
(n = 47)
E. coli
(n = 29)
pErMr
(n = 47)
ErMs
(n = 29)
pCPE
(n = 35)
NCPE
(n = 41)
p
ErMs29 (38)8 (17)21 (72)<0.001 5 (14)24 (59)<0.001
NCPE41 (54)19 (40)22 (76)0.0117 (36)24 (83)<0.001
CPE35 (46)28 (60)7 (24)0.0130 (64)5 (17)<0.001
blaMBL  A5 (7)3 (6)2 (7)1.004 (9)1 (3)0.705 (14)0 (0)0.04
blaKPC  B28 (37)23 (49)5 (17)0.0124 (51)4 (14)0.00228 (80)0 (0)<0.001
blaOXA-48  C2 (3)2 (4)0 (0)0.702 (4)0 (0)0.702 (6)0 (0)0.41
blaOXA-1/-933 (43)22 (47)11 (38)0.6022 (47)11 (38)0.6021 (60)12 (29)0.01
blaESBL  D52 (68)32 (68)20 (69)1.0028 (60)24 (83)0.0621 (60)31 (76)0.23
blaCTX-M  E47 (62)27 (57)20 (69)0.4523 (49)24 (83)0.0116 (46)31 (76)0.02
blaCTX-M-1543 (57)27 (57)16 (55)1.0022 (47)21 (72)0.0516 (46)27 (66)0.13
blaSHV-127 (9)7 (15)0 (0)0.084 (9)3 (10)1.004 (11)3 (7)0.83
blapenicillinase  F60 (79)42 (89)18 (62)0.0140 (85)20 (69)0.1730 (86)30 (73)0.29
blaAmpC  G12 (16)5 (11)7 (24)0.217 (15)5 (17)1.003 (8)9 (22)0.20
Distribution of β-lactamase genes based on short-read sequences. ErMs: ertapenem-resistant meropenem-susceptible, NCPE: non-carbapenemase-producing Enterobacterales, CPE: carbapenemase-producing Enterobacterales, ESBL: extended-spectrum β-lactamase. A Metallo-β-lactamases (MBL) variants: blaNDM-1, blaNDM-5, blaVIM-27. B blaKPC variants: blaKPC-2, blaKPC-3. C blaOXA-48-like variants: blaOXA-232. D ESBL variants: blaCTX-M-15, blaCTX-M-14, blaCTX-M-27, blaSHV-12, blaSHV-105, blaOXY-2-7, blaOXY-2-8. E Any blaCTX-M: blaCTX-M-15, blaCTX-M-14, blaCTX-M-27; F blapenicillinase: various blaTEM-1-like and blaSHV-1-like variants. G AmpC variants: blaCMY-2, blaCMY-6, blaCMY-42, blaCMY-59, blaCMY-133, blaDHA-9, blaFOX-5.
Table 3. Meropenem hydrolysis across distinct beta-lactamase profiles.
IDβ-Lactamase Profile AMeropenem
Hydrolysis
(ng/mL-h)
Vaborbactam
Hydrolysis
(ng/mL-h) B
CarbapenemaseNon-Carbapenemase
β-Lactamase
EC68noneblaCMY-133, blaTEM-1−0.5−0.1
EC5noneblaCTX-M-15, blaOXA-1−0.8No loss
EC201noneblaCTX-M-15, blaOXA-1−1.0No loss
KP56blaKPC-2blaOXA-9,blaTEM-1, blaSHV-182−1.0No loss
EC74blaKPC-3none−1.3No loss
KP15blaKPC-2blaCTX-M-15, blaOXA-9,blaTEM-1, blaSHV-100−2.0No loss
EC23blaNDM-5blaCTX-M-15, blaOXA-1, blaTEM-1, blaSHV-27−2.8No loss
EC22blaNDM-5blaCTX-M-15, blaOXA-1, blaTEM-1, blaSHV-27LLQ at t1No loss
KP26blaNDM-1blaCTX-M-15, blaCMY-6, blaOXA-1, blaTEM-1, blaSHV-155LLQ at t1No loss
EC: E. coli; KP: K. pneumoniae; LLQ: lower limit of quantitation; None: none detected; t1: hour 1 since drug exposure; t2: hour 18 since drug exposure. A β-lactamase profile determined by short, raw read uploads to ResFinder database [11,12,13]. B Vaborbactam concentrations remained constant between hours 1 and 18 across all nine isolates with an average t2 − t1 concentration of +0.75 ng/mL and overall average parent concentration of 6.0 ng/mL at all time points.
Table 4. Mean ΔCt of resistance genes relative to rpsL among E. coli and K. pneumoniae ErMs and EsMs.
PhenotypeIDrpsLblaCTX-MblaTEMblaSHVblaOXA-1/9blaCMYblaKPCompC/
ompK36
ompF/
ompK35
tolC/
oqxA
ErMsEC121.02.30.4 0.6 1.60.50.40.4
EC3048.82.8 1.41.31.7
EC315.20.9 0.60.60.8
EC3539.91.2 0.1 0.70.91.0
KP101.010.74.70.54.3 0.60.70.7
KP3820.44.31.6 1.71.81.9
KP459.14.99.2 1.21.31.0
KP54 0.20.20.2 0.20.20.30.2
Mean ΔCt17.12.41.40.60.00.20.90.91.0
EsMsEC871.01.6 0.7 0.60.50.6
EC888.1 0.80.61.9
EC892.12.0 0.60.71.5
EC921.4 0.6 0.50.41.2
KP851.01.31.20.80.5 0.50.5
KP862.7 0.7 0.3 0.40.6
KP90208.61.03.6 0.81.01.6
KP911.1 0.1 0.40.4
Mean ΔCt4.81.50.30.70.10.00.50.61.1
Mean fold gene copy number relative to rpsL (species-specific) of ertapenem-resistant but meropenem-susceptible (ErMs) and ceftriaxone-resistant but ertapenem- and meropenem-susceptible (EsMs) E. coli and K. pneumoniae. Fold copies calculated with formula ΔCt = 2(CTrpsL−CTtarget) relative to each isolate. Group-1 and Group-9 blaCTX-M primers used for screening. Porin and efflux genes, ompC/ompF/tolC and ompK35/ompK36/oqxA, were analyzed in E. coli and K. pneumoniae, respectively. KP54 is ATCC ErMs strain BAA-1903 with a subpopulation of KPC producers.
Table 5. Major amino acid alterations in porin genes in E. coli and K. pneumoniae by carbapenemase status and carbapenem phenotype.
E. coli K. pneumoniae
CP-ErMr
(n = 2)
NCP-ErMs
(n = 16)
pCP-ErMr
(n = 28)
NCP-ErMs
(n = 8)
p
No major alteration(s)2 (100)0 (0)0.0021 (3.6)0 (0)1.00
Any major alteration(s)0 (0)16 (100)0.00227 (96)8 (100)1.00
ompC/ompK350 (0)14 (88)0.0527 (96)8 (100)1.00
ompF/ompK360 (0)8 (50)0.5520 (71)4 (50)0.47
Insertion/Deletion0 (0)10 (63)0.8527 (96)8 (100)1.00
ompC/ompK350 (0)10 (63)0.8527 (96)8 (100)1.00
ompF/ompK360 (0)0 (0)ND0 (0)0 (0)ND
Frameshift0 (0)16 (100)0.00227 (96)8 (100)1.00
ompC/ompK350 (0)14 (88)0.0524 (85)8 (100)0.62
ompF/ompK360 (0)8 (50)0.550 (0)0 (0)ND
Premature Stop0 (0)1 (6.2)1.0025 (89)8 (100)0.80
ompC/ompK350 (0)1 (6.2)1.0023 (82)7 (87)1.00
ompF/ompK360 (0)0 (0)ND20 (71)4 (50)0.47
Major amino acid alterations in porin genes in E. coli and K. pneumoniae by carbapenemase status and carbapenem phenotype determined by short-read sequences mapped to reference. Abbreviations: CP: carbapenemase-producing; ErMs: ertapenem-resistant, meropenem-susceptible; ErMr: ertapenem- and meropenem-resistant; NCP: non-carbapenemase-producing; ND: not detected. Major alterations in either ompF-like or ompC-like genes are included unless specific gene noted.
Disclaimer/Publisher’s Note: The statements, opinions and data contained in all publications are solely those of the individual author(s) and contributor(s) and not of MDPI and/or the editor(s). MDPI and/or the editor(s) disclaim responsibility for any injury to people or property resulting from any ideas, methods, instructions or products referred to in the content.

