
Procalcitonin Values Fail to Track the Presence of Secondary Bacterial Infections in COVID-19 ICU Patients
 ,
,  , ,
, , 
Abstract
1. Introduction
2. Results
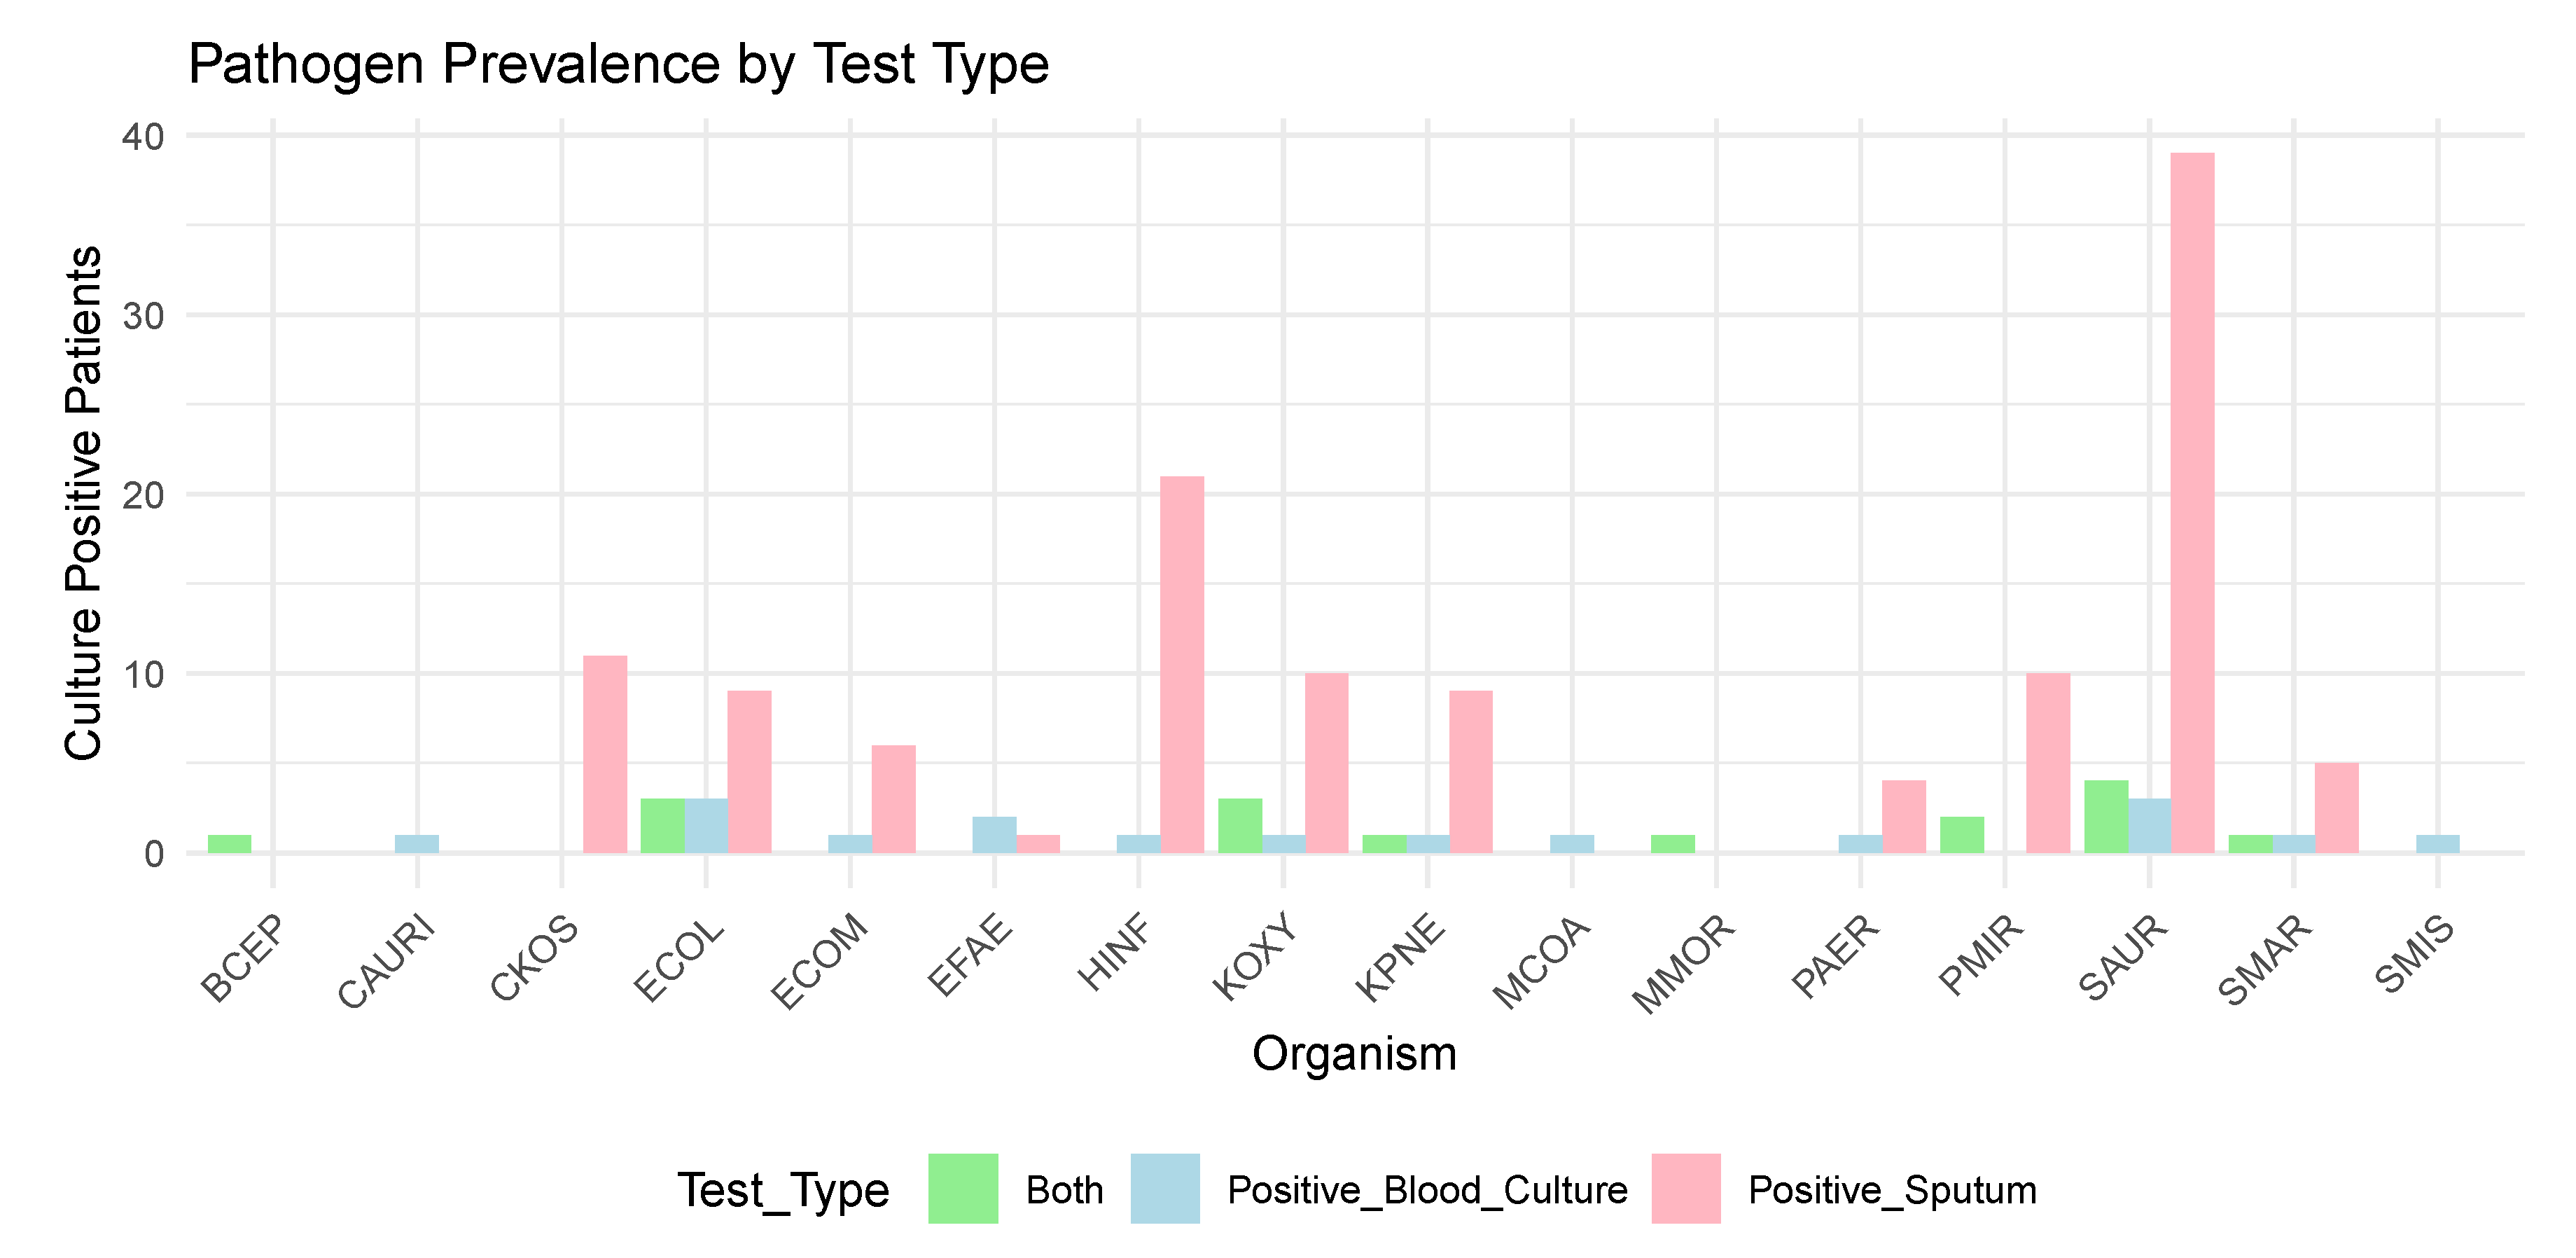
2.1. Infection Data
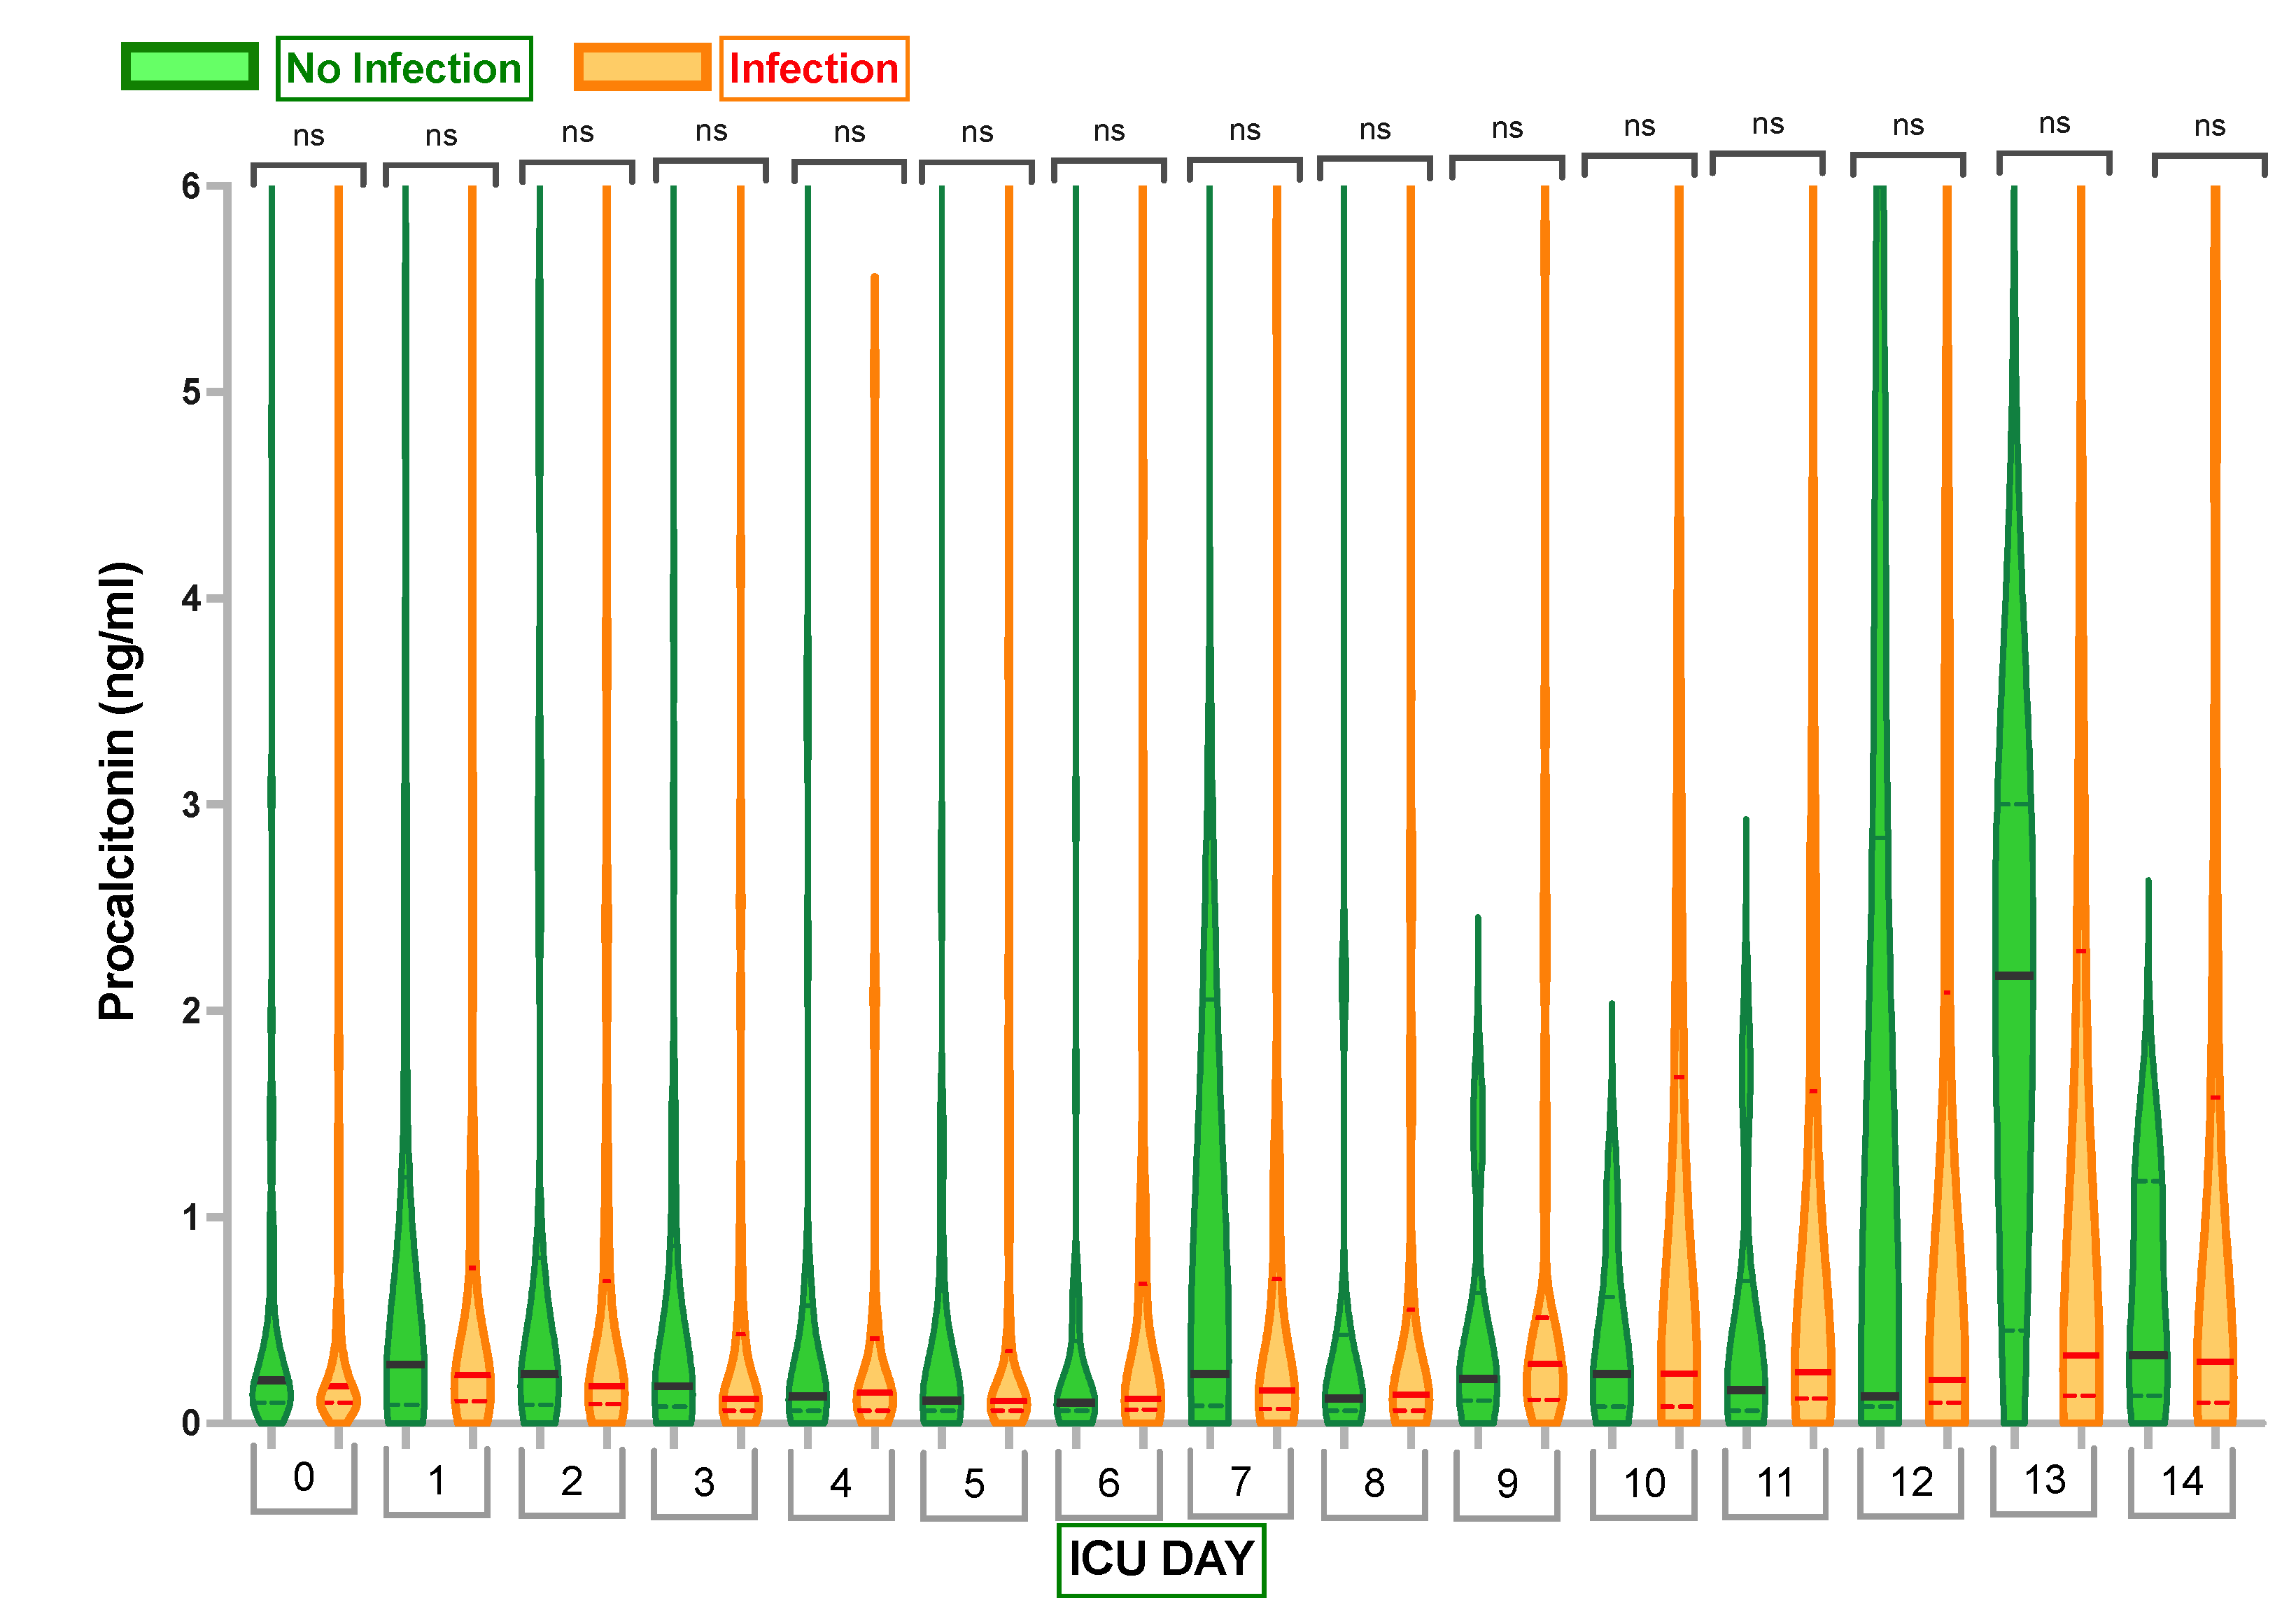
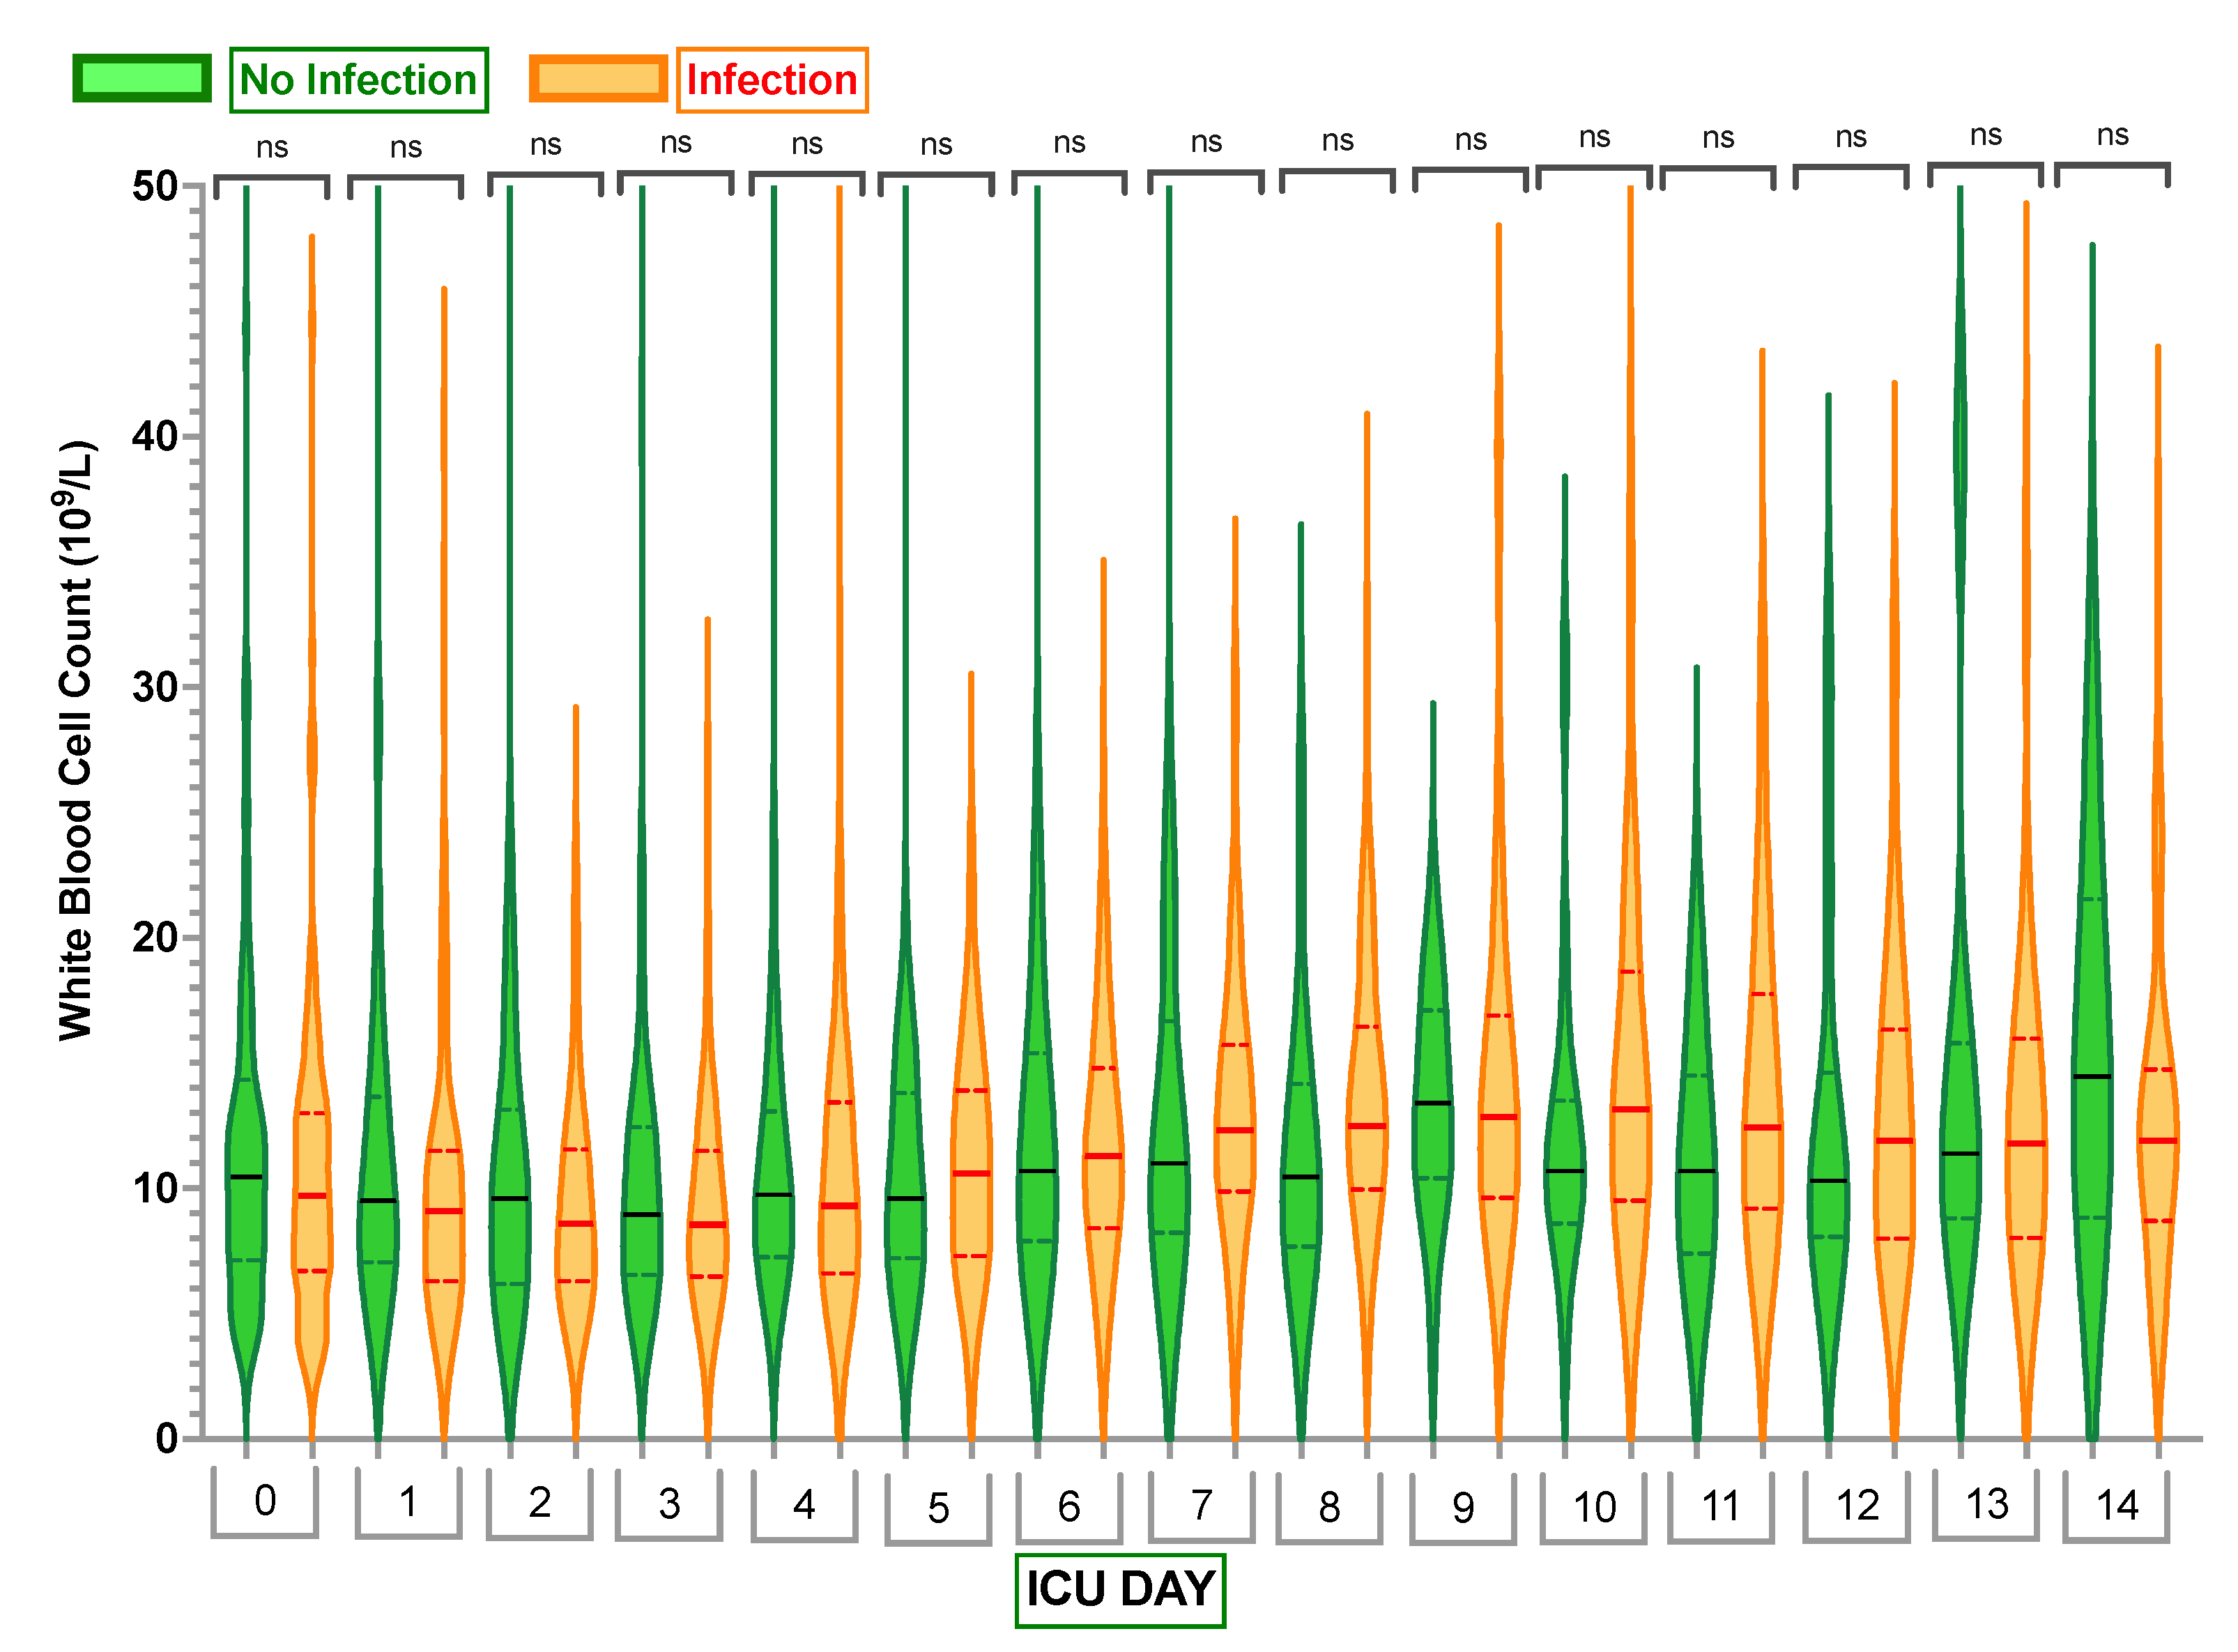
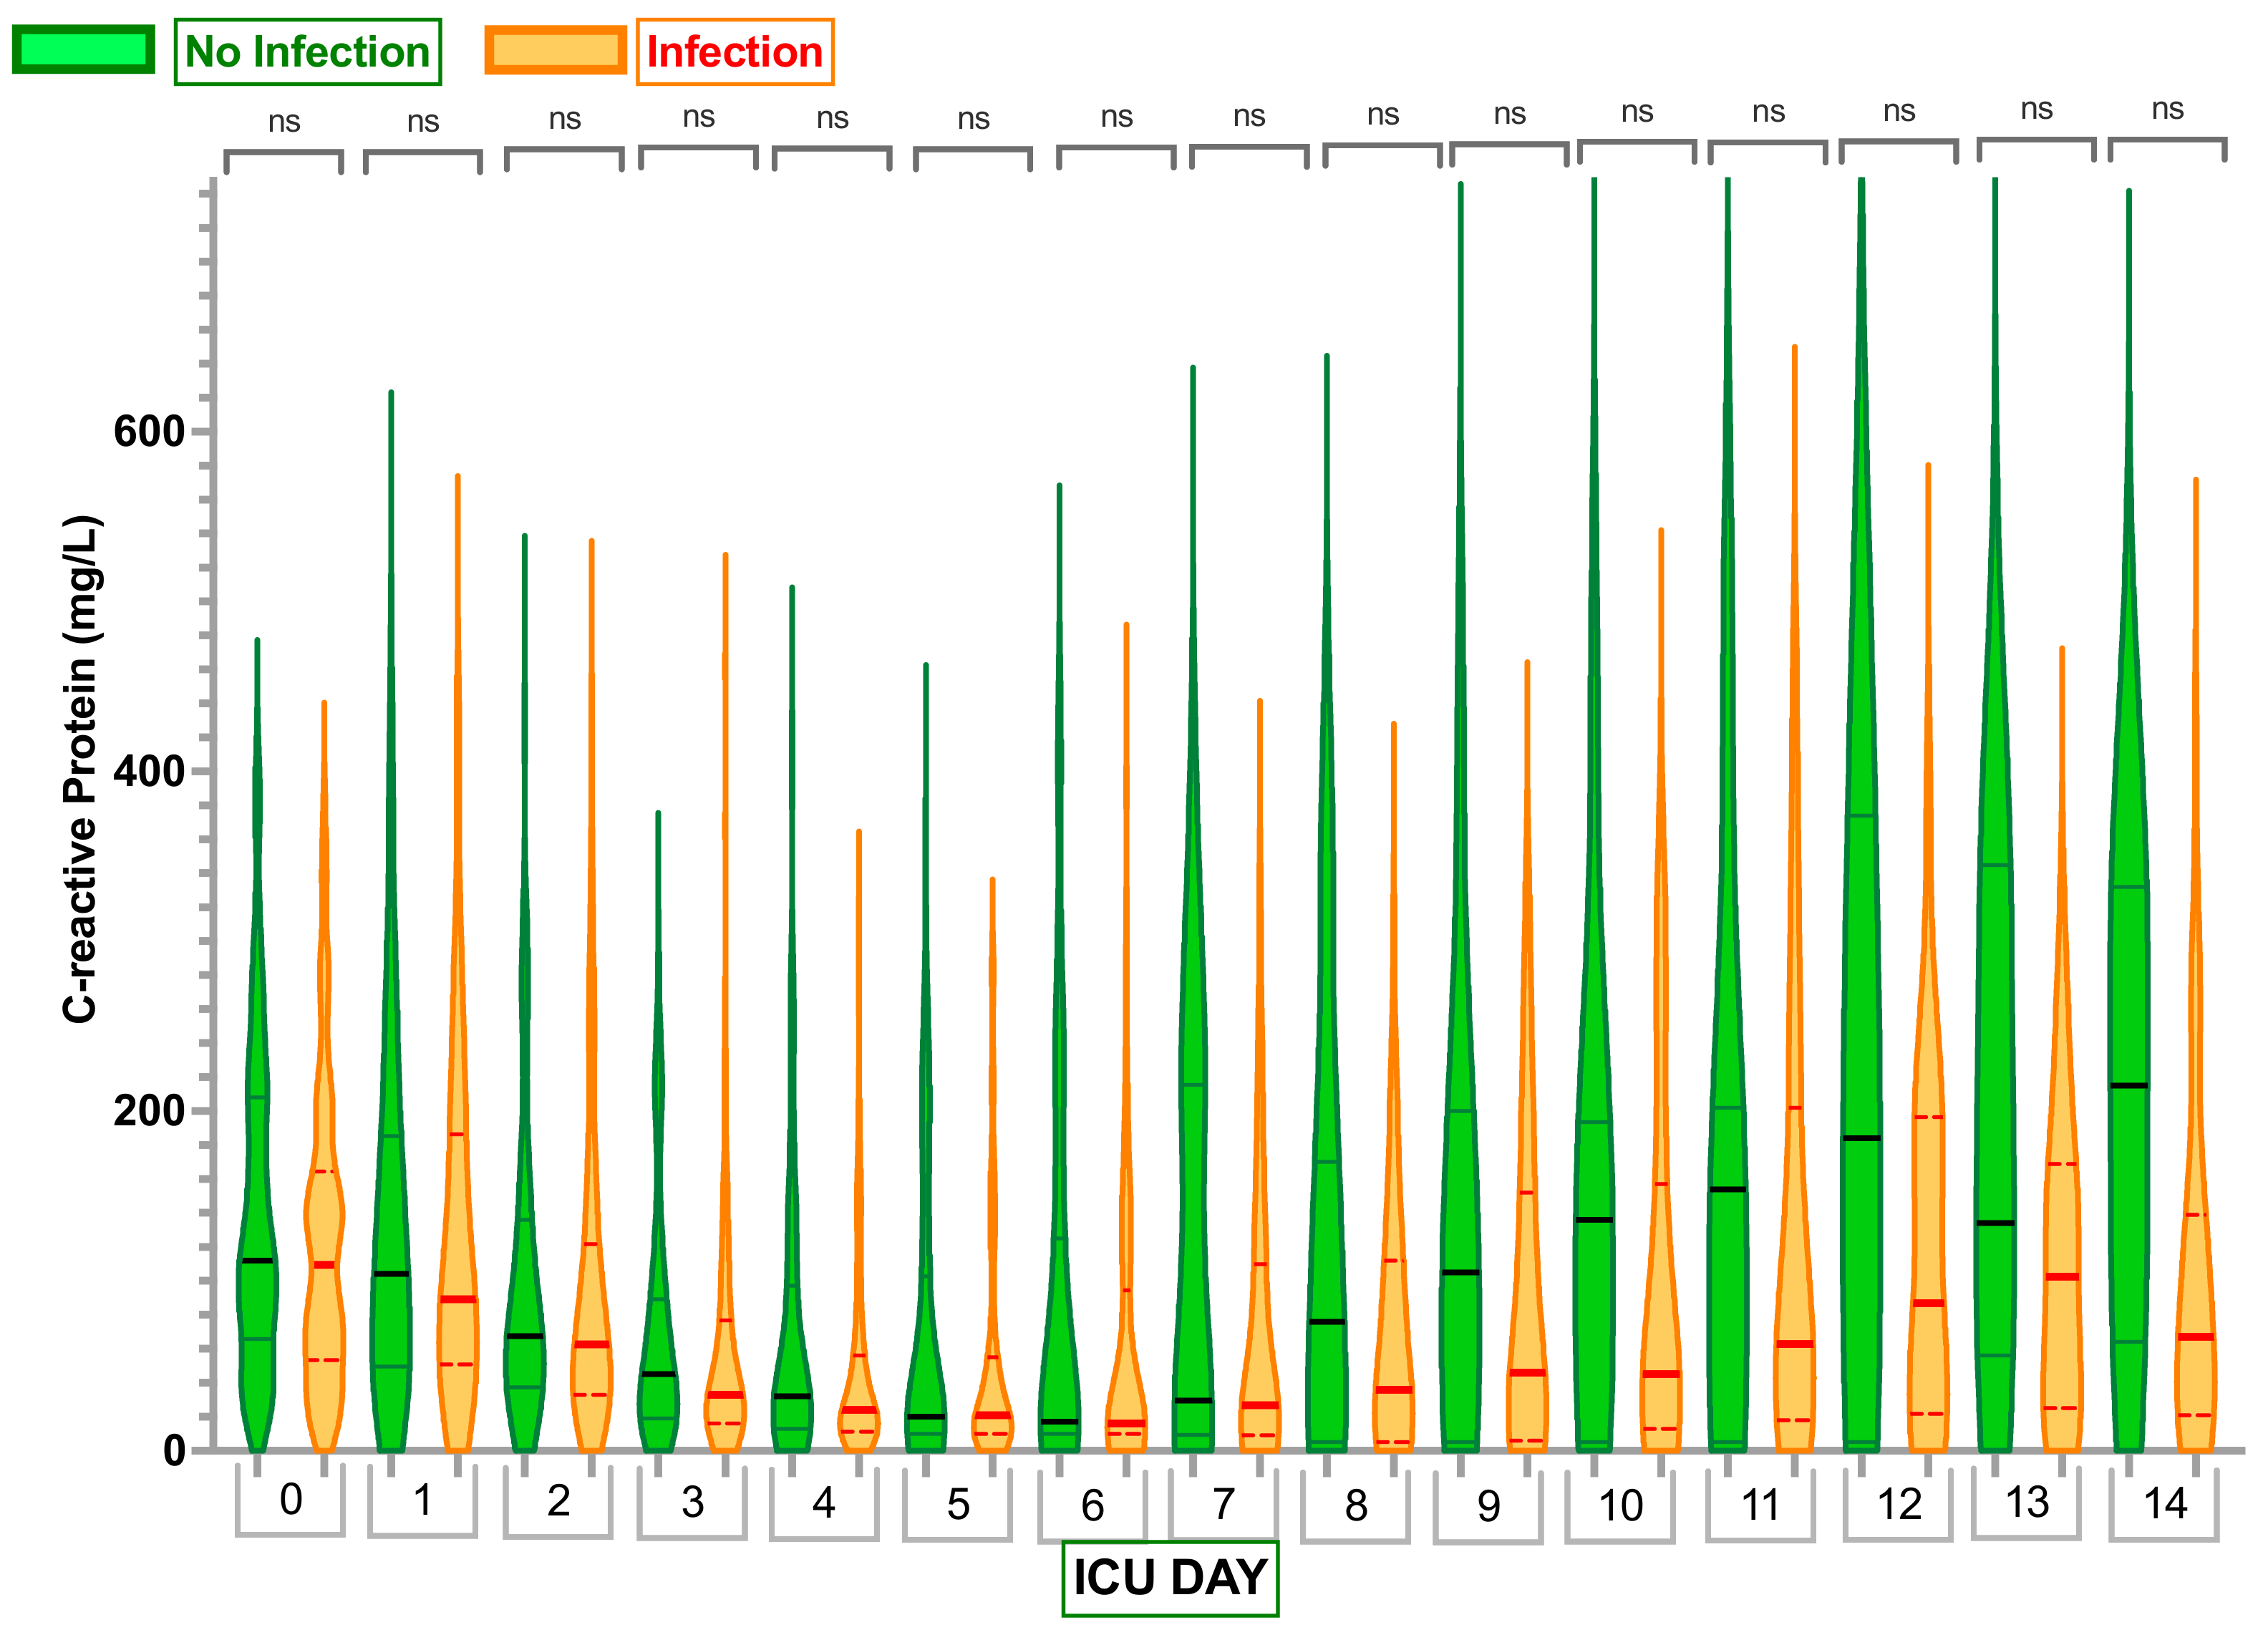
2.2. Inflammatory Markers
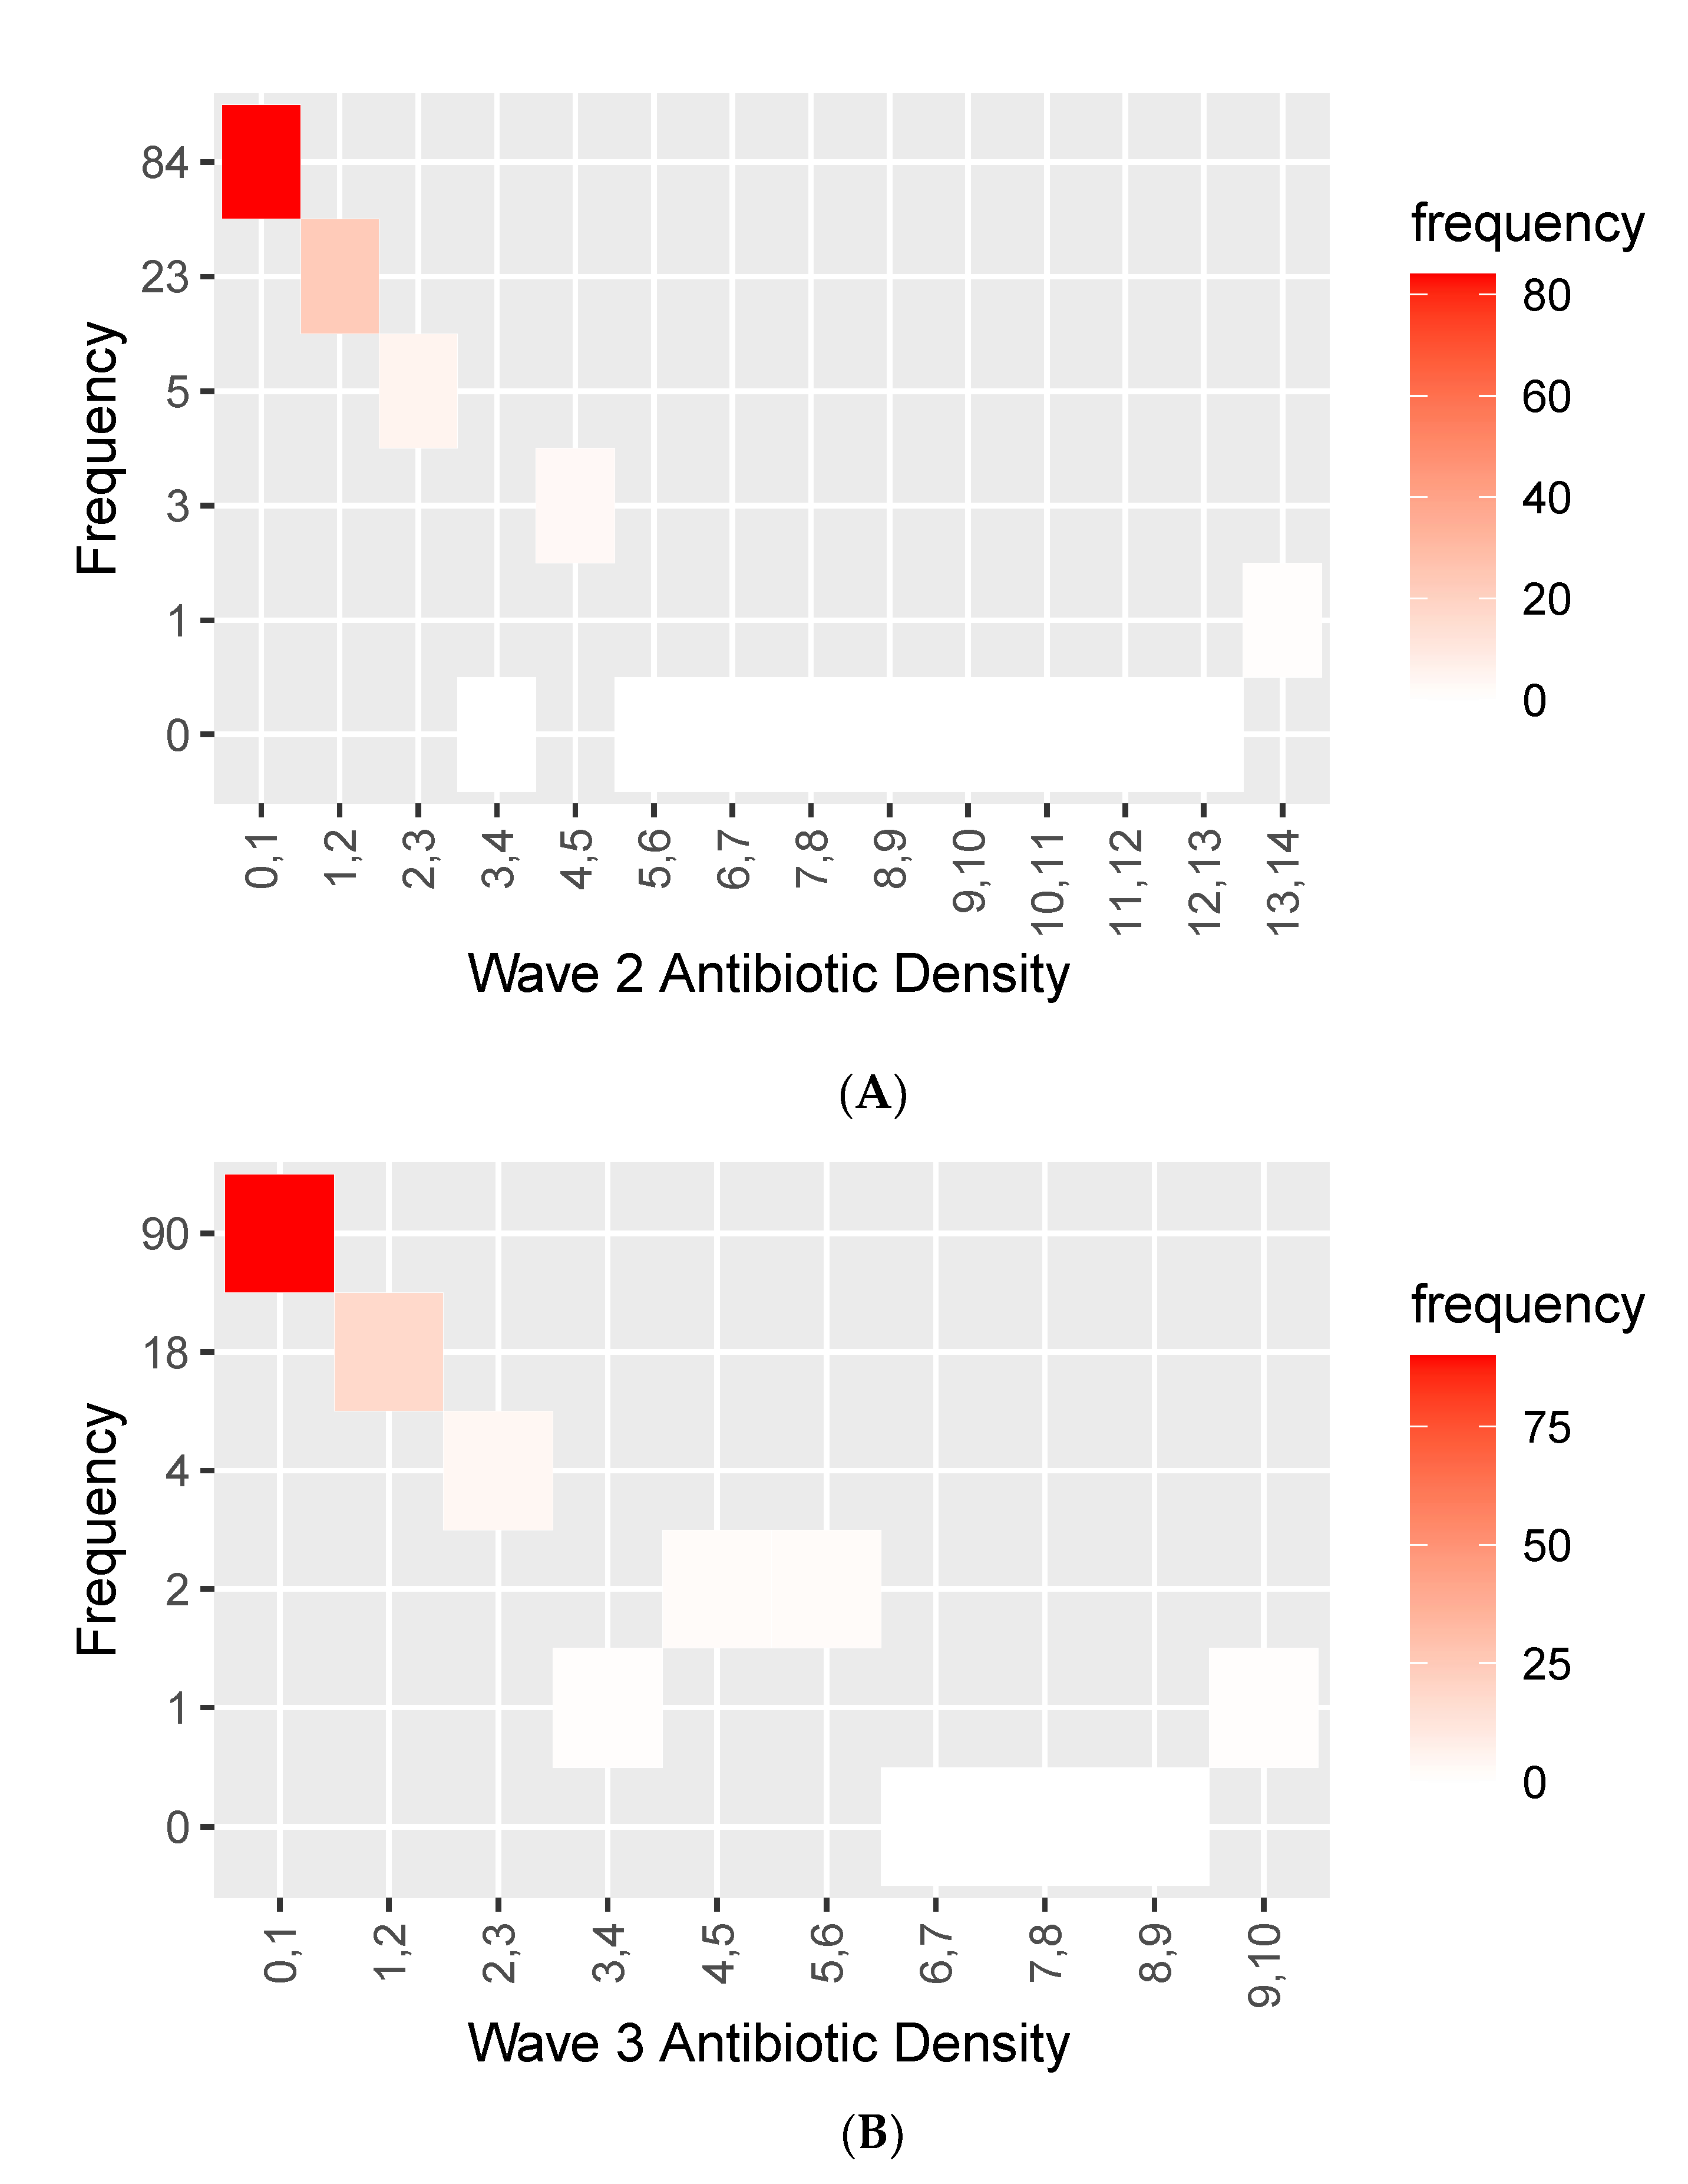
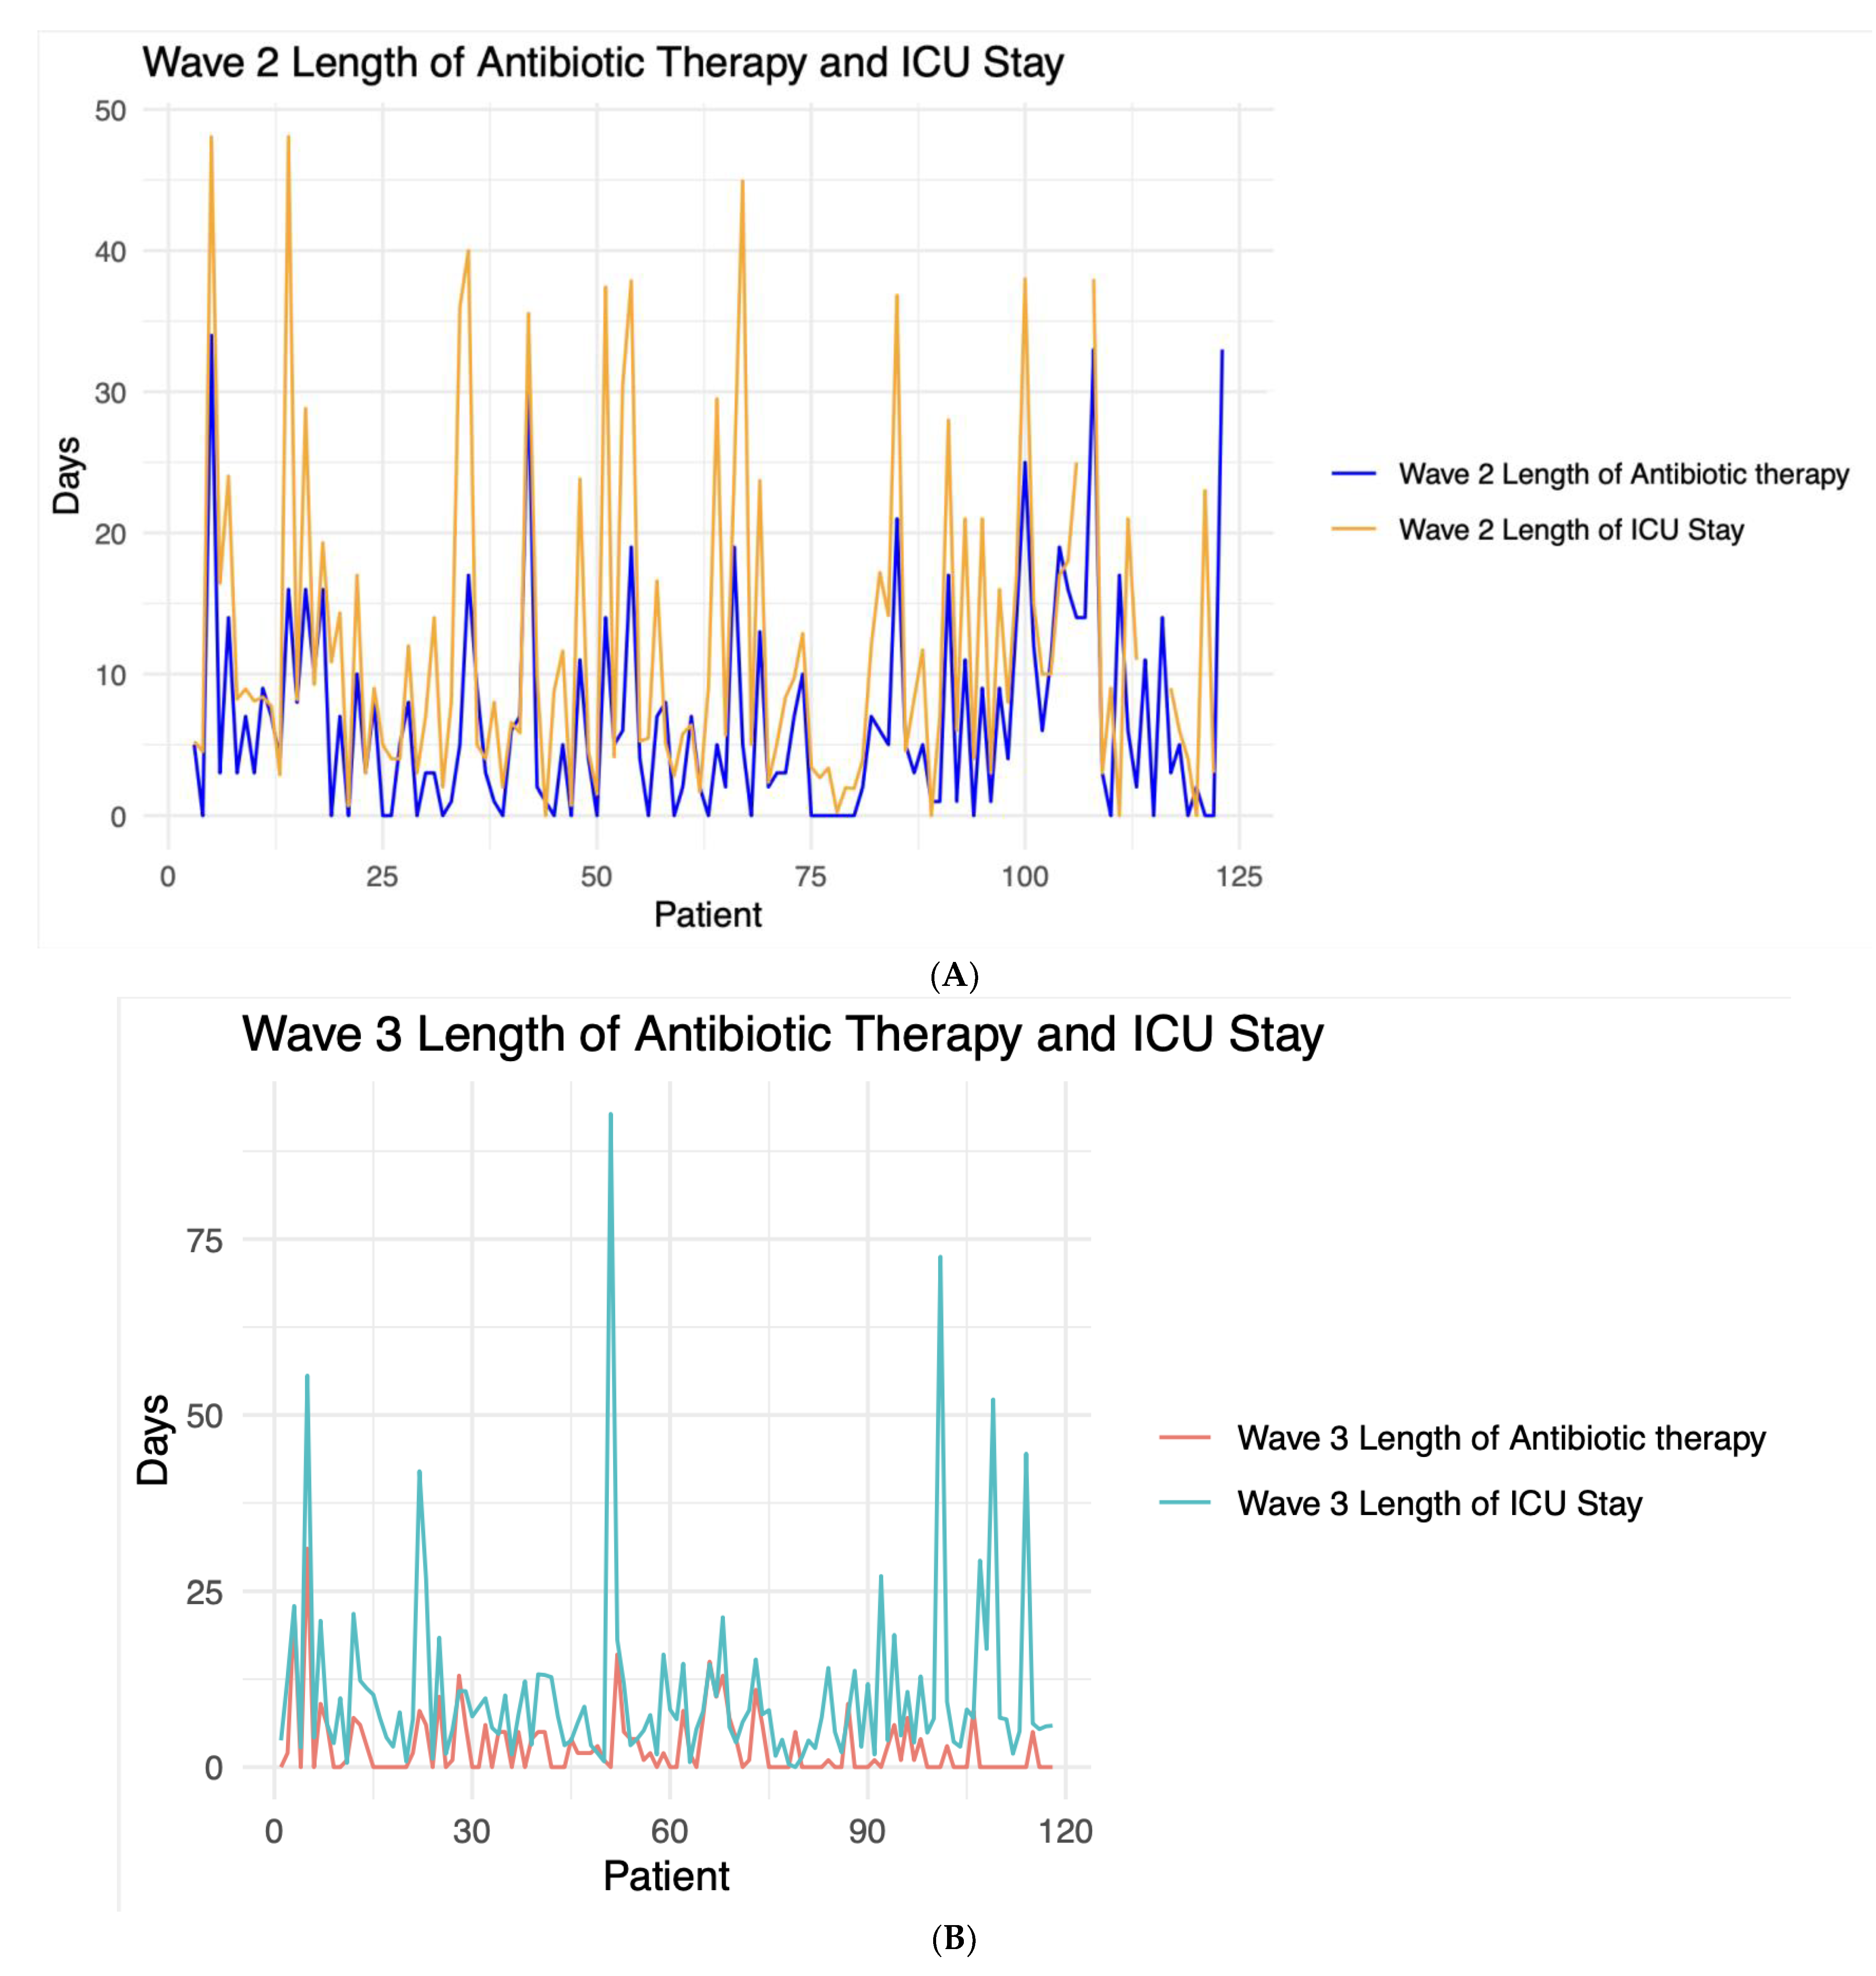
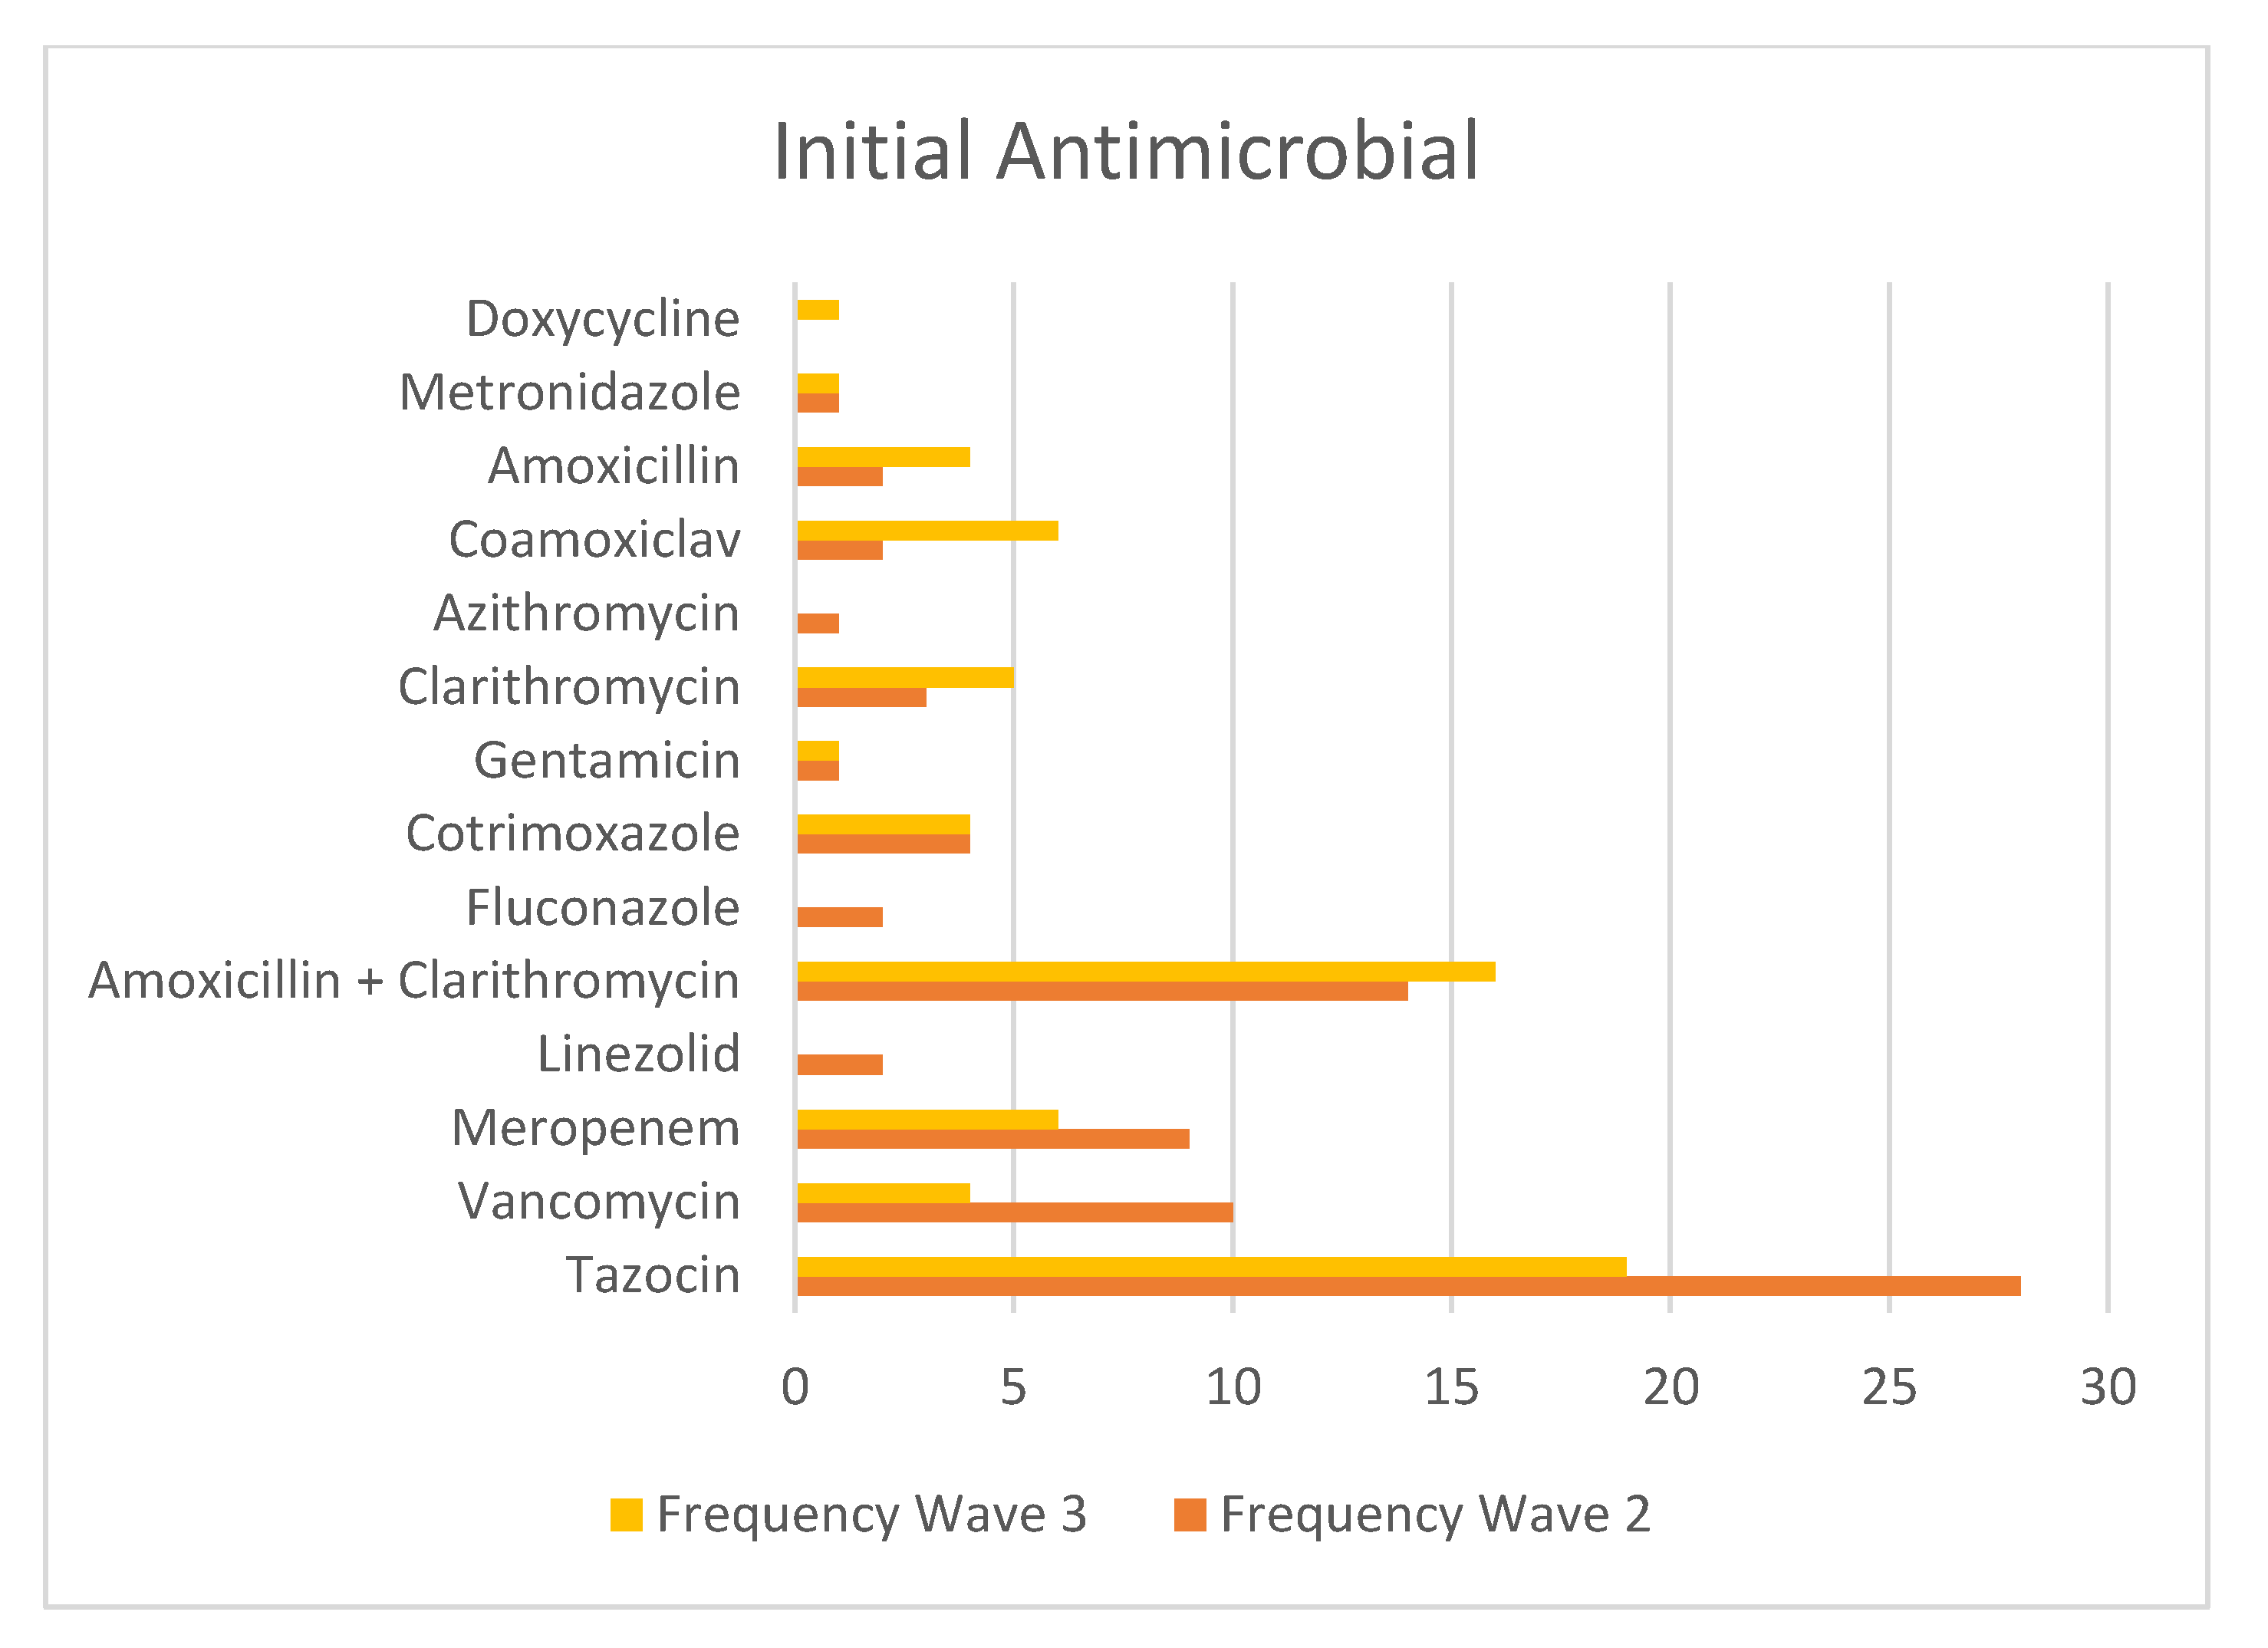
2.3. Antimicrobial Use across Waves 2 and Waves 3
3. Discussion
4. Materials and Methods
Statistical Analysis
5. Conclusions
Author Contributions
Funding
Institutional Review Board Statement
Informed Consent Statement
Data Availability Statement
Conflicts of Interest
Appendix A. Micro-Organism Key

| BCEP | Burkholderia cepacian |
| CAURI | Corynebacterium aurimucosum |
| CKOS | Citrobacter koseri |
| ECOM | Enterobacter Cloacae Complex |
| ECOL | Escherichia coli |
| EFAE | Enterococcus faecalis |
| HINF | Haemophilus influenzae |
| KOXY | Klebsiella oxytoca |
| KPNE | Klebsiella pneumoniae |
| MCOA | Mixed Coagulase Negative Staphylococci |
| MMOR | Morganella morganii |
| SMIS | Streptococcus mitis |
| PAER | Pseudomonas aeruginosa |
| SMAR | Serratia marcescens |
| PMIR | Proteus mirabilis |
| SAUR | Staphylococcus aureus |
Appendix B. One-Way Analysis of Variances (ANOVA) to Compare the Mean Procalcitonin Values between Those Who Had an Infection and Those Who Did Not
| ANOVA | ||||||
|---|---|---|---|---|---|---|
| Sum of Squares | df | Mean Square | f | Sig | ||
| PCT 0 | Between Groups | 459.136 | 1 | 459.136 | 1.138 | 0.288 |
| Within Groups | 58,479.511 | 145 | 403.307 | |||
| Total | 58,938.646 | 146 | ||||
| PCT 1 | Between Groups | 18.343 | 1 | 18.343 | 0.042 | 0.839 |
| Within Groups | 57,618.284 | 131 | 439.834 | |||
| Total | 57,636.626 | 132 | ||||
| PCT 2 | Between Groups | 97.395 | 1 | 97.395 | 1.010 | 0.317 |
| Within Groups | 12,633.835 | 131 | 96.441 | |||
| Total | 12,731.230 | 132 | ||||
| PCT 3 | Between Groups | 0.427 | 1 | 0.427 | 0.004 | 0.949 |
| Within Groups | 11,268.915 | 109 | 103.385 | |||
| Total | 11,269.342 | 110 | ||||
| PCT 4 | Between Groups | 139.425 | 1 | 139.425 | 2.736 | 0.101 |
| Within Groups | 5350.499 | 105 | 50.957 | |||
| Total | 5489.924 | 106 | ||||
| PCT 5 | Between Groups | 10.780 | 1 | 10.780 | 0.131 | 0.718 |
| Within Groups | 7906.563 | 96 | 82.360 | |||
| Total | 7917.343 | 97 | ||||
| PCT 6 | Between Groups | 16.273 | 1 | 16.273 | 1.054 | 0.307 |
| Within Groups | 1405.585 | 91 | 15.446 | |||
| Total | 1421.859 | 92 | ||||
| PCT 7 | Between Groups | 40.457 | 1 | 40.457 | 3.750 | 0.057 |
| Within Groups | 668.891 | 62 | 10.789 | |||
| Total | 709.347 | 63 | ||||
| PCT 8 | Between Groups | 0.510 | 1 | 0.510 | 0.125 | 0.725 |
| Within Groups | 268.757 | 66 | 4.072 | |||
| Total | 269.266 | 67 | ||||
| PCT 9 | Between Groups | 0.669 | 1 | 0.669 | 0.609 | 0.438 |
| Within Groups | 59.275 | 54 | 1.098 | |||
| Total | 59.944 | 55 | ||||
| PCT 10 | Between Groups | 12.706 | 1 | 12.706 | 1.325 | 0.255 |
| Within Groups | 498.611 | 52 | 9.589 | |||
| Total | 511.317 | 53 | ||||
| PCT 11 | Between Groups | 129.216 | 1 | 129.216 | 0.294 | 0.590 |
| Within Groups | 24,209.817 | 55 | 440.178 | |||
| Total | 24,339.033 | 56 | ||||
| PCT 12 | Between Groups | 3.931 | 1 | 3.931 | 0.226 | 0.636 |
| Within Groups | 798.525 | 46 | 17.359 | |||
| Total | 802.456 | 47 | ||||
| PCT 13 | Between Groups | 8.327 | 1 | 8.327 | 0.086 | 0.770 |
| Within Groups | 4056.327 | 42 | 96.579 | |||
| Total | 4064.654 | 43 | ||||
| PCT 14 | Between Groups | 2.261 | 1 | 2.261 | 0.540 | 0.467 |
| Within Groups | 146.496 | 35 | 4.186 | |||
| Total | 148.757 | 36 | ||||
Appendix C. Independent Mann–Whitney U Tests to Compare the Mean Procalcitonin Values between Those Who Had an Infection and Those Who Did Not: Wave 2(A) and Wave 3(B)
| Hypothesis Test Summary | ||||
|---|---|---|---|---|
| Null Hypothesis | Test | Sig.a,b | Decision | |
| 1 | The distribution of PCT 0 is the same across categories of Infection. | Independent-Samples Mann-Whitney U Test | 0.288 | Retain the null hypothesis. |
| 2 | The distribution of PCT 1 is the same across categories of Infection. | Independent-Samples Mann-Whitney U Test | 0.873 | Retain the null hypothesis. |
| 3 | The distribution of PCT 2 is the same across categories of Infection. | Independent-Samples Mann-Whitney U Test | 0.345 | Retain the null hypothesis. |
| 4 | The distribution of PCT 3 is the same across categories of Infection. | Independent-Samples Mann-Whitney U Test | 0.099 | Retain the null hypothesis. |
| 5 | The distribution of PCT 4 is the same across categories of Infection. | Independent-Samples Mann-Whitney U Test | 0.925 | Retain the null hypothesis. |
| 6 | The distribution of PCT 5 is the same across categories of Infection. | Independent-Samples Mann-Whitney U Test | 0.812 | Retain the null hypothesis. |
| 7 | The distribution of PCT 6 is the same across categories of Infection. | Independent-Samples Mann-Whitney U Test | 0.382 | Retain the null hypothesis. |
| 8 | The distribution of PCT 7 is the same across categories of Infection. | Independent-Samples Mann-Whitney U Test | 0.299 | Retain the null hypothesis. |
| 9 | The distribution of PCT 8 is the same across categories of Infection. | Independent-Samples Mann-Whitney U Test | 0.691 | Retain the null hypothesis. |
| 10 | The distribution of PCT 9 is the same across categories of Infection. | Independent-Samples Mann-Whitney U Test | 0.500 | Retain the null hypothesis. |
| 11 | The distribution of PCT 10 is the same across categories of Infection. | Independent-Samples Mann-Whitney U Test | 0.517 | Retain the null hypothesis. |
| 12 | The distribution of PCT 11 is the same across categories of Infection. | Independent-Samples Mann-Whitney U Test | 0.254 c | Retain the null hypothesis. |
| 13 | The distribution of PCT 12 is the same across categories of Infection. | Independent-Samples Mann-Whitney U Test | 0.529 c | Retain the null hypothesis. |
| 14 | The distribution of PCT 13 is the same across categories of Infection. | Independent-Samples Mann-Whitney U Test | 0.221 c | Retain the null hypothesis. |
| 15 | The distribution of PCT 14 is the same across categories of Infection. | Independent-Samples Mann-Whitney U Test | 0.780 c | Retain the null hypothesis. |
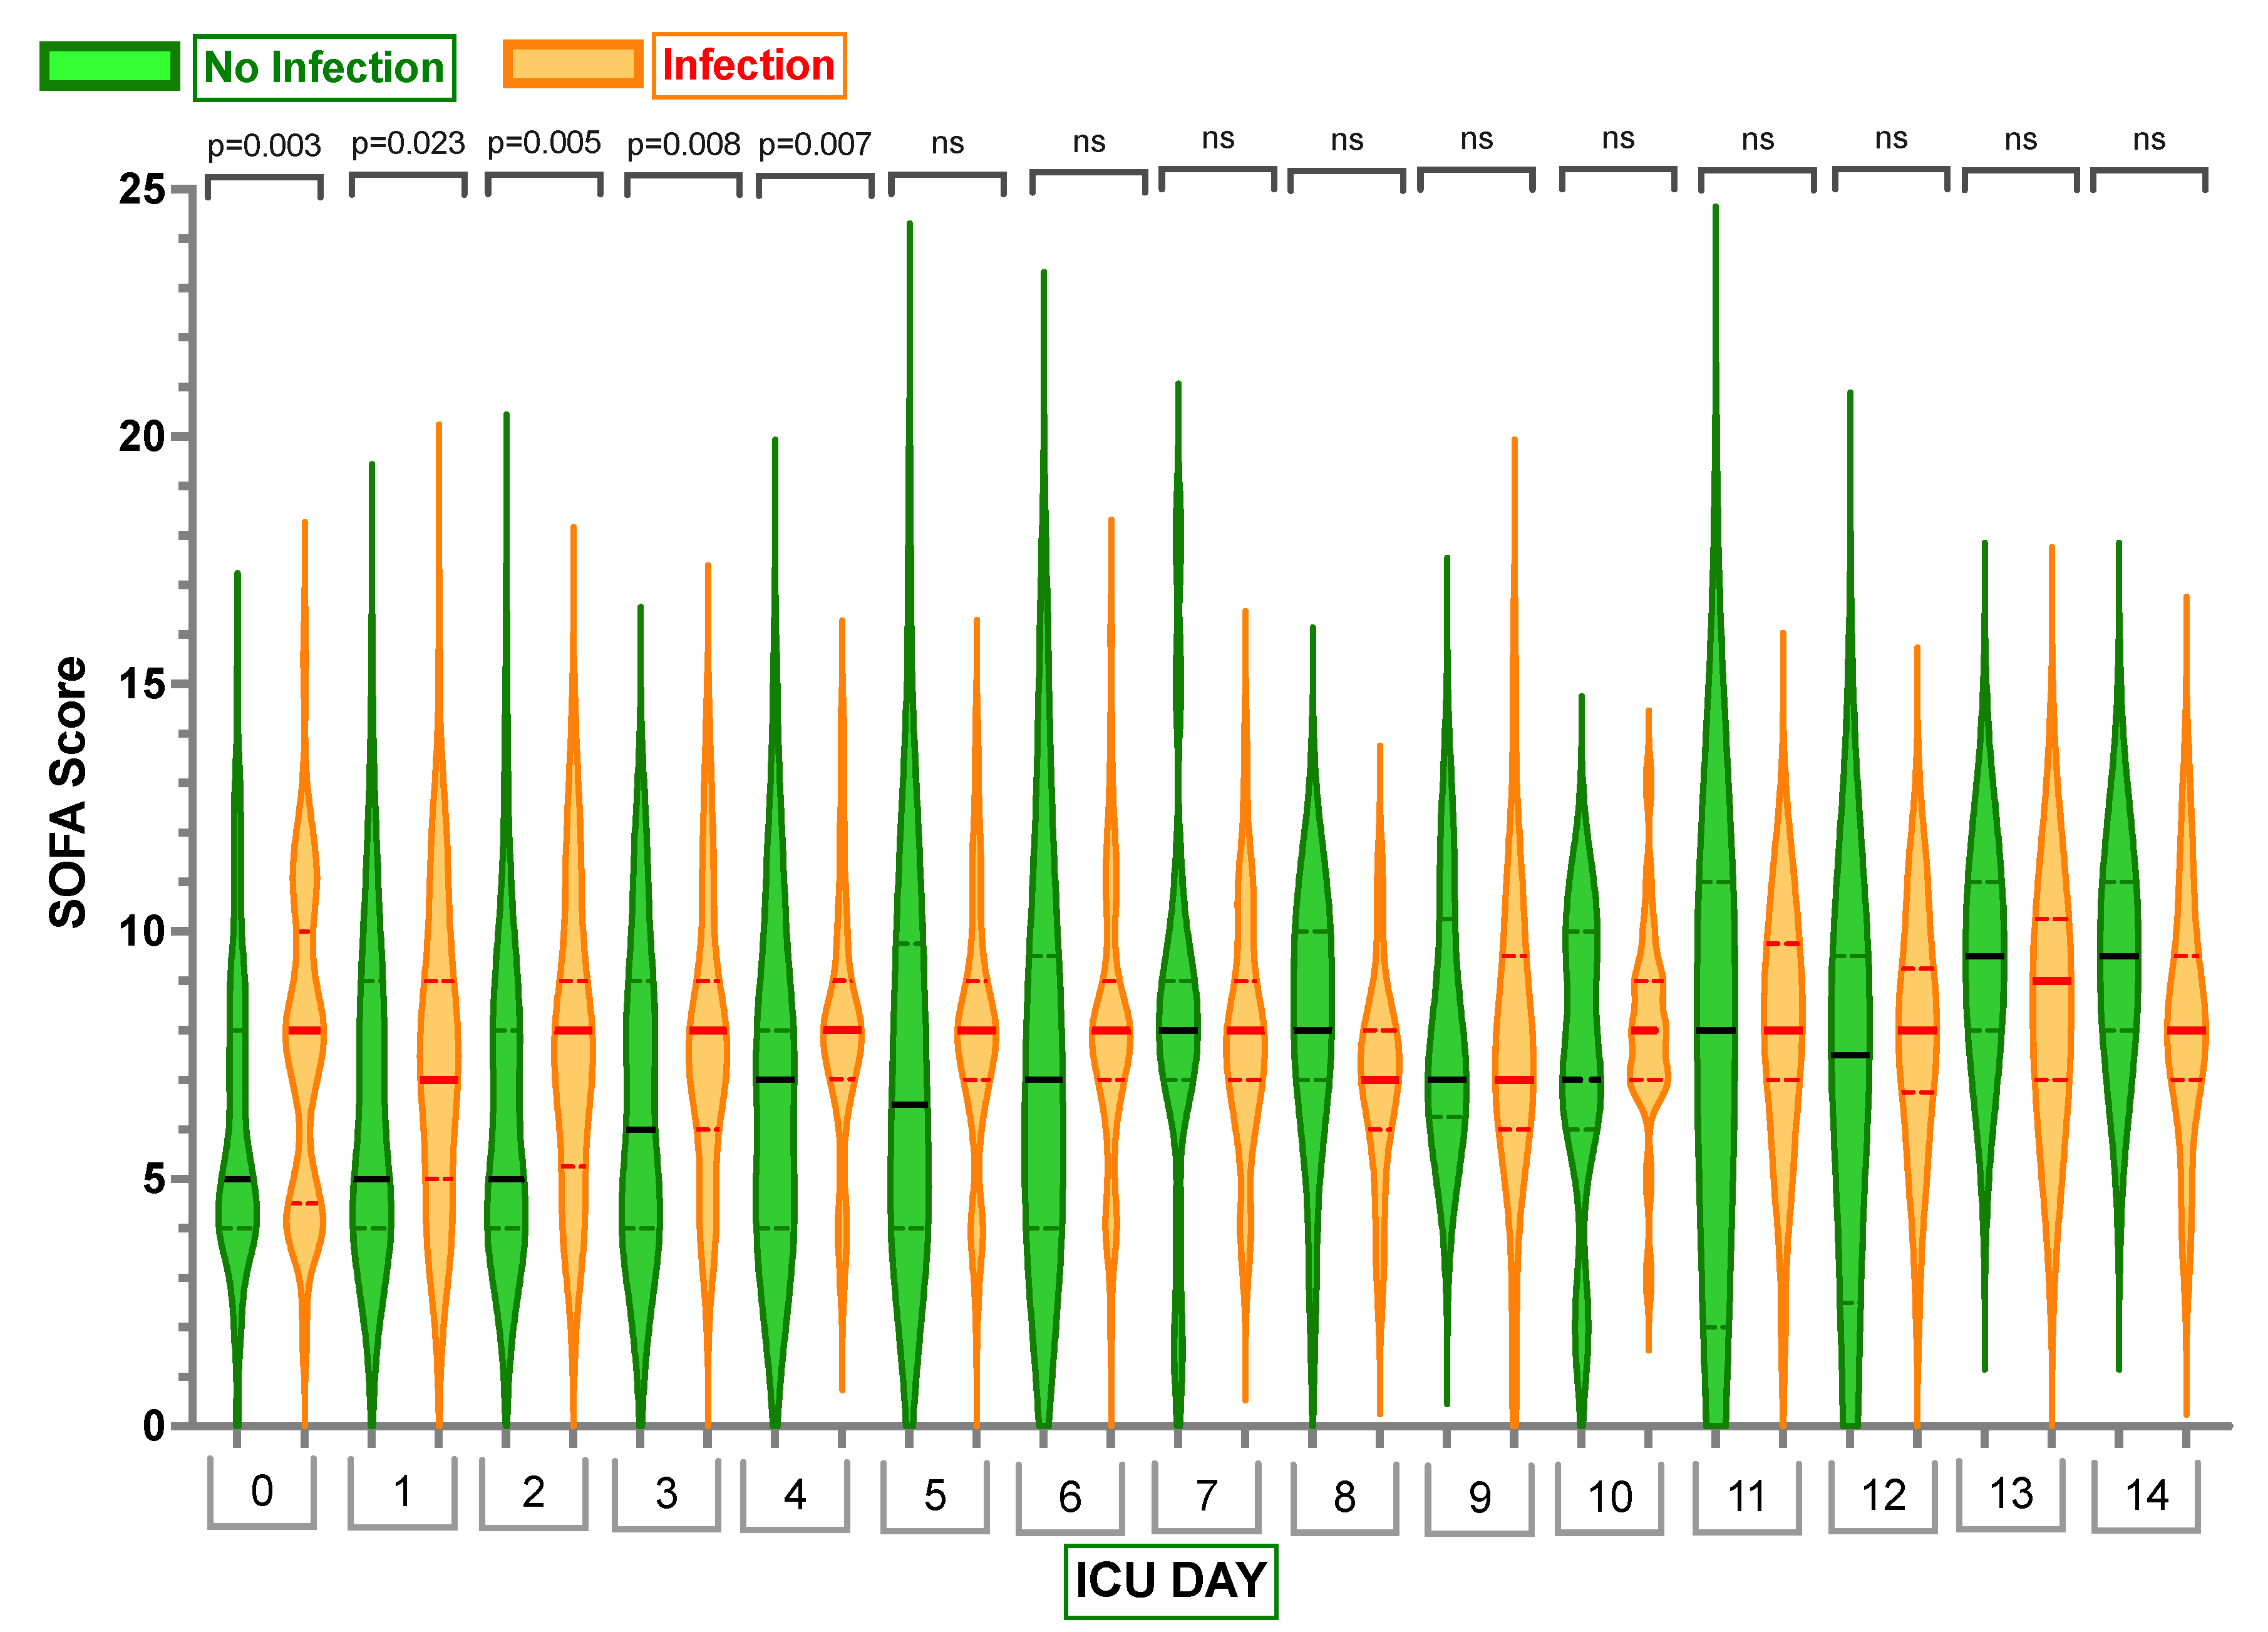
Appendix D. Median, Q1 (0.25) and Q3 (0.75) Sequential Organ Failure Assessment (SOFA) Scores for Day 0 to Day 14 in Those Who Had an Infection and Those Who Did Not
| Infection | 0.25 | Median | 0.75 | |
|---|---|---|---|---|
| SOFA Score 0 | no infection | 4.00 | 5.00 | 8.00 |
| infection | 4.50 | 8.00 | 10.00 | |
| SOFA Score 1 | no infection | 4.00 | 5.00 | 9.00 |
| infection | 5.00 | 7.00 | 9.00 | |
| SOFA Score 2 | no infection | 4.00 | 5.00 | 8.00 |
| infection | 5.25 | 8.00 | 9.00 | |
| SOFA Score 3 | no infection | 4.00 | 6.00 | 9.00 |
| infection | 6.00 | 8.00 | 9.00 | |
| SOFA Score 4 | no infection | 4.00 | 7.00 | 8.00 |
| infection | 7.00 | 8.00 | 9.00 | |
| SOFA Score 5 | no infection | 4.00 | 6.50 | 9.75 |
| infection | 7.00 | 8.00 | 9.00 | |
| SOFA Score 6 | no infection | 4.00 | 7.00 | 9.50 |
| infection | 7.00 | 8.00 | 9.00 | |
| SOFA Score 7 | no infection | 7.00 | 8.00 | 9.00 |
| infection | 7.00 | 8.00 | 9.00 | |
| SOFA Score 8 | no infection | 7.00 | 8.00 | 10.00 |
| infection | 6.00 | 7.00 | 8.00 | |
| SOFA Score 9 | no infection | 6.25 | 7.00 | 10.25 |
| infection | 6.00 | 7.00 | 9.50 | |
| SOFA Score 10 | no infection | 6.00 | 7.00 | 10.00 |
| infection | 7.00 | 8.00 | 9.00 | |
| SOFA Score 11 | no infection | 2.00 | 8.00 | . |
| infection | 7.00 | 8.00 | 9.75 | |
| SOFA Score 12 | no infection | 2.50 | 7.50 | 9.50 |
| infection | 6.75 | 8.00 | 9.25 | |
| SOFA Score 13 | no infection | 8.00 | 9.50 | . |
| infection | 7.00 | 9.00 | 10.25 | |
| SOFA Score 14 | no infection | 8.00 | 9.50 | . |
| infection | 7.00 | 8.00 | 9.50 |
References
- World Health Organisation. WHO Director-General’s Opening Remarks at the Media Briefing on COVID-19—11 March 2020. Who.int. 2020. Available online: https://www.who.int/director-general/speeches/detail/who-director-general-s-opening-remarks-at-the-media-briefing-on-covid-19---11-march-2020 (accessed on 30 June 2022).
- World Health Organisation. WHO Coronavirus (COVID-19) Dashboard. Covid19.who.int. 2022. Available online: https://covid19.who.int (accessed on 27 February 2023).
- Umakanthan, S.; Sahu, P.; Ranade, A.V.; Bukelo, M.M.; Rao, J.S.; Abrahao-Machado, L.F.; Dahal, S.; Kumar, H.; Kv, D. Origin, Transmission, Diagnosis and Management of Coronavirus Disease 2019 (COVID-19). Postgrad. Med. J. 2020, 96, 753–758. [Google Scholar] [PubMed]
- Docherty, A.B.; Harrison, E.M.; Green, C.A.; Hardwick, H.E.; Pius, R.; Norman, L.; Holden, K.A.; Read, J.M.; Dondelinger, F.; Carson, G.; et al. ISARIC4C investigators. Features of 20 133 UK patients in hospital with COVID-19 using the ISARIC WHO Clinical Characterisation Protocol: Prospective observational cohort study. BMJ 2020, 369, m1985. [Google Scholar] [CrossRef] [PubMed]
- Chen, N.; Zhou, M.; Dong, X.; Qu, J.; Gong, F.; Han, Y.; Qiu, Y.; Wang, J.; Liu, Y.; Wei, Y.; et al. Epidemiological and Clinical Characteristics of 99 cases of 2019 Novel Coronavirus Pneumonia in Wuhan, China: A descriptive study. Lancet 2020, 395, 507–513. [Google Scholar] [CrossRef] [PubMed]
- Huang, C.; Wang, Y.; Li, X.; Ren, L.; Zhao, J.; Hu, Y.; Zhang, L.; Fan, G.; Xu, J.; Gu, X.; et al. Clinical features of Patients Infected with 2019 Novel Coronavirus in Wuhan, China. Lancet 2020, 395, 497–506. [Google Scholar] [CrossRef]
- Vazzana, N.; Dipaola, F.; Ognibene, S. Procalcitonin and Secondary Bacterial Infections in COVID-19: Association with Disease Severity and Outcomes. Acta Clinica Belgica. 2020, 77, 268–272. [Google Scholar] [CrossRef]
- NICE. COVID-19 Rapid Guideline: Antibiotics for Pneumonia In Adults In Hospital. Nice.org.uk. 2020. Available online: https://www.ncbi.nlm.nih.gov/books/NBK566162/ (accessed on 28 February 2023).
- Russell, C.D.; Fairfield, C.J.; Drake, T.M.; Turtle, L.; Seaton, R.A.; Wootton, D.G.; Sigfrid, L.; Harrison, E.M.; Docherty, A.B.; de Silva, T.I.; et al. Co-infections, secondary infections, and antimicrobial use in patients hospitalised with COVID-19 during the first pandemic wave from the ISARIC WHO CCP-UK study: A Multicentre, prospective cohort study. Lancet Microbe 2021, 2, e354–e365. [Google Scholar] [CrossRef]
- Karami, Z.; Knoop, B.T.; Dofferhoff, A.S.M.; Blaauw, M.J.T.; Janssen, N.A.; van Apeldoorn, M.; Kerckhoffs, A.P.M.; van de Maat, J.S.; Hoogerwerf, J.J.; Oever, J.T. Few bacterial co-infections but frequent empiric antibiotic use in the early phase of hospitalized patients with COVID-19: Results from a multicentre retrospective cohort study in the Netherlands. Infect. Dis. 2020, 53, 102–110. [Google Scholar] [CrossRef]
- Getahun, H.; Smith, I.; Trivedi, K.; Paulin, S.; Balkhy, H.H. Tackling antimicrobial resistance in the COVID-19 pandemic. Bull. World Health Organ. 2020, 98, 442–442A. [Google Scholar] [CrossRef]
- Lynch, C.; Mahida, N.; Gray, J. Antimicrobial stewardship: A covid casualty? J. Hosp. Infect. 2020, 106, 401–403. [Google Scholar] [CrossRef]
- Global Action Plan on Antimicrobial Resistance. World Health Organization. World Health Organization. Available online: https://apps.who.int/iris/handle/10665/193736 (accessed on 28 February 2023).
- Schuetz, P.; Wirz, Y.; Sager, R.; Christ-Crain, M.; Stolz, D.; Tamm, M.; Bouadma, L.; Luyt, C.E.; Wolff, M.; Chastre, J.; et al. Effect of Procalcitonin-guided Antibiotic Treatment on Mortality in Acute Respiratory Infections: A patient level meta-analysis. Lancet Infect. Dis. 2018, 18, 95–107. [Google Scholar] [CrossRef]
- Powell, N.; Howard, P.; Llewelyn, M.J.; Szakmany, T.; Albur, M.; Bond, S.E.; Euden, J.; Brookes-Howell, L.; Dark, P.; Hellyer, T.P.; et al. Use of Procalcitonin During the First Wave of COVID-19 in the Acute NHS Hospitals: A Retrospective Observational Study. Antibiotics 2021, 10, 516. [Google Scholar] [CrossRef]
- Llewelyn, M.J.; Grozeva, D.; Howard, P.; Euden, J.; Gerver, S.M.; Hope, R.; Heginbothom, M.; Powell, N.; Richman, C.; Shaw, D.; et al. Impact of introducing Procalcitonin testing on antibiotic usage in acute NHS hospitals during the first wave of COVID-19 in the UK: A controlled interrupted time series analysis of organization-level data. J. Antimicrob. Chemother. 2022, 77, 1189–1196. [Google Scholar] [CrossRef]
- Williams, E.J.; Mair, L.; de Silva, T.I.; Green, D.J.; House, P.; Cawthron, K.; Gillies, C.; Wigfull, J.; Parsons, H.; Partridge, D.G. Evaluation of procalcitonin as a contribution to antimicrobial stewardship in SARS-COV-2 infection: A retrospective cohort study. J. Hosp. Infect. 2021, 110, 103–107. [Google Scholar] [CrossRef]
- Peters, C.; Williams, K.; Un, E.A.; Little, L.; Saad, A.; Lendrum, K.; Thompson, N.; Weatherley, N.D.; Pegden, A. Use of procalcitonin for antibiotic stewardship in patients with COVID-19: A quality improvement project in a District General Hospital. Clin. Med. 2020, 21, e71–e76. [Google Scholar] [CrossRef]
- Heesom, L.; Rehnberg, L.; Nasim-Mohi, M.; Jackson, A.I.R.; Celinski, M.; Dushianthan, A.; Cook, P.; Rivinberg, W.; Saeed, K. Procalcitonin as an antibiotic stewardship tool in COVID-19 patients in the Intensive Care Unit. J. Glob. Antimicrob. Resist. 2020, 22, 782–784. [Google Scholar] [CrossRef]
- Heer, R.S.; Mandal, A.K.J.; Kho, J.; Szawarski, P.; Csabi, P.; Grenshaw, D.; Walker, I.A.L.; Missouris, C.G. Elevated procalcitonin concentrations in severe COVID-19 may not reflect bacterial co-infection. Ann. Clin. Biochem. Int. J. Lab. Med. 2021, 58, 520–527. [Google Scholar] [CrossRef]
- Leticia Fernandez-Carballo, B.; Escadafal, C.; MacLean, E.; Kapasi, A.J.; Dittrich, S. Distinguishing bacterial versus non-bacterial causes of febrile illness—A systematic review of host biomarkers. J. Infect. 2021, 82, 1–10. [Google Scholar] [CrossRef]
- Richards, O.; Pallmann, P.; King, C.; Cheema, Y.; Killick, C.; Thomas-Jones, E.; Harris, J.; Bailey, C.; Szakmany, T. Procalcitonin Increase Is Associated with the Development of Critical Care-Acquired Infections in COVID-19 ARDS. Antibiotics 2021, 10, 1425. [Google Scholar] [CrossRef]
- NICE. Pneumonia (Hospital-Acquired): Antimicrobial Prescribing: Guidance. Nice.org.uk. 2019. Available online: https://www.nice.org.uk/guidance/ng139 (accessed on 28 February 2023).
- NICE. Pneumonia (Community-Acquired): Antimicrobial Prescribing: Guidance. Nice.org.uk. 2019. Available online: https://www.nice.org.uk/guidance/ng138 (accessed on 28 February 2023).
- NICE. COVID-19 Rapid Guideline: Identifying and Managing Co-Infections. Nice.org.uk. 2022. Available online: https://www.nice.org.uk/guidance/ng191/chapter/Recommendations (accessed on 28 February 2023).
- Simon, L.; Gauvin, F.; Amre, D.; Saint-Louis, P.; Lacroix, J. Serum Procalcitonin and C-Reactive Protein Levels as Markers of Bacterial Infection: A Systematic Review and Meta-analysis. Clin. Infect. Dis. 2004, 39, 206–217. [Google Scholar] [CrossRef]
- Pink, I.; Raupach, D.; Fuge, J.; Vonberg, R.-P.; Hoeper, M.M.; Welte, T.; Rademacher, J. C-reactive protein and procalcitonin for antimicrobial stewardship in COVID-19. Infection 2021, 49, 935–943. [Google Scholar] [CrossRef]
- Matwiyoff, G.N.; Prahl, J.D.; Miller, R.J.; Carmichael, J.J.; Amundson, D.E.; Seda, G.; Daheshia, M. Immune Regulation of Procalcitonin: A Biomarker and Mediator of Infection. Inflamm. Res. 2012, 61, 401–409. [Google Scholar] [CrossRef] [PubMed]
- Maruna, P.; Nedelníková, K.; Gürlich, R. Physiology and Genetics of Procalcitonin. Physiol. Res. 2000, 49, 57–61. [Google Scholar]
- Kooistra, E.J.; van Berkel, M.; van Kempen, N.F.; van Latum, C.R.M.; Bruse, N.; Frenzel, T.; Berg, M.J.W.V.D.; Schouten, J.A.; Kox, M.; Pickkers, P. Dexamethasone and tocilizumab treatment considerably reduces the value of C-reactive protein and PROCALCITONIN to detect secondary bacterial infections in COVID-19 patients. Crit. Care 2021, 25, 1–12. [Google Scholar] [CrossRef] [PubMed]
- Rawson, T.M.; Moore, L.S.P.; Zhu, N.; Ranganathan, N.; Skolimowska, K.; Gilchrist, M.; Satta, G.; Cooke, G.; Holmes, A.H. Bacterial and Fungal Coinfection in Individuals with Coronavirus: A Rapid Review to Support COVID-19 Antimicrobial Prescribing. Clin. Infect. Dis. 2020, 71, 2459–2468. [Google Scholar] [CrossRef]
- He, Y.; Li, W.; Wang, Z.; Chen, H.; Tian, L.; Liu, D. Nosocomial Infection Among Patients with COVID-19: A retrospective Data Analysis of 918 cases from a Single Center in Wuhan, China. Infect. Control. Hosp. Epidemiol. 2020, 41, 982–983. [Google Scholar] [CrossRef]
- Lansbury, L.; Lim, B.; Baskaran, V.; Lim, W. Co-infections in People with COVID-19: A systematic review and meta-analysis. J. Infect. 2020, 81, 266–275. [Google Scholar] [CrossRef]
- Dudoignon, E.; Caméléna, F.; Deniau, B.; Habay, A.; Coutrot, M.; Ressaire, Q.; Plaud, B.; Berçot, B.; Dépret, F. Bacterial Pneumonia in COVID-19 Critically Ill Patients: A Case Series. Clin. Infect. Dis. 2020, 72, 905–906. [Google Scholar] [CrossRef]
- Kollef, M.; Torres, A.; Shorr, A.; Martin-Loeches, I.; Micek, S. Nosocomial Infection. Crit. Care Med. 2021, 49, 169–187. [Google Scholar] [CrossRef]
- Morris, A.C.; Kohler, K.; De Corte, T.; Ercole, A.; De Grooth, H.-J.; Elbers, P.W.G.; Povoa, P.; Morais, R.; Koulenti, D.; Jog, S.; et al. Co-infection and ICU-acquired infection in COVID-19 ICU patients: A secondary analysis of the Unite-Covid Data Set. Crit. Care 2022, 26, 1–13. [Google Scholar] [CrossRef]
- Pandey, M.; May, A.; Tan, L.; Hughes, H.; Jones, J.P.; Harrison, W.; Bradburn, S.; Tyrrel, S.; Muthuswamy, B.; Berry, N.; et al. Comparative incidence of early and late bloodstream and respiratory tract co-infection in patients admitted to ICU with COVID-19 pneumonia versus influenza A or B pneumonia versus no viral pneumonia: Wales Multicentre ICU Cohort Study. Crit. Care. 2022, 26, 1–12. [Google Scholar] [CrossRef]
- Giacobbe, D.R.; Battaglini, D.; Ball, L.; Brunetti, I.; Bruzzone, B.; Codda, G.; Crea, F.; De Maria, A.; Dentone, C.; Di Biagio, A.; et al. Bloodstream Infections in Critically Ill Patients with COVID-19. Eur. J. Clin. Investig. 2020, 50, e13319. [Google Scholar] [CrossRef]
- Hall, K.; Lyman, J. Updated Review of Blood Culture Contamination. Clin. Microbiol. Rev. 2006, 19, 788–802. [Google Scholar] [CrossRef]
- Carbonell, R.; Urgelés, S.; Rodríguez, A.; Bodí, M.; Martín-Loeches, I.; Solé-Violán, J.; Díaz, E.; Gómez, J.; Trefler, S.; Vallverdú, M.; et al. Mortality comparison between the first and second/third waves among 3,795 critical COVID-19 patients with pneumonia admitted to the ICU: A multicentre retrospective cohort study. Lancet Reg. Health—Eur. 2021, 11, 100243. [Google Scholar] [CrossRef]
- Bardi, T.; Pintado, V.; Gomez-Rojo, M.; Escudero-Sanchez, R.; Lopez, A.A.; Diez-Remesal, Y.; Castro, N.M.; Ruiz-Garbajosa, P.; Pestaña, D. Nosocomial Infections Associated to COVID-19 in the Intensive Care Unit: Clinical Characteristics and Outcome. Eur. J. Clin. Microbiol. Infect. Dis. 2021, 40, 495–502. [Google Scholar] [CrossRef]
- Alqahtani, A.; Alamer, E.; Mir, M.; Alasmari, A.; Alshahrani, M.M.; Asiri, M.; Ahmad, I.; Alhazmi, A.; Algaissi, A. Bacterial coinfections increase mortality of severely ill COVID-19 patients in Saudi Arabia. Int. J. Environ. Res. Public Health 2022, 19, 2424. [Google Scholar] [CrossRef]
- Silva, D.; Lima, C.; Magalhães, V.; Baltazar, L.; Peres, N.; Caligiorne, R.; Moura, A.; Fereguetti, T.; Martins, J.; Rabelo, L.; et al. Fungal and bacterial coinfections increase mortality of severely ill COVID-19 patients. J. Hosp. Infect. 2021, 113, 145–154. [Google Scholar] [CrossRef]
- He, S.; Liu, W.; Jiang, M.; Huang, P.; Xiang, Z.; Deng, D.; Chen, P.; Xie, L. Clinical characteristics of COVID-19 patients with clinically diagnosed bacterial co-infection: A multi-center study. PLoS ONE 2021, 16, e0249668. [Google Scholar] [CrossRef]
- Bonazzetti, C.; Rinaldi, M.; Giacomelli, A.; Colombo, R.; Ottolina, D.; Rimoldi, S.G.; Pagani, C.; Morena, V.; Ridolfo, A.L.; Vatamanu, O.; et al. Risk Factors Associated with Bacteremia in COVID-19 Patients Admitted to Intensive Care Unit: A Retrospective Multicenter Cohort Study. Infection 2023, 51, 129–136. [Google Scholar] [CrossRef]
- Van Vught, L.A.; Klouwenberg, P.M.C.K.; Spitoni, C.; Scicluna, B.P.; Wiewel, M.A.; Horn, J.; Schultz, M.J.; Nürnberg, P.; Bonten, M.J.M.; Cremer, O.L.; et al. Incidence, Risk Factors, and Attributable Mortality of Secondary Infections in the Intensive Care Unit After Admission for Sepsis. JAMA 2016, 315, 1469–1479. [Google Scholar] [CrossRef]
- Sinha, P.; Calfee, C.S.; Cherian, S.; Brealey, D.; Cutler, S.; King, C.; Killick, C.; Richards, O.; Cheema, Y.; Bailey, C.; et al. Prevalence of Phenotypes of Acute Respiratory Distress Syndrome in Critically Ill Patients with COVID-19: A Prospective Observational Study. Lancet Respir. Med. 2020, 8, 1209–1218. [Google Scholar] [CrossRef]
- Reyes, L.F.; Rodriguez, A.; Bastidas, A.; Parra-Tanoux, D.; Fuentes, Y.V.; García-Gallo, E.; Moreno, G.; Ospina-Tascon, G.; Hernandez, G.; Silva, E.; et al. Dexamethasone as risk-factor for ICU-acquired respiratory tract infections in severe COVID-19. J. Crit. Care 2022, 69, 154014. [Google Scholar] [CrossRef] [PubMed]
- Horby, P.; Lim, W.S.; Emberson, J.R.; Mafham, M.; Bell, J.L.; Linsell, L.; Staplin, N.; Brightling, C.; Ustianowski, A.; RECOVERY Collaborative Group; et al. Dexamethasone in Hospitalized Patients with COVID-19. N. Engl. J. Med. 2021, 384, 693–704. [Google Scholar] [CrossRef] [PubMed]
- Szakmany, T.; Tuckwell, W.; Harte, E.; Wetherall, N.; Ramachandran, S.; Price, S.; Breen, H.; Killick, C.; Cheema, Y.; King, C.; et al. Differences in Inflammatory Marker Kinetics between the First and Second Wave of COVID-19 Patients Admitted to the ICU: A Retrospective, Single-Center Study. J. Clin. Med. 2021, 10, 3290. [Google Scholar] [CrossRef] [PubMed]
- Gordon, A.C.; Mouncey, P.R.; Al-Beidh, F.; Rowan, K.M.; Nichol, A.D.; Arabi, Y.M.; Annane, D.; Beane, A.; Van Bentum-Puijk, W.; Berry, L.R.; et al. Interleukin-6 Receptor Antagonists in Critically Ill Patients with COVID-19. N. Engl. J. Med. 2021, 384, 1491–1502. [Google Scholar] [CrossRef]
- RECOVERY Collaborative Group. Tocilizumab in patients admitted to hospital with COVID-19 (RECOVERY): A randomised, controlled, open-label, platform trial. Lancet 2021, 397, 1637–1645. [Google Scholar] [CrossRef]
- RECOVERY Collaborative Group. Baricitinib in patients admitted to hospital with COVID-19 (RECOVERY): A randomised, controlled, open-label, platform trial and updated meta-analysis. Lancet 2022, 400, 359–368. [Google Scholar] [CrossRef]
- Tong, D.L.; Kempsell, K.E.; Szakmany, T.; Ball, G. Development of a Bioinformatics Framework for Identification and Validation of Genomic Biomarkers and Key Immunopathology Processes and Controllers in Infectious and Non-infectious Severe Inflammatory Response Syndrome. Front. Immunol. 2020, 11, 380. [Google Scholar] [CrossRef]
- Poole, S.; Tanner, A.R.; Naidu, V.V.; Borca, F.; Phan, H.; Saeed, K.; Grocott, M.P.W.; Dushianthan, A.; Moyses, H.; Clark, T.W. Molecular point-of-care testing for lower respiratory tract pathogens improves safe antibiotic de-escalation in patients with pneumonia in the ICU: Results of a randomised controlled trial. J. Infect. 2022, 85, 625–633. [Google Scholar] [CrossRef]


| Count (n) (No Infection/ Infection) | No Infection (n = 115) | Infection (n = 119) | Overall (n = 234) | |
|---|---|---|---|---|
| Age (years) | ||||
| Mean (SD) | (115/119) | 56.58 (14.33) | 55.08 (12.386) | 55.81 (13.37) |
| Median [Min, Max] | 60 [28, 80] | 57 [23, 76] | 58 [23, 80] | |
| Sex (Male/Female, n) | (115/119) | 87/28 | 85/34 | 172/62 |
| Outcome | (115/119) | |||
| Alive (n, %) | 76 (66.7%) | 63 (52.9%) | 139 (59.7%) | |
| Deceased (n, %) | 38 (33%) | 56 (47.1%) | 94 (40.3%) | |
| Comorbidities | (115/119) | |||
| Diabetes | 28 (24.6%) | 29 (24.4%) | 57 (24.4%) | |
| Hypertension | 33 (28.9%) | 42 (35.3%) | 75 (32.2%) | |
| Cardiovascular disease | 16 (14.2%) | 16 (13.4%) | 233 (13.8%) | |
| COPD | 8 (7%) | 3 (2.5%) | 11 (4.7%) | |
| Asthma | 18 (15.8%) | 26 (21.8%) | 44 (18.9%) | |
| Renal Impairment | 11 (9.6%) | 4 (3.4%) | 15 (6.4%) | |
| SOFA score Day 0 | (91/97) | |||
| Mean (SD) | 6.22 (3.1) | 7.62 (3.06) | 6.95 (3.14) | |
| Median [Min, Max] | 5 [0, 15] | 8 [2, 16] | 7 [0, 16] | |
| Length of ICU stay (days) | (115/119) | |||
| Mean (SD) | 6.15 (6.2) | 16.38 (13.1) | 11.29 (11.47) | |
| Median [Min, Max] | 5 [0.08, 52.2] | 12.3 [0, 72.5] | 7.5 [0, 72.5} |
| Infection | 0.25 | Median | 0.75 | Count (n) | |
|---|---|---|---|---|---|
| Day of admission ng/mL | no infection | 0.10 | 0.23 | 0.77 | 115 |
| Infection | 0.10 | 0.18 | 0.54 | 119 | |
| Day 1 ng/mL | no infection | 0.09 | 0.30 | 1.26 | 112 |
| Infection | 0.11 | 0.23 | 0.75 | 112 | |
| Day 2 ng/mL | no infection | 0.10 | 0.24 | 0.81 | 105 |
| Infection | 0.09 | 0.18 | 0.69 | 111 | |
| Day 3 ng/mL | no infection | 0.08 | 0.18 | 0.86 | 91 |
| Infection | 0.06 | 0.12 | 0.43 | 110 | |
| Day 4 ng/mL | no infection | 0.06 | 0.13 | 0.57 | 76 |
| Infection | 0.06 | 0.15 | 0.41 | 106 | |
| Day 5 ng/mL | no infection | 0.06 | 0.11 | 0.64 | 65 |
| Infection | 0.06 | 0.11 | 0.35 | 100 | |
| Day 6 ng/mL | no infection | 0.06 | 0.10 | 0.40 | 49 |
| Infection | 0.07 | 0.12 | 0.68 | 96 | |
| Day 7 ng/mL | no infection | 0.09 | 0.24 | 2.05 | 37 |
| Infection | 0.07 | 0.16 | 0.70 | 94 | |
| Day 8 ng/mL | no infection | 0.06 | 0.12 | 0.43 | 27 |
| Infection | 0.06 | 0.14 | 0.55 | 88 | |
| Day 9 ng/mL | no infection | 0.11 | 0.22 | 0.63 | 19 |
| Infection | 0.12 | 0.29 | 0.51 | 79 | |
| Day 10 ng/mL | no infection | 0.08 | 0.24 | 0.61 | 16 |
| Infection | 0.08 | 0.24 | 1.68 | 72 | |
| Day 11 ng/mL | no infection | 0.06 | 0.16 | 0.69 | 12 |
| Infection | 0.12 | 0.25 | 1.61 | 68 | |
| Day 12 ng/mL | no infection | 0.08 | 0.13 | 2.84 | 11 |
| Infection | 0.10 | 0.21 | 2.09 | 63 | |
| Day 13 ng/mL | no infection | 0.45 | 2.17 | 2.91 | 9 |
| Infection | 0.14 | 0.33 | 2.29 | 57 | |
| Day 14 ng/mL | no infection | 0.14 | 0.33 | 1.17 | 5 |
| Infection | 0.10 | 0.30 | 1.58 | 54 |
Disclaimer/Publisher’s Note: The statements, opinions and data contained in all publications are solely those of the individual author(s) and contributor(s) and not of MDPI and/or the editor(s). MDPI and/or the editor(s) disclaim responsibility for any injury to people or property resulting from any ideas, methods, instructions or products referred to in the content. |
© 2023 by the authors. Licensee MDPI, Basel, Switzerland. This article is an open access article distributed under the terms and conditions of the Creative Commons Attribution (CC BY) license (https://creativecommons.org/licenses/by/4.0/).
Share and Cite
Harte, E.; Kumarasamysarma, S.; Phillips, B.; Mackay, O.; Rashid, Z.; Malikova, N.; Mukit, A.; Ramachandran, S.; Biju, A.; Brown, K.; et al. Procalcitonin Values Fail to Track the Presence of Secondary Bacterial Infections in COVID-19 ICU Patients. Antibiotics 2023, 12, 709. https://doi.org/10.3390/antibiotics12040709
Harte E, Kumarasamysarma S, Phillips B, Mackay O, Rashid Z, Malikova N, Mukit A, Ramachandran S, Biju A, Brown K, et al. Procalcitonin Values Fail to Track the Presence of Secondary Bacterial Infections in COVID-19 ICU Patients. Antibiotics. 2023; 12(4):709. https://doi.org/10.3390/antibiotics12040709
Chicago/Turabian StyleHarte, Elsa, Sharuha Kumarasamysarma, Benjamin Phillips, Olivia Mackay, Zohra Rashid, Natalya Malikova, Abdullah Mukit, Saraswathi Ramachandran, Anna Biju, Kate Brown, and et al. 2023. "Procalcitonin Values Fail to Track the Presence of Secondary Bacterial Infections in COVID-19 ICU Patients" Antibiotics 12, no. 4: 709. https://doi.org/10.3390/antibiotics12040709
APA StyleHarte, E., Kumarasamysarma, S., Phillips, B., Mackay, O., Rashid, Z., Malikova, N., Mukit, A., Ramachandran, S., Biju, A., Brown, K., Watts, R., Hodges, C., Tuckwell, W., Wetherall, N., Breen, H., Price, S., & Szakmany, T. (2023). Procalcitonin Values Fail to Track the Presence of Secondary Bacterial Infections in COVID-19 ICU Patients. Antibiotics, 12(4), 709. https://doi.org/10.3390/antibiotics12040709