
Molecular Characterization and Epidemiology of Antibiotic Resistance Genes of β-Lactamase Producing Bacterial Pathogens Causing Septicemia from Tertiary Care Hospitals

 ,
,  , ,
, ,
Abstract
1. Introduction
2. Results
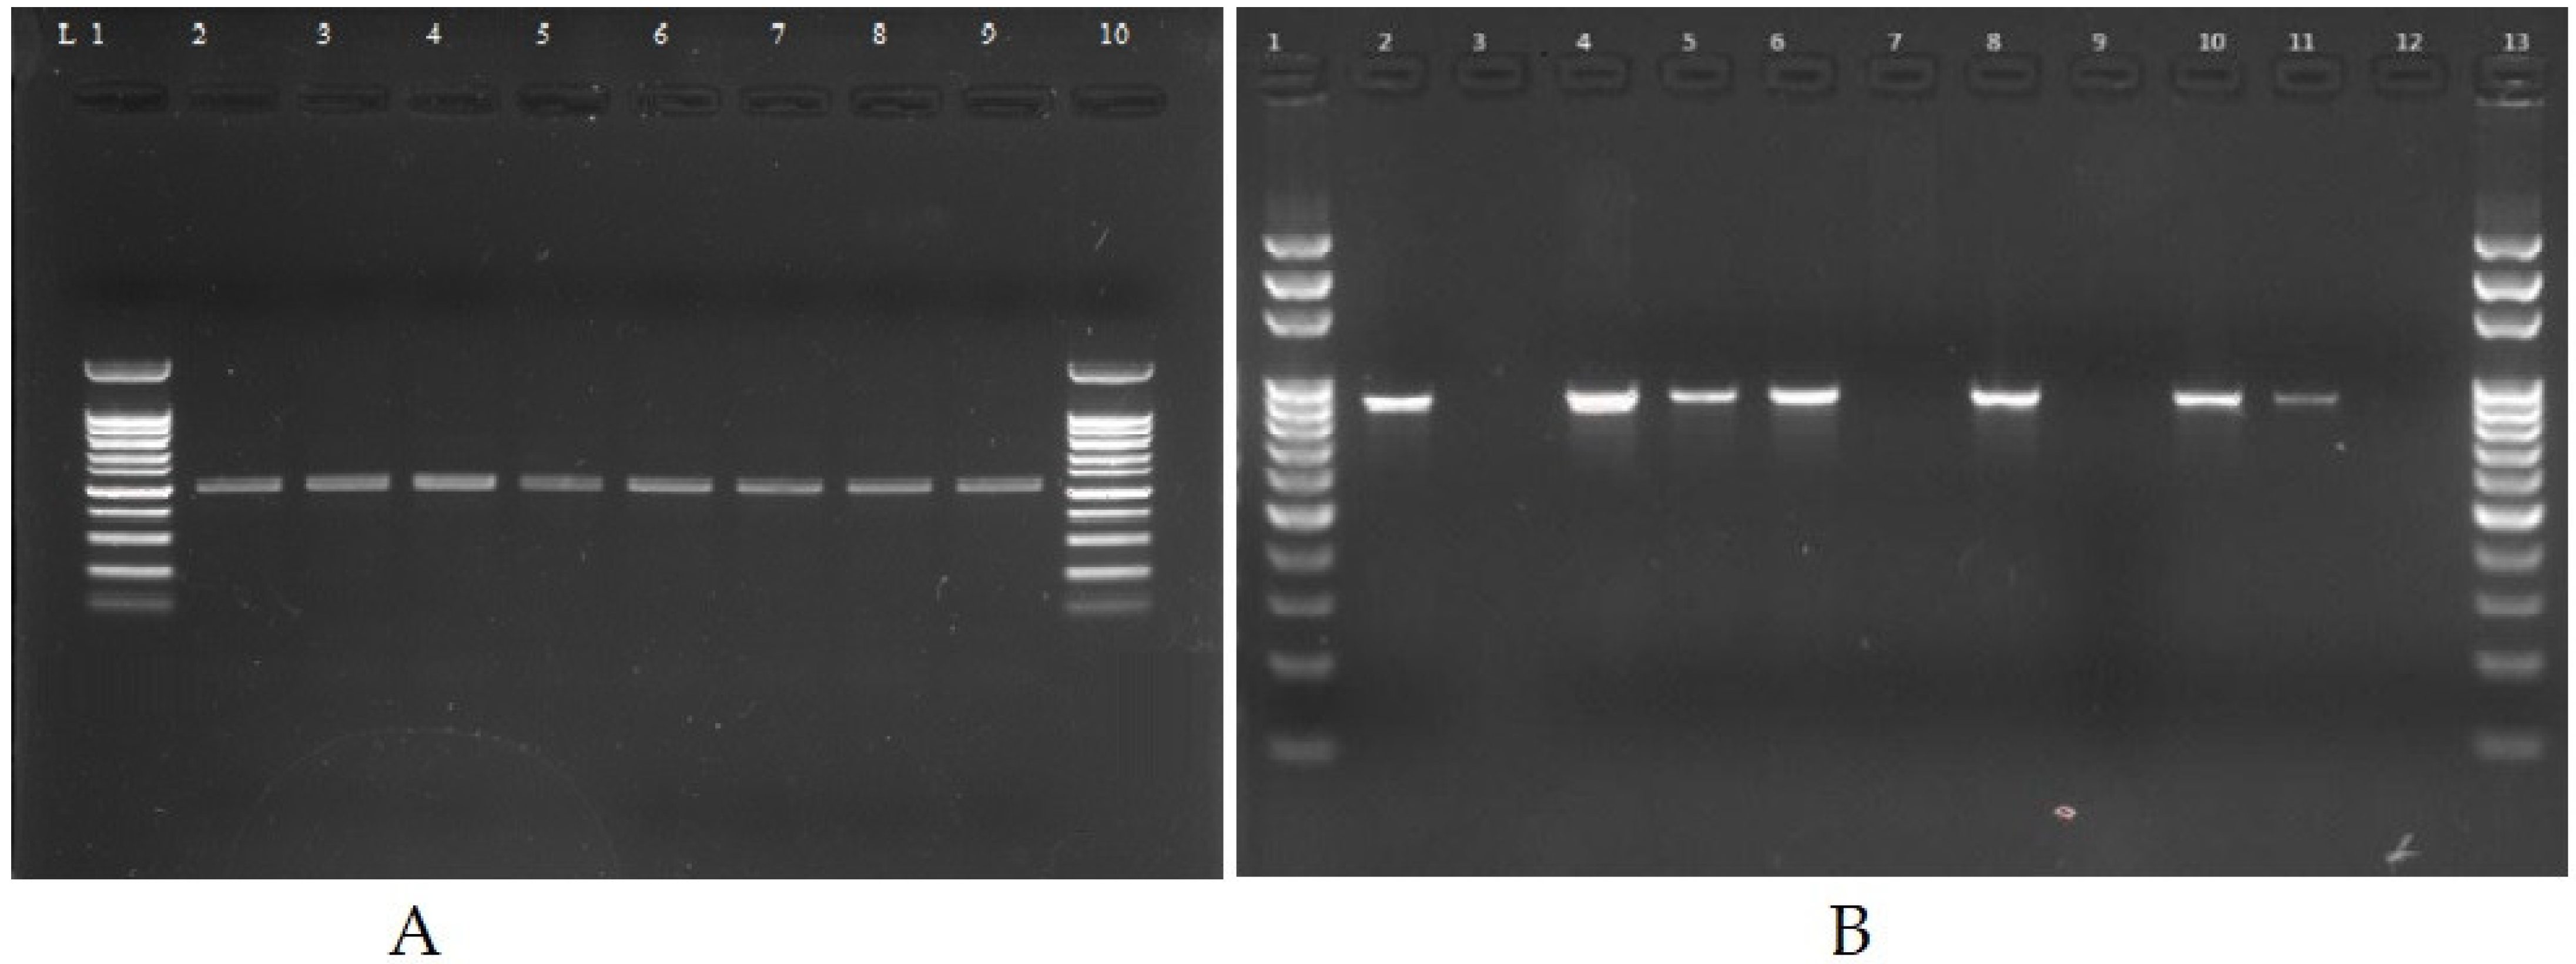
2.1. Identification of Bacterial Isolates
2.2. Antibiotic Susceptibility Pattern of Clinical Isolates
2.3. Determination of Minimum Inhibitory Concentration
2.4. Phenotypic and Genotypic Identification of β-Lactamase Producers
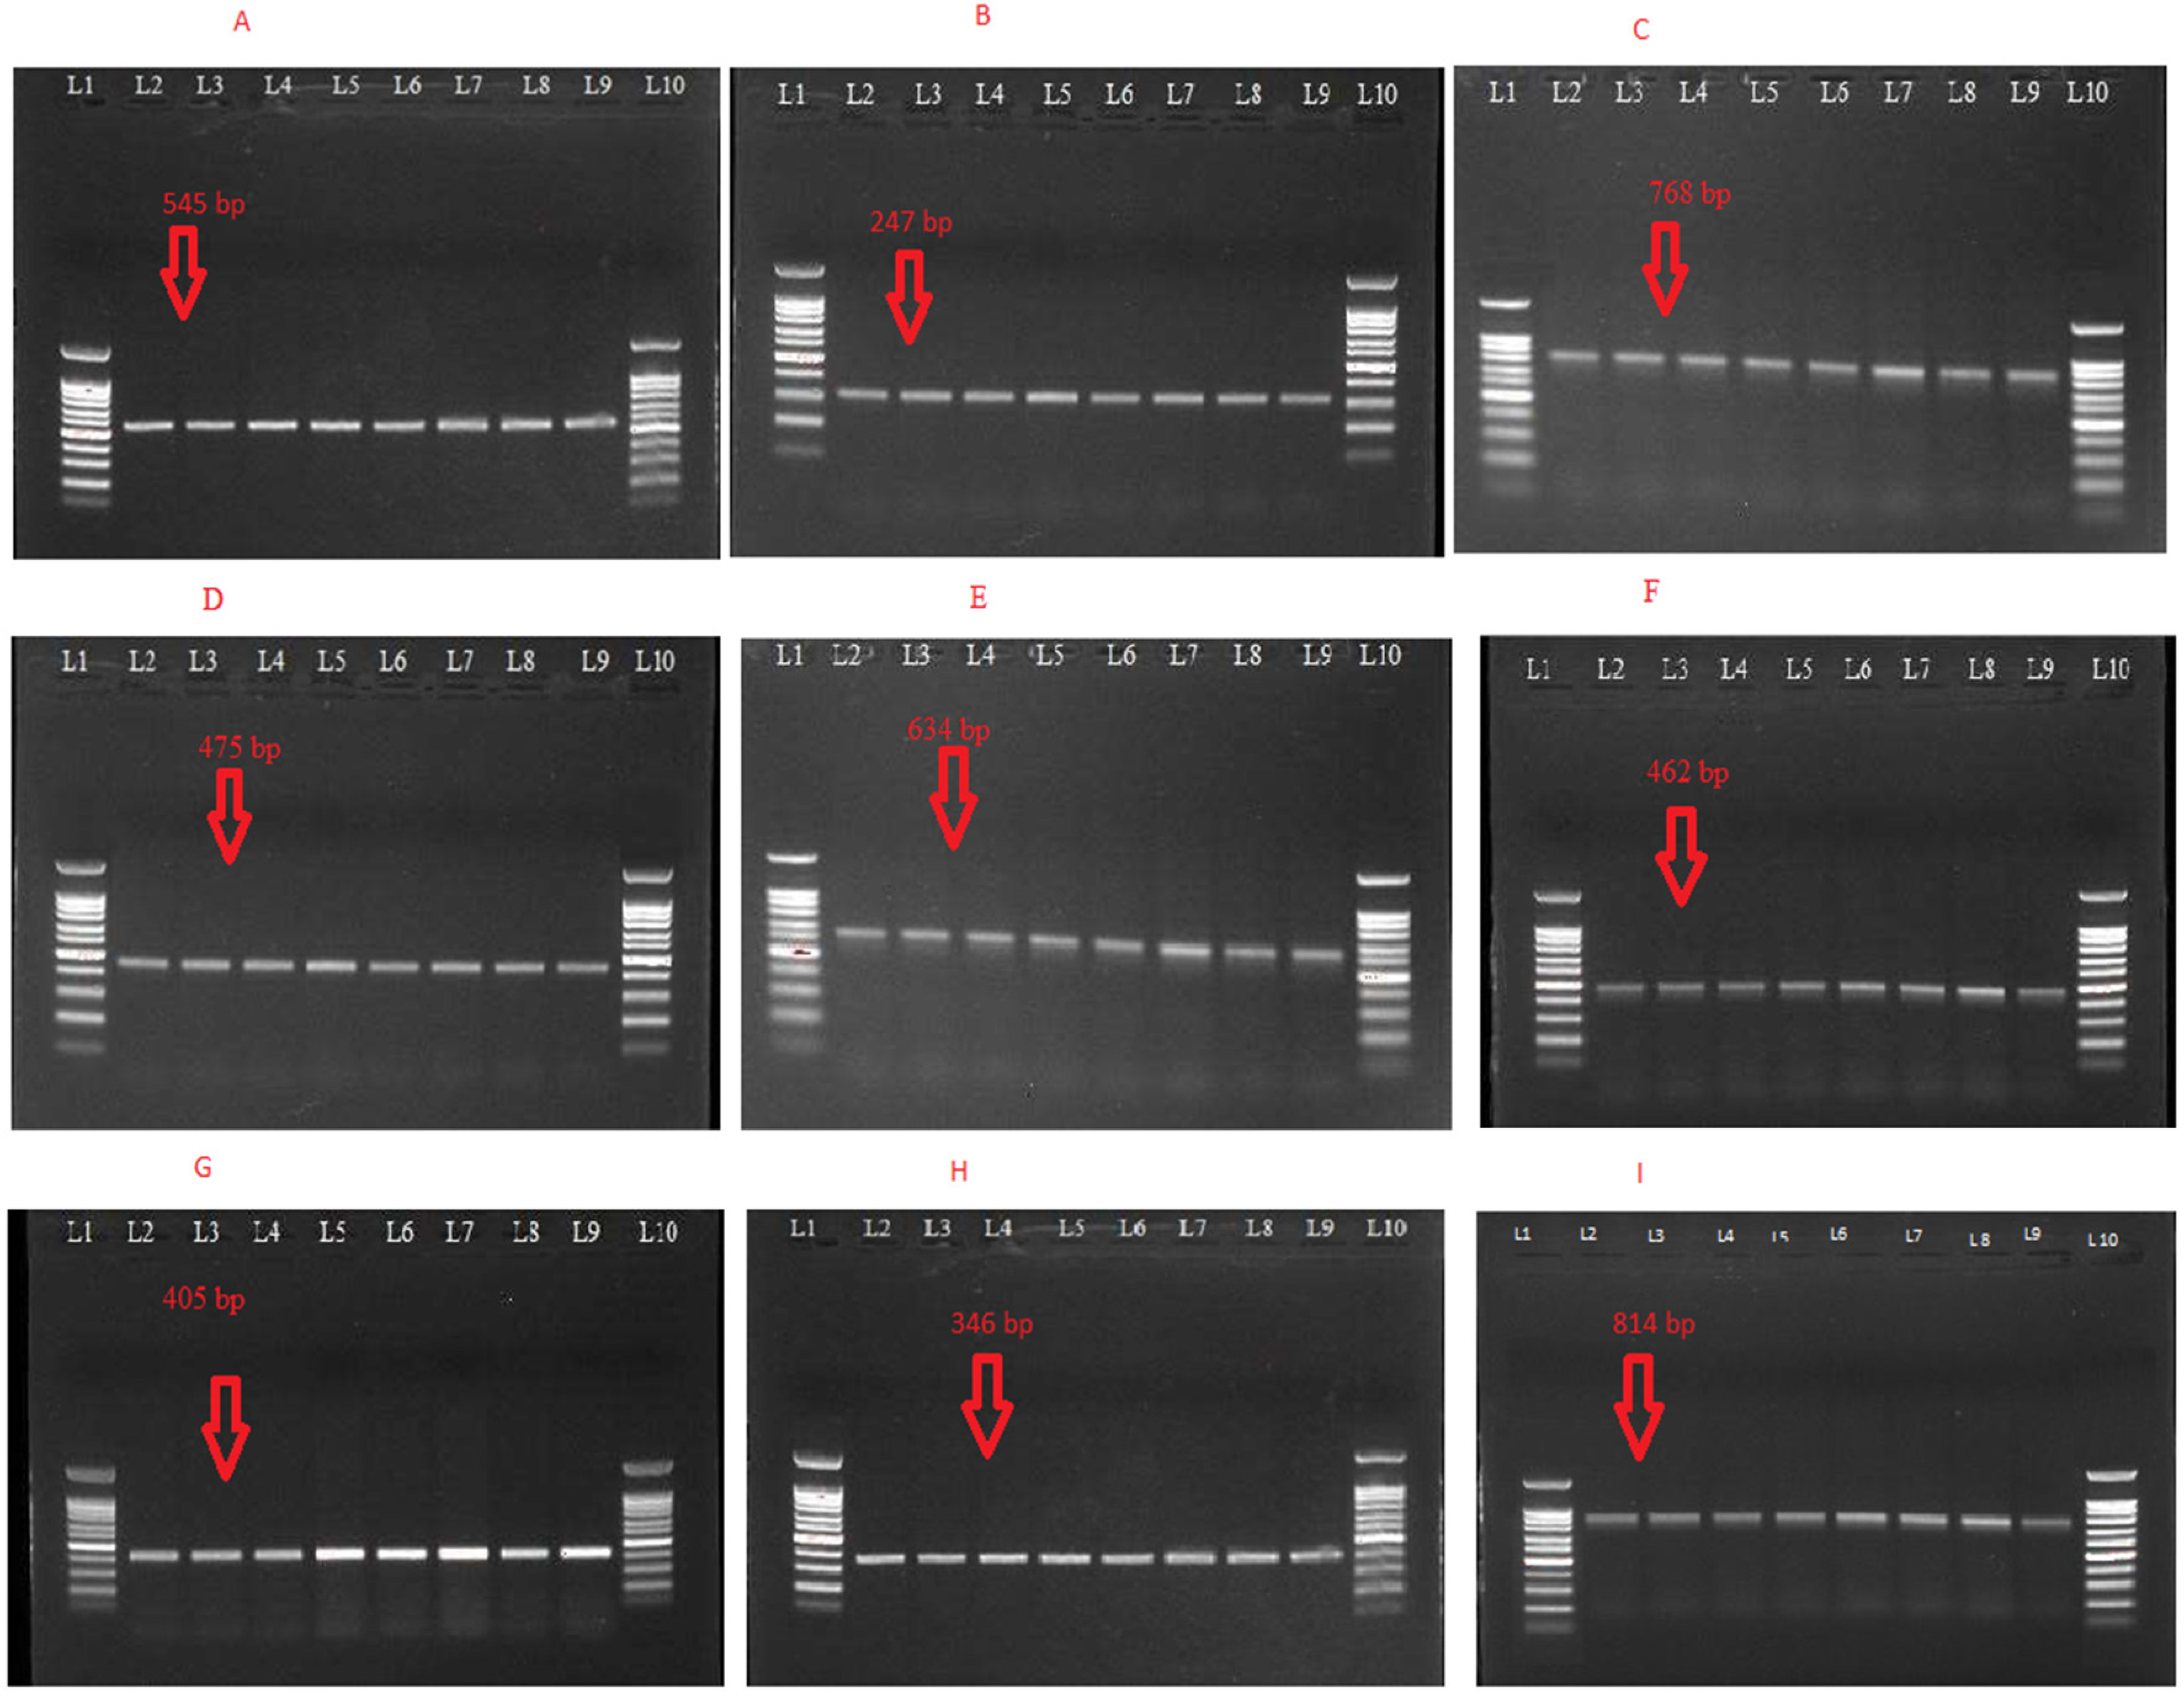
2.5. Characterization of ESBLs Gene(s), MBLs and AmpC β-Lactamase Resistance Genes
2.6. Mutational Analysis ESBLs Gene(s), MBLs and AmpC β-Lactamase Resistance Genes
3. Discussion
4. Conclusions
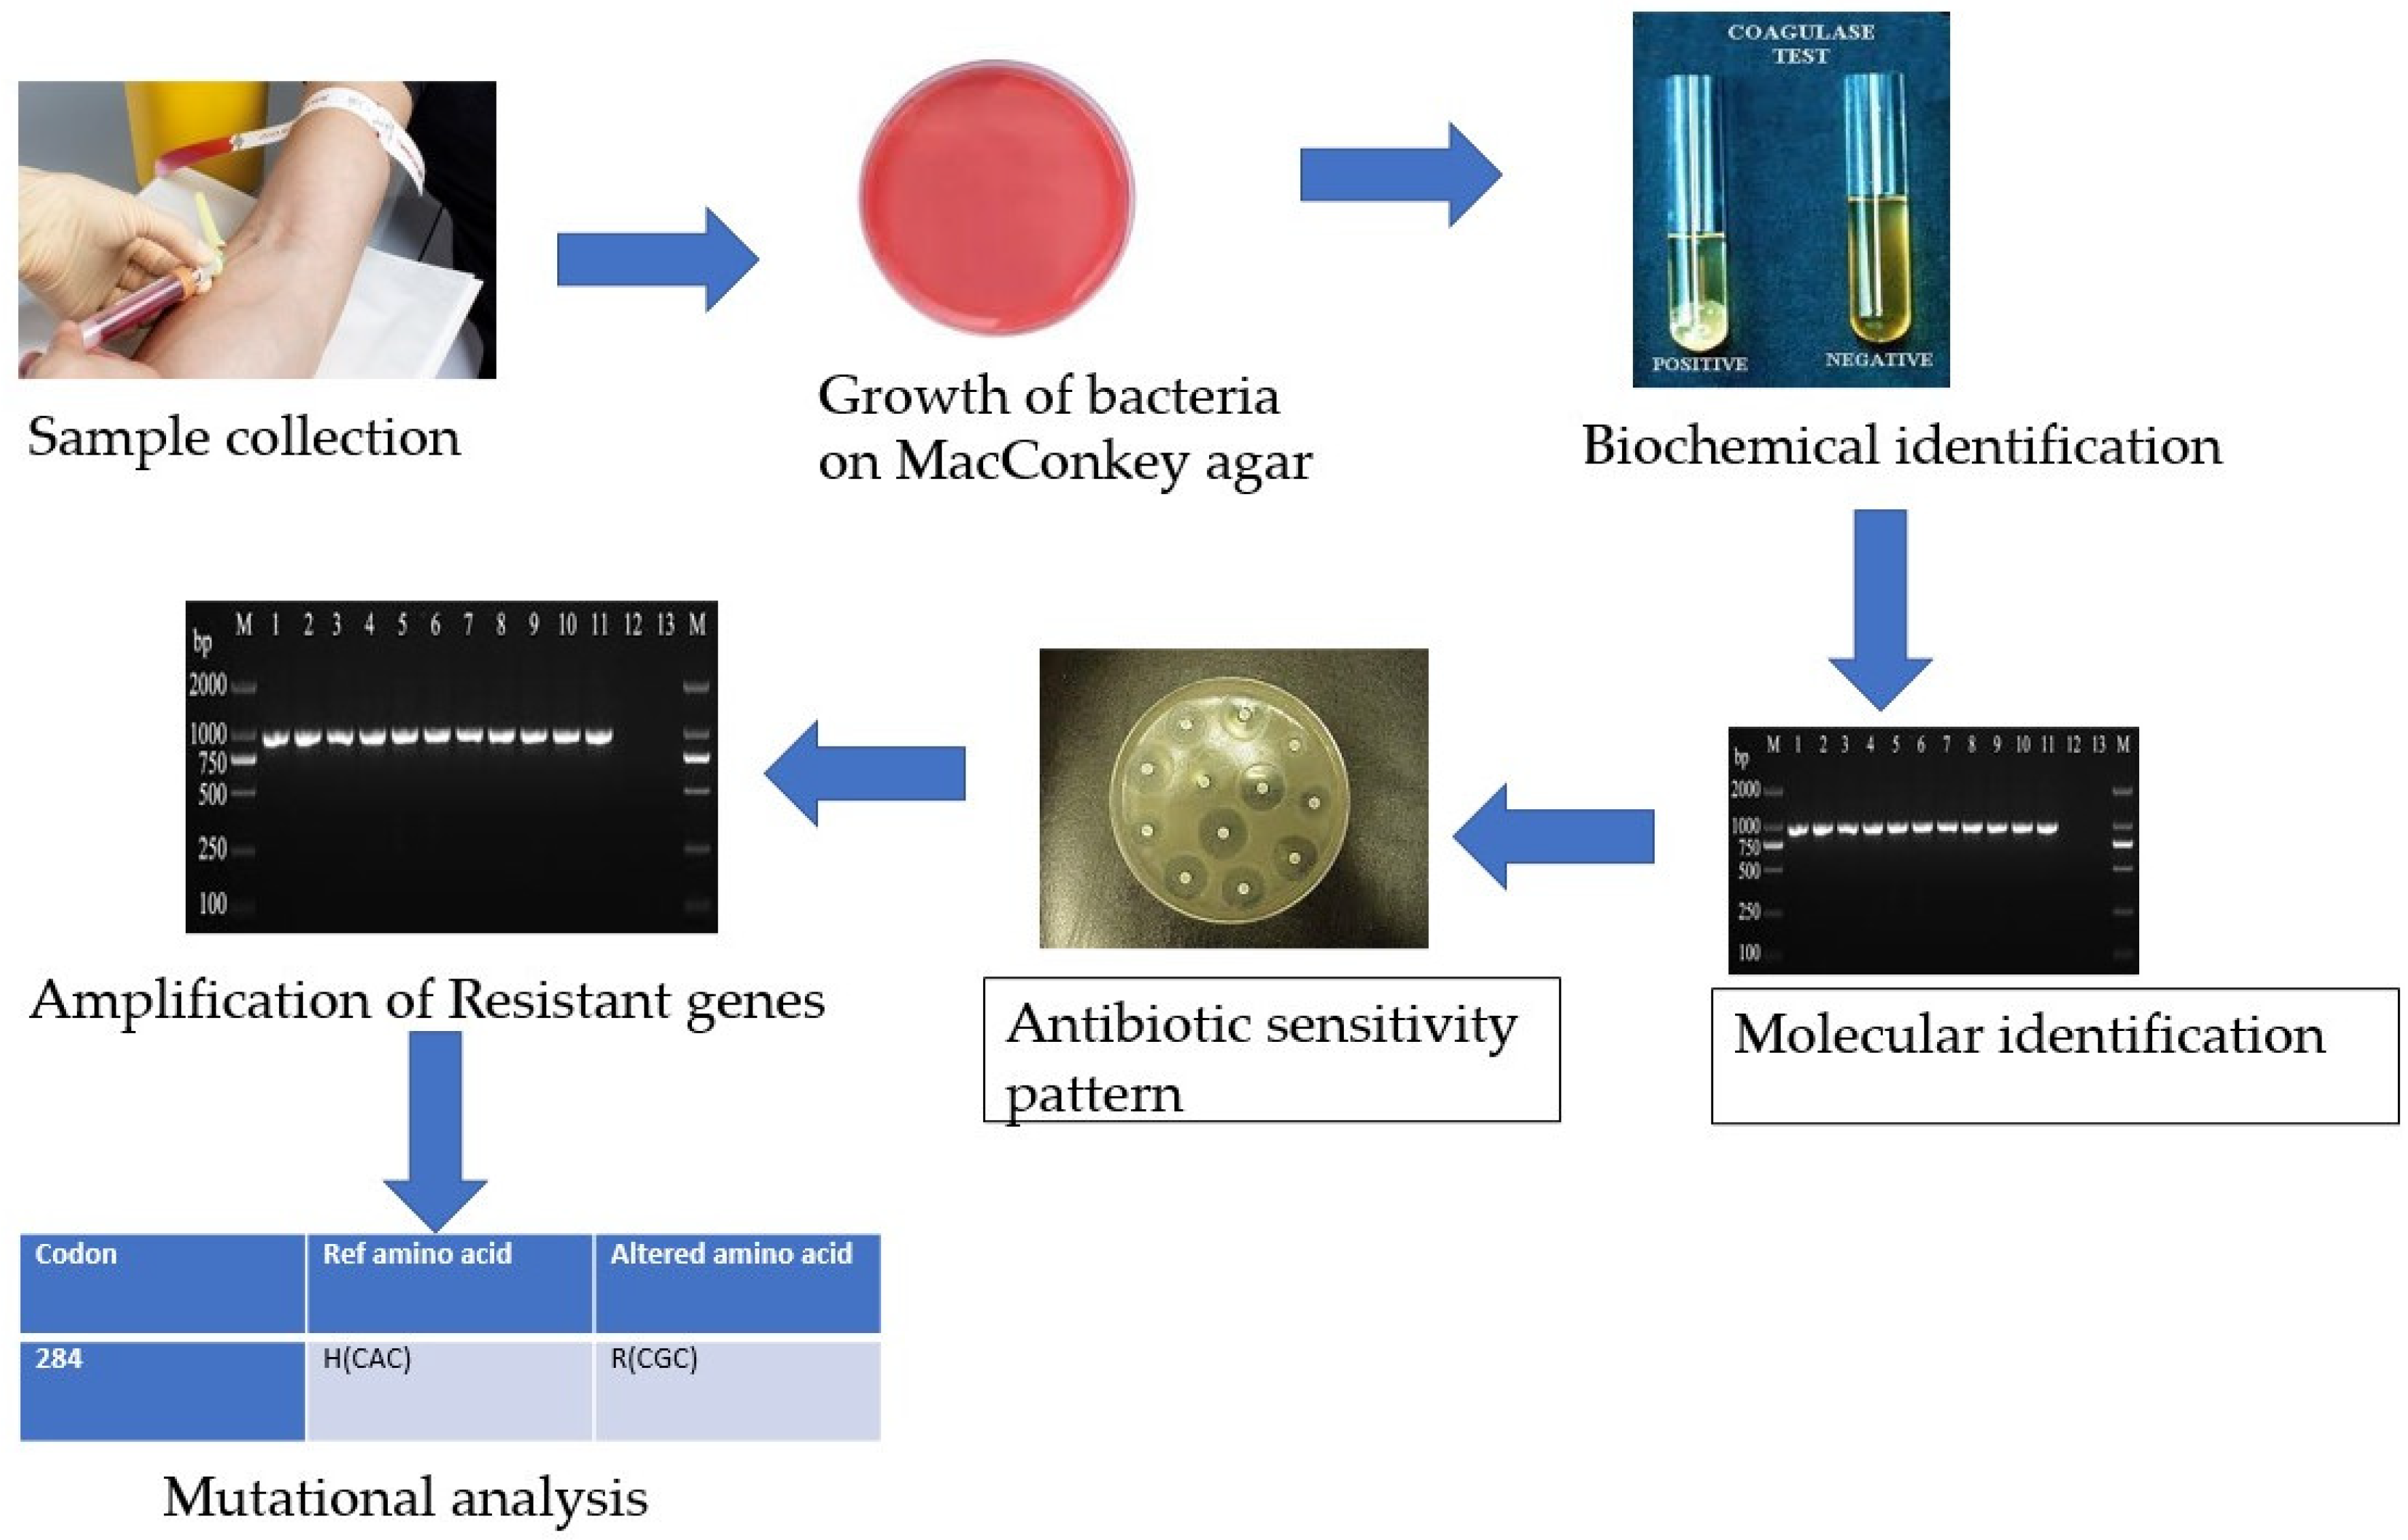
5. Materials and Methods
5.1. Isolation and Identification
5.2. Molecular-Level Identification
5.3. Antimicrobial Susceptibility Testing
5.4. Minimum Inhibitory Concentration
5.5. Detection of Antibiotic-Resistant Genes by Polymerase Chain Reaction
5.6. DNA Sequencing and Mutational Analysis
5.7. Statistical Analysis
Author Contributions
Funding
Institutional Review Board Statement
Informed Consent Statement
Data Availability Statement
Conflicts of Interest
References
- Liew, C.C.; Ma, J.; Tang, H.C.; Zheng, R.; Dempsey, A.A. The peripheral blood transcriptome dynamically reflects system wide biology: A potential diagnostic tool. J. Lab. Clin. Med. 2006, 147, 126–132. [Google Scholar] [CrossRef] [PubMed]
- Abdel-Dayem, M.; Al Zou’bi, R.; Hani, R.B.; Amr, Z.S. Microbiological and parasitological investigation among food handlers in hotels in the dead sea area, Jordan. J. Microbiol. Immunol. Infect. 2014, 47, 377–380. [Google Scholar] [CrossRef] [PubMed]
- Mack, J.P.; Miles, J.; Stolla, M. Cold-stored platelets: Review of studies in humans. Transfus. Med. Rev. 2020, 34, 221–226. [Google Scholar] [CrossRef] [PubMed]
- Diekema, D.J.; Beekmann, S.E.; Chapin, K.C.; Morel, K.A.; Munson, E.; Doern, G.V. Epidemiology and outcome of nosocomial and community-onset bloodstream infection. J. Clin. Microbiol. 2003, 41, 3655–3660. [Google Scholar] [CrossRef]
- Jarvis, W.R. The evolving world of healthcare-associated bloodstream infection surveillance and prevention: Is your system as good as you think. Infect. Control Hosp. Epidemiol. 2002, 23, 236–238. [Google Scholar] [CrossRef]
- Choileain, N.N.; Redmond, H.P. Cell response to surgery. Arch. Surg. 2006, 141, 1132–1140. [Google Scholar] [CrossRef]
- Wong, P.H.P.; Krosigk, M.V.; Roscoe, D.L.; Lau, T.T.; Yousefi, M.; Bowie, W.R. Antimicrobial coresistance patterns of gram-negative bacilli isolated from bloodstream infections: A longitudinal epidemiological study from 2002–2011. BMC Infect. Dis. 2014, 14, 393. [Google Scholar] [CrossRef]
- Nwadioha, S.I.; Kashibu, E.; Alao, O.O.; Aliyu, I. Bacterial isolates in blood cultures of children with suspected septicaemia in kano: A two-year study. Niger. Postgrad. Med. J. 2011, 18, 130–133. [Google Scholar]
- Vergnano, S.; Sharland, M.; Kazembe, P.; Mwansambo, C.; Heath, P.T. Neonatal sepsis: An international perspective. Arch. Dis. Child. Fetal Neonatal Ed. 2005, 90, 220–224. [Google Scholar] [CrossRef]
- Majeed, A.; Moser, K. Age-and sex-specific antibiotic prescribing patterns in general practice in england and wales in 1996. Br. J. Gen. Pract. 1999, 49, 735–736. [Google Scholar]
- Holmberg, S.D.; Solomon, S.L.; Blake, P.A. Health and economic impacts of antimicrobial resistance. Rev. Infect. Dis. 1987, 9, 1065–1078. [Google Scholar] [CrossRef]
- Rabirad, N.; Mohammadpoor, M.; Lari, A.R.; Shojaie, A.; Bayat, R.; Alebouyeh, M. Antimicrobial susceptibility patterns of the gram-negative bacteria isolated from septicemia in Children’s Medical Center. J. Prev. Med. Hyg. 2014, 55, 23–26. [Google Scholar]
- Dawood, S. American society of clinical oncology 2014: Updates in breast and gastrointestinal cancers. Indian J. Med. Paediatr. Oncol. 2014, 35, 176–180. [Google Scholar] [CrossRef]
- Rudd, K.E.; Johnson, S.C.; Agesa, K.M.; Shackelford, K.A.; Tsoi, D.; Kievlan, D.R.; Naghavi, M. Global, regional, and national sepsis incidence and mortality, 1990–2017: Analysis for the Global Burden of Disease Study. Lancet 2020, 395, 200–211. [Google Scholar] [CrossRef]
- Chaudhry, I.; Chaudhry, N.A.; Muhammad, M.; Raheela, H.; Muhammad, T. Etiological pattern of septicemia at three hospitals in lahore. J. Coll. Physicians Surg. Pak. 2000, 10, 375–379. [Google Scholar]
- Okomo, U.; Akpalu, E.N.; Le Doare, K.; Roca, A.; Cousens, S.; Jarde, A.; Lawn, J.E.A. Etiology of invasive bacterial infection and antimicrobial resistance in neonates in Sub-Saharan Africa: A systematic review and meta-analysis in line with the STROBE-NI reporting guidelines. Lancet Infect. Dis. 2019, 19, 1219–1234. [Google Scholar] [CrossRef]
- Mythri, B.A.; Asha, B.; Patil, A.; Divya, P.M.; Sharon, V.A. Bacteriological profile and antibiogram of neonatal septicemia in a tertiary care hospital. Indian J. Microbiol. Res. 2016, 3, 136–140. [Google Scholar] [CrossRef]
- Mansouri, S.; Chitsaz, M.; Haji, H.R.; Mirzaei, M.; Gheyni, M.H. Determination of resistance pattern of plasmid-mediated Ampc. Daneshvar Med. 2009, 16, 61–70. [Google Scholar]
- Reller, L.B.; Weinstein, M.; Jorgensen, J.H.; Ferraro, M.J. Antimicrobial Susceptibility testing: A review of General Principles and Contemporary Practices. Clin. Infect. Dis. 2009, 49, 1749–1755. [Google Scholar]
- Russotto, V.; Cortegiani, A.; Graziano, G.; Saporito, L.; Raineri, S.M.; Mammina, C.; Giarratano, A. Bloodstream infections in intensive care unit patients: Distribution and antibiotic resistance of bacteria. Infect. Drug Resist. 2015, 8, 287. [Google Scholar]
- Bauer, R.J.; Zhang, L.; Foxman, B.; Siitonen, A.; Jantunen, M.E.; Saxen, H.; Marrs, C.F. Molecular epidemiology of 3 putative virulence genes for escherichia coli urinary tract infection–usp, iha, and Iron (E. Coli). J. Infect. Dis. 2002, 185, 1521–1524. [Google Scholar] [CrossRef] [PubMed]
- Sana, E.M. Antibacterial properties of traditional Sudanese medicinal materials against selected enteric bacterial strains. Afr. J. Microbiol. Res. 2020, 14, 555–563. [Google Scholar] [CrossRef]
- Aryal, S.C.; Upreti, M.K.; Sah, A.K.; Ansari, M.; Nepal, K.; Dhungel, B.; Adhikari, N.; Lekhak, B.; Rijal, K.R. Plasmid-Mediated AmpC β-Lactamase CITM and DHAM Genes among Gram-Negative Clinical Isolates. Infect. Drug Resist. 2020, 13, 4249–4261. [Google Scholar] [CrossRef] [PubMed]
- Gupta, S.; Kashyap, B. Bacteriological profile and antibiogram of blood culture isolates from a tertiary care hospital of North India. Trop. J. Med. Res. 2016, 19, 94. [Google Scholar]
- Velazquez, E.M.; Nguyen, H.; Heasley, K.T.; Saechao, C.H.; Gil, L.M.; Rogers, A.W.; Bäumler, A.J. Endogenous enterobacteriaceae underlie variation in susceptibility to salmonella infection. Nat. Microbiol. 2019, 4, 1057–1064. [Google Scholar] [CrossRef]


| Parameters | E. coli (n = 184) | P. aeruginosa (n = 78) | |
|---|---|---|---|
| Frequency (%) | Frequency (%) | ||
| Gender | Male | 65 (35.3) | 60 (76.9) |
| Female | 119 (64.7) | 18 (23.1) | |
| Age Groups | 00 to 10 | 37 (20.10) | 02 (2.56) |
| 11 to 20 | 26 (14.13) | 04 (5.12) | |
| 21 to 40 | 48 (26.01) | 18 (23.07) | |
| 41 to 60 | 50 (27.1) | 28 (35.8) | |
| Above 60 | 23 (12.5) | 26 (33.3) | |
| Total | 184 (100) | 78 (100) | |
| Antibiotics | E. coli (n = 184) | P. aeruginosa (n = 78) | ||
|---|---|---|---|---|
| Sensitive (%) | Resistant (%) | Sensitive (%) | Resistant (%) | |
| AMP (ampicillin) | 13 (7.06) | 171 (92.9) | 08 (10.5) | 70 (89.7) |
| FOX (cefoxitin) | 91 (49.4) | 93 (50.5) | 08 (10.2) | 70 (89.7) |
| AMC (amoxicillin) | 76 (41.3) | 108 (58.6) | 08 (10.2) | 70 (89.7) |
| SCF (cefoperazone-sulbactam) | 134 (72.8) | 50 (27.1) | 27 (34.6) | 51 (65.3) |
| TZP (piperacillin-tazobactam) | 117 (63.5) | 67 (36.4) | 62 (79.4) | 16 (20.5) |
| FEP (cefepime) | 70 (38) | 114 (62) | 35 (44.8) | 43 (55.1) |
| CTX (cefotaxime) | 70 (38) | 114 (62) | 29 (37.1) | 49 (62.8) |
| CAZ (ceftazidime) | 70 (38) | 114 (62) | 42 (53.8) | 36 (46.1) |
| ATM (aztreonam) | 78 (42.3) | 106 (57.6) | 23 (29.48) | 55 (70.5) |
| MEM (meropenem) | 157 (85.3) | 27 (14.6) | 74 (94.8) | 04 (5.12) |
| IPM (imipenem) | 157 (85.3) | 27 (14.6) | 74 (94.8) | 04 (5.12) |
| CN (gentamicin) | 104 (56.5) | 80 (43.4) | 28 (35.8) | 50 (64.1) |
| AK (Amikacin) | 137 (74.4) | 47 (25.5) | 20 (25.6) | 58 (74.3) |
| TOB (tobramycin) | 93 (50.5) | 91 (49.4) | 31 (39.7) | 47 (60.2) |
| DO (doxycycline) | 70 (38.0) | 114 (62) | 33 (42.3) | 45 (57.6) |
| CIP (ciprofloxacin) | 45 (24.4) | 139 (75.5) | 40 (51.2) | 38 (48.7) |
| SXT (trimethoprim/sulfamethoxazole) | 21 (11.4) | 163 (88.5) | 33 (42.3) | 45 (57.6) |
| Antibiotics | ESBLs | MBLs | AmpC | |||
|---|---|---|---|---|---|---|
| MIC90/MIC50 (μg/mL) | MIC Range (μg/mL) | MIC90/MIC50 (μg/mL) | MIC Range (μg/mL) | MIC90/MIC50 (μg/mL) | MIC Range (μg/mL) | |
| CTX | 256/128 | 4–256 | 128/256 | 4–256 | 128/256 | 4–256 |
| CAZ | 256/64 | 16–256 | 64/256 | 16–256 | 64/256 | 16–256 |
| MEM | 0.75/0.125 | 0.023–1 | 4/32 | 3–256 | 0.19/0.75 | 0.023–1 |
| IPM | 0.75/0.19 | 0.023–1 | 4/32 | 3–96 | 0.19/1.0 | 0.023–1 |
| CN | 16/4 | 0.064–140 | 16/16 | 4–16 | 4/16 | 0.064–140 |
| AK | 256/8 | 0.19–256 | 16/256 | 1–256 | 8/256 | 0.19–256 |
| DO | 192/16 | 0.125–256 | 16/192 | 1–256 | 16/128 | 0.125–256 |
| CIP | 256/24 | 0.25–256 | 32/256 | 0.094–256 | 24/256 | 0.25–256 |
| SXT | 256/24 | 0.19–256 | 32/32 | 0.064–32 | 24/256 | 0.19–256 |
| TGC | 1.5/0.25 | 0.023–2 | 0.5/1.5 | 0.023–8 | 0.50/1.5 | 0.023–2 |
| Antibiotics | ESBLs | MBLs | AmpC | |||
|---|---|---|---|---|---|---|
| MIC90/MIC50 (μg/mL) | MIC Range (μg/mL) | MIC90/MIC50 (μg/mL) | MIC Range (μg/mL) | MIC90/MIC50 (μg/mL) | MIC Range (μg/mL) | |
| CTX | 16/256 | 0.16–256 | 12/256 | 0.023–256 | 12/256 | 0.023–256 |
| CAZ | 128/256 | 2–256 | 64/256 | 1.5–256 | 64/256 | 1.5–256 |
| MEM | 0.38/1 | 0.016–1 | 2/16 | 0.023–26 | 0.75/1 | 0.023–1 |
| IPM | 0.50/1 | 0.012–1 | 2/16 | 0.016–16 | 0.50/1 | 0.012–1 |
| CN | 4/16 | 0.064–140 | 8/16 | 0.064–64 | 8/16 | 0.064–64 |
| AK | 12/256 | 0.25–256 | 8/128 | 0.094–128 | 8/128 | 0.094–128 |
| DO | 32/192 | 0.125–256 | 32/192 | 0.125–192 | 32/192 | 0.125–192 |
| CIP | 24/256 | 0.19–256 | 24/192 | 0.19–256 | 24/92 | 0.19–256 |
| SXT | 24/256 | 1.0–256 | 8/64 | 1.5–64 | 8/64 | 1.5–64 |
| TGC | 0.50/2 | 0.032–2 | 0.75/2.0 | 0.047–2 | 0.75/2 | 0.047–2 |
| Organisms | ESBL (%) | AmpC β-Lactamase (%) | MBL (%) |
|---|---|---|---|
| P. aeruginosa | 46 (58.9) | 38 (48.7) | 15 (19.2) |
| E. coli | 80 (43.4) | 67 (36.4) | 30 (16.3) |
| Total | 126 (28.4) | 105 (23.7) | 45 (10.1) |
| Genes | Escherichia coli | Pseudomonas aeruginosa | ||
|---|---|---|---|---|
| Negative (%) | Positive (%) | Negative (%) | Positive (%) | |
| ESBL genes | ||||
| Bla-CTX—M | 24 (30) | 56 (70) | 30 (65.2) | 16 (73.9) |
| Bla-TEM | 29 (36.2) | 51 (63.7) | 12 (26) | 34 (73.9) |
| Bla-SHV | 52 (65) | 28 (35) | 17 (36.9) | 29 (34.7) |
| Bla-OXA1 | 05 (6.25) | 75 (93.75) | 3 (6.52) | 43 (93.47) |
| MBL genes | ||||
| Bla-NDM-1 | 21(70) | 09 (30) | 12 (80) | 03 (20) |
| AmpC β-Lactamases genes | ||||
| Bla-AmpC | 10 (14.9) | 57 (85) | 03 (7.89) | 35 (92.1) |
| Bla-CIT | 56 (83.5) | 11 (16.4) | 07 (31) | 31 (81.5) |
| Bla-DHA | 59 (88) | 08 (11.9) | 21 (55.2) | 17 (44.7) |
| Bla-ACC | 67 (100) | 00 | 33 (86.3) | 05 (13.1) |
| Antibiotic Resistance Genes | Position | Mutation |
|---|---|---|
| Bla-TEM | 31 | Deletion of G |
| Bla-SHV | 34 | Deletion of T |
| 101 | Insertion of G | |
| Bla-ACC | 13 and 14 | Deletion of T and G |
| 24 | T to A | |
| 30 and 31 | Deletion of G and T | |
| 73 | C to A | |
| 163 | C to A | |
| Bla-NDM1 | 40–43 | Deletion of C, C, G, G |
| 46 | Deletion of G | |
| 219 | C to G | |
| 322 | C to G | |
| 362 | G to C | |
| 576 and 577 | Deletion of C and A | |
| 579 | Deletion of C | |
| Bla-OXA1 | 49 | Deletion of C |
| 51 | Deletion of A | |
| 327 | C to T | |
| Bla-AAD | 67 | Deletion of T |
| Wild Type | New Type | I-Mutant Prediction Effect | Reliability Index (RI) | pH | Temperature |
|---|---|---|---|---|---|
| Bla TEM-1 gene | |||||
| A | G | Decrease | 2 | 7 | 25 |
| Bla SHV gene | |||||
| G | T | Decrease | 3 | 7 | 25 |
| G | V | Increase | 2 | 7 | 25 |
| Bla ACC | |||||
| N | V | Increase | 4 | 7 | 25 |
| N | L | Increase | 4 | 7 | 25 |
| N | A | Increase | 1 | 7 | 25 |
| C | V | Increase | 0 | 7 | 25 |
| N | I | Increase | 1 | 7 | 25 |
| T | A | Decrease | 6 | 7 | 25 |
| C | A | Decrease | 3 | 7 | 25 |
| Bla NDM1 | |||||
| T | V | Increase | 2 | 7 | 25 |
| G | V | Increase | 1 | 7 | 25 |
| A | V | Increase | 3 | 7 | 25 |
| T | L | Increase | 1 | 7 | 25 |
| T | V | Increase | 3 | 7 | 25 |
| A | G | Decrease | 0 | 7 | 25 |
| T | G | Increase | 0 | 7 | 25 |
| T | C | Increase | 1 | 7 | 25 |
| Bla AAD1 | |||||
| G | V | Increase | 2 | 7 | 25 |
| Gene | Primer Sequence | Gene Size (bp) | Optimized Condition Annealing (°C/s): | Cycle |
|---|---|---|---|---|
| Marker genes of E. coli and P. aeruginosa | ||||
| USP | F: ATCACCGTGGTGACCGCATGTCGC R: CACCACGATGCCATGTTCATCTGC | 884 | 54/30 | 35 |
| oprL | F: ATGGAAATGCTGAAATTCGGC R: CTTCTTCAGCTCGACGCGCG | 504 | 55/30 | 35 |
| ESBL genes | ||||
| Bla-TEM | F: TTAACTGGCGAACTACTTAC R: GTCTATTTCGTTCATCCATA | 247 | 54/30 | 35 |
| Bla-SHV | F: TCGCCTGTGTATTATCTCCC R: CGCAGATAAATCACCACAATG | 768 | 52/30 | 35 |
| Bla-CTX-M | F: ATGTGCAGCACCAGTAAAGT R: ACCGCGATATCGTTGGTGG | 545 | 54/30 | 35 |
| Bla-OXA-1 | F: ACACAATACATATCAACTTCGC R: AGTGTGTTTAGAATGGTGATC | 814 | 57/30 | 35 |
| MBLs genes | ||||
| Bla-NDM1 | F: GGGCAGTCGCTTCCAACGGT R: GTAGTGCTCAGTGTCGGCAT | 475 | 54/30 | 35 |
| AmpC β-lactamase genes | ||||
| Bla-AmpC | F: CCCCGCCTTATAGAGCAACAA R: TCAATGGTCGACTTCACACC | 634 | 54/30 | 35 |
| Bla-ACC | F: AACAGCCTCAGCAGCCGGTTA R: TTCGCCGCAATCATCCCTAGC | 346 | 54/30 | 35 |
| Bla-CIT | F: TGGCCAGAACTGACAGGCAAA R: TTTCTCCTGAACGTGGCTGGC | 462 | 54/30 | 35 |
| Bla-DHA | F: AACTTTCACAGGTGTGCTGGGT R: CCGTACGCATACTGGCTTTGC | 405 | 54/30 | 35 |
| S. No | Name of Antibiotic | Concentration (µg/mL) | Inhibition Value (mm) | |
|---|---|---|---|---|
| Sensitive | Resistant | |||
| 1 | AMC | 20/10 | ≥18 | ≤13 |
| 2 | AMP | 10 | ≥17 | ≤13 |
| 3 | SCF | 75/30 | ≥21 | ≤15 |
| 4 | TZP | 100/10 | ≥21 | ≤17 |
| 5 | FEP | 30 | ≥25 | ≤18 |
| 6 | CTX | 30 | ≥26 | ≤22 |
| 7 | FOX | 30 | ≥18 | ≤24 |
| 8 | CAZ | 30 | ≥21 | ≤27 |
| 9 | ATM | 30 | ≥21 | ≤27 |
| 10 | MEM | 10 | ≥23 | ≤29 |
| 11 | IPM | 10 | ≥23 | ≤29 |
| 12 | GEN | 10 | ≥15 | ≤23 |
| 13 | TOB | 10 | ≥15 | ≤23 |
| 14 | AMK | 30 | ≥17 | ≤14 |
| 15 | DO | 30 | ≥14 | ≤10 |
| 16 | CIP | 5 | ≥26 | ≤21 |
| 17 | SXT | 1.25/23.75 | ≥16 | ≤10 |
| E-Strips | Symbols | Resistant | Sensitive |
|---|---|---|---|
| E-CT (Cefotaxime) | CTX | ≥4 | ≤1 |
| E-TZ (Ceftazidime) | CAZ | ≥16 | ≤4 |
| E-MP (Meropenem) | MEM | ≥4 | ≤1 |
| E-IP (Imipenem) | IPM | ≥4 | ≤1 |
| E-GM (Gentamicin) | CN | ≥16 | ≤4 |
| E-AK (Amikacin) | AK | ≤4 | ≤16 |
| E-DC (Doxycycline) | DO | ≥16 | ≤4 |
| E-CL (Ciprofloxacin) | CIP | ≥1 | ≤0.25 |
| E-TS (Co-Trimoxazole) | SXT | ≥4 | ≤2.38 |
| E-TGC (Tigecycline) | TGC | - | ≤2 |
Disclaimer/Publisher’s Note: The statements, opinions and data contained in all publications are solely those of the individual author(s) and contributor(s) and not of MDPI and/or the editor(s). MDPI and/or the editor(s) disclaim responsibility for any injury to people or property resulting from any ideas, methods, instructions or products referred to in the content. |
© 2023 by the authors. Licensee MDPI, Basel, Switzerland. This article is an open access article distributed under the terms and conditions of the Creative Commons Attribution (CC BY) license (https://creativecommons.org/licenses/by/4.0/).
Share and Cite
Khan, M.R.; Azam, S.; Ahmad, S.; Ali, Q.; Liaqat, Z.; Rehman, N.; Khan, I.; Alharbi, M.; Alshammari, A. Molecular Characterization and Epidemiology of Antibiotic Resistance Genes of β-Lactamase Producing Bacterial Pathogens Causing Septicemia from Tertiary Care Hospitals. Antibiotics 2023, 12, 617. https://doi.org/10.3390/antibiotics12030617
Khan MR, Azam S, Ahmad S, Ali Q, Liaqat Z, Rehman N, Khan I, Alharbi M, Alshammari A. Molecular Characterization and Epidemiology of Antibiotic Resistance Genes of β-Lactamase Producing Bacterial Pathogens Causing Septicemia from Tertiary Care Hospitals. Antibiotics. 2023; 12(3):617. https://doi.org/10.3390/antibiotics12030617
Chicago/Turabian StyleKhan, Mohammad Riaz, Sadiq Azam, Sajjad Ahmad, Qaisar Ali, Zainab Liaqat, Noor Rehman, Ibrar Khan, Metab Alharbi, and Abdulrahman Alshammari. 2023. "Molecular Characterization and Epidemiology of Antibiotic Resistance Genes of β-Lactamase Producing Bacterial Pathogens Causing Septicemia from Tertiary Care Hospitals" Antibiotics 12, no. 3: 617. https://doi.org/10.3390/antibiotics12030617
APA StyleKhan, M. R., Azam, S., Ahmad, S., Ali, Q., Liaqat, Z., Rehman, N., Khan, I., Alharbi, M., & Alshammari, A. (2023). Molecular Characterization and Epidemiology of Antibiotic Resistance Genes of β-Lactamase Producing Bacterial Pathogens Causing Septicemia from Tertiary Care Hospitals. Antibiotics, 12(3), 617. https://doi.org/10.3390/antibiotics12030617