

Infections in Glucose-6-Phosphate Dehydrogenase G6PD-Deficient Patients; Predictors for Infection-Related Mortalities and Treatment Outcomes

 , ,
, ,  , , and
Abstract
1. Introduction
2. Method
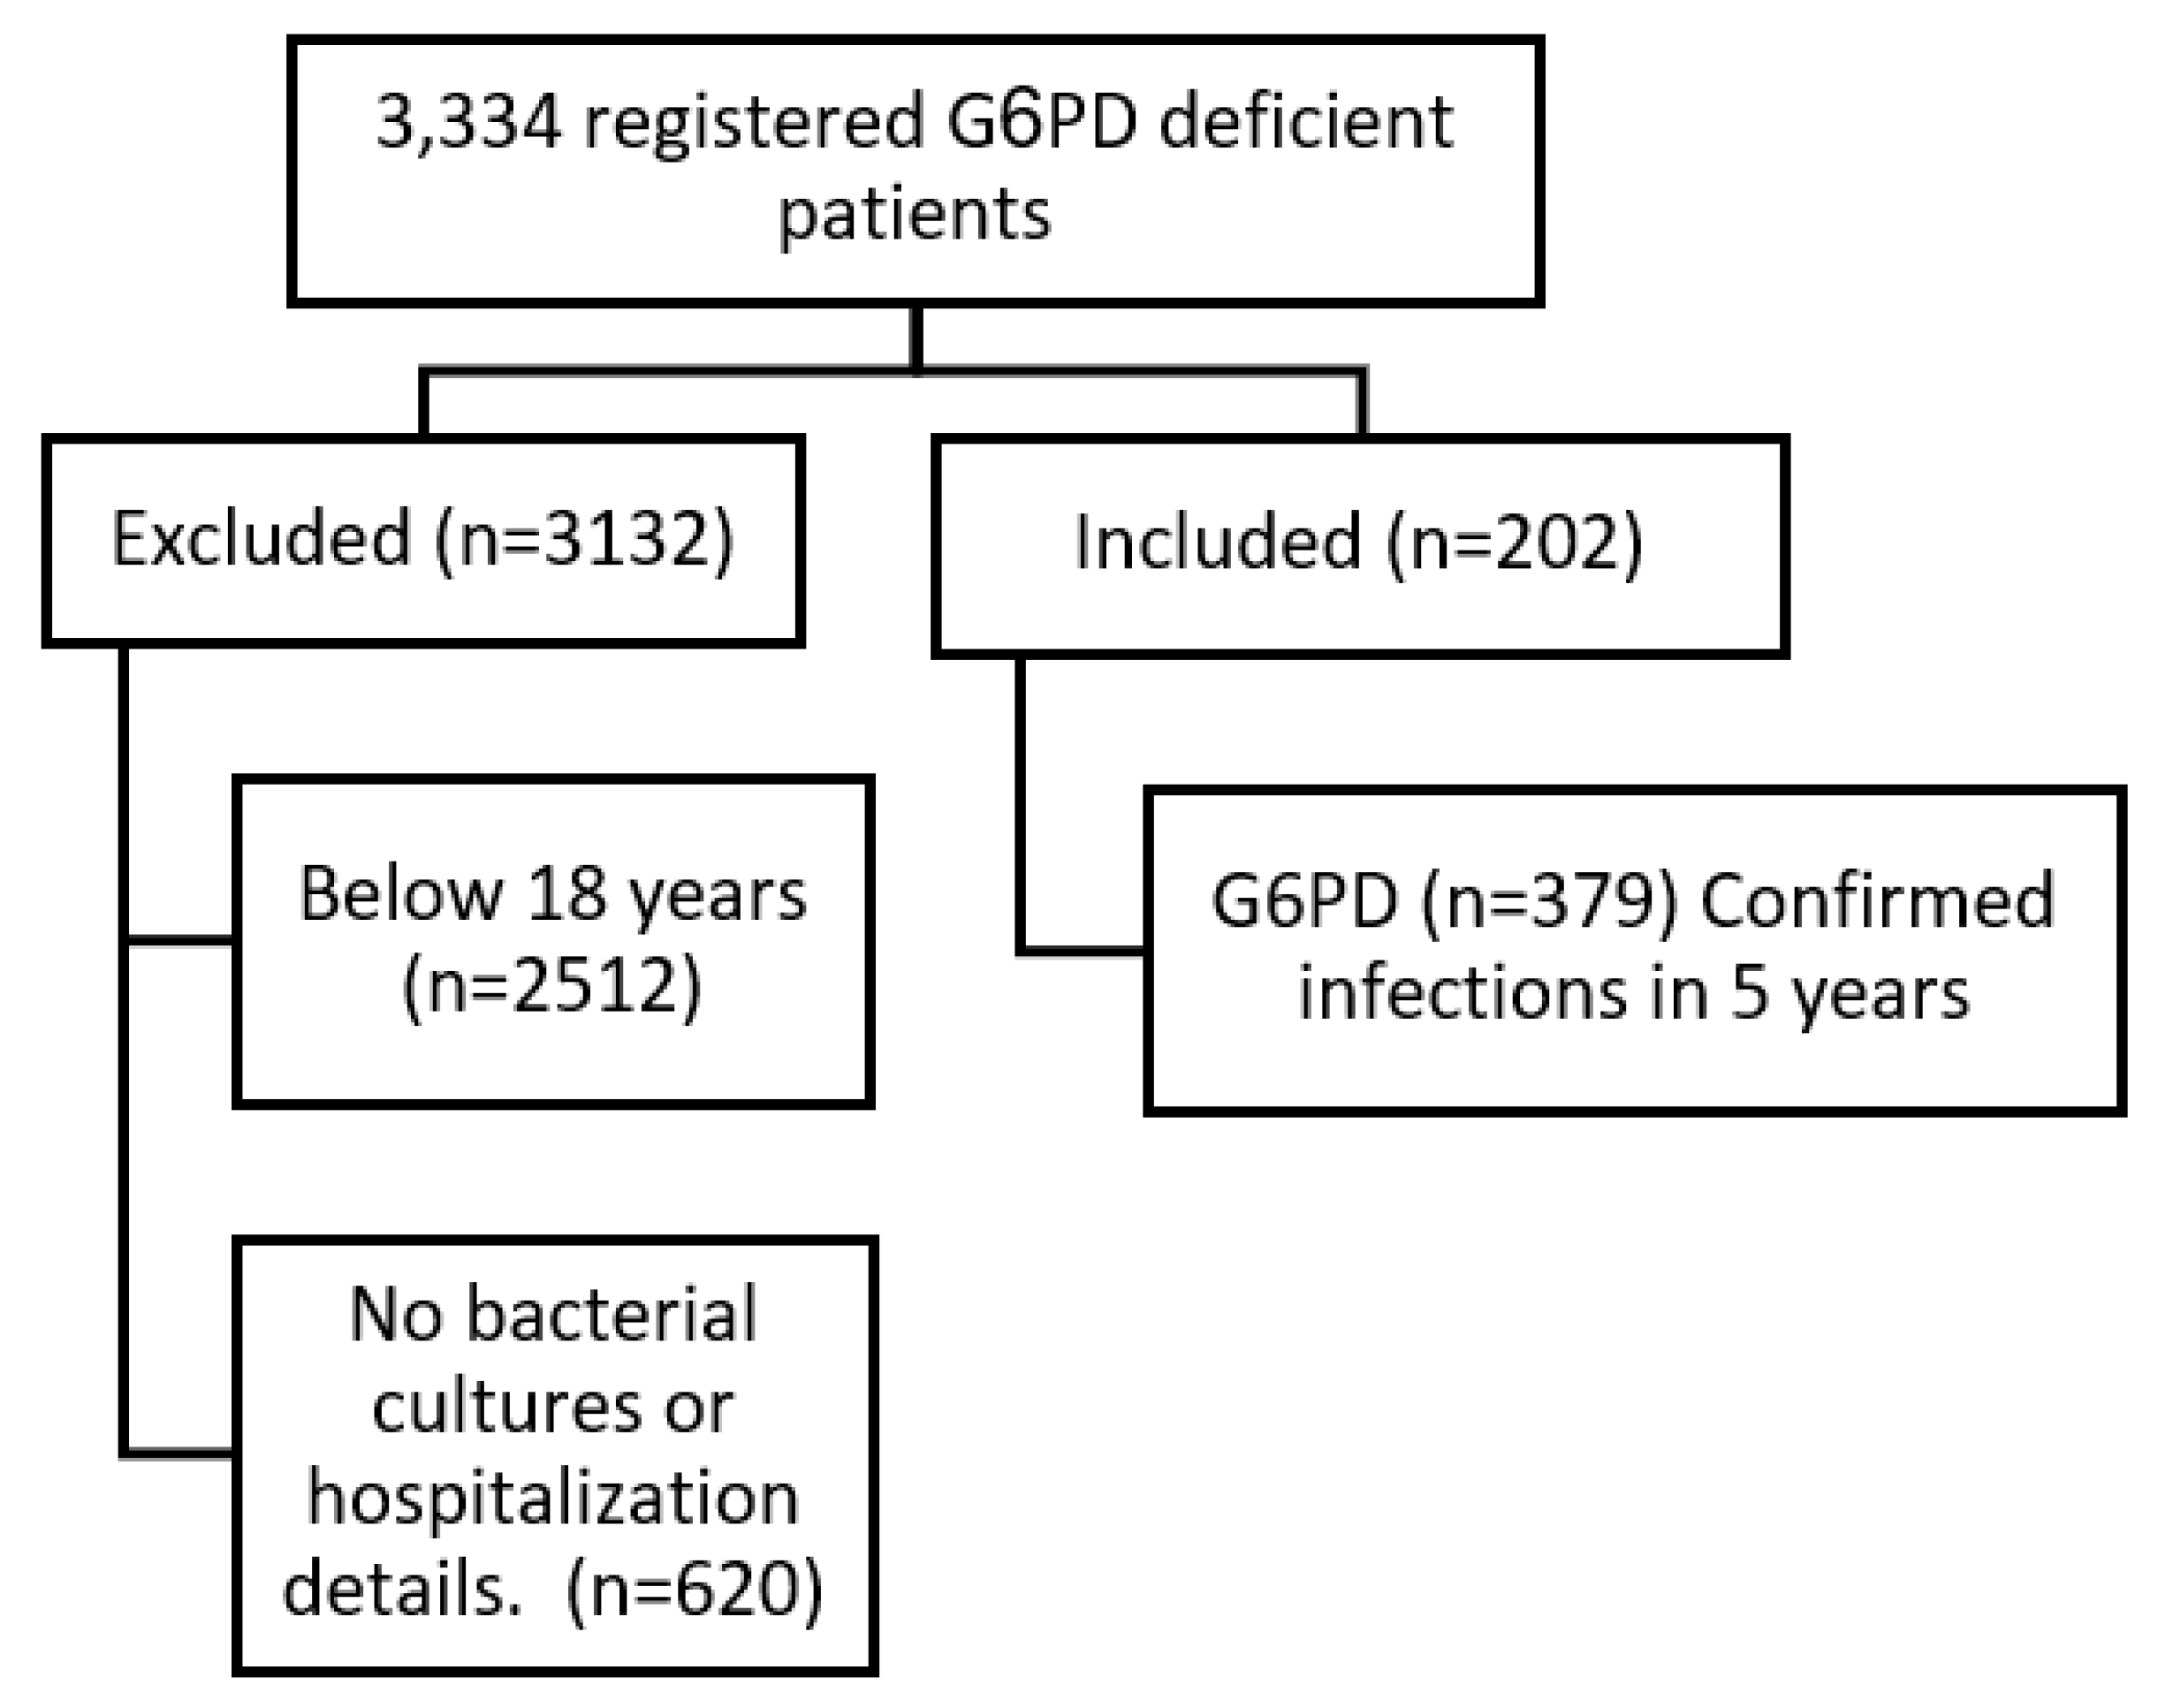
2.1. Study Population
2.2. Definitions
2.3. Microbiological Details
2.4. Statistical Analysis
3. Results
3.1. Patients’ Demographics
3.2. Univariate Analysis
3.2.1. Crude, In-Hospital Mortality (105, 28%)
3.2.2. 14-Day Mortality (27, 26% of Overall Mortality)
3.2.3. 28-Day Mortality (30, 29% of Overall Mortality)
3.3. Multivariate Analysis: All Variables with p ≤ 0.2 in the Univariate Analysis for Each Dependent Variable Were Included in a Multivariate Regression Model
3.3.1. Crude, In-Hospital Mortality
3.3.2. 14-Day Mortality
3.3.3. 28-Day Mortality
3.4. Antimicrobial Treatment Regimen and Treatment Outcomes
4. Discussion
4.1. Predictors of Infection-Related Mortalities
4.2. Clinical Outcomes vs. Antimicrobial Treatment
Monotherapy vs. Combined
5. Conclusions
Supplementary Materials
Author Contributions
Funding
Institutional Review Board Statement
Informed Consent Statement
Data Availability Statement
Conflicts of Interest
Abbreviations
| ASP | Antimicrobial stewardship programs |
| BU | Burn unit |
| CAI | Community-acquired infections |
| CCD | Chronic cardiac disease |
| CCU | Cardiac care unit |
| CI | Confidence intervals |
| CKD | Chronic kidney disease |
| CRD | Chronic respiratory disease |
| DCs | Dendritic cells |
| DM | Diabetes mellitus |
| eGFR | Estimated glomerular filtration rate |
| G6PD | Glucose-6-phosphate dehydrogenase |
| HAIs | Hospital-acquired infections |
| ICU | Intensive care unit |
| IQR | Interquartile ranges |
| LOS | Length of stay |
| MDR | Multi-drug resistant |
| NADP | Nicotinamide adenine dinucleotide phosphate |
| OR | Odds ratios |
| PPP | Pentose phosphate pathway |
| SARS-CoV-19 | Severe acute respiratory syndrome-Coronavirus |
| TNF | Tumor necrosis factor |
References
- Medzhitov, R. Recognition of microorganisms and activation of the immune response. Nature 2007, 449, 819–826. [Google Scholar] [CrossRef] [PubMed]
- Kogut, M.H.; Lee, A.; Santin, E. Microbiome and pathogen interaction with the immune system. Poult. Sci. 2020, 99, 1906–1913. [Google Scholar] [CrossRef] [PubMed]
- Yen, W.-C.; Wu, Y.-H.; Wu, C.-C.; Lin, H.-R.; Stern, A.; Chen, S.-H.; Shu, J.-C.; Tsun-Yee Chiu, D. Impaired inflammasome activation and bacterial clearance in G6PD deficiency due to defective NOX/p38 MAPK/AP-1 redox signaling. Redox Biol. 2020, 28, 101363. [Google Scholar] [CrossRef] [PubMed]
- Youssef, J.G.; Zahiruddin, F.; Youssef, G.; Padmanabhan, S.; Ensor, J.; Pingali, S.R.; Zu, Y.; Sahay, S.; Iyer, S.P. G6PD deficiency and severity of COVID19 pneumonia and acute respiratory distress syndrome: Tip of the iceberg? Ann. Hematol. 2021, 100, 667–673. [Google Scholar] [CrossRef] [PubMed]
- Yang, H.-C.; Wu, Y.-H.; Yen, W.-C.; Liu, H.-Y.; Hwang, T.-L.; Stern, A.; Chiu, D.T.-Y. The Redox Role of G6PD in Cell Growth, Cell Death, and Cancer. Cells 2019, 8, 1055. [Google Scholar] [CrossRef] [PubMed]
- Yang, H.-C.; Ma, T.-H.; Tjong, W.-Y.; Stern, A.; Chiu, D.T.-Y. G6PD deficiency, redox homeostasis, and viral infections: Implications for SARS-CoV-2 (COVID-19). Free. Radic. Res. 2021, 55, 364–374. [Google Scholar] [CrossRef]
- Alrahmany, D.; Omar, A.F.; Al-Maqbali, S.R.S.; Harb, G.; Ghazi, I.M. Infections in G6PD-Deficient Hospitalized Patients-Prevalence, Risk Factors, and Related Mortality. Antibiotics 2022, 11, 934. [Google Scholar] [CrossRef]
- Yu, R.; Chen, C.-R.; Evans, D.; Qing, X.; Gotesman, M.; Chandramohan, G.; Kallay, T.; Lin, H.J.; Pedigo, T.P. Glucose-6-phosphate dehydrogenase deficiency presenting with rhabdomyolysis in a patient with coronavirus disease 2019 pneumonia: A case report. J. Med Case Rep. 2022, 16, 106. [Google Scholar] [CrossRef]
- Abu-Osba, Y.K.; Mallouh, A.A.; Hann, R.W. Incidence and causes of sepsis in glucose-6-phosphate dehydrogenase-deficient newborn infants. J. Pediatr. 1989, 114, 748–752. [Google Scholar] [CrossRef]
- Al Riyami, A.A.; Suleiman, A.J.; Afifi, M.; Al Lamki, Z.M.; Daar, S. A community-based study of common hereditary blood disorders in Oman. EMHJ 2001, 7, 1004–1011. [Google Scholar] [CrossRef]
- Kadri, S.S.; Adjemian, J.; Lai, Y.L.; Spaulding, A.B.; Ricotta, E.; Prevots, D.R.; Palmore, T.N.; Rhee, C.; Klompas, M.; Dekker, J.P.; et al. Difficult-to-Treat Resistance in Gram-negative Bacteremia at 173 US Hospitals: Retrospective Cohort Analysis of Prevalence, Predictors, and Outcome of Resistance to All First-line Agents. Clin. Infect. Dis. 2018, 67, 1803–1814. [Google Scholar] [CrossRef] [PubMed]
- Falagas, M.E.; Koletsi, P.K.; Bliziotis, I.A. The diversity of definitions of multidrug-resistant (MDR) and pandrug-resistant (PDR) Acinetobacter baumannii and Pseudomonas aeruginosa. J. Med Microbiol. 2006, 55, 1619–1629. [Google Scholar] [CrossRef] [PubMed]
- Sun, B.; Li, Q.; Dong, X.; Hou, J.; Wang, W.; Ying, W.; Hui, X.; Zhou, Q.; Yao, H.; Sun, J.; et al. Severe G6PD deficiency leads to recurrent infections and defects in ROS production: Case report and literature review. Front. Genet. 2022, 13, 1035673. [Google Scholar] [CrossRef] [PubMed]
- Siler, U.; Romao, S.; Tejera, E.; Pastukhov, O.; Kuzmenko, E.; Valencia, R.G.; Spaccamela, V.M.; Belohradsky, B.H.; Speer, O.; Schmugge, M.; et al. Severe glucose-6-phosphate dehydrogenase deficiency leads to susceptibility to infection and absent NETosis. J. Allergy Clin. Immunol. 2017, 139, 212–219.e3. [Google Scholar] [CrossRef]
- Agudelo-Flórez, P.; Costa-Carvalho, B.T.; López, J.A.; Redher, J.; Newburger, P.; Olalla-Saad, S.T.; Condino-Neto, A. Association of glucose-6-phosphate dehydrogenase deficiency and X-linked chronic granulomatous disease in a child with anemia and recurrent infections. Am. J. Hematol. 2004, 75, 151–156. [Google Scholar] [CrossRef]
- Mehl, A.; Åsvold, B.O.; Lydersen, S.; Paulsen, J.; Solligård, E.; Damås, J.K.; Harthug, S.; Edna, T.-H. Burden of bloodstream infection in an area of Mid-Norway 2002–2013: A prospective population-based observational study. BMC Infect. Dis. 2017, 17, 205. [Google Scholar] [CrossRef]
- Dang, T.T.; Majumdar, S.R.; Marrie, T.J.; Eurich, D.T. Recurrent pneumonia: A review with focus on clinical epidemiology and modifiable risk factors in elderly patients. Drugs Aging 2015, 32, 13–19. [Google Scholar] [CrossRef]
- Clark, M.; Root, R.K. Glucose-6-phosphate dehydrogenase deficiency and infection: A study of hospitalized patients in Iran. Yale J. Biol. Med. 1979, 52, 169–179. [Google Scholar]
- Hassan, M.; Tuckman, H.P.; Patrick, R.H.; Kountz, D.S.; Kohn, J.L. Hospital length of stay and probability of acquiring infection. Int. J. Pharm. Healthc. Mark. 2010, 4, 324–338. [Google Scholar] [CrossRef]
- Chafranska, L.; Stenholt, O.O.; Sørensen, R.H.; Bin Abdullah, S.O.; Nielsen, F.E. Predictors for mortality in patients admitted with suspected bacterial infections—A prospective long-term follow-up study. Am. J. Emerg. Med. 2022, 56, 236–243. [Google Scholar] [CrossRef]
- Dat, V.Q.; Linh, B.T.K.; Kim, G.B. Causes of admissions and in-hospital mortality among patients admitted to critical care units in primary and secondary hospitals in Vietnam in 2018: A multicentre retrospective study. BMJ Open 2022, 12, e061638. [Google Scholar] [CrossRef]
- Namikata, Y.; Matsuoka, Y.; Ito, J.; Seo, R.; Hijikata, Y.; Itaya, T.; Ouchi, K.; Nishida, H.; Yamamoto, Y.; Ariyoshi, K. Association between ICU admission during off-hours and in-hospital mortality: A multicenter registry in Japan. J. Intensiv. Care 2022, 10, 41. [Google Scholar] [CrossRef] [PubMed]
- Valley, T.S.; Sjoding, M.W.; Ryan, A.M.; Iwashyna, T.J.; Cooke, C.R. Association of Intensive Care Unit Admission with Mortality Among Older Patients with Pneumonia. JAMA 2015, 314, 1272–1279. [Google Scholar] [CrossRef] [PubMed]
- Abuhasira, R.; Anstey, M.; Novack, V.; Bose, S.; Talmor, D.; Fuchs, L. Intensive care unit capacity and mortality in older adults: A three nations retrospective observational cohort study. Ann. Intensiv. Care 2022, 12, 20. [Google Scholar] [CrossRef] [PubMed]
- Raslan, I.R.; Ross, H.J.; Fowler, R.A.; Scales, D.C.; Stelfox, H.T.; Mak, S.; Tu, J.V.; Farkouh, M.E.; Stukel, T.A.; Wang, X.; et al. The associations between direct and delayed critical care unit admission with mortality and readmissions among patients with heart failure. Am. Heart J. 2021, 233, 20–38. [Google Scholar] [CrossRef]
- Simpson, A.; Puxty, K.; McLoone, P.; Quasim, T.; Sloan, B.; Morrison, D.S. Comorbidity and survival after admission to the intensive care unit: A population-based study of 41,230 patients. J. Intensiv. Care Soc. 2020, 22, 143–151. [Google Scholar] [CrossRef] [PubMed]
- Mullen, M.G.; Michaels, A.D.; Mehaffey, J.H.; Guidry, C.A.; Turrentine, F.E.; Hedrick, T.L.; Friel, C.M. Risk Associated with Complications and Mortality After Urgent Surgery vs Elective and Emergency Surgery: Implications for Defining "Quality" and Reporting Outcomes for Urgent Surgery. JAMA Surg. 2017, 152, 768–774. [Google Scholar] [CrossRef]
- Tanaka, A.; Uchiyama, A.; Kitamura, T.; Sakaguchi, R.; Komukai, S.; Matsuyama, T.; Yoshida, T.; Tokuhira, N.; Iguchi, N.; Fujino, Y. Association between early tracheostomy and patient outcomes in critically ill patients on mechanical ventilation: A multicenter cohort study. J. Intensiv. Care 2022, 10, 19. [Google Scholar] [CrossRef]
- Caraballo, C.; Ascuntar, J.; Hincapié, C.; Restrepo, C.; Bernal, E.; Jaimes, F. Association between site of infection and in-hospital mortality in patients with sepsis admitted to emergency departments of tertiary hospitals in Medellin, Colombia. Rev. Bras. Ter. Intensiv. 2019, 31, 47–56. [Google Scholar] [CrossRef]
- Klastrup, V.; Hvass, A.M.; Mackenhauer, J.; Fuursted, K.; Schønheyder, H.C.; Kirkegaard, H. Site of infection and mortality in patients with severe sepsis or septic shock. A cohort study of patients admitted to a Danish general intensive care unit. Infect. Dis. 2016, 48, 726–731. [Google Scholar] [CrossRef]
- Gandra, S.; Tseng, K.K.; Arora, A.; Bhowmik, B.; Robinson, M.L.; Panigrahi, B.; Laxminarayan, R.; Klein, E.Y. The Mortality Burden of Multidrug-resistant Pathogens in India: A Retrospective, Observational Study. Clin. Infect. Dis. 2019, 69, 563–570. [Google Scholar] [CrossRef] [PubMed]
- Nielsen, S.L. The incidence and prognosis of patients with bacteremia. Dan. Med, J. 2015, 62, B5128. [Google Scholar] [PubMed]
- van Hal, S.J.; Jensen, S.O.; Vaska, V.L.; Espedido, B.A.; Paterson, D.L.; Gosbell, I.B. Predictors of mortality in Staphylococcus aureus Bacteremia. Clin. Microbiol. Rev. 2012, 25, 362–386. [Google Scholar] [CrossRef] [PubMed]
- Garcia-Vidal, C.; Fernandez-Sabe, N.; Carratala, J.; Diaz, V.; Verdaguer, R.; Dorca, J.; Manresa, F.; Gudiol, F. Early mortality in patients with community-acquired pneumonia: Causes and risk factors. Eur. Respir. J. 2008, 32, 733–739. [Google Scholar] [CrossRef]
- Massart, N.; Mansour, A.; Ross, J.T.; Piau, C.; Verhoye, J.-P.; Tattevin, P.; Nesseler, N. Mortality due to hospital-acquired infection after cardiac surgery. J. Thorac. Cardiovasc. Surg. 2022, 163, 2131–2140.e3. [Google Scholar] [CrossRef]
- Haque, M.; Sartelli, M.; McKimm, J.; Bin Abu Bakar, M. Health care-associated infections—An overview. Infect. Drug Resist. 2018, 11, 2321–2333. [Google Scholar] [CrossRef]
- Nuckchady, D.C. Incidence, Risk Factors, and Mortality From Hospital-Acquired Infections at a Hospital in Mauritius. Cureus. 2021, 13, e19962. [Google Scholar] [CrossRef]
- Wang, Y.C.; Ku, W.W.; Yang, Y.S.; Kao, C.C.; Kang, F.Y.; Kuo, S.C.; Chiu, C.; Chen, T.; Wang, F.; Lee, Y. Is Polymicrobial Bacteremia an Independent Risk Factor for Mortality in Acinetobacter baumannii Bacteremia? J. Clin. Med. 2020, 9, 153. [Google Scholar] [CrossRef]
- Pavlaki, M.; Poulakou, G.; Drimousis, P.; Adamis, G.; Apostolidou, E.; Gatselis, N.K.; Kritselis, I.; Mega, A.; Mylona, V.; Papatsoris, A.; et al. Polymicrobial bloodstream infections: Epidemiology and impact on mortality. J. Glob. Antimicrob. Resist. 2013, 1, 207–212. [Google Scholar] [CrossRef]
- Karakonstantis, S.; Kritsotakis, E.I. Systematic review and meta-analysis of the proportion and associated mortality of polymicrobial (vs monomicrobial) pulmonary and bloodstream infections by Acinetobacter baumannii complex. Infection 2021, 49, 1149–1161. [Google Scholar] [CrossRef]
- Pammi, M.; Zhong, D.; Johnson, Y.; Revell, P.; Versalovic, J. Polymicrobial bloodstream infections in the neonatal intensive care unit are associated with increased mortality: A case-control study. BMC Infect. Dis. 2014, 14, 390. [Google Scholar] [CrossRef] [PubMed]
- Alrahmany, D.; Omar, A.F.; Alreesi, A.; Harb, G.; Ghazi, I.M. Acinetobacter baumannii Infection-Related Mortality in Hospitalized Patients: Risk Factors and Potential Targets for Clinical and Antimicrobial Stewardship Interventions. Antibiotics 2022, 11, 1086. [Google Scholar] [CrossRef] [PubMed]
- He, W.; Jiang, K.; Qiu, H.; Liao, L.; Wang, S. 16-membered ring macrolides and erythromycin induce ermB expression by different mechanisms. BMC Microbiol. 2022, 22, 152. [Google Scholar] [CrossRef]
- Tumbarello, M.; Sanguinetti, M.; Montuori, E.; Trecarichi, E.M.; Posteraro, B.; Fiori, B.; Citton, R.; D’Inzeo, T.; Fadda, G.; Cauda, R.; et al. Predictors of mortality in patients with bloodstream infections caused by extended-spectrum-beta-lactamase-producing Enterobacteriaceae: Importance of inadequate initial antimicrobial treatment. Antimicrob. Agents Chemother. 2007, 51, 1987–1994. [Google Scholar] [CrossRef] [PubMed]
- Bush, K. Bench-to-bedside review: The role of β-lactamases in antibiotic-resistant Gram-negative infections. Crit. Care 2010, 14, 224–228. [Google Scholar] [CrossRef]
- Hu, Y.; Li, L.; Li, W.; Xu, H.; He, P.; Yan, X.; Dai, H. Combination antibiotic therapy versus monotherapy for Pseudomonas aeruginosa bacteraemia: A meta-analysis of retrospective and prospective studies. Int. J. Antimicrob. Agents 2013, 42, 492–496. [Google Scholar] [CrossRef]
- Babich, T.; Naucler, P.; Valik, J.K.; Giske, C.G.; Benito, N.; Cardona, R.; Rivera, A.; Pulcini, C.; Fattah, M.A.; Haquin, J.; et al. Combination versus monotherapy as definitive treatment for Pseudomonas aeruginosa bacteraemia: A multicentre retrospective observational cohort study. J. Antimicrob. Chemother. 2021, 76, 2172–2181. [Google Scholar] [CrossRef]
- Alrahmany, D.; Omar, A.F.; Harb, G.; El Nekidy, W.S.; Ghazi, I.M. Acinetobacter baumannii Infections in Hospitalized Patients, Treatment Outcomes. Antibiotics 2021, 10, 630. [Google Scholar] [CrossRef]
- Schmid, A.; Wolfensberger, A.; Nemeth, J.; Schreiber, P.W.; Sax, H.; Kuster, S.P. Monotherapy versus combination therapy for multidrug-resistant Gram-negative infections: Systematic Review and Meta-Analysis. Sci. Rep. 2019, 9, 15290. [Google Scholar] [CrossRef]


| Overall N (%) | Recovery N (%) | Death N (%) | p Value Chi | |
|---|---|---|---|---|
| Male | 256 (68) | 192 (70.1) | 73 (69.5) | 1.00 |
| median (IQR) | 60 (41–77) | 53 (35–72) | 77 (68–80) | <0.001 |
| Age ≤ 60 Years | 190 (50) | 172 (62.8) | 18 (17.1) | <0.001 |
| Age > 60 years | 189 (50) | 102 (37.2) | 87 (82.9) | |
| LOS median (IQR) | 12 (5–31) | 9 (5–24) | 26 (13–43) | <0.001 |
| LOS ≤ 14 days | 195 (51) | 168 (61.3) | 27 (25.7) | <0.001 |
| LOS > 14 days | 184 (49) | 106 (38.7) | 78 (74.3) | |
| Admission with infectious disease | 273 (72) | 183 (66.8) | 90 (85.7) | <0.001 |
| Admission to critical care area | 117 (31) | 57 (20.8) | 60 (57.1) | <0.001 |
| Underlying Comorbidities | ||||
| Diabetes | 254 (67) | 170 (62.0) | 84 (80.0) | 0.001 |
| Chronic kidney disease | 228 (60) | 141 (51.5) | 87 (82.9) | <0.001 |
| Active malignancy | 14 (4) | 7 (2.6) | 7 (6.7) | 0.111 |
| Immunosuppressed | 24 (6) | 15 (5.5) | 9 (8.6) | 0.383 |
| Chronic Cardiac Diseases | 282 (74) | 185 (67.5) | 97 (92.4) | <0.001 |
| HIV follow-up AIDS | 1 (0) | 0 (0.0) | 1 (1.0) | 0.618 |
| Chronic Resp. Disease | 70 (18) | 27 (9.9) | 43 (41.0) | <0.001 |
| Sickle Cell | 19 (5) | 18 (6.6) | 1 (1.0) | 0.048 |
| Other comorbidities | 179 (47) | 122 (44.5) | 57 (54.3) | 0.112 |
| No. of comorbidities median (IQR) | 3 (2–4) | 4 (3–4) | 3 (2–4) | <0.001 |
| Any comorbidity | 338 (89) | 234 (85.4) | 104 (99.0) | <0.001 |
| Risk Factors for infection | ||||
| Blood transfusion during admission | 212 (56) | 128 (46.7) | 84 (80.0) | <0.001 |
| Invasive procedure during admission | 285 (75) | 182 (66.4) | 103 (98.1) | <0.001 |
| Surgery 90-day history | 39 (10) | 35 (12.8) | 4 (3.8) | 0.017 |
| Type of infection | ||||
| Bacteremia | 88 (23) | 56 (20.4) | 32 (30.5) | 0.053 |
| Body Fluids | 1 (0) | 1 (0.4) | 0 (0.0) | 1.000 |
| Respiratory infections | 91 (24) | 53 (19.3) | 38 (36.2) | 0.001 |
| Skin and soft tissue infections | 103 (27) | 86 (31.4) | 17 (16.2) | 0.004 |
| Urinary tract infections | 96 (25) | 78 (28.5) | 18 (17.1) | 0.033 |
| Gram-negative infections | 227 (60) | 163 (59.5) | 64 (61.0) | 0.886 |
| Gram-positive infections | 107 (28) | 80 (29.2) | 27 (25.7) | 0.585 |
| Fungal infections | 31 (8) | 22 (8.0) | 9 (8.6) | 1.000 |
| SARS-CoV19 infections | 14 (4) | 9 (3.3) | 5 (4.8) | 0.705 |
| CRE infections | 24 (6) | 21 (7.7) | 3 (2.9) | 0.138 |
| ESBL infections | 50 (13) | 35 (12.8) | 15 (14.3) | 0.826 |
| MDR infections | 67 (18) | 39 (14.2) | 28 (26.7) | 0.007 |
| MRSA infections | 12 (3) | 11 (4.0) | 1 (1.0) | 0.232 |
| Resistant phenotypes | 153 (40) | 106 (38.7) | 47 (44.8) | 0.336 |
| Community-acquired infections | 212 (56) | 180 (65.7) | 32 (30.5) | <0.001 |
| Hospital-acquired infections | 167 (44) | 94 (34.3) | 73 (69.5) | <0.001 |
| 90-day recurrence of any infection | 136 (36) | 131 (47.8) | 5 (4.8) | <0.001 |
| Antimicrobial treatment | ||||
| Cephalosporins (90-day exposure) | 105 (28) | 76 (27.7) | 29 (27.6) | 1.000 |
| Aminoglycosides (90-day exposure) | 25 (7) | 21 (7.7) | 4 (3.8) | 0.262 |
| Tetracyclines (90-day exposure) | 19 (5) | 15 (5.5) | 4 (3.8) | 0.688 |
| B-lactam/B-lactamase (90-day exposure) | 58 (15) | 32 (11.7) | 26 (24.8) | 0.003 |
| Macrolides (90-day exposure) | 34 (9) | 16 (5.8) | 18 (17.1) | 0.001 |
| Glycopeptides (90-day exposure) | 33 (9) | 29 (10.6) | 4 (3.8) | 0.059 |
| Nitroimidazole (90-day exposure) | 29 (8) | 18 (6.6) | 11 (10.5) | 0.287 |
| Colistin (90-day exposure) | 1 (0) | 1 (0.4) | 0 (0.0) | 1.000 |
| B-lactams (90-day exposure) | 70 (18) | 42 (15.3) | 28 (26.7) | 0.016 |
| Glycylcycline (90-day exposure) | 3 (1) | 3 (1.1) | 0 (0.0) | 0.668 |
| Quinolones (90-day exposure) | 64 (17) | 49 (17.9) | 15 (14.3) | 0.494 |
| Oxazolidinones (90-day exposure) | 2 (1) | 2 (0.7) | 0 (0.0) | 0.932 |
| 90-day exposure to any antibiotic | 158 (42) | 108 (39.4) | 50 (47.6) | 0.182 |
| History of infection | ||||
| 90-days prior infection | 87 (23) | 63 (23.0) | 24 (22.9) | 1.000 |
| Previous Gram-negative infection | 48 (13) | 41 (15.0) | 7 (6.7) | 0.045 |
| Previous Gram-positive infection | 34 (9) | 32 (11.7) | 2 (1.9) | 0.005 |
| Previous fungal infections | 4 (1) | 4 (1.5) | 0 (0.0) | 0.495 |
| Previous SARS-CoV-19 infection | 20 (5) | 3 (1.1) | 17 (16.2) | <0.001 |
| Polymicrobial infections | 224 (59) | 137 (50.0) | 87 (82.9) | <0.001 |
| Concurrent Gram-negative infection | 169 (45) | 98 (35.8) | 71 (67.6) | <0.001 |
| Concurrent Gram-positive infection | 106 (28) | 68 (24.8) | 38 (36.2) | 0.038 |
| Concurrent Fungal infection | 59 (16) | 25 (9.1) | 34 (32.4) | <0.001 |
| Concurrent SARS-CoV-19 infection | 7 (2) | 0 (0.0) | 7 (6.7) | <0.001 |
| Recovery n (%) | Death n (%) | Univariable OR (CI, p) | OR (Multivariable) | ||
|---|---|---|---|---|---|
| Age Mean (SD) | 53.2 (21.2) | 72.9 (12.7) | 1.1 (1.0–1.1, p < 0.001) | # | 1.13 (1.05–1.24, p = 0.003) |
| Age > 60 years | 102 (54.0) | 87 (46.0) | 8.2 (4.7–14.7, p < 0.001) | # | 3.00 (0.20–45.77, p = 0.426) |
| LOS Mean (SD) | 17.7 (19.2) | 46.4 (48.7) | 1.03 (1.02–1.04, p < 0.001) | # | 0.98 (0.96–1.02, p = 0.321) |
| LOS > 14 days | 106 (57.6) | 78 (42.4) | 4.58 (2.81–7.66, p < 0.001) | # | 0.05 (0.01–0.35, p = 0.004) |
| Admission with infectious disease | 183 (67.0) | 90 (33.0) | 2.98 (1.68–5.63, p < 0.001) | # | 14.59 (2.0–156.98, p = 0.015) |
| Admission to critical care area | 57 (48.7) | 60 (51.3) | 5.08 (3.14–8.29, p < 0.001) | # | 46.39 (5.1–716.25, p = 0.002) |
| Diabetes | 170 (66.9) | 84 (33.1) | 2.45 (1.45–4.27, p = 0.001) | # | 0.03 (0.00–0.48, p = 0.077) |
| Chronic kidney disease | 141 (61.8) | 87 (38.2) | 4.56 (2.66–8.19, p < 0.001) | # | 0.12 (0.00–2.51, p = 0.328) |
| Active malignancy | 7 (50.0) | 7 (50.0) | 2.72 (0.91–8.15, p = 0.067) | # | 0.11 (0.00–71.31, p = 0.598) |
| Chronic Cardiac Diseases | 185 (65.6) | 97 (34.4) | 5.83 (2.87–13.5, p < 0.001) | # | 0.15 (0.00–6.99, p = 0.423) |
| Chronic Resp. Disease | 27 (38.6) | 43 (61.4) | 6.34 (3.66–11.2, p < 0.001) | # | 1.10 (0.00–29.04, p = 0.966) |
| Sickle Cell | 18 (94.7) | 1 (5.3) | 0.14 (0.01–0.68, p = 0.054) | # | 0.01 (0.00–0.87, p = 0.081) |
| Other comorbidities | 122 (68.2) | 57 (31.8) | 1.48 (0.94–2.33, p = 0.089) | # | 0.36 (0.00–7.60, p = 0.626) |
| Comorbid Mean (SD) | 3.5 (1.4) | 4.7 (1.1) | 2.06 (1.67–2.58, p < 0.001) | # | 6.11 (0.36–2119.6, p = 0.358) |
| Any comorbidity | 234 (69.2) | 104 (30.8) | 17.8 (3.8–317.5, p = 0.005) | # | 111.3 (1.3–15,131, p = 0.045) |
| Blood transfusion during admission | 128 (60.4) | 84 (39.6) | 4.56 (2.72–7.94, p < 0.001) | # | 0.95 (0.21–4.00, p = 0.942) |
| Invasive procedure during admission | 182 (63.9) | 103 (36.1) | 26.03 (8–160.03, p < 0.001) | # | 392.6 (37.8–7562, p < 0.001) |
| Surgery 90-day history | 35 (89.7) | 4 (10.3) | 0.27 (0.08–0.70, p = 0.016) | # | 0.11 (0.01–0.73, p = 0.031) |
| Bacteremia | 56 (63.6) | 32 (36.4) | 1.71 (1.02–2.83, p = 0.040) | # | * p = 0.992 |
| Respiratory infections | 53 (58.2) | 38 (41.8) | 2.36 (1.43–3.89, p = 0.001) | # | * p = 0.992 |
| Skin and soft tissue infections | 86 (83.5) | 17 (16.5) | 0.42 (0.23–0.74, p = 0.003) | # | * p = 0.993 |
| Urinary tract infections | 78 (81.2) | 18 (18.8) | 0.52 (0.29, 0.92, p = 0.025) | # | * p = 0.993 |
| CRE infections | 21 (87.5) | 3 (12.5) | 0.35 (0.08–1.06, p = 0.099) | # | 0.02 (0.00–0.39, p = 0.013) |
| MDR infections | 39 (58.2) | 28 (41.8) | 2.19 (1.26–3.79, p = 0.005) | # | 0.64 (0.13–3.11, p = 0.575) |
| MRSA infections | 11 (91.7) | 1 (8.3) | 0.23 (0.01–1.20, p = 0.162) | # | 1.36 (0.04–19.46, p = 0.840) |
| Hospital-acquired infections | 94 (56.3) | 73 (43.7) | 4.37 (2.71–7.17, p < 0.001) | # | 5.22 (1.13–28.78, p = 0.043) |
| Aminoglycosides (90-day exposure) | 21 (84.0) | 4 (16.0) | 0.48 (0.14–1.29, p = 0.185) | # | 2.17 (0.02–210.65, p = 0.739) |
| B-lactam/B-lactamase (90-day exposure) | 32 (55.2) | 26 (44.8) | 2.49 (1.39–4.43, p = 0.002) | # | 141.9 (10.7–2759, p < 0.001) |
| Macrolides (90-day exposure) | 16 (47.1) | 18 (52.9) | 3.34 (1.63–6.89, p = 0.001) | # | 1.68 (0.09–31.01, p = 0.724) |
| Glycopeptides (90-day exposure) | 29 (87.9) | 4 (12.1) | 0.33 (0.10–0.88, p = 0.045) | # | 0.07 (0.00–2.54, p = 0.171) |
| Nitroimidazole (90-day exposure) | 18 (62.1) | 11 (37.9) | 1.66 (0.74–3.61, p = 0.204) | # | 39.83 (1.2–1506.5, p = 0.043) |
| B-lactams (90-day exposure) | 42 (60.0) | 28 (40.0) | 2.01 (1.16–3.45, p = 0.012) | # | 15.13 (1.57–172.3, p = 0.021) |
| 90-day exposure to any antibiotic | 108 (68.4) | 50 (31.6) | 1.40 (0.89–2.20, p = 0.148) | # | 0.28 (0.02–3.55, p = 0.330) |
| Previous Gram-negative infection | 41 (85.4) | 7 (14.6) | 0.41 (0.16–0.88, p = 0.034) | # | 0.72 (0.04–9.96, p = 0.812) |
| Previous Gram-positive infection | 32 (94.1) | 2 (5.9) | 0.15 (0.02–0.50, p = 0.009) | # | 0.01 (0.00–0.68, p = 0.052) |
| Previous SARSCoV19 infection | 3 (15.0) | 17 (85.0) | 17.45 (5.70–76, p < 0.001) | # | 1.42 (0.01–123.01, p = 0.873) |
| Polymicrobial infections | 137 (61.2) | 87 (38.8) | 4.83 (2.82–8.69, p < 0.001) | # | 1.91 (0.19–19.60, p = 0.581) |
| Concurrent Gram-negative infection | 98 (58.0) | 71 (42.0) | 3.75 (2.34–6.10, p < 0.001) | # | 3.03 (0.51–21.84, p = 0.241) |
| Concurrent Gram-positive infection | 68 (64.2) | 38 (35.8) | 1.72 (1.06–2.78, p = 0.028) | # | 0.71 (0.15–3.24, p = 0.652) |
| Concurrent Fungal infection | 25 (42.4) | 34 (57.6) | 4.77 (2.68–8.59, p < 0.001) | # | 1.73 (0.25–12.42, p = 0.575) |
| Concurrent SARSCoV19 infection | 0 (0.0) | 7 (100.0) | * p = 0.976 |
| No | Yes | Univariable OR (CI, p) | Multivariable OR (CI, p) | ||
|---|---|---|---|---|---|
| Male | 241 (90.9) | 24 (9.1) | 3.68 (1.25–15.73, p = 0.036) | # | 5.01 (0.70–65.98, p = 0.154) |
| Age Mean (SD) | 57.5 (21.1) | 73.4 (16.0) | 1.05 (1.02–1.07, p < 0.001) | # | 1.06 (0.99–1.14, p = 0.116) |
| Age > 60 years | 167 (88.4) | 22 (11.6) | 4.87 (1.95–14.81, p = 0.002) | # | 1.06 (0.08–15.47, p = 0.967) |
| Length of stay mean (SD) | 27.2 (33.7) | 5.3 (3.7) | 0.85 (0.77–0.92, p < 0.001) | # | 0.71 (0.58–0.83, p < 0.001) |
| Chronic kidney disease | 208 (91.2) | 20 (8.8) | 1.98 (0.85–5.15, p = 0.132) | # | 0.60 (0.11–3.20, p = 0.550) |
| Blood transfusion during admission | 201 (94.8) | 11 (5.2) | 0.52 (0.23–1.14, p = 0.104) | # | 1.73 (0.43–7.20, p = 0.441) |
| Invasive procedure during admission | 260 (91.2) | 25 (8.8) | 4.42 (1.28–27.83, p = 0.046) | # | 100.8 (13.88–1455.8, p < 0.001) |
| Bacteremia | 75 (85.2) | 13 (14.8) | 3.43 (1.53–7.65, p = 0.002) | # | 2.06 (0.40–11.46, p = 0.389) |
| Skin and soft tissue infections | 99 (96.1) | 4 (3.9) | 0.44 (0.13–1.19, p = 0.144) | # | 0.40 (0.06–2.50, p = 0.333) |
| Gram-negative infections | 217 (95.6) | 10 (4.4) | 0.37 (0.16–0.81, p = 0.015) | # | 0.24 (0.03–1.99, p = 0.172) |
| Gram-positive infections | 94 (87.9) | 13 (12.1) | 2.55 (1.14–5.65, p = 0.020) | # | 1.00 (0.11–9.98, p = 0.998) |
| Community-acquired infections | 162 (97.0) | 5 (3.0) | 3.9 (0.09–0.67, p = 0.009) | # | 4.80 (0.57–50.13, p = 0.162) |
| Aminoglycosides (90-day exposure) | 21 (84.0) | 4 (16.0) | 2.74 (0.75–7.96, p = 0.086) | # | 189.14 (2.47–18,342.45, p = 0.020) |
| Tetracyclines (90-day exposure) | 16 (84.2) | 3 (15.8) | 2.62 (0.58–8.58, p = 0.146) | # | 0.35 (0.01–14.33, p = 0.559) |
| B-lactam/B-lactamase (90-day exposure) | 57 (98.3) | 1 (1.7) | 0.20 (0.01–0.97, p = 0.117) | # | 0.01 (0.00–0.23, p = 0.013) |
| 90-day exposure to any antibiotic | 151 (95.6) | 7 (4.4) | 0.47 (0.18–1.08, p = 0.091) | # | 0.28 (0.04–1.46, p = 0.157) |
| 90-days prior infection | 84 (96.6) | 3 (3.4) | 0.40 (0.09–1.18, p = 0.141) | # | 0.21 (0.02–1.70, p = 0.179) |
| Polymicrobial infections | 212 (94.6) | 12 (5.4) | 0.53 (0.24–1.16, p = 0.113) | # | 2.68 (0.24–24.41, p = 0.386) |
| Concurrent Gram-negative infection | 161 (95.3) | 8 (4.7) | 0.50 (0.20–1.13, p = 0.110) | # | 0.36 (0.04–4.35, p = 0.394) |
| Concurrent SARSCoV19 infection | 4 (57.1) | 3 (42.9) | 10.87 (2.05–52.10, p = 0.003) | # | 4.92 (0.04–1209.39, p = 0.612) |
| No | Yes | Univariable OR (CI, p) | Multivariable OR (CI, p) | ||
|---|---|---|---|---|---|
| Age Mean (SD) | 57.6 (21.3) | 70.8 (14.8) | 1.04 (1.01–1.06, p = 0.002) | # | 0.96 (0.89–1.03, p = 0.257) |
| Age > 60 years | 164 (86.8) | 25 (13.2) | 5.64 (2.29–17.01, p = 0.001) | # | 66.81 (3.58–2143.23, p = 0.009) |
| Admission with infectious disease | 247 (90.5) | 26 (9.5) | 2.68 (1.01–9.27, p = 0.073) | # | 4.02 (0.97–21.13, p = 0.072) |
| Chronic kidney disease | 205 (89.9) | 23 (10.1) | 2.31 (1.01–5.95, p = 0.060) | # | 0.02 (0.00–0.40, p = 0.015) |
| Active malignancy | 8 (57.1) | 6 (42.9) | 10.66 (3.28–33.21, p < 0.001) | # | * (p = 0.830) |
| Immunosuppressed | 18 (75.0) | 6 (25.0) | 4.60 (1.55–12.15, p = 0.003) | # | 0.00 (0.00–1.13, p = 0.843) |
| Chronic Cardiac Diseases | 255 (90.4) | 27 (9.6) | 3.32 (1.14–14.12, p = 0.053) | # | 4.30 (0.39–67.64, p = 0.260) |
| Chronic Resp. Disease | 68 (97.1) | 2 (2.9) | 0.30 (0.05–1.02, p = 0.101) | # | 0.00 (0.00–0.07, p = 0.001) |
| Other comorbidities | 155 (86.6) | 24 (13.4) | 5.01 (2.12–13.79, p = 0.001) | # | 0.13 (0.01–1.51, p = 0.117) |
| No. of comorbid Mean (SD) | 3.7 (1.4) | 4.8 (1.6) | 1.81 (1.33–2.55, p < 0.001) | # | 3.16 (0.77–15.18, p = 0.123) |
| Blood transfusion | 187 (88.2) | 25 (11.8) | 4.33 (1.75–13.06, p = 0.003) | # | 13.70 (2.85–91.25, p = 0.003) |
| Respiratory infections | 79 (86.8) | 12 (13.2) | 2.28 (1.03–4.89, p = 0.037) | # | 1.28 (0.38–4.35, p = 0.689) |
| Skin and soft tissue infections | 102 (99.0) | 1 (1.0) | 0.08 (0.00–0.40, p = 0.015) | # | 0.14 (0.00–1.35, p = 0.148) |
| Fungal infections | 26 (83.9) | 5 (16.1) | 2.48 (0.79–6.58, p = 0.086) | # | 4.35 (0.54–34.25, p = 0.157) |
| ESBL infections | 49 (98.0) | 1 (2.0) | 0.21 (0.01–1.02, p = 0.131) | # | 0.38 (0.02–3.09, p = 0.431) |
| Place of Acquisition | 145 (86.8) | 22 (13.2) | 3.87 (1.74–9.48, p = 0.002) | # | 6.62 (1.44–37.62, p = 0.021) |
| Cephalosporins (90-day exposure) | 92 (87.6) | 13 (12.4) | 2.14 (0.98–4.55, p = 0.050) | # | 13.21 (2.33–102.04, p = 0.007) |
| B-lactam/B-lactamase (90-day exposure) | 49 (84.5) | 9 (15.5) | 2.62 (1.09–5.91, p = 0.024) | # | 22.11 (4.66–137.65, p < 0.001) |
| Polymicrobial Infections | 196 (87.5) | 28 (12.5) | 10.93 (3.22–68.35, p = 0.001) | # | 31.80 (1.97–934.33, p = 0.024) |
| Concurrent Gram-negative infection | 144 (85.2) | 25 (14.8) | 7.12 (2.88–21.48, p < 0.001) | # | 4.73 (0.97–34.53, p = 0.081) |
| Antimicrobial Therapy | Overall | 14-Day Mortality (27) | 28-Day Mortality (30) | All-Cause In-Hospital Mortality (105) | LOS | |||||||||
|---|---|---|---|---|---|---|---|---|---|---|---|---|---|---|
| no. (%) | no. (%) | p | OR | no. (%) | p | OR | no. (%) | p | OR | Median | IQR | p | OR | |
| Combined | 129 (34) | 11 (41) | 0.45 | 1.4 | 7 (23) | 0.20 | 0.6 | 35 (33) | 0.86 | 1.0 | 11 | (6–27) | 0.21 | 1.0 |
| Monotherapy | 250 (66) | 16 (59) | 0.45 | 0.7 | 23 (77) | 0.20 | 1.8 | 70 (67) | 0.86 | 1.0 | 16 | (5–34) | 0.21 | 1.0 |
| Cephalosporin-based | 157 (41) | 16 (59) | 0.06 | 2.2 | 10 (33) | 0.35 | 0.7 | 51 (49) | 0.08 | 1.5 | 9 | (5–23) | 0.35 | 1.0 |
| β-lactam/β-lactamase inhibitor-based | 131 (35) | 13 (48) | 0.13 | 1.8 | 13 (43) | 0.30 | 1.5 | 46 (44) | 0.02 | 1.7 | 16 | (5–38) | 0.10 | 1.0 |
| Piperacillin/Tazobactam based | 99 (26) | 9 (33) | 0.38 | 1.5 | 9 (30) | 0.62 | 1.2 | 36 (34) | 0.03 | 1.7 | 24 | (8–50) | 0.00 | 1.0 |
| Quinolones-based | 45 (12) | 0 (0) | 0.97 | * | 1 (3) | 0.17 | 0.2 | 2 (2) | 0.00 | 0.1 | 16 | (9–25) | 0.37 | 1.0 |
| Vancomycin-based | 38 (10) | 1 (4) | 0.28 | 0.3 | 6 (20) | 0.07 | 2.5 | 10 (10) | 0.84 | 0.9 | 11 | (5–26) | 0.07 | 1.0 |
| β-lactam-based | 37 (10 | 0 (0) | 0.96 | * | 3 (10) | 0.96 | 1.0 | 5 (5) | 0.05 | 0.4 | 18 | (8–41) | 0.99 | 1.0 |
| Antifungal | 31 (8) | 1 (4) | 0.39 | 0.4 | 5 (17) | 0.09 | 2.5 | 9 (9) | 0.86 | 1.1 | 16 | (5–40) | 0.91 | 1.0 |
| Tetracycline-based | 30 (8) | 2 (7) | 0.92 | 0.9 | 0 (0) | 0.96 | * | 2 (2) | 0.02 | 0.2 | 6.5 | (5–19) | 0.38 | 1.0 |
| Meropenem based | 28 (7) | 0 (0) | 0.96 | * | 3 (10) | 0.57 | 1.4 | 4 (4) | 0.11 | 0.4 | 18 | (10–41) | 0.49 | 1.0 |
| Macrolide-based | 28 (7) | 6 (22) | 0.01 | 4.3 | 3 (10) | 0.57 | 1.4 | 12 (11) | 0.07 | 2.1 | 9 | (4–17) | 0.12 | 1.0 |
| Colistin-based | 24 (6) | 0 (0) | 0.97 | * | 4 (13) | 0.11 | 2.5 | 7 (7) | 0.87 | 1.1 | 40 | (22–60) | 0.01 | 1.0 |
| Aminoglycosides-based | 22 (6) | 0 (0) | 0.97 | * | 0 (0) | 0.97 | * | 7 (7) | 0.66 | 1.2 | 11 | (7–37) | 0.72 | 1.0 |
Disclaimer/Publisher’s Note: The statements, opinions and data contained in all publications are solely those of the individual author(s) and contributor(s) and not of MDPI and/or the editor(s). MDPI and/or the editor(s) disclaim responsibility for any injury to people or property resulting from any ideas, methods, instructions or products referred to in the content. |
© 2023 by the authors. Licensee MDPI, Basel, Switzerland. This article is an open access article distributed under the terms and conditions of the Creative Commons Attribution (CC BY) license (https://creativecommons.org/licenses/by/4.0/).
Share and Cite
Alrahmany, D.; Omar, A.F.; Hafez, W.; Albaloshi, S.; Harb, G.; Ghazi, I.M. Infections in Glucose-6-Phosphate Dehydrogenase G6PD-Deficient Patients; Predictors for Infection-Related Mortalities and Treatment Outcomes. Antibiotics 2023, 12, 494. https://doi.org/10.3390/antibiotics12030494
Alrahmany D, Omar AF, Hafez W, Albaloshi S, Harb G, Ghazi IM. Infections in Glucose-6-Phosphate Dehydrogenase G6PD-Deficient Patients; Predictors for Infection-Related Mortalities and Treatment Outcomes. Antibiotics. 2023; 12(3):494. https://doi.org/10.3390/antibiotics12030494
Chicago/Turabian StyleAlrahmany, Diaa, Ahmed F. Omar, Wael Hafez, Sara Albaloshi, Gehan Harb, and Islam M. Ghazi. 2023. "Infections in Glucose-6-Phosphate Dehydrogenase G6PD-Deficient Patients; Predictors for Infection-Related Mortalities and Treatment Outcomes" Antibiotics 12, no. 3: 494. https://doi.org/10.3390/antibiotics12030494
APA StyleAlrahmany, D., Omar, A. F., Hafez, W., Albaloshi, S., Harb, G., & Ghazi, I. M. (2023). Infections in Glucose-6-Phosphate Dehydrogenase G6PD-Deficient Patients; Predictors for Infection-Related Mortalities and Treatment Outcomes. Antibiotics, 12(3), 494. https://doi.org/10.3390/antibiotics12030494