Epidemiology of Antimicrobial Resistance Genes in Staphylococcus aureus Isolates from a Public Database from a One Health Perspective—Sample Origin and Geographical Distribution of Isolates

 , , , , , ,
Abstract
:1. Introduction
2. Results
2.1. Data Description
2.2. European Isolates
2.3. USA Isolates
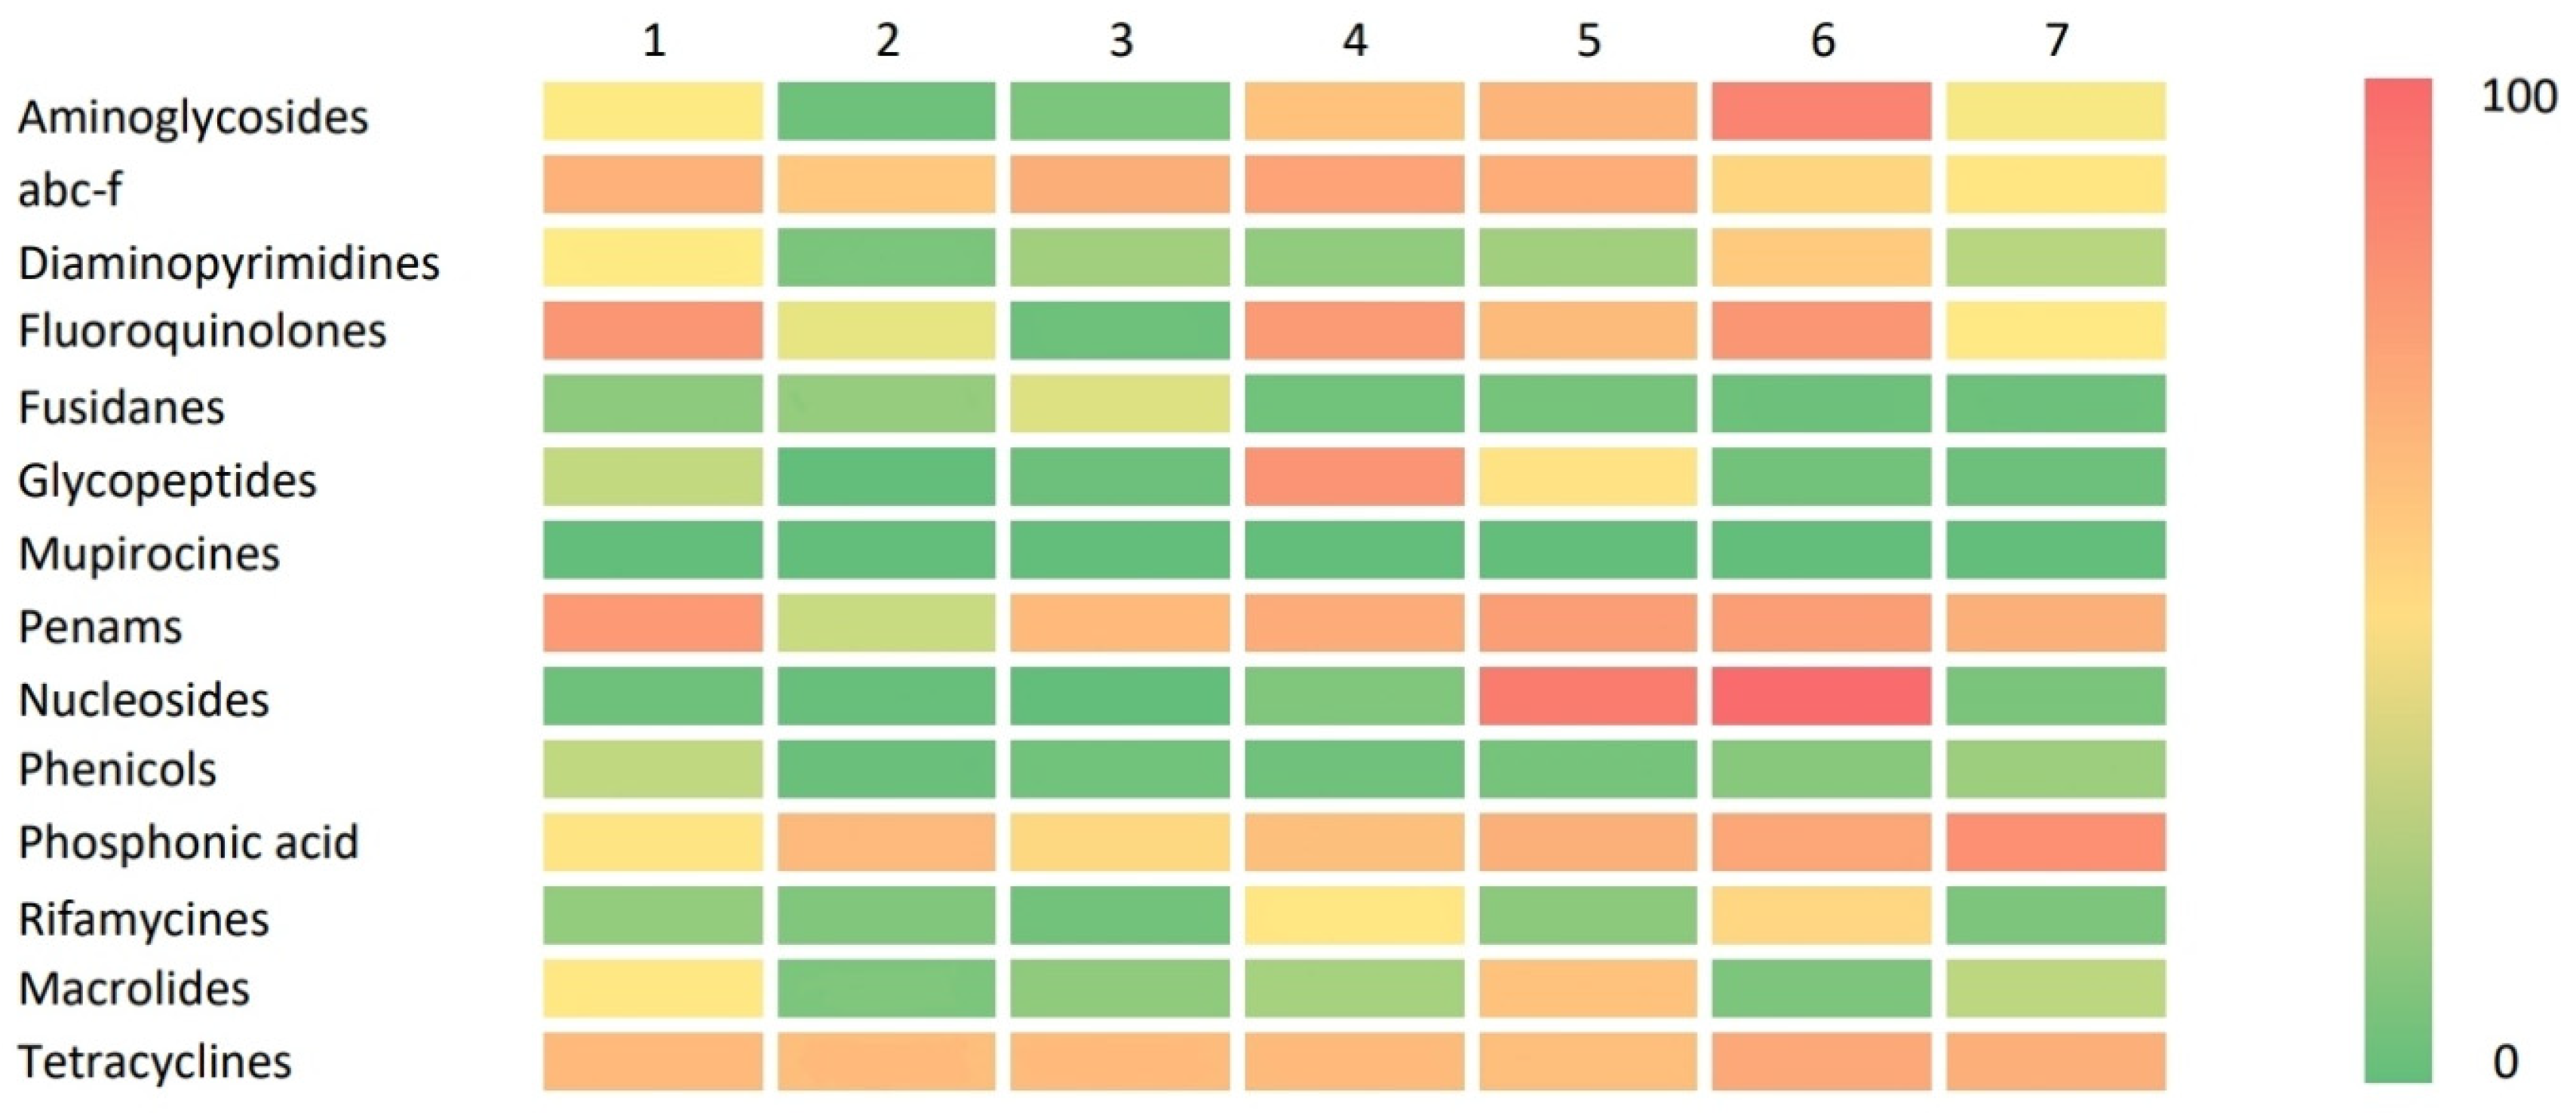
2.4. Resistance Gene Distribution
2.5. Cluster Analyses
2.5.1. Association between Gene Cluster and Geographical Area of Submission
2.5.2. European and USA Isolates
2.6. Isolates from Humans (Clinical Sources)
2.7. Isolates from Animals, Food, and Environment
3. Discussion
4. Materials and Methods
4.1. NCBI Pathogen Detection Isolate Browser and Antibacterial Data (NPDIB)
4.2. Statistical Analysis
5. Conclusions
Supplementary Materials
Author Contributions
Funding
Institutional Review Board Statement
Informed Consent Statement
Data Availability Statement
Conflicts of Interest
References
- Gajdács, M. The Continuing Threat of Methicillin-Resistant Staphylococcus aureus. Antibiotics 2019, 8, 52. [Google Scholar] [CrossRef]
- Fogarty, L.R.; Haack, S.K.; Johnson, H.E.; Brennan, A.K.; Isaacs, N.M.; Spencer, C. Staphylococcus aureus and Methicillin-Resistant S. aureus (MRSA) at Ambient Freshwater Beaches. J. Water Health 2014, 13, 680–692. [Google Scholar] [CrossRef]
- Tong, S.Y.C.; Davis, J.S.; Eichenberger, E.; Holland, T.L.; Fowler, V.G. Staphylococcus aureus Infections: Epidemiology, Pathophysiology, Clinical Manifestations, and Management. Clin. Microbiol. Rev. 2015, 28, 603–661. [Google Scholar] [CrossRef] [PubMed]
- Wertheim, H.F.L.; Melles, D.C.; Vos, M.C.; Van Leeuwen, W.; Van Belkum, A.; Verbrugh, H.A.; Nouwen, J.L. The Role of Nasal Carriage in Staphylococcus aureus Infections. Lancet Infect. Dis. 2005, 5, 751–762. [Google Scholar] [CrossRef] [PubMed]
- Ikuta, K.S.; Swetschinski, L.R.; Aguilar, G.R.; Sharara, F.; Mestrovic, T.; Gray, A.P.; Weaver, N.D.; Wool, E.; Han, C.; Hayoon, A.G.; et al. Global Mortality Associated with 33 Bacterial Pathogens in 2019: A Systematic Analysis for the Global Burden of Disease Study 2019. Lancet 2022, 400, 2221–2248. [Google Scholar] [CrossRef] [PubMed]
- Heaton, C.J.; Gerbig, G.R.; Sensius, L.D.; Patel, V.; Smith, T.C. Staphylococcus aureus Epidemiology in Wildlife: A Systematic Review. Antibiotics 2020, 9, 89. [Google Scholar] [CrossRef]
- Park, S.; Ronholm, J. Staphylococcus aureus in Agriculture: Lessons in Evolution from a Multispecies Pathogen. Clin. Microbiol. Rev. 2021, 34, 1110–1128. [Google Scholar] [CrossRef]
- Abdel-Moein, K.A.; Samir, A. Isolation of Enterotoxigenic Staphylococcus aureus from Pet Dogs and Cats: A Public Health Implication. Vector-Borne Zoonotic Dis. 2011, 11, 627–629. [Google Scholar] [CrossRef]
- Ren, Q.; Liao, G.; Wu, Z.; Lv, J.; Chen, W. Prevalence and Characterization of Staphylococcus aureus Isolates from Subclinical Bovine Mastitis in Southern Xinjiang, China. J. Dairy Sci. 2020, 103, 3368–3380. [Google Scholar] [CrossRef]
- Szafraniec, G.M.; Szeleszczuk, P.; Dolka, B. Review on Skeletal Disorders Caused by Staphylococcus Spp. in Poultry. Vet. Q. 2022, 42, 21–40. [Google Scholar] [CrossRef]
- Xu, Y.; Rivas, J.M.; Brown, E.L.; Liang, X.; Höök, M. Virulence Potential of the Staphylococcal Adhesin CNA in Experimental Arthritis Is Determined by Its Affinity for Collagen. J. Infect. Dis. 2004, 189, 2323–2333. [Google Scholar] [CrossRef] [PubMed]
- Ali, Y.; Islam, M.A.; Muzahid, N.H.; Sikder, M.O.F.; Hossain, M.A.; Marzan, L.W. Characterization, Prevalence and Antibiogram Study of Staphylococcus aureus in Poultry. Asian Pac. J. Trop. Biomed. 2017, 7, 253–256. [Google Scholar] [CrossRef]
- Youssef, F.M.; Soliman, A.A.; Ibrahim, G.A.; Saleh, H.A. Advanced Bacteriological Studies on Bumblefoot Infections in Broiler Chicken with Some Clinicopathological Alteration. Vet. Sci. Res. 2019, 1, 1–10. [Google Scholar]
- Van Duijkeren, E.; Jansen, M.D.; Flemming, S.C.; De Neeling, H.; Wagenaar, J.A.; Schoormans, A.H.W.; Van Nes, A.; Fluit, A.C. Methicillin-Resistant Staphylococcus aureus in Pigs with Exudative Epidermitis. Emerg. Infect. Dis. 2007, 13, 1408–1410. [Google Scholar] [CrossRef]
- Corpa, J.M.; Hermans, K.; Haesebrouck, F. Main Pathologies Associated with Staphylococcus aureus Infections in Rabbits: A Review. World Rabbit. Sci. 2010, 17, 115–125. [Google Scholar] [CrossRef]
- Viana, D.; Selva, L.; Callanan, J.J.; Guerrero, I.; Ferrian, S.; Corpa, J.M. Strains of Staphylococcus aureus and Pathology Associated with Chronic Suppurative Mastitis in Rabbits. Vet. J. 2011, 190, 403–407. [Google Scholar] [CrossRef]
- Kadariya, J.; Smith, T.C.; Thapaliya, D. Staphylococcus aureus and Staphylococcal Food-Borne Disease: An Ongoing Challenge in Public Health. Biomed. Res. Int. 2014, 2014, 827965. [Google Scholar] [CrossRef]
- Scallan, E.; Hoekstra, R.M.; Angulo, F.J.; Tauxe, R.V.; Widdowson, M.A.; Roy, S.L.; Jones, J.L.; Griffin, P.M. Foodborne Illness Acquired in the United States-Major Pathogens. Emerg. Infect. Dis. 2011, 17, 7–15. [Google Scholar] [CrossRef]
- European Food Safety Authority; European Centre for Disease Prevention and Control. The European Union One Health 2021 Zoonoses Report. EFSA J. 2022, 20, e07666. [Google Scholar] [CrossRef]
- Zaghen, F.; Sora, V.M.; Meroni, G.; Laterza, G.; Martino, P.A.; Soggiu, A.; Bonizzi, L.; Zecconi, A. Epidemiology of Antimicrobial Resistance Genes in Staphyloccocus aureus Isolates from a Public Database in a One Health Perspective—Sample Characteristics and Isolates’ Sources. Antibiotics 2023, 12, 1225. [Google Scholar] [CrossRef]
- Sung, J.M.L.; Lloyd, D.H.; Lindsay, J.A. Staphylococcus aureus Host Specificity: Comparative Genomics of Human versus Animal Isolates by Multi-Strain Microarray. Microbiology 2008, 154, 1949–1959. [Google Scholar] [CrossRef] [PubMed]
- Shepheard, M.A.; Fleming, V.M.; Connor, T.R.; Corander, J.; Feil, E.J.; Fraser, C.; Hanage, W.P. Historical Zoonoses and Other Changes in Host Tropism of Staphylococcus aureus, Identified by Phylogenetic Analysis of a Population Dataset. PLoS ONE 2013, 8, e62369. [Google Scholar] [CrossRef] [PubMed]
- Graham, D.W.; Bergeron, G.; Bourassa, M.W.; Dickson, J.; Gomes, F.; Howe, A.; Kahn, L.H.; Morley, P.S.; Scott, H.M.; Simjee, S.; et al. Complexities in Understanding Antimicrobial Resistance across Domesticated Animal, Human, and Environmental Systems. Ann. N. Y. Acad. Sci. 2019, 1441, 17–30. [Google Scholar] [CrossRef] [PubMed]
- Pennone, V.; Cobo-Díaz, J.F.; Prieto-Maradona, M.; Álvarez-Ordóñez, A. Integration of Genomics in Surveillance and Risk Assessment for Outbreak Investigation. EFSA J. 2022, 20, e200417. [Google Scholar] [CrossRef] [PubMed]
- Meroni, G.; Sora, V.M.; Martino, P.A.; Sbernini, A.; Laterza, G.; Zaghen, F.; Soggiu, A.; Zecconi, A. Epidemiology of Antimicrobial Resistance Genes in Streptococcus agalactiae Sequences from a Public Database in a One Health Perspective. Antibiotics 2022, 11, 1236. [Google Scholar] [CrossRef] [PubMed]
- Piccinini, R.; Borromeo, V.; Zecconi, A. Relationship between S. aureus Gene Pattern and Dairy Herd Mastitis Prevalence. Vet. Microbiol. 2010, 145, 100–105. [Google Scholar] [CrossRef]
- Aarestrup, F.M.; Wegener, H.C.; Jensen, N.E.; Jonsson, O.; Myllys, V.; Thorberg, B.M.; Waage, S.; Rosdahl, V.T. A Study of Phage- and Ribotype Patterns of Staphylococcus aureus Isolated from Bovine Mastitis in the Nordic Countries. Acta Vet. Scand. 1997, 38, 243–252. [Google Scholar] [CrossRef] [PubMed]
- Larsen, H.D.; Aarestrup, F.M.; Jensen, N.E. Geographical Variation in the Presence of Genes Encoding Superantigenic Exotoxins and β-Hemolysin among Staphylococcus aureus Isolated from Bovine Mastitis in Europe and USA. Vet. Microbiol. 2002, 85, 61–67. [Google Scholar] [CrossRef]
- Coppens, J.; Xavier, B.B.; Vlaeminck, J.; Larsen, J.; Lammens, C.; Van Puyvelde, S.; Goossens, H.; Larsen, A.R.; Malhotra-Kumar, S. Genomic Analysis of Methicillin-Resistant Staphylococcus aureus Clonal Complex 239 Isolated from Danish Patients with and without an International Travel History. Front. Microbiol. 2022, 13, 1016829. [Google Scholar] [CrossRef]
- De Backer, S.; Xavier, B.B.; Vanjari, L.; Coppens, J.; Lammens, C.; Vemu, L.; Carevic, B.; Hryniewicz, W.; Jorens, P.; Kumar-Singh, S.; et al. Remarkable Geographical Variations between India and Europe in Carriage of the Staphylococcal Surface Protein-Encoding SasX/SesI and in the Population Structure of Methicillin-Resistant Staphylococcus aureus Belonging to Clonal Complex 8. Clin. Microbiol. Infect. 2018, 25, 628.e1–628.e7. [Google Scholar] [CrossRef]
- Fetsch, A.; Etter, D.; Johler, S. Livestock-Associated Meticillin-Resistant Staphylococcus aureus—Current Situation and Impact From a One Health Perspective. Curr. Clin. Microbiol. Rep. 2021, 8, 103–113. [Google Scholar] [CrossRef]
- Wu, Q.; Sabokroo, N.; Wang, Y.; Hashemian, M.; Karamollahi, S.; Kouhsari, E. Systematic Review and Meta-Analysis of the Epidemiology of Vancomycin-Resistance Staphylococcus aureus Isolates. Antimicrob. Resist. Infect. Control. 2021, 10, 101. [Google Scholar] [CrossRef] [PubMed]
- Wu, M.; Tong, X.; Liu, S.; Wang, D.; Wang, L.; Fan, H. Prevalence of Methicillin-Resistant Staphylococcus aureus in Healthy Chinese Population: A System Review and Meta-Analysis. PLoS ONE 2019, 14, e0223599. [Google Scholar] [CrossRef] [PubMed]
- Sulis, G.; Sayood, S.; Gandra, S. Antimicrobial Resistance in Low- and Middle-Income Countries: Current Status and Future Directions. Expert. Rev. Anti Infect. Ther. 2021, 20, 147–160. [Google Scholar] [CrossRef] [PubMed]
- Lawal, O.U.; Ayobami, O.; Abouelfetouh, A.; Mourabit, N.; Kaba, M.; Egyir, B.; Abdulgader, S.M.; Shittu, A.O. A 6-Year Update on the Diversity of Methicillin-Resistant Staphylococcus aureus Clones in Africa: A Systematic Review. Front. Microbiol. 2022, 13, 860436. [Google Scholar] [CrossRef] [PubMed]
- Stefani, S.; Chung, D.R.; Lindsay, J.A.; Friedrich, A.W.; Kearns, A.M.; Westh, H.; MacKenzie, F.M. Meticillin-Resistant Staphylococcus aureus (MRSA): Global Epidemiology and Harmonisation of Typing Methods. Int. J. Antimicrob. Agents 2012, 39, 273–282. [Google Scholar] [CrossRef]
- EU Veterinary Medicinal Product Database. European Medicines Agency. 2019. Available online: http://Data.Europa.Eu/88u/Dataset/Eu-Veterinary-Medicinal-Product-Database (accessed on 5 September 2023).
- Tiseo, K.; Huber, L.; Gilbert, M.; Robinson, T.P.; Van Boeckel, T.P. Global Trends in Antimicrobial Use in Food Animals from 2017 to 2030. Antibiotics 2020, 9, 918. [Google Scholar] [CrossRef]
- Everitt, B.S.; Landau, S.; Leese, M.; Stahl, D. Cluster Analysis, 5th ed.; John Wiley & Sons: Hoboken, NJ, USA, 2011; ISBN 978-0-470-74991-3. [Google Scholar]


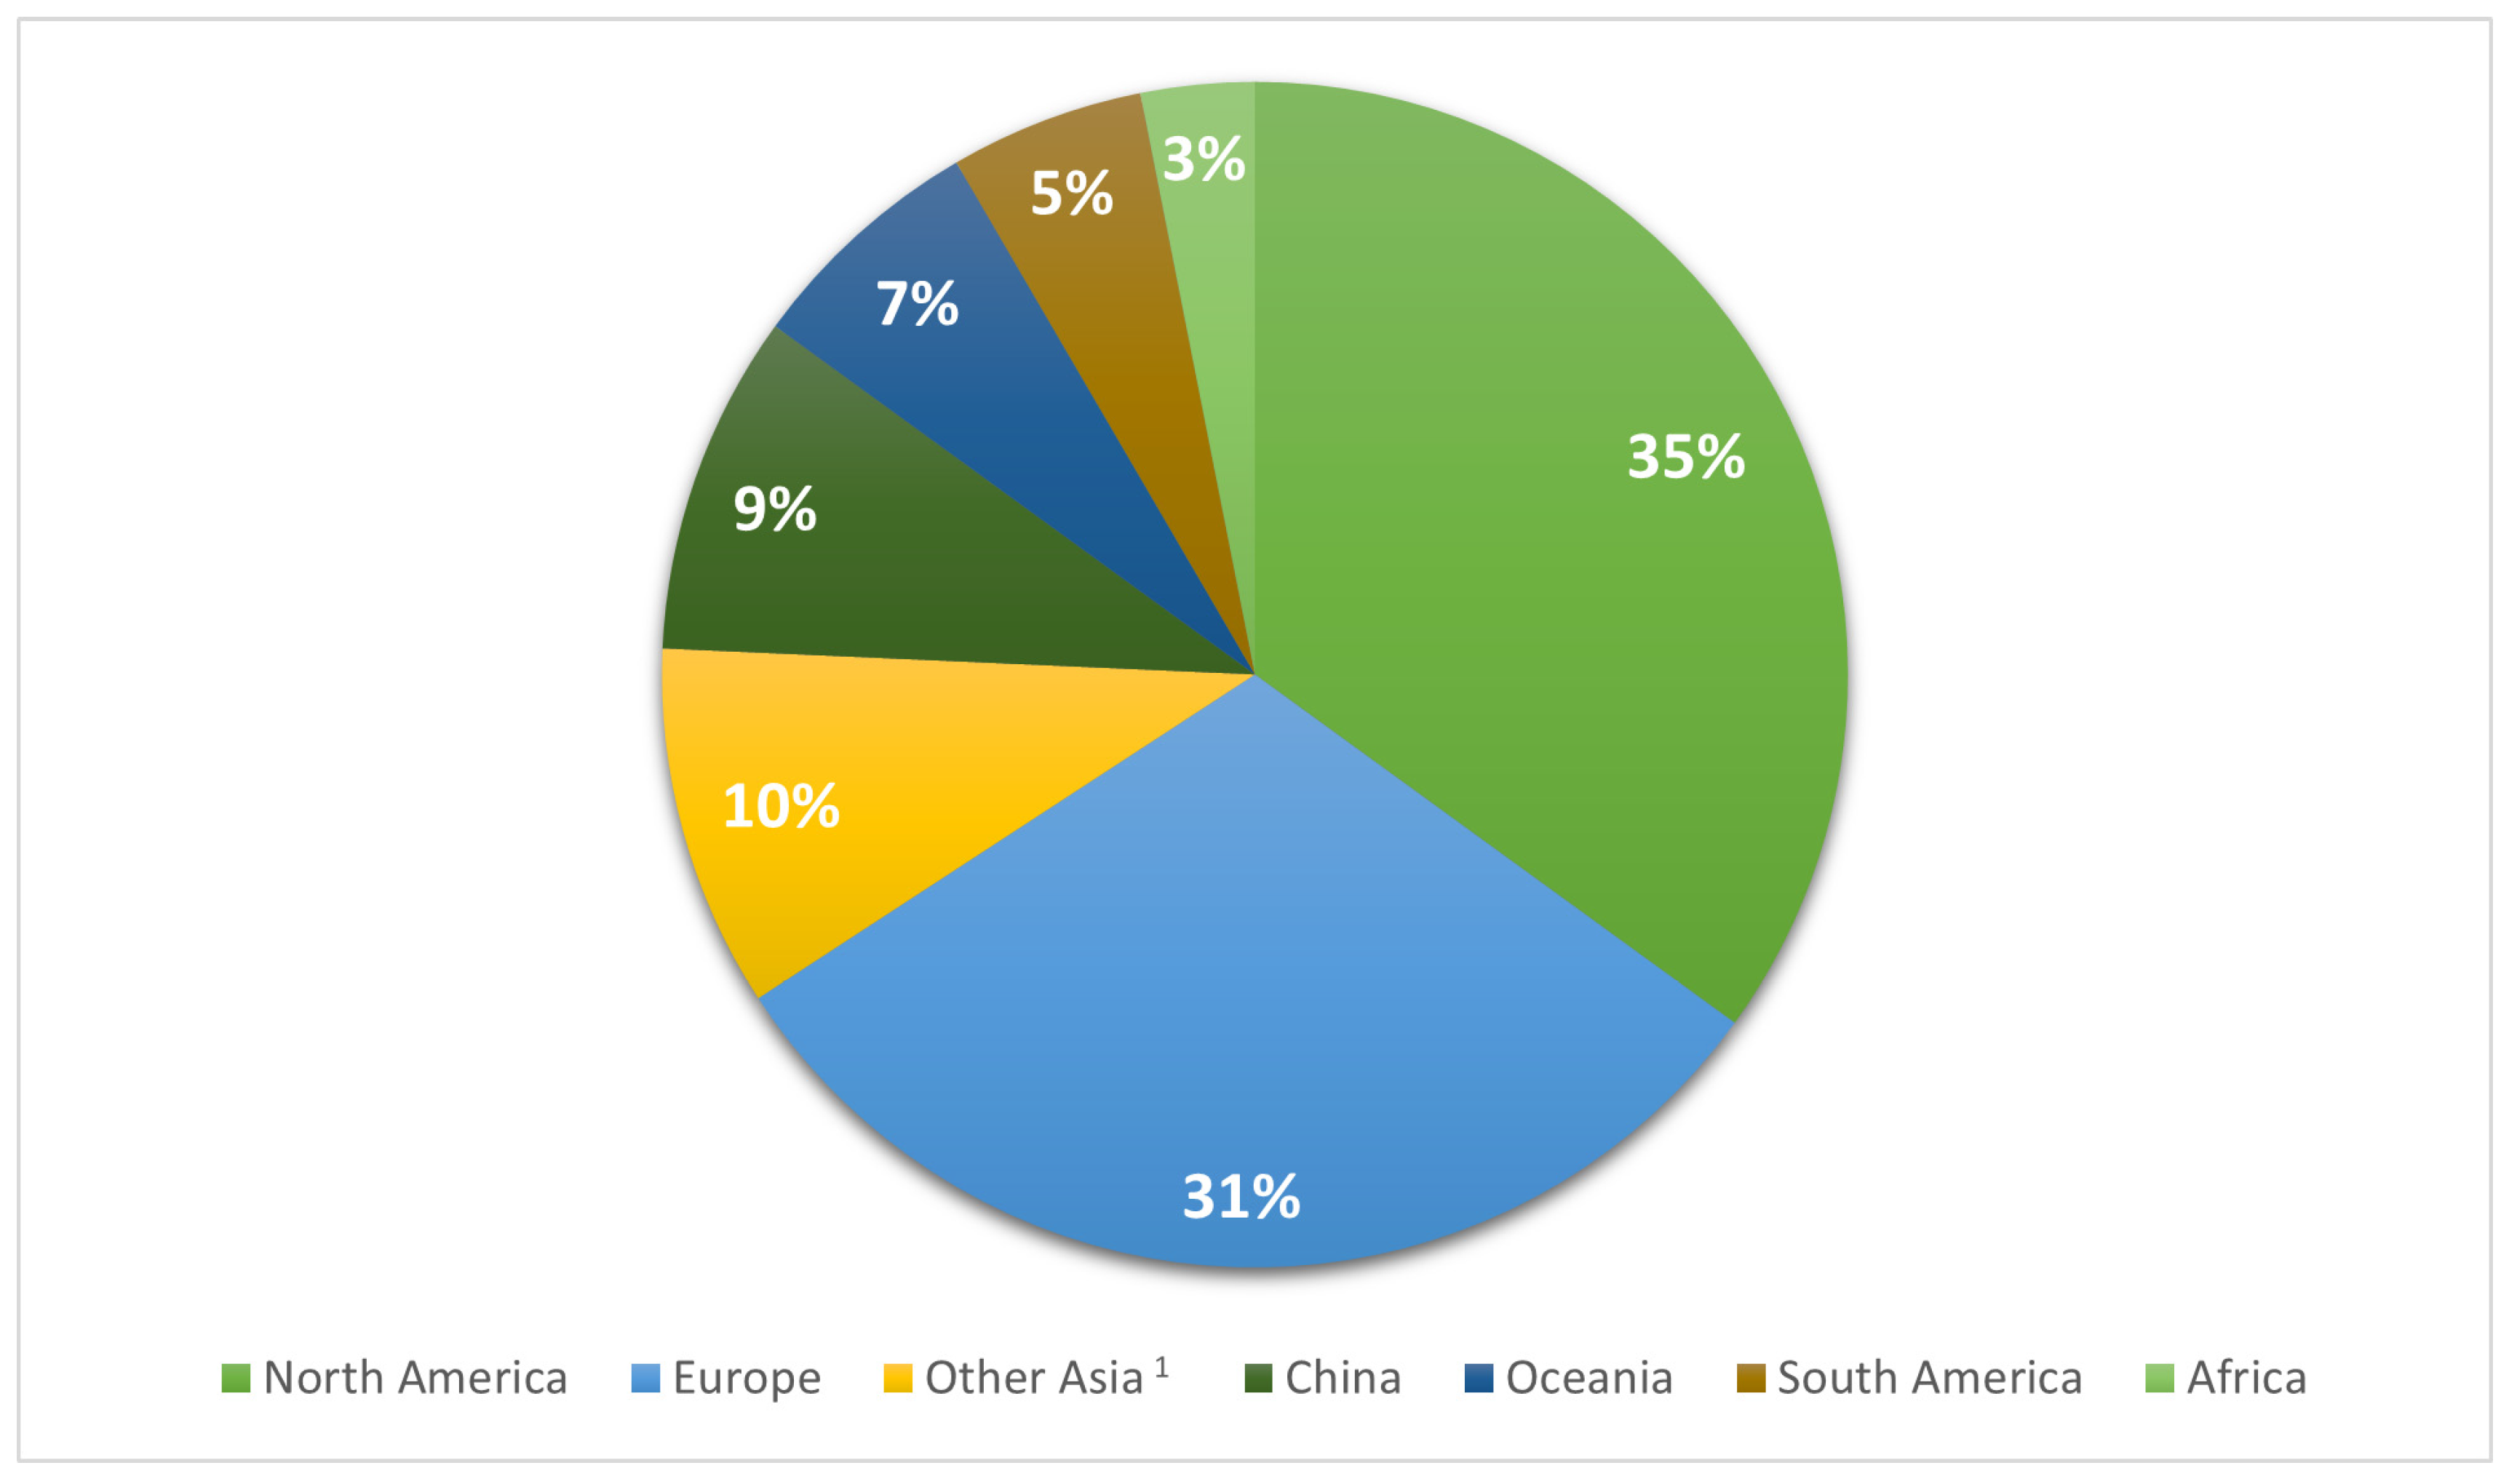
| Geographical Region | NHA 1 | HUA | UNK | Total | |
|---|---|---|---|---|---|
| North America | n % | 595 a,2 (6.4) | 7940 b (77.7) | 1470 c (15.9) | 9255 (100) |
| Europe | n % | 490 a (6) | 3441 b (42.3) | 4213 c (51.7) | 8144 (100) |
| Other Asia 3 | n % | 135 a (5.2) | 1832 b (70.3) | 639 c (24.5) | 2606 (100) |
| China | n % | 685 a (27.8) | 802 b (32.6) | 974 c (39.6) | 2461 (100) |
| Oceania | n % | 85 a (4.9) | 1472 b (84.6) | 183 c (10.5) | 1740 (100) |
| South America | n % | 13 a (0.9) | 1369 b (98.2) | 12 c (0.9) | 1394 (100) |
| Africa | n % | 56 a (6.7) | 545 a (65.7) | 229 a (27.6) | 830 (100) |
| State | NHA 1 | HUA | UNK | Total | |
|---|---|---|---|---|---|
| United Kingdom | n % | 73 a,2 (3.3) | 1440 b (65.1) | 699 a (31.6) | 2212 (100) |
| Other Europe 3 | n % | 129 a (8.1) | 593 b (37.3) | 867 c (54.6) | 1589 (100) |
| Germany | n % | 135 a (8.7) | 586 b (37.9) | 826 c (53.4) | 1547 (100) |
| Denmark | n % | 3 a (0.3) | 153 b (16.5) | 722 c (83.2) | 928 (100) |
| Netherlands | n % | 8 a (1.1) | 282 b (37.4) | 464 c (61.5) | 754 (100) |
| Switzerland | n % | 81 a (13.5) | 115 b (19.2) | 403 c (67.3) | 599 (100) |
| Italy | n % | 61 a (11.8) | 272 b (52.8) | 182 c (35.3) | 515 (100) |
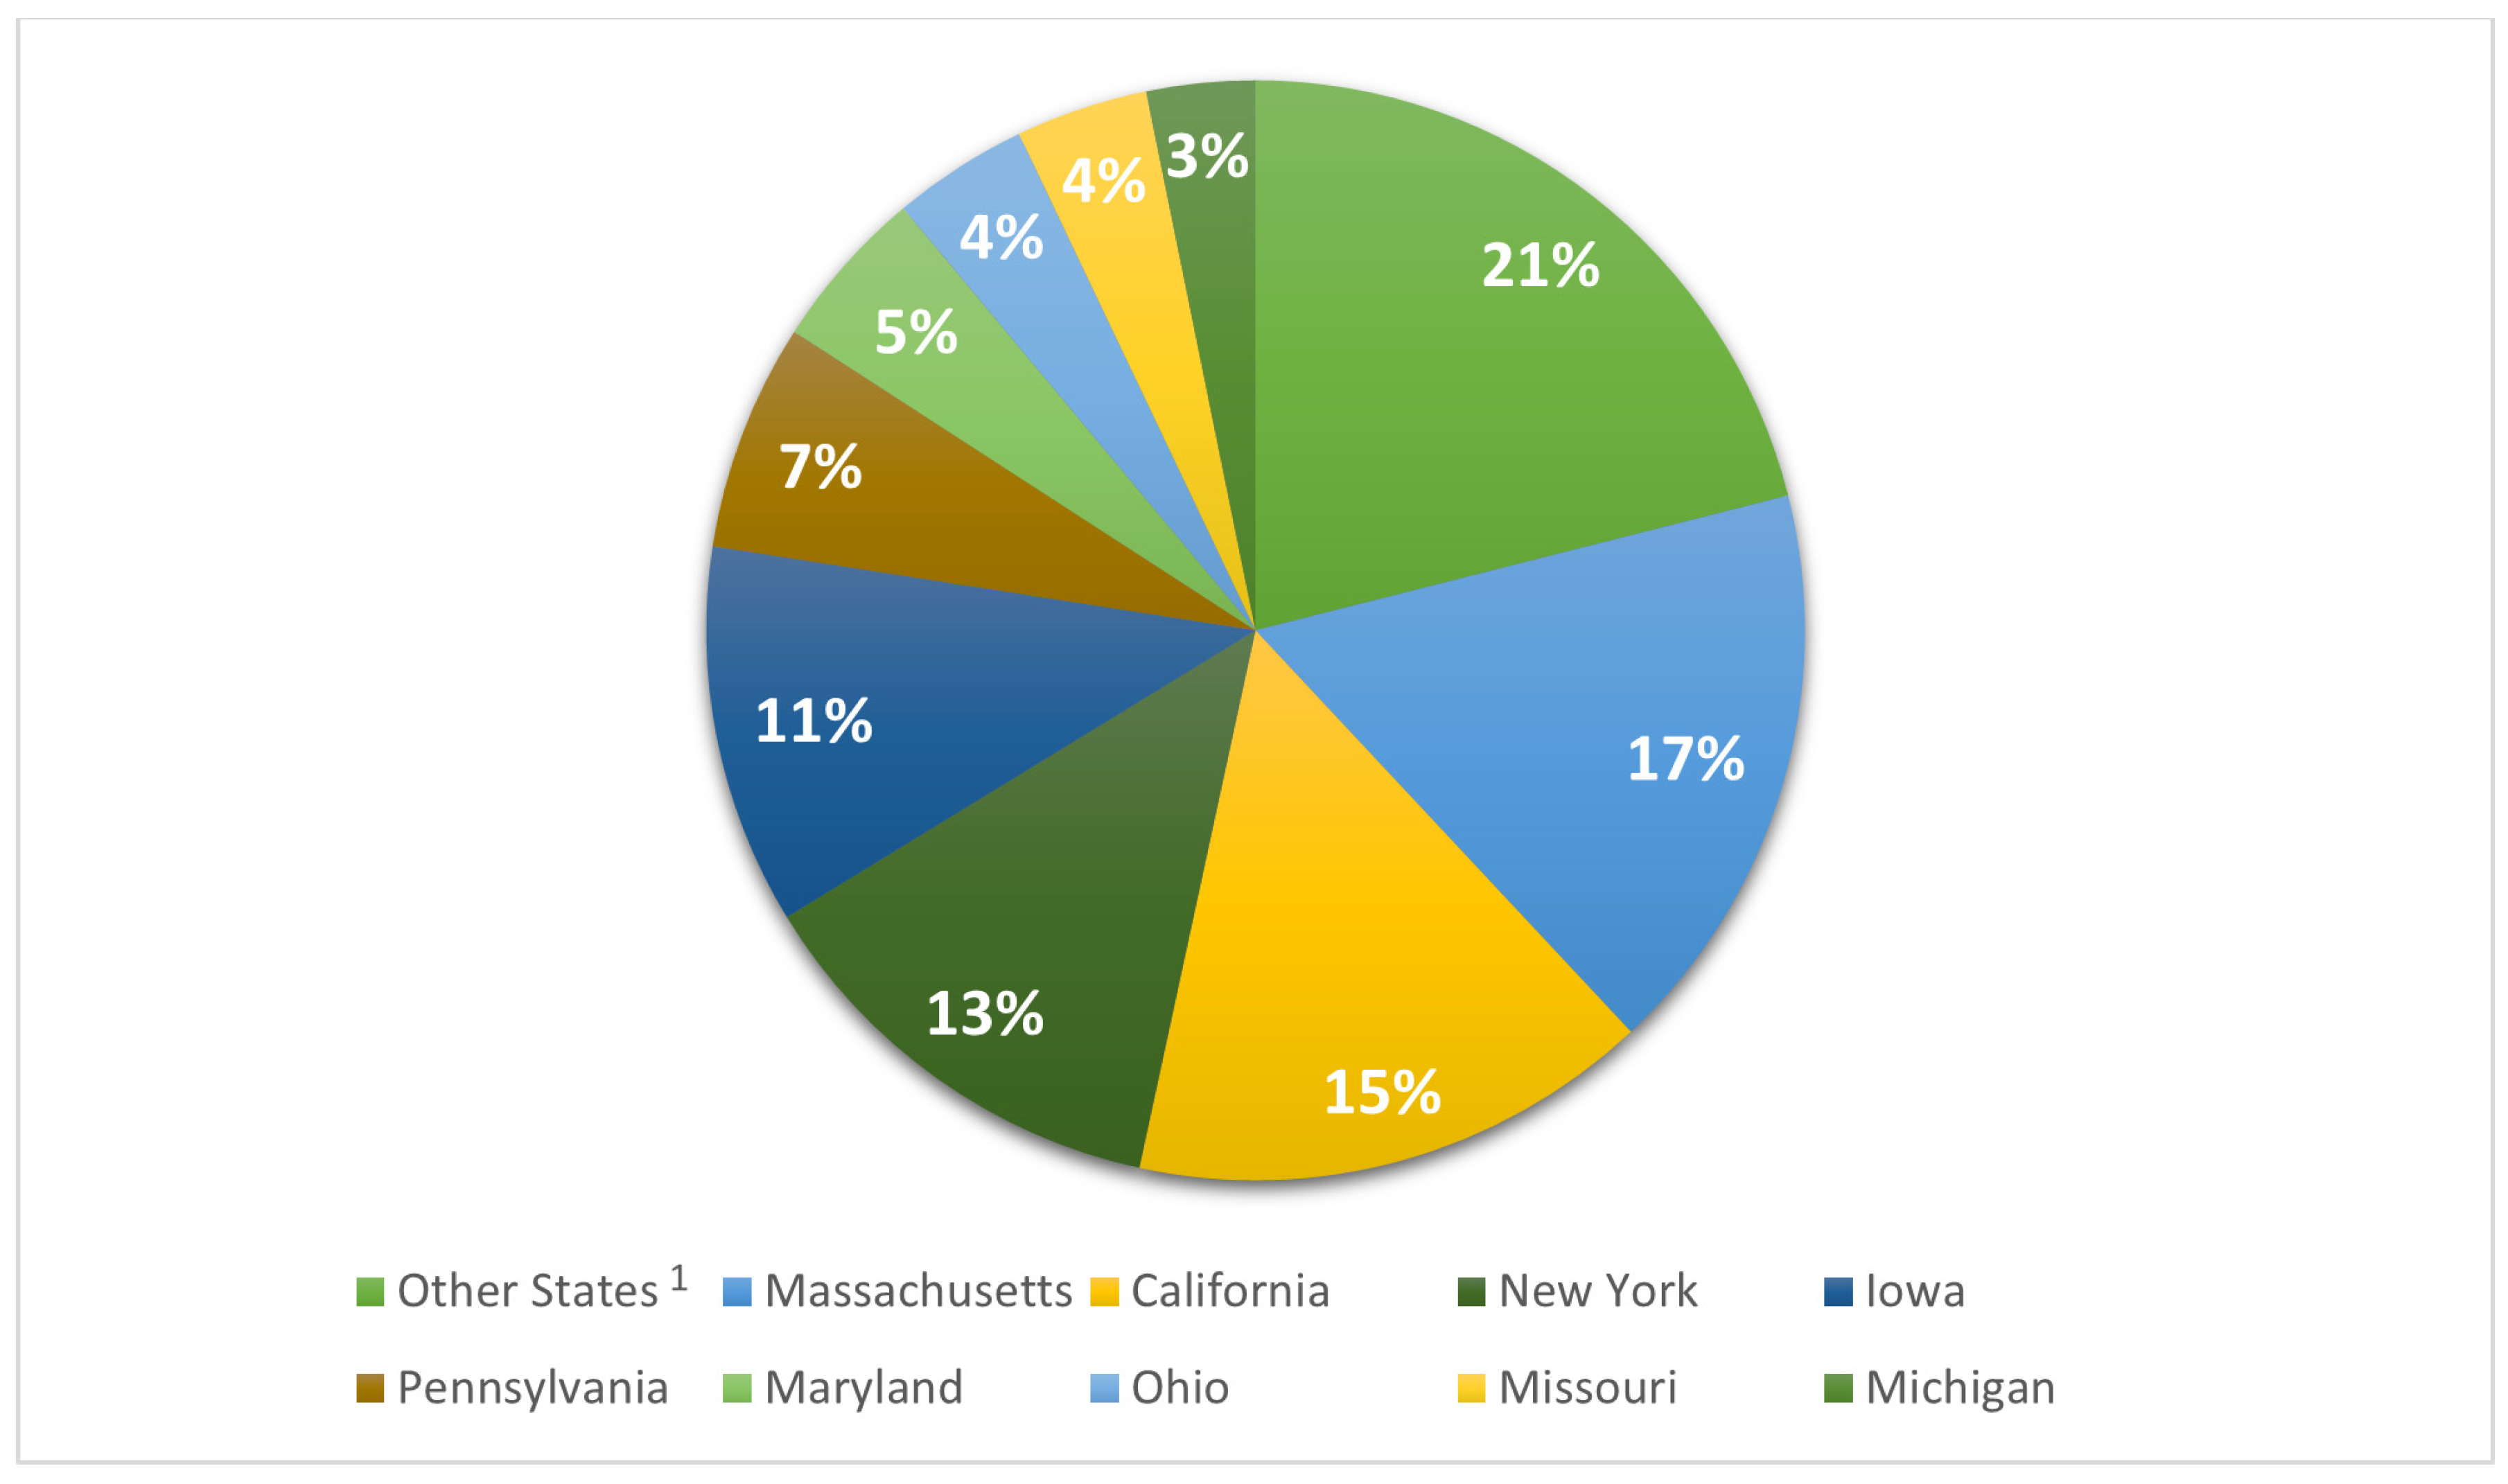
| State | NHA 1 | HUA | UNK | Total | |
|---|---|---|---|---|---|
| Other States 2 | n % | 243 a,3 (12.8) | 1153 b (60.7) | 503 c (26.5) | 1899 (100) |
| Massachusetts | n % | 0 a (0.0) | 1239 b (81) | 291 c (19) | 1530 (100) |
| California | n % | 0 a (0.0) | 829 b (59.7) | 559 c (40.3) | 1388 (100) |
| New York | n % | 74 a (6.4) | 1068 a (92.1) | 18 b (1.6) | 1160 (100) |
| Iowa | n % | 0 a (0.0) | 1003 b (99.6) | 4 a (0.4) | 1007 (100) |
| Pennsylvania | n % | 2 a (0.3) | 593 b (98.5) | 7 a (1.2) | 602 (100) |
| Maryland | n % | 121 a (28.2) | 282 b (65.7) | 26 c (6.1) | 429 (100) |
| Ohio | n % | 0 a (0.0) | 344 b (94.8) | 19 c (5.2) | 363 (100) |
| Missouri | n % | 0 a (0.0) | 352 b (100) | 0 a (0.0) | 352 (100) |
| Michigan | n % | 3 a (1.1) | 270 b (95.1) | 11 a (3.9) | 284 (100) |
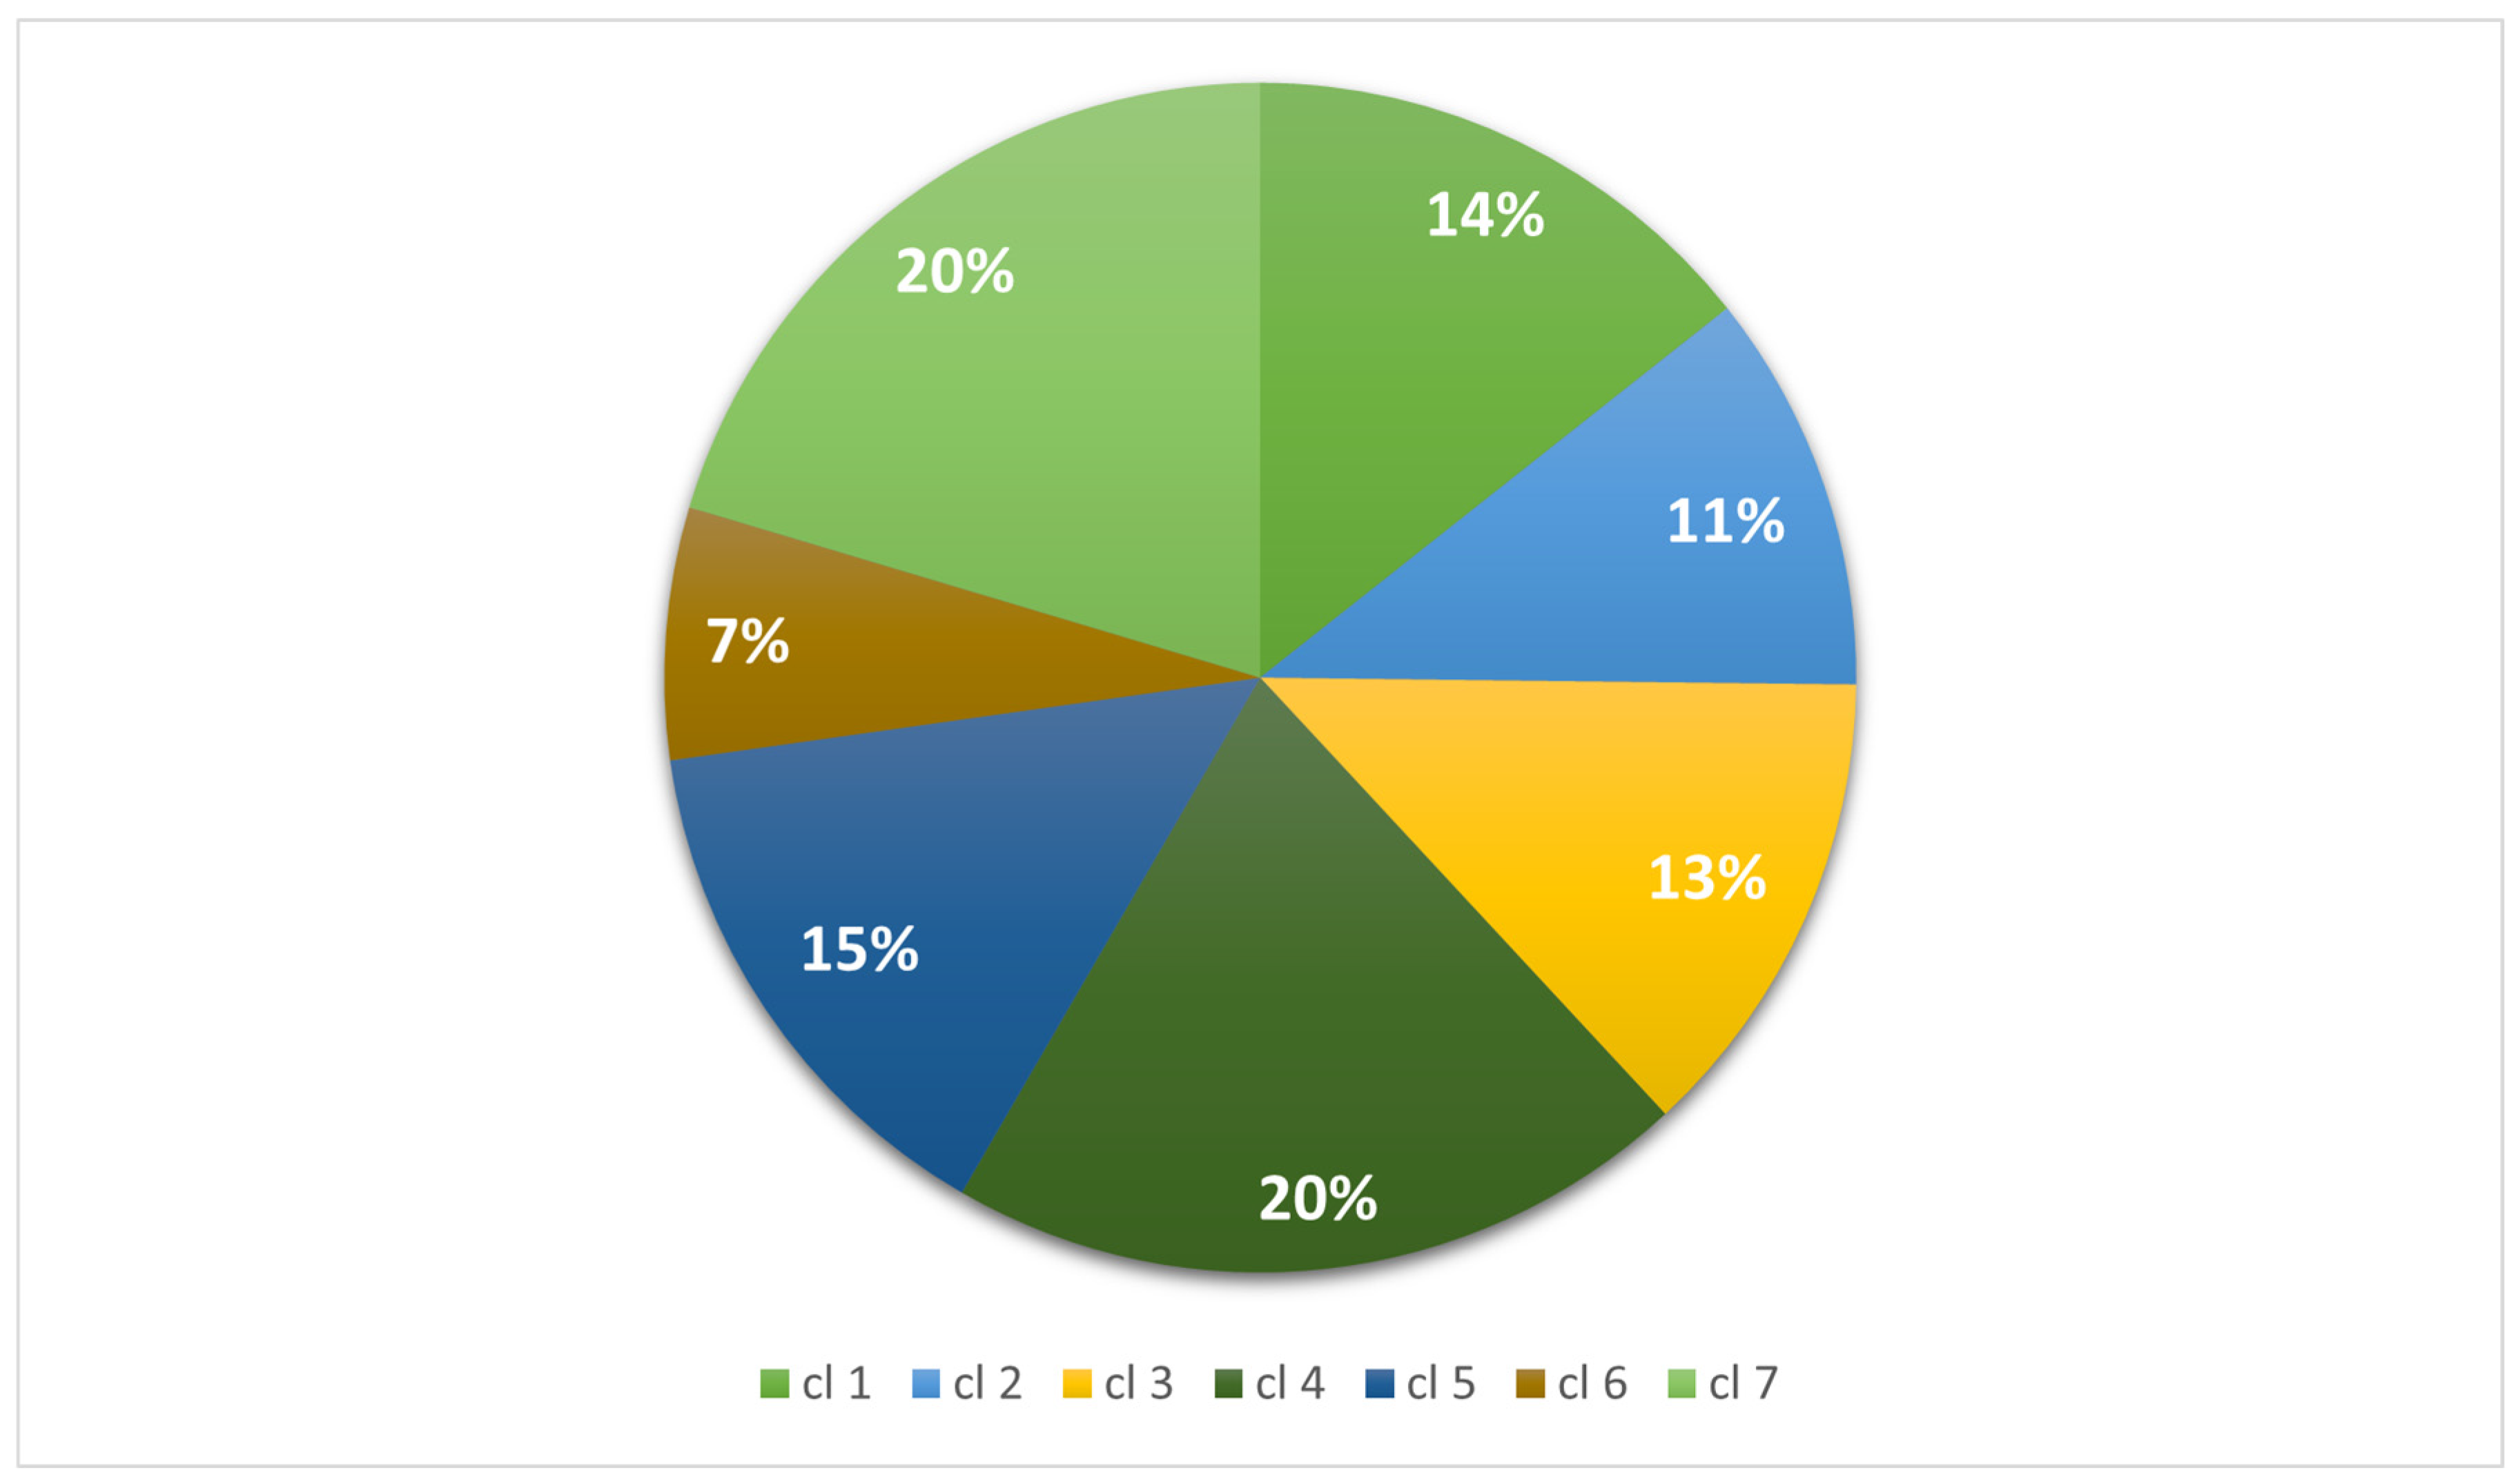
| Geographical Region | Cluster 1 n (%) | Cluster 2 n (%) | Cluster 3 n (%) | Cluster 4 n (%) | Cluster 5 n (%) | Cluster 6 n (%) | Cluster 7 n (%) |
|---|---|---|---|---|---|---|---|
| North America | 456 e,1 (12.1) | 977 c (34.1) | 651 c (19.1) | 3471 f (64.9) | 2802 f (73.5) | 59 f (3.3) | 839 e (15.6) |
| Europe | 2034 b (53.7) | 1153 a (40.3) | 1138 d (33.3) | 933 a (17.5) | 331 d (8.7) | 327 d (18.1) | 2228 a (41.4) |
| Other Asia 2 | 229 a (6.0) | 193 b (6.7) | 225 c (6.6) | 236 b,d (4.4) | 255 a (6.7) | 1019 c (56.2) | 449 d (8.3) |
| China | 622 b (16.4) | 159 b (5.5) | 468 b (13.7) | 359 e (6.7) | 28 b (0.7) | 38 b (2.1) | 787 b (14.6) |
| Oceania | 335 c (8.8) | 122 b (4.3) | 401 a (11.7) | 131 c,d (2.4) | 43 e (1.1) | 33 b (1.8) | 675 c (12.5) |
| South America | 38 a (1.0) | 127 b,c (4.4) | 344 c (10.1) | 136 a,b,c,d (2.5) | 289 e (7.6) | 256 e (14.2) | 204 d (3.8) |
| Africa | 75 a (2.0) | 136 a (4.7) | 188 a,b (5.5) | 84 a,b,c,d (1.6) | 66 a (1.7) | 77 a (4.3) | 204 a (3.8) |
| Total | 3789 (100) | 2867 (100) | 3415 (100) | 5350 (100) | 3814 (100) | 1809 (100) | 5386 (100) |
| State | Cluster 1 n (%) | Cluster 2 n (%) | Cluster 3 n (%) | Cluster 4 n (%) | Cluster 5 n (%) | Cluster 6 n (%) | Cluster 7 n (%) |
|---|---|---|---|---|---|---|---|
| United Kingdom | 1243 e,1 (61.1) | 377 b (32.6) | 150 d (13.2) | 273 e (29.3) | 11 b (3.3) | 53 b (16.2) | 105 f (4.7) |
| Other Europe 2 | 408 d (20.1) | 252 a (21.9) | 266 c (23.3) | 157 c,e (16.8) | 89 a (26.9) | 107 d (32.8) | 310 d (13.9) |
| Germany | 227 b (11.2) | 164 b (14.2) | 210 b,c (18.5) | 90 b (9.6) | 90 a (27.2) | 57 b (17.4) | 709 b (31.8) |
| Denmark | 90 a (4.4) | 153 a (13.3) | 289 a (25.4) | 12 a (1.3) | 61 a (18.4) | 3 a (0.9) | 320 a (14.4) |
| Netherlands | 7 c (0.3) | 82 b (7.1) | 102 b,c (9) | 0 d (0.0) | 1 b (0.3) | 0 a (0.0) | 562 c (25.2) |
| Switzerland | 11 c (0.5) | 56 b (4.9) | 56 b,d (4.9) | 364 f (39) | 41 a (12.4) | 23 b,d (7) | 48 e (2.2) |
| Italy | 48 a (2.4) | 69 a,b (6) | 65 b,c (5.7) | 37 b,c (4) | 38 a (11.5) | 84 c (25.7) | 174 a (7.8) |
| Total | 2034 (100) | 1153 (100) | 1138 (100) | 933 (100) | 331 (100) | 327 (100) | 2228 (100) |
| State | Cluster 1 n (%) | Cluster 2 n (%) | Cluster 3 n (%) | Cluster 4 n (%) | Cluster 5 n (%) | Cluster 6 n (%) | Cluster 7 n (%) |
|---|---|---|---|---|---|---|---|
| Other States 1 | 95 b,d,f,h,2 (20.9) | 290 a (35.2) | 253 d (39.9) | 496 c (14.4) | 387 b (13.8) | 13 a,b,c (22.7) | 365 b (46.1) |
| Massachusetts | 15 i (3.3) | 7 g (0.8) | 18 a (2.8) | 1191 b (34.4) | 268 b (9.6) | 1 c (1.8) | 30 a,b,c (3.8) |
| California | 87 a,b,c,d,e,f,g (19.1) | 170 a,b (20.6) | 10 a (1.6) | 587 a (17) | 492 a (17.5) | 20 a (35.1) | 22 a (2.8) |
| New York | 101 c,g (22.2) | 122 a,b,c (14.8) | 97 b (15.3) | 114 e (3.3) | 661 c (23.6) | 13 a,b (22.7) | 52 c (6.6) |
| Iowa | 31 h (6.8) | 90 b,c,d,e,f (10.9) | 78 b (12.3) | 402 a (11.6) | 227 b (8.1) | 1 b,c (1.8) | 178 b (22.5) |
| Pennsylvania | 54 a,c,e,g (11.9) | 37 c,d,e,f (4.5) | 36 b (5.7) | 231 a (6.7) | 221 a (7.9) | 5 a,b,c (8.8) | 18 a,c (2.3) |
| Maryland | 35 e,f,g (7.7) | 18 e,f (2.2) | 21 b (3.3) | 85 c (2.5) | 251 c (9) | 3 a,b,c (5.3) | 16 a,c (2) |
| Ohio | 11 b,d,f,h,i (2.4) | 32 a,b,c,d,e,f (3.9) | 19 b (3) | 143 a (4.1) | 122 a (4.4) | 0 a,b,c (0.0) | 36 d (4.5) |
| Missouri | 9 d,h,i (2) | 46 a,b (5.6) | 86 c (13.6) | 20 e (0.6) | 120 a (4.3) | 1 a,b,c (1.8) | 70 b (8.8) |
| Michigan | 17 a,b,c,d,e,f,g,h (3.7) | 12 d,f (1.5) | 16 b (2.5) | 185 d (5.4) | 49 b (1.8) | 0 a,b,c (0.0) | 5 a,c (0.6) |
| Total | 455 (100) | 824 (100) | 634 (100) | 3454 (100) | 2798 (100) | 57 (100) | 792 (100) |
| Geographical Region | Cluster 1 n (%) | Cluster 2 n (%) | Cluster 3 n (%) | Cluster 4 n (%) | Cluster 5 n (%) | Cluster 6 n (%) | Cluster 7 n (%) |
|---|---|---|---|---|---|---|---|
| North America | 344 a,1 (14.7) | 631 a (39.6) | 508 d (25.5) | 2824 d (76) | 2222 e (76.7) | 49 b (3.3) | 612 d (23.3) |
| Europe | 1165 f (49.6) | 601 d (37.7) | 481 b (24.3) | 331 a (8.9) | 157 c (5.4) | 95 d (6.4) | 611 c (23.3) |
| Other Asia 2 | 161 c (6.8) | 43 c (2.7) | 37 c (1.9) | 187 a,c (5) | 141 a (4.9) | 989 e (66.7) | 274 c (10.4) |
| China | 328 d (13.9) | 56 a,b (3.5) | 89 b (4.5) | 109 c (2.9) | 5 b (0.2) | 4 b,c (0.3) | 211 a (8) |
| Oceania | 288 e (12.2) | 83 b (5.2) | 386 a (19.5) | 87 b (2.4) | 42 c (1.4) | 28 c,d (1.9) | 558 b (21.2) |
| South America | 37 b (1.6) | 121 a (7.6) | 340 a (17.1) | 133 a,c (3.6) | 287 d (9.9) | 250 f (16.9) | 201 c (7.7) |
| Africa | 29 a,b,c,d (1.2) | 59 a (3.7) | 142 a (7.2) | 45 a,b,c (1.2) | 43 a (1.5) | 67 a (4.5) | 160 a (6.1) |
| Total | 2352 (100) | 1594 (100) | 1983 (100) | 3716 (100) | 2897 (100) | 1482 (100) | 2627 (100) |
| State | Cluster 1 n (%) | Cluster 2 n (%) | Cluster 3 n (%) | Cluster 4 n (%) | Cluster 5 n (%) | Cluster 6 n (%) | Cluster 7 n (%) |
|---|---|---|---|---|---|---|---|
| United Kingdom | 880 e,1 (75.5) | 244 b (40.6) | 39 f (8.1) | 217 g (65.7) | 7 c (4.5) | 25 a,c (26.3) | 28 c (4.6) |
| Other Europe 2 | 122 d (10.5) | 122 b,c (20.3) | 97 a,c,d,e (20.2) | 69 f,g (20.8) | 21 a (13.4) | 14 a,b,c (14.7) | 148 a (24.2) |
| Germany | 74 b (6.4) | 106 b,c (17.6) | 132 d,e (27.4) | 15 d,e (4.5) | 47 b (29.9) | 14 a,b,c (14.7) | 198 b (32.4) |
| Denmark | 53 a (4.5) | 9 a (1.5) | 37 a,b,c,d,e (7.7) | 2 a,b,c,d,e (0.6) | 14 a (8.9) | 2 a,b,c (2.1) | 36 a,b (5.9) |
| Netherlands | 7 c (0.6) | 72 c (12) | 97 b (20.2) | 0 b,e (0.0) | 0 c (0.0) | 0 c (0.0) | 106 b (17.3) |
| Switzerland | 5 b,c (0.4) | 6 a (1) | 31 a,b,c,d,e (6.4) | 8 a,c,d,f,g (2.4) | 41 d (26.1) | 7 b,d (7.4) | 17 a (2.8) |
| Italy | 24 b (2.1) | 42 a,b,c (7) | 48 c,e (10) | 20 c,f (6) | 27 b (17.2) | 33 d (34.8) | 78 a,b (12.8) |
| Total | 1165 (100) | 601 (100) | 481 (100) | 331 (100) | 157 (100) | 95 (100) | 611 (100) |
| State | Cluster 1 n (%) | Cluster 2 n (%) | Cluster 3 n (%) | Cluster 4 n (%) | Cluster 5 n (%) | Cluster 6 n (%) | Cluster 7 n (%) |
|---|---|---|---|---|---|---|---|
| Other States 1 | 56 b,d,f,g,h,i,j,k,2 (16.4) | 166 a (27) | 145 d (29.3) | 363 f (12.9) | 204 b,c (9.2.) | 10 a,b,c (20.8) | 209 b (34.7) |
| Massachusetts | 10 l (2.9) | 6 g (1) | 13 b (2.6) | 974 b (34.7) | 207 c (9.3) | 1 c (2.1) | 28 a (4.7) |
| California | 49 a,b,c,d,e,f,g,h,i,j,k (14.3) | 113 a,b (18.4) | 9 a,b (1.8) | 340 a (12.1) | 292 a (13.2) | 14 a (29.1) | 12 a (2) |
| New York | 96 c (28.1) | 107 a,b,c,e (17.4) | 85 c (17.1) | 112 e (4) | 616 d (27.7) | 13 a,b (27.1) | 39 a (6.5) |
| Iowa | 31 h,i,j,k (9) | 89 b,c,d,e,f (14.5) | 78 c (15.7) | 401 a (14.3) | 227 b (10.2) | 1 b,c (2.1) | 176 b (29.3) |
| Pennsylvania | 54 a,c,e (15.7) | 36 c,d,e,f (5.9) | 35 c (7) | 226 a,f (8) | 219 a (9.9) | 5 a,b,c (10.4) | 18 a (3) |
| Maryland | 22 a,b,c,d,e,f,g (6.4) | 13 f (2.1) | 11 a,c (2.2) | 56 c (2) | 166 d (7.5) | 3 a,b,c (6.3) | 11 a,c (1.8) |
| Ohio | 8 b,d,f,g,h,i,j,k,l (2.3) | 28 a,b,c,d,e,f (4.6) | 19 c (3.8) | 136 a,f (4.8) | 119 a (5.4) | 0 a,b,c (0.0) | 34 c (5.7) |
| Missouri | 9 d,g,i,k,l (2.6) | 46 a,b (7.5) | 86 e (17.3) | 20 e (0.7) | 120 a (5.4) | 1 a,b,c (2.1) | 70 b (11.6) |
| Michigan | 8 e,f,g,j,k,l (2.3) | 10 d,f (1.6) | 16 c,d (3.2) | 183 d (6.5) | 49 b,c (2.2) | 0 a,b,c (0.0) | 4 a (0.7) |
| Total | 343 (100) | 614 (100) | 497 (100) | 2811 (100) | 2219 (100) | 48 (100) | 601 (100) |
Disclaimer/Publisher’s Note: The statements, opinions and data contained in all publications are solely those of the individual author(s) and contributor(s) and not of MDPI and/or the editor(s). MDPI and/or the editor(s) disclaim responsibility for any injury to people or property resulting from any ideas, methods, instructions or products referred to in the content. |
© 2023 by the authors. Licensee MDPI, Basel, Switzerland. This article is an open access article distributed under the terms and conditions of the Creative Commons Attribution (CC BY) license (https://creativecommons.org/licenses/by/4.0/).
Share and Cite
Zaghen, F.; Sora, V.M.; Meroni, G.; Laterza, G.; Martino, P.A.; Soggiu, A.; Bonizzi, L.; Zecconi, A. Epidemiology of Antimicrobial Resistance Genes in Staphylococcus aureus Isolates from a Public Database from a One Health Perspective—Sample Origin and Geographical Distribution of Isolates. Antibiotics 2023, 12, 1654. https://doi.org/10.3390/antibiotics12121654
Zaghen F, Sora VM, Meroni G, Laterza G, Martino PA, Soggiu A, Bonizzi L, Zecconi A. Epidemiology of Antimicrobial Resistance Genes in Staphylococcus aureus Isolates from a Public Database from a One Health Perspective—Sample Origin and Geographical Distribution of Isolates. Antibiotics. 2023; 12(12):1654. https://doi.org/10.3390/antibiotics12121654
Chicago/Turabian StyleZaghen, Francesca, Valerio Massimo Sora, Gabriele Meroni, Giulia Laterza, Piera Anna Martino, Alessio Soggiu, Luigi Bonizzi, and Alfonso Zecconi. 2023. "Epidemiology of Antimicrobial Resistance Genes in Staphylococcus aureus Isolates from a Public Database from a One Health Perspective—Sample Origin and Geographical Distribution of Isolates" Antibiotics 12, no. 12: 1654. https://doi.org/10.3390/antibiotics12121654
APA StyleZaghen, F., Sora, V. M., Meroni, G., Laterza, G., Martino, P. A., Soggiu, A., Bonizzi, L., & Zecconi, A. (2023). Epidemiology of Antimicrobial Resistance Genes in Staphylococcus aureus Isolates from a Public Database from a One Health Perspective—Sample Origin and Geographical Distribution of Isolates. Antibiotics, 12(12), 1654. https://doi.org/10.3390/antibiotics12121654