
Ventilator-Associated Pneumonia, Multidrug-Resistant Bacteremia and Infection Control Interventions in an Intensive Care Unit: Analysis of Six-Year Time-Series Data

 ,
,  , , ,
, , ,  , ,
, ,  and
and
Abstract: Background
1. Introduction
2. Materials and Methods
2.1. Setting
2.2. Interventions
2.3. Outcomes
2.4. Data Collection
2.5. Diagnostic Criteria for VAP
2.6. Detection of Bacteremia and Microbial Resistance
2.7. Definitions
2.8. Statistical Analysis
3. Results
4. Discussion
5. Conclusions
Author Contributions
Funding
Institutional Review Board Statement
Informed Consent Statement
Data Availability Statement
Acknowledgments
Conflicts of Interest
References
- Torres, A.; Niederman, M.S.; Chastre, J.; Ewig, S.; Fernandez-Vandellos, P.; Hanberger, H.; Kollef, M.; Li Bassi, G.; Luna, C.M.; Martin-Loeches, I.; et al. International ERS/ESICM/ESCMID/ALAT guidelines for the management of hospital-acquired pneumonia and ventilator-associated pneumonia: Guidelines for the management of hospital-acquired pneumonia (HAP)/ventilator-associated pneumonia (VAP) of the European Respiratory Society (ERS), European Society of Intensive Care Medicine (ESICM), European Society of Clinical Microbiology and Infectious Diseases (ESCMID) and AsociacionLatinoamericana del Torax (ALAT). Eur. Respir. J. 2017, 50, 1700582. [Google Scholar] [PubMed]
- Safdar, N.; Dezfulian, C.; Collard, H.R.; Saint, S. Clinical and economic consequences of ventilator-associated pneumonia: A systematic review. Crit. Care Med. 2005, 33, 2184–2193. [Google Scholar] [CrossRef] [PubMed]
- Ego, A.; Preiser, J.C.; Vincent, J.L. Impact of diagnostic criteria on the incidence of ventilator-associated pneumonia. Chest 2015, 147, 347–355. [Google Scholar] [CrossRef] [PubMed]
- Shorr, A.F.; Chan, C.M.; Zilberberg, M.D. Diagnostics and epidemiology in ventilator-associated pneumonia. Ther. Adv. Respir. Dis. 2011, 5, 121–130. [Google Scholar] [CrossRef]
- Dudeck, M.A.; Weiner, L.M.; Allen-Bridson, K.; Malpiedi, P.J.; Peterson, K.D.; Pollock, D.A.; Sievert, D.M.; Edwards, J.R. National Healthcare Safety Network (NHSN) report, data summary for 2012, Device-associated module. Am. J. Infect. Control 2013, 41, 1148–1166. [Google Scholar] [CrossRef]
- Rosenthal, V.D.; Bat-Erdene, I.; Gupta, D.; Belkebir, S.; Rajhans, P.; Zand, F.; Myatra, S.N.; Afeef, M.; Tanzi, V.L.; Muralidharan, S.; et al. International Nosocomial Infection Control Consortium. International Nosocomial Infection Control Consortium (INICC) report, data summary of 45 countries for 2012–2017: Device-associated module. Am. J. Infect. Control 2020, 48, 423–432. [Google Scholar] [CrossRef]
- Koulenti, D.; Tsigou, E.; Rello, J. Nosocomial pneumonia in 27 ICUs in Europe: Perspectives from the EU-VAP/CAP study. Eur. J. Clin. Microbiol. Infect. Dis. 2017, 36, 1999–2006. [Google Scholar] [CrossRef]
- Park, D.R. The microbiology of ventilator-associated pneumonia. Respir. Care 2005, 50, 742–763; discussion 763–765. [Google Scholar]
- Schuts, E.C.; Hulscher, M.E.J.L.; Mouton, J.W.; Verduin, C.M.; Stuart, J.W.T.C.; Overdiek, H.W.P.M.; van der Linden, P.D.; Natsch, S.; Hertogh, C.M.P.M.; Wolfs, T.F.W.; et al. Current evidence on hospital antimicrobial stewardship objectives: A systematic review and meta-analysis. Lancet Infect. Dis. 2016, 16, 847–856. [Google Scholar] [CrossRef]
- Baur, D.; Gladstone, B.P.; Burkert, F.; Carrara, E.; Foschi, F.; Döbele, S.; Tacconelli, E. Effect of antibiotic stewardship on the incidence of infection and colonisation with antibiotic-resistant bacteria and Clostridium difficile infection: A systematic review and meta-analysis. Lancet Infect. Dis. 2017, 17, 990–1001. [Google Scholar] [CrossRef]
- Talbot, T.R.; Carr, D.; Parmley, C.L.; Martin, B.J.; Gray, B.; Ambrose, A.; Starmer, J. Sustained Reduction of Ventilator-Associated Pneumonia Rates Using Real-Time Course Correction with a Ventilator Bundle Compliance Dashboard. Infect. Control Hosp. Epidemiol. 2015, 36, 1261–1267. [Google Scholar] [CrossRef]
- Fortaleza, C.M.C.B.; Filho, S.P.F.; Silva, M.O.; Queiroz, S.M.; Cavalcante, R.S. Sustained reduction of healthcare-associated infections after the introduction of a bundle for prevention of ventilator-associated pneumonia in medical-surgical intensive care units. Braz. J. Infect. Dis. 2020, 24, 373–379. [Google Scholar] [CrossRef]
- Osman, S.; Al Talhi, Y.M.; Al Dabbagh, M.; Baksh, M.; Osman, M.; Azzam, M. The incidence of ventilator-associated pneumonia (VAP) in a tertiary-care center: Comparison between pre- and post-VAP prevention bundle. J. Infect. Public Health 2020, 13, 552–557. [Google Scholar] [CrossRef]
- National Healthcare Safety Network. Bloodstream Infection Event (Central Line-Associated Bloodstream Infection and Non-Central Line Associated Bloodstream Infection). Available online: https://www.cdc.gov/nhsn/pdfs/pscmanual/4psc_clabscurrent.pdf (accessed on 3 June 2022).
- Hortal, J.; Muñoz, P.; Cuerpo, G.; Litvan, H.; Rosseel, P.M.; Bouza, E. European Study Group on Nosocomial Infections; European Workgroup ofCardiothoracic Intensivists. Ventilator-associated pneumonia in patients undergoing major heart surgery: An incidence study in Europe. Crit. Care 2009, 13, R80. [Google Scholar] [CrossRef]
- Cooke, J.P. Inflammation and its role in regeneration and repair—A caution for novel anti-inflammatory therapies. Circ. Res. 2019, 124, 1166–1168. [Google Scholar] [CrossRef]
- Levin, B.R.; Baquero, F.; Ankomah, P.; McCall, I.C. Phagocytes, Antibiotics, and Self-Limiting Bacterial Infections. Trends Microbiol. 2017, 25, 878–892. [Google Scholar] [CrossRef]
- Levin, B.R.; Antia, R. Why we don’t get sick: The within-host population dynamics of bacterial infections. Science 2001, 292, 1112–1115. [Google Scholar] [CrossRef]
- Cunliffe, J. Intentional pathogen killing–or denial of substrate? Scand. J. Immunol. 2007, 66, 604–609. [Google Scholar] [CrossRef]
- Humphries, D.L.; Scott, M.E.; Vermund, S.H. Pathways linking nutritional status and infectious disease. In Nutrition and Infectious Disease: Shifting the Clinical Paradigm; Humphries, D.L., Scott, M.E., Vermund, S.H., Eds.; Humana Press: Totowa, NJ, USA, 2020; pp. 4–5. [Google Scholar]
- Arabi, Y.M.; Reintam, B.A.; Preiser, J.C. Less is more in nutrition: Critically ill patients are starving but not hungry. Intensive Care Med. 2019, 45, 1629–1631. [Google Scholar] [CrossRef]
- Wu, D.; Wu, C.; Zhang, S.; Zhong, Y. Risk Factors of Ventilator-Associated Pneumonia in Critically III Patients. Front. Pharmacol. 2019, 10, 482. [Google Scholar] [CrossRef]
- Kalil, A.C.; Metersky, M.L.; Klompas, M.; Muscedere, J.; Sweeney, D.A.; Palmer, L.B.; Napolitano, L.M.; O’Grady, N.P.; Bartlett, J.G.; Carratalà, J.; et al. Management of Adults with Hospital-acquired and Ventilator-associated Pneumonia: 2016 Clinical Practice Guidelines by the Infectious Diseases Society of America and the American Thoracic Society. Clin. Infect. Dis. 2016, 63, e61–e111. [Google Scholar] [CrossRef] [PubMed]
- Campogiani, L.; Tejada, S.; Ferreira-Coimbra, J.; Restrepo, M.I.; Rello, J. Evidence supporting recommendations from international guidelines on treatment, diagnosis, and prevention of HAP and VAP in adults. Eur. J. Clin. Microbiol. Infect. Dis. 2020, 39, 483–491. [Google Scholar] [CrossRef] [PubMed]
- Dicks, K.V.; Lofgren, E.; Lewis, S.S.; Moehring, R.W.; Sexton, D.J.; Anderson, D.J. A Multicenter Pragmatic Interrupted Time Series Analysis of Chlorhexidine Gluconate Bathing in Community Hospital Intensive Care Units. Infect. Control Hosp. Epidemiol. 2016, 37, 791–797. [Google Scholar] [CrossRef] [PubMed]
- Su, K.C.; Kou, Y.R.; Lin, F.C.; Wu, C.H.; Feng, J.Y.; Huang, S.F.; Shiung, T.F.; Chung, K.C.; Tung, Y.H.; Yang, K.Y.; et al. A simplified prevention bundle with dual hand hygiene audit reduces early-onset ventilator-associated pneumonia in cardiovascular surgery units: An interrupted time-series analysis. PLoS ONE 2017, 12, e0182252. [Google Scholar] [CrossRef] [PubMed]
- Roberts, K.L.; Micek, S.T.; Juang, P.; Kollef, M.H. Controversies and advances in the management of ventilator associated pneumonia. Expert Rev. Respir. Med. 2017, 11, 875–884. [Google Scholar] [CrossRef] [PubMed]
- Cillóniz, C.; Dominedò, C.; Torres, A. An overview of guidelines for the management of hospital-acquired and ventilator-associated pneumonia caused by multidrug-resistant Gram-negative bacteria. Curr.Opin. Infect. Dis. 2019, 32, 656–662. [Google Scholar] [CrossRef]
- Maltezou, H.C.; Kontopidou, F.; Dedoukou, X.; Katerelos, P.; Gourgoulis, G.M.; Tsonou, P.; Maragos, A.; Gargalianos, P.; Gikas, A.; Gogos, C.; et al. Working Group for the National Action Plan to Combat Infections due to Carbapenem-Resistant, Gram-Negative Pathogens in Acute-Care Hospitals in Greece. J. Glob.Antimicrob. Resist. 2014, 2, 11–16. [Google Scholar] [CrossRef]
- Suetens, C.; Latour, K.; Kärki, T.; Ricchizzi, E.; Kinross, P.; Moro, M.L.; Jans, B.; Hopkins, S.; Hansen, S.; Lyytikäinen, O.; et al. Prevalence of healthcare-associated infections, estimated incidence and composite antimicrobial resistance index in acute care hospitals and long-term care facilities: Results from two European point prevalence surveys, 2016 to 2017. Eurosurveillance 2018, 23, 1800516. [Google Scholar] [CrossRef]
- Haessler, S.; Martin, E.M.; Scales, M.E.; Kang, L.; Doll, M.; Stevens, M.P.; Uslan, D.Z.; Pryor, R.; Edmond, M.B.; Godbout, E.; et al. Stopping the routine use of contact precautions for management of MRSA and VRE at three academic medical centers: An interrupted time series analysis. Am. J. Infect. Control 2020, 48, 1466–1473. [Google Scholar] [CrossRef]
- AlMohanna, Z.; Snavely, A.C.; Viviano, J.P.; Bischoff, W.E. Long-term Impact of Contact Precautions Cessation for Methicillin-Resistant Staphylococcus Aureus (MRSA). Am. J. Infect. Control 2022, 50, 336–341. [Google Scholar] [CrossRef]
- Perneger, T.V. What’s wrong with Bonferroni adjustments. BMJ 1998, 316, 1236–1238. [Google Scholar] [CrossRef]

| Admissions (n) | Trauma Patients (n) | CTS Patients (n) | %CTS Patients/Admissions | %(Trauma + CTS Patients)/Admissions | |
|---|---|---|---|---|---|
| 2013 | 905 | 23 | 659 | 72.82 | 75.36 |
| 2014 | 671 | 131 | 411 | 61.25 | 80.77 |
| 2015 | 737 | 12 | 313 | 42.47 | 44.10 |
| 2016 | 789 | 7 | 322 | 40.81 | 41.70 |
| 2017 | 783 | 9 | 215 | 27.46 | 28.61 |
| 2018 | 869 | 11 | 174 | 20.02 | 21.29 |
| 6-year | 4754 | 193 | 2094 | 44.05 | 48.11 |
| Admissions (n) | VP (n) | % VP/Admissions | Mean VD | VAP Rate/1000 VD | |
|---|---|---|---|---|---|
| 2013 | 905 | 688 | 76.02 | 2.83 | 7.08 |
| 2014 | 671 | 566 | 84.35 | 2.89 | 7.38 |
| 2015 | 737 | 352 | 47.76 | 3.73 | 5.33 |
| 2016 | 789 | 403 | 51.08 | 4.60 | 0.88 |
| 2017 | 783 | 514 | 65.64 | 4.19 | 1.39 |
| 2018 | 869 | 483 | 55.58 | 2.92 | 1.42 |
| 6-year | 4754 | 3006 | 63.23 | 3.53 | 3.27 |
| Time Trend | |||||
|---|---|---|---|---|---|
| ICU Interventions | EVSP January 2013 (95% CI) | EVEP December 2018 (95% CI) | p-Value | % Relative Change/Year (95% CI) | p-Value |
| 1.Isolations per 100 hospital admissions | |||||
| % isolations | 20.4(19.2 to 21.8) | 27.6 (24.1 to 31.4) | <0.001 | 14.35 (10.62 to 18.22) | <0.001 |
| up to 6/2017 | |||||
| −12.34 (−24.77 to 2.13) after 6/2017 | 0.091 | ||||
| 2.Hand disinfectant solutions use (L/1000 patient-days) | |||||
| Alcohol disinfectant sol | 98.0 | 83.2 | 0.286 | −2.50 | 0.286 |
| (80.9 to 115.1) | (68.5 to 97.9) | (−7.15 to 2.14) | |||
| Scrub disinfectant sol | 1.9 | 35.9 | 0.001 | 24.37 (18.64 to 30.10) | <0.001 |
| (7.4 to 11.3) | (17.7 to 54.2) | up to 8/2016 | |||
| −22.85 (−34.36 to −11.35) after 8/2016 | <0.001 | ||||
| All hand disinfectant sol | 117.0 | 179.3 | 0.001 | 10.53 | 0.001 |
| (97.3 to 136.7) | (157.8 to 200.9) | (4.56 to 16.50) | |||
| Time Trend | |||||
|---|---|---|---|---|---|
| Outcomes | EVSP January 2013 (95% CI) | EVEP December 2018 (95% CI) | p-Value | % Relative Change/Year (95% CI) | p-Value |
| 1. VAP rate | |||||
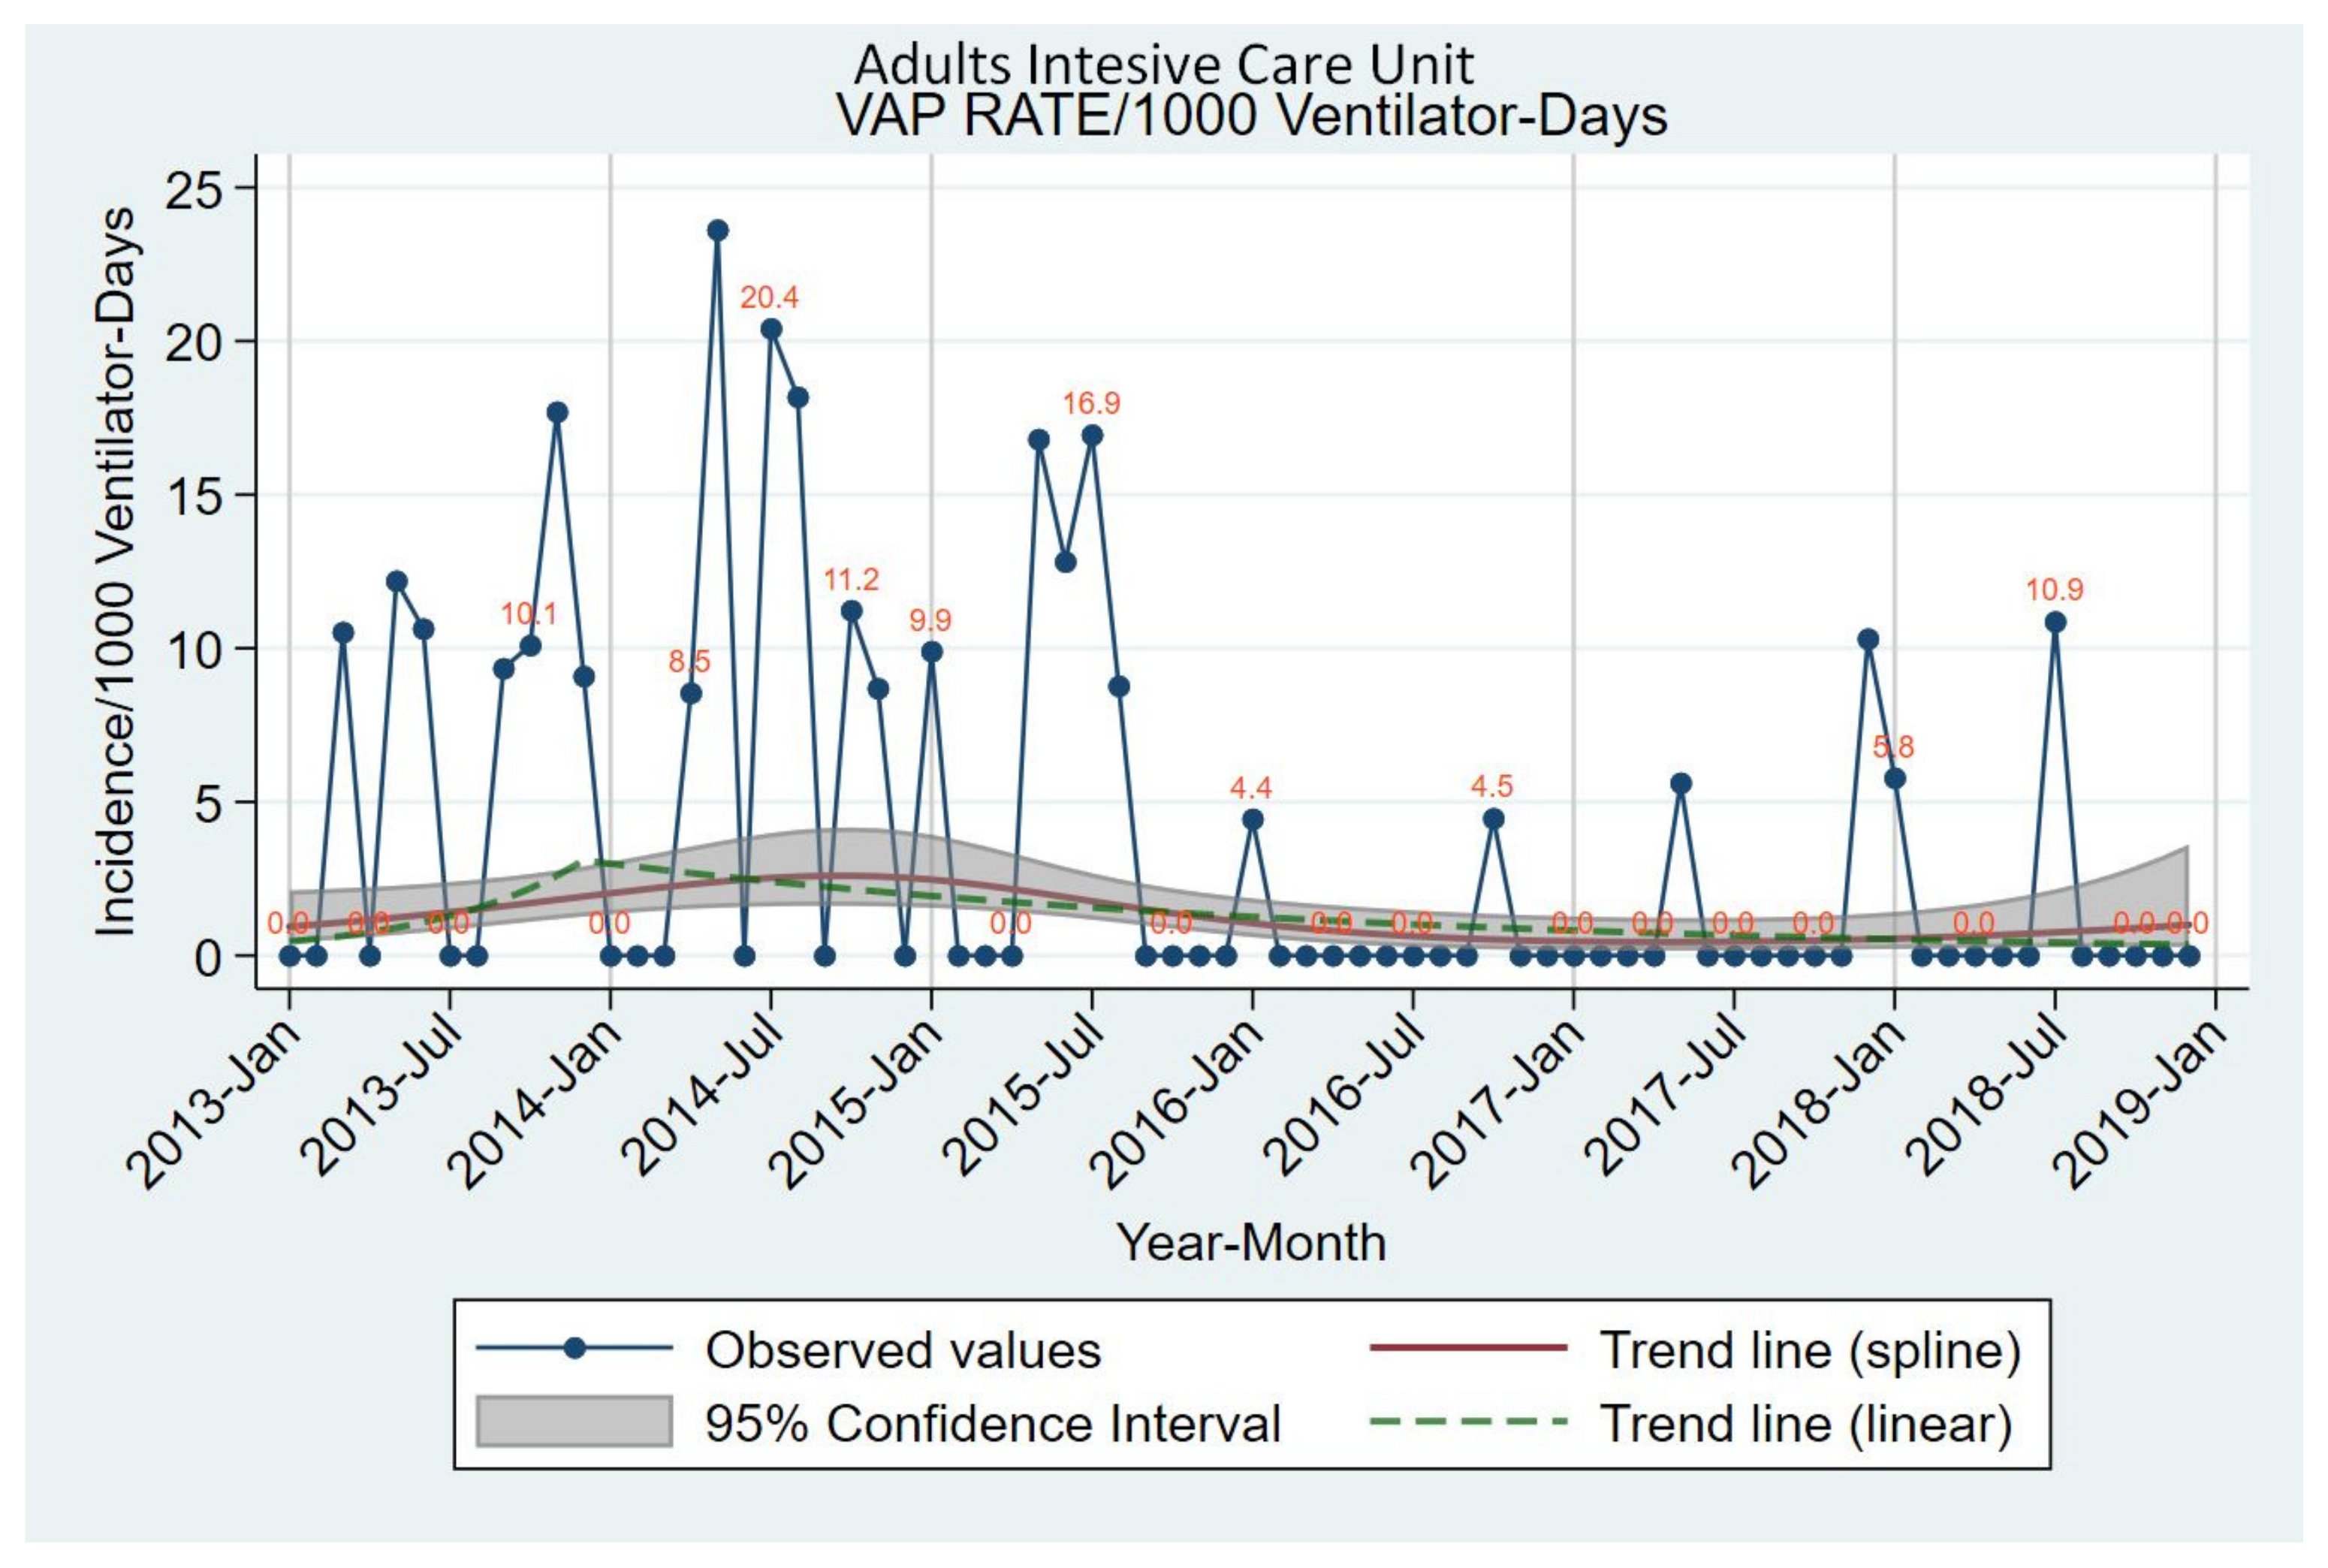
| Incidence of VAP/1000 ventilator-days | 0.4 (0.1 to 2.0) | 0.4 (0.1 to 1.3) | 0.775 | 721.72 (18.45 to 5600.63) up to 12/2013 | 0.090 |
| −35.12 (−53.52 to −9.41) after 12/2013 | 0.011 | ||||
| 2.Incidence of bacteremia/1000 patient-days | |||||
| Total bacteremia | 18.2 | 32.8 | <0.001 | −3.81 (−15.16 to 9.07) | 0.545 |
| (13.9 to 23.7) | (27.5 to 39.2) | up to 02/2016 | |||
| 28.57 (14.91 to 43.85) after 02/2016 | <0.001 | ||||
| Total MDR bacteremia | 1.9 | 2.3 | 0.678 | 34.51 (3.32 to 75.12) | 0.028 |
| (1.2 to 3.0) | (1.2 to 4.2) | up to 10/2015 | |||
| −18.86 (−38.09 to 6.34) after 10/2015 | 0.130 | ||||
| Total CR Gram (-) bacteremia | 2.5 | 3.3 | 0.392 | 4.91 (−5.99 to 17.07) | 0.392 |
| (1.7 to 3.5) | (2.1 to 5.1) | ||||
| Total MDR Gram (+) bacteremia | N/A | N/A | N/A | N/A | N/A |
| Total CR-Acbacteremia | 0.8 | 1.8 | 0.256 | −28.93 (−51.89 to 5.00) up to 01/2017 | 0.086 |
| (0.4 to 2.0) | (0.6 to 5.6) | 209.33 (46.70 to 552.27) after 01/2018 | 0.003 | ||
| Total CR-KlPn bacteremia | 0.3 | 0.5 | 0.635 | 137.77 (8.59 to 420.63) up to 01/2015 | 0.030 |
| (0.1 to 1.2) | (0.1 to 1.7) | −28.44 (−51.84 to 6.33) after 01/2015 | 0.098 | ||
| Total CR-PsA bacteremia | 0.9 | 0.9 | 0.909 | 1.25 (−18.13 to 25.21) | 0.909 |
| (0.4 to 1.8) | (0.4 to 2.1) | ||||
| VAP Rate: Correlation with Bacteremia and Type of ICU Patients | ||||||||
|---|---|---|---|---|---|---|---|---|
| ICU | Per (n) Unit | Month 0 | Month -1 | Month -2 | Month -3 | IRR | 95% C.I. | p-Value |
| Incidence of bacteremia/1000 patient-days | ||||||||
| Total bacteremia | n.s. | |||||||
| Total resistant Gram (+) &(−) | n.s. | |||||||
| Total CR Gram (-) | n.s. | |||||||
| Total CR-Ac | 1 | ◊ | 1.17 | (1.00, 1.36) | 0.045 | |||
| Total CR-KlPn | 1 | ◊ | 1.24 | (0.97, 1.57) | 0.086 | |||
| Total CR-PsA | n.s. | |||||||
| Number of ICU patients | ||||||||
| Cardiothoracic surgeries | 10 | ◊ | 3.46 | (2.71, 4.42) | <0.001 | |||
| Trauma patients | 10 | ◊ | 2.31 | (1.36, 3.94) | 0.002 | |||
| Cardiothoracic surgeries + Trauma patients | 10 | ◊ | 2.49 | (2.09, 2.96) | <0.001 | |||
| VAP: Correlation with Infection Control Interventions | ||||||||
|---|---|---|---|---|---|---|---|---|
| Infection Control Interventions | Per (n) Unit | Month 0 | Month -1 | Month -2 | Month -3 | IRR | 95% CI | p-Value |
| % isolations/admissions | 10 | ◊ | 0.52 | (0.27, 0.99) | 0.048 | |||
| L of alcohol disinfectant sol/1000 patient-days | 10 | ◊ | 0.92 | (0.83, 1.01) | 0.079 | |||
| L of scrub disinfectant sol/1000 patient-days | 10 | ◊ | 0.85 | (0.74, 0.98) | 0.028 | |||
| L of all hand disinfectant sol/1000 patient-days | 10 | ◊ | 0.40 | (0.18, 0.89) | 0.024 | |||
Publisher’s Note: MDPI stays neutral with regard to jurisdictional claims in published maps and institutional affiliations. |
© 2022 by the authors. Licensee MDPI, Basel, Switzerland. This article is an open access article distributed under the terms and conditions of the Creative Commons Attribution (CC BY) license (https://creativecommons.org/licenses/by/4.0/).
Share and Cite
Papanikolopoulou, A.; Maltezou, H.C.; Stoupis, A.; Pangalis, A.; Kouroumpetsis, C.; Chronopoulou, G.; Kalofissoudis, Y.; Kostares, E.; Boufidou, F.; Karalexi, M.; et al. Ventilator-Associated Pneumonia, Multidrug-Resistant Bacteremia and Infection Control Interventions in an Intensive Care Unit: Analysis of Six-Year Time-Series Data. Antibiotics 2022, 11, 1128. https://doi.org/10.3390/antibiotics11081128
Papanikolopoulou A, Maltezou HC, Stoupis A, Pangalis A, Kouroumpetsis C, Chronopoulou G, Kalofissoudis Y, Kostares E, Boufidou F, Karalexi M, et al. Ventilator-Associated Pneumonia, Multidrug-Resistant Bacteremia and Infection Control Interventions in an Intensive Care Unit: Analysis of Six-Year Time-Series Data. Antibiotics. 2022; 11(8):1128. https://doi.org/10.3390/antibiotics11081128
Chicago/Turabian StylePapanikolopoulou, Amalia, Helena C. Maltezou, Athina Stoupis, Anastasia Pangalis, Christos Kouroumpetsis, Genovefa Chronopoulou, Yannis Kalofissoudis, Evangelos Kostares, Fotini Boufidou, Maria Karalexi, and et al. 2022. "Ventilator-Associated Pneumonia, Multidrug-Resistant Bacteremia and Infection Control Interventions in an Intensive Care Unit: Analysis of Six-Year Time-Series Data" Antibiotics 11, no. 8: 1128. https://doi.org/10.3390/antibiotics11081128
APA StylePapanikolopoulou, A., Maltezou, H. C., Stoupis, A., Pangalis, A., Kouroumpetsis, C., Chronopoulou, G., Kalofissoudis, Y., Kostares, E., Boufidou, F., Karalexi, M., Koumaki, V., Pantazis, N., Tsakris, A., & Kantzanou, M. (2022). Ventilator-Associated Pneumonia, Multidrug-Resistant Bacteremia and Infection Control Interventions in an Intensive Care Unit: Analysis of Six-Year Time-Series Data. Antibiotics, 11(8), 1128. https://doi.org/10.3390/antibiotics11081128