1. Introduction
In an era of increasing antimicrobial resistance and a dwindling pipeline of novel antimicrobial drugs, the diligent use of the currently available antibiotics is more crucial than ever to preserve their activity. Rational dosing—balancing drug efficacy, safety and the emergence of resistance—poses a challenge particularly (i) for pathogens with reduced antibiotic susceptibility, including WHO critical priority pathogens like carbapenem-resistant
Pseudomonas aeruginosa; and (ii) in special patient populations who frequently display variable pharmacokinetic processes like drug distribution or elimination [
1,
2]. In an effort to improve antibiotic exposure and therapeutic success for the abovementioned scenarios, alternative off-label dosing strategies have been proposed. As a prominent example, extended (prolonged or continuous) infusions of beta-lactams and other antibiotics with ‘time-dependent’ bactericidal killing have been increasingly popular owing to previous preclinical and clinical evidence. While the carbapenem antibiotic meropenem, for instance, is approved as 15–30 min infusions, 3-h infusions up to continuous infusions are commonly used [
3,
4]. Furthermore, renal function is an important factor to consider in meropenem dosing [
3].
Clinical, randomised controlled trials are considered the most effective approach to support one therapy regimen for patients over another. For example, continuous infusion versus standard intermittent infusion is being investigated for carbapenems, inter alia in the BLING III study [
5]. Although providing a high level of evidence, large clinical studies of this type (
n = 7000 critically ill patients [
5]) are resource-intensive and challenging, particularly if inclusion criteria are difficult to meet, as in the case of rare multidrug-resistant pathogens. These studies are usually restricted to highly-selected patient populations, types of infection and/or dosing regimens, leaving diverse other patient groups without explicit dosing recommendations. Furthermore, measures of clinical outcome of bacterial infections are usually restricted to indirect surrogates of bacterial eradication and disease severity determined at one specific time point (e.g., mortality or clinical cure after 90 days). Owing to these hurdles, preclinical studies that enable the direct quantification of the bacterial burden during antibiotic exposure, and translation of their results to humans, have been gaining increasing relevance in assessing antibiotic dosing strategies for patients [
6].
Traditional approaches for preclinical-clinical translation and guidance on dosing regimens do not consider the time course of antibiotic exposure and response, but rather rely on summary measures like pharmacokinetic/pharmacodynamic (PK/PD) indices and targets [
6]. The PK/PD index most closely associated with the efficacy of an antibiotic, e.g.,
fT
>MIC (cumulative time that unbound antibiotic concentrations exceed the minimum inhibitory concentration MIC) or
fAUC/MIC (area under the unbound concentration-time curve/MIC), is typically determined in animals (e.g., murine infection) or in vitro time-kill experiments by determining the correlation between each index and the antibacterial response at one single time point (e.g., 24 h). The values of the PK/PD index, reflecting bacteriostasis, −1 log kill or −2 log kill at a certain time compared to start of antibiotic treatment, are referred to as PK/PD targets and constitute a common tool to select dosing regimens in humans (e.g., using probability of target attainment PTA analyses). However, this concept only allows for ‘black-and-white’ decisions (i.e., the PK/PD target is either met or not met given a certain dosing regimen) and lacks information on the development of antibiotic resistance [
6,
7]. Also, the MIC as the pharmacodynamic component in the PK/PD indices suffers from imprecision and represents bacterial susceptibility at merely one time point [
8]. Furthermore, previous evidence has indicated that the magnitude of PK/PD targets can be influenced by different factors including the design of the underlying PKPD studies, MIC value, type of infection, species, patient population, half-life of the antibiotic, and shape of the pharmacokinetic profile [
9]. For example, previous PKPD evidence on meropenem includes PK/PD targets of
fT
>MIC~20% (bacteriostasis in mice [
10]),
fT
>MIC~35–55% (1−log10 reduction of
P. aeruginosa [
11]),
fT
>MIC~40–45% (bactericidal activity in mice [
10]), T
>MIC ≥ 75% (febrile neutropenic patients [
12],
fT
>MIC = 100% (critically ill patients [
13]), up to
fC
min/MIC > 5 (patients with lower respiratory tract infections [
14]).
In contrast to the PK/PD index-based translational approach to inform human antibiotic dosing, model-based approaches allow for the consideration of the time course of bacterial dynamics [
15]. Semi-mechanistic models are usually built upon data of in vitro time-kill experiments investigating bacterial growth, killing and resistance development of bacterial isolates (including rare and/or multi-drug resistant strains) during exposure to either constant, static antibiotic concentrations, or dynamic concentrations changing over time, e.g., mimicking pharmacokinetic profiles of patients. A comprehensive review has recently summarised such PK/PD models for time courses of antibiotic effects published since 1963, together with strategies to describe bacterial growth, regrowth, drug effects and interactions [
16]. The developed models enable the prediction of continuous profiles of antibiotic concentrations (pharmacokinetics) and effects on the bacterial load (pharmacodynamics) over time, which were either previously measured in in vitro experiments, or represented yet untested scenarios. For instance, human pharmacokinetic profiles may be used to drive the outcome of the PKPD model and to explore in vitro-in vivo translation, i.e., the impact of pharmacokinetic profiles of specific patient populations on the bacteria given different dosing regimens. Hollow-fibre models have been increasingly used for this purpose, although also these experiments are usually limited to a few selected scenarios that often focus on the typical patient of a population of interest. Model-based approaches to characterise antibiotic PKPD have been widely used in research and are encouraged by regulatory agencies like the European Medicines Agency [
17].
The current study aimed to investigate the impact of the shape of human pharmacokinetic (concentration-time) profiles of meropenem on the bacterial dynamics (growth/killing over time) of P. aeruginosa given diverse patient-, infection site-, and pathogen-related characteristics using a semi-mechanistic PKPD model versus a time-collapsed PK/PD index-based approach. We further sought to assess the relative benefit of different dosing strategies (e.g., short, prolonged and continuous infusions) expected for these clinically relevant scenarios to identify efficacious dosing regimens for special patient populations and specific clinical conditions.
2. Results
Of the ten dosage schemes investigated (e.g., high/low-dose short, prolonged- and continuous-infusion regimens ± loading dose), the regimen identified as the most favourable for a scenario (i.e., resulting in the lowest total bacterial load B
tot or highest
fT
>MIC) differed depending on (i) whether the median or the P
0.95 profile of the population was assessed; (ii) the time of assessment (24 h or 8 h); and (iii) on the evaluated measure of efficacy (B
tot or
fT
>MIC). Comparisons of total bacterial load and
fT
>MIC given the different populations (
Table S1) dosing regimens, scenarios, times of assessment (24 h/8 h) and profiles (median/P
0.95) are presented graphically (
Figure 1: B
tot and
fT
>MIC at 24 h;
Figures S1 and S2: time courses of meropenem concentrations and bacterial load;
Figure S3: B
tot and
fT
>MIC at 8 h) and in tables (
Table 1: B
tot_P0.95 at 8 h and 24 h;
Table 2:
fT
>MIC_P0.95 at 8 h and 24 h;
Table S2: B
tot_median at 8 h and 24 h;
Table S3:
fT
>MIC_median at 8 h and 24 h).
Table 3 highlights the most favourable dosing regimens with respect to total bacterial load and
fT
>MIC (at 8 h and 24 h) based on plasma PKPD profiles (covering 95% of patients) for the diverse investigated scenarios.
Of the six diverse patient populations used to inform the pharmacokinetic component of the PKPD model (
Table S1), the median representative of neurosurgery patients [
18] exhibited the lowest meropenem concentrations given continuous infusion, followed by the median obese patient [
19], burns patient [
20], and the median profile of a mixed infected population (default scenario [
21]). Critically ill patients exhibited the highest trough concentrations (to be precise, the septic population without renal dysfunction [
22] displayed lower concentrations than the more diverse septic population [
23]). When assuming CLCR values of 30 mL/min and 250 mL/min (instead of the default value of 83 mL/min) for the general mixed population (Li et al. [
21]), overall highest and lowest concentration-time profiles were achieved compared to all other median population profiles. Differences in the pharmacokinetic (concentration-time) profile were naturally reflected by different shapes of the pharmacodynamic (bacterial load-time) profile and by different
fT
>MIC values. The following results focus on the resistant ARU552 strain unless stated otherwise.
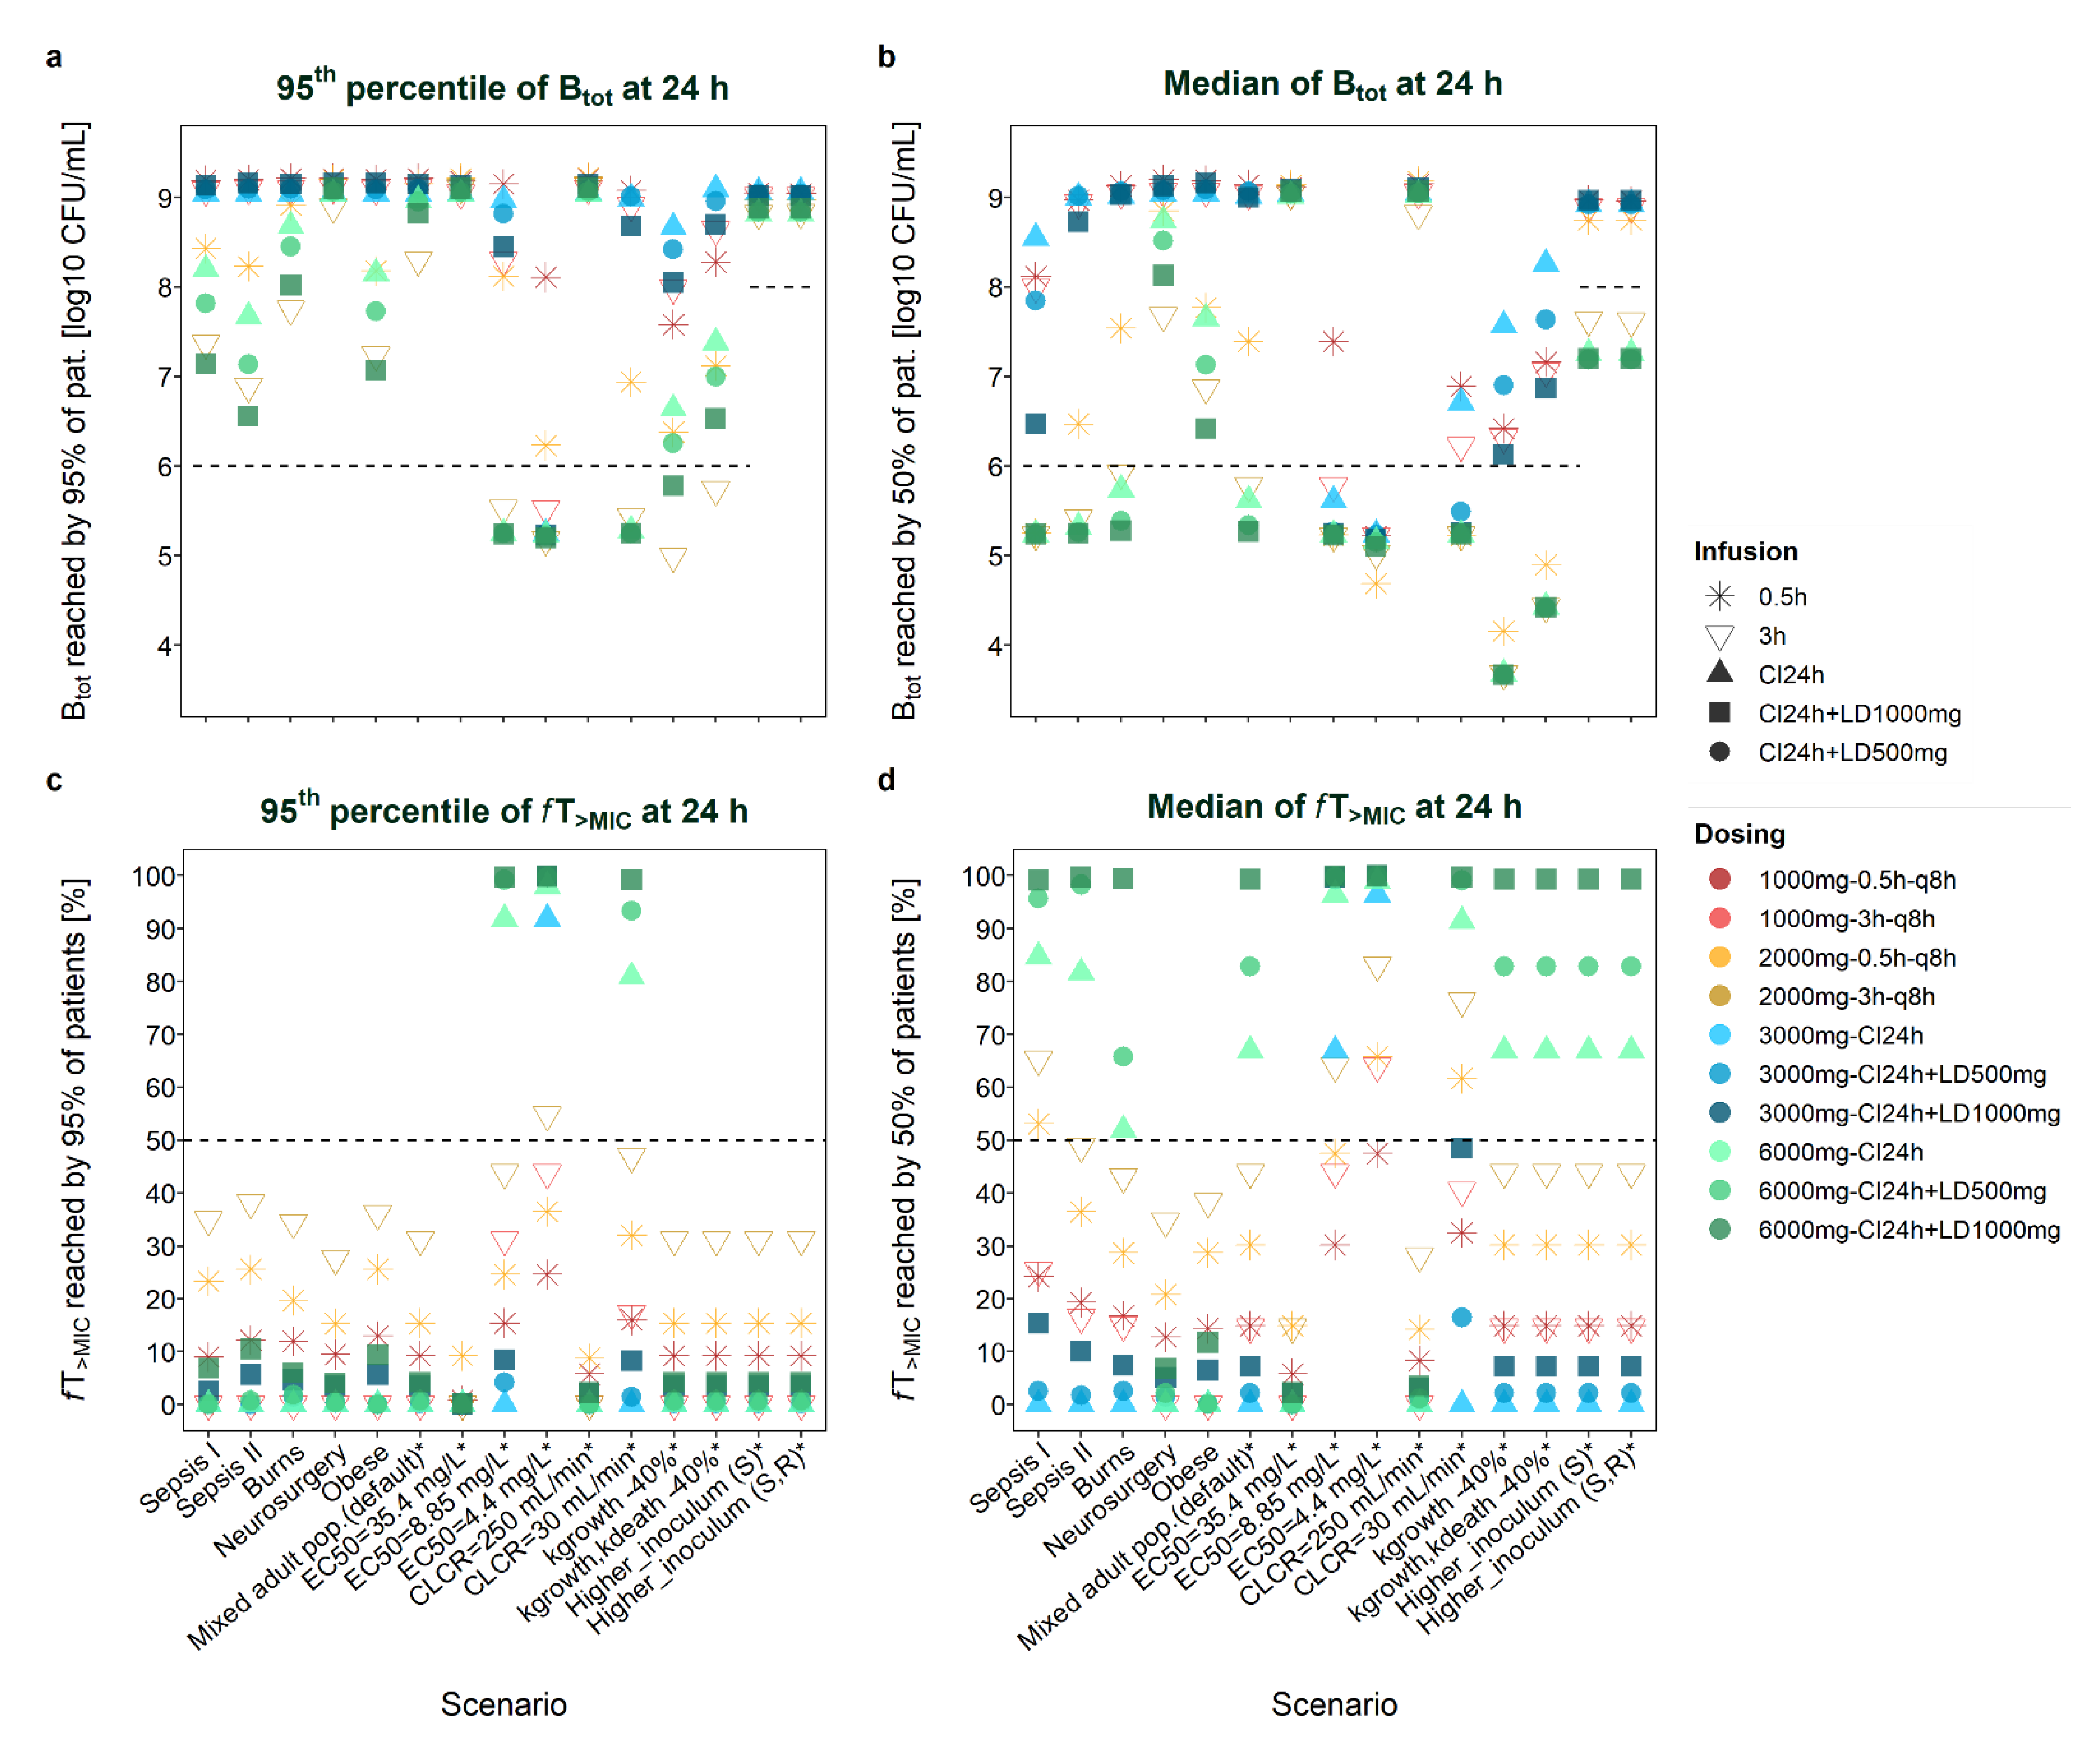
Figure 1.
Total bacterial load (B
tot,
a,
b) and
fT
>MIC (time that meropenem concentrations exceed the minimum inhibitory concentration, Figures (
c,
d)) reached by 95% (
a,
c) or 50% (
b,
d) of the patient (pat.) population at 24 h after start of therapy given different scenarios. Sepsis I: Delattre et al. [
23]; Sepsis II: Roberts et al. [
22] (no renal dysfunction); EC
50: drug concentration that produces 50% of E
max (maximum achievable kill rate constant); CLCR: creatinine clearance; kgrowth: rate constant of bacterial growth; kdeath: rate constant of natural bacterial death; higher inoculum: initial bacterial load of 8 log10 CFU/mL, either assumed to be susceptible or with an initial fraction in the resting state; scenarios marked with an asterisk * refer to a mixed adult population (default scenario; Li et al. [
21]); CI: continuous infusion; LD: loading dose; q8h: every 8 h.
Table 1.
Total bacterial load at 8 h and 24 h based on PKPD profiles covering 95% of patients.
Table 1.
Total bacterial load at 8 h and 24 h based on PKPD profiles covering 95% of patients.
| | | | | Total Bacterial Load (Btot, P0.95 Profile) |
|---|
| | | | | TDD ~3000 mg/Day | TDD ~6000 mg/Day |
|---|
| Model | Population | Scenario | Btot
Time | II 1000 mg
q8h | CI 3000 mg/24h | II 2000 mg
q8h | CI 6000 mg/24 h |
|---|
| | | | | 0.5 h | 3 h | No LD | LD
500 | LD
1000 | 0.5 h | 3 h | No LD | LD
500 | LD
1000 |
|---|
Li
2006 [21] | Infected adults | Default (Plasma,
CLCR 83 mL/min,
MIC 16 mg/L) | 8 h | 7.66 | 7.80 | 8.07 | 7.77 | 7.36 | 7.27 | 6.81 | 7.46 | 7.08 | 6.64 |
| 24 h | 9.21 | 9.11 | 9.04 | 9.10 | 9.15 | 9.15 | 8.30 | 8.97 | 8.95 | 8.82 |
Doh
2010 [20] | Burns | Plasma | 8 h | 7.54 | 7.69 | 8.03 | 7.67 | 7.18 | 7.08 | 6.63 | 7.26 | 6.81 | 6.28 |
| 24 h | 9.21 | 9.10 | 9.04 | 9.10 | 9.15 | 8.91 | 7.75 | 8.68 | 8.45 | 8.02 |
Delattre
2012 [23] | Sepsis | Plasma | 8 h | 7.58 | 7.74 | 8.02 | 7.67 | 7.08 | 6.84 | 6.56 | 7.23 | 6.75 | 6.07 |
| 24 h | 9.19 | 9.08 | 9.04 | 9.09 | 9.14 | 8.43 | 7.37 | 8.20 | 7.82 | 7.14 |
| Lung | 8 h | 8.15 | 8.16 | 8.18 | 8.16 | 8.12 | 7.98 | 8.06 | 8.14 | 8.12 | 8.05 |
| 24 h | 9.10 | 9.05 | 9.05 | 9.05 | 9.10 | 9.19 | 9.05 | 9.05 | 9.05 | 9.08 |
Roberts
2009 [22] | Sepsis | Plasma | 8 h | 7.43 | 7.57 | 7.95 | 7.50 | 6.85 | 6.76 | 6.32 | 6.89 | 6.33 | 5.66 |
| 24 h | 9.20 | 9.10 | 9.04 | 9.10 | 9.16 | 8.23 | 6.89 | 7.67 | 7.14 | 6.56 |
| Lung | 8 h | 8.12 | 8.16 | 8.17 | 8.15 | 8.08 | 7.85 | 8.01 | 8.13 | 8.09 | 7.99 |
| 24 h | 9.07 | 9.05 | 9.05 | 9.05 | 9.07 | 9.20 | 9.06 | 9.05 | 9.05 | 9.08 |
Lu
2016 [18] | Neurosurgery | Plasma | 8 h | 7.70 | 7.91 | 8.11 | 7.89 | 7.54 | 7.34 | 7.07 | 7.74 | 7.47 | 7.08 |
| 24 h | 9.21 | 9.11 | 9.05 | 9.10 | 9.16 | 9.20 | 8.89 | 9.04 | 9.07 | 9.10 |
Cerebrospinal
fluid | 8 h | 8.18 | 8.18 | 8.18 | 8.18 | 8.18 | 8.18 | 8.18 | 8.18 | 8.18 | 8.18 |
| 24 h | 9.05 | 9.05 | 9.05 | 9.05 | 9.05 | 9.05 | 9.05 | 9.05 | 9.05 | 9.05 |
| Wittau 2015 [19] | Obese | Plasma | 8 h | 7.46 | 7.64 | 7.99 | 7.60 | 6.94 | 6.75 | 6.44 | 7.07 | 6.57 | 5.86 |
| 24 h | 9.20 | 9.09 | 9.04 | 9.09 | 9.16 | 8.18 | 7.24 | 8.15 | 7.73 | 7.07 |
s.c. interstitial
space fluid | 8 h | 7.74 | 7.92 | 8.10 | 7.91 | 7.46 | 7.07 | 7.04 | 7.64 | 7.37 | 6.83 |
| 24 h | 9.17 | 9.04 | 9.04 | 9.07 | 9.13 | 8.92 | 8.79 | 9.01 | 9.02 | 8.99 |
Peritoneal
fluid | 8 h | 7.49 | 7.67 | 8.00 | 7.65 | 7.01 | 6.79 | 6.52 | 7.16 | 6.69 | 6.00 |
| 24 h | 8.52 | 8.42 | 8.76 | 8.60 | 8.47 | 8.08 | 7.23 | 7.47 | 7.23 | 6.95 |
Li
2006 [21] | Infected
adults | CLCR 30 mL/min | 8 h | 7.21 | 7.21 | 7.72 | 6.97 | 6.13 | 6.37 | 5.76 | 6.12 | 5.35 | 4.63 |
| 24 h | 9.08 | 8.91 | 8.99 | 9.01 | 8.68 | 6.94 | 5.44 | 5.28 | 5.25 | 5.25 |
| CLCR 250 mL/min | 8 h | 7.98 | 8.09 | 8.16 | 8.06 | 7.84 | 7.68 | 7.67 | 8.05 | 7.93 | 7.69 |
| 24 h | 9.21 | 9.10 | 9.05 | 9.09 | 9.15 | 9.22 | 9.14 | 9.04 | 9.07 | 9.11 |
| EC50 4.4 mg/L | 8 h | 6.74 | 5.75 | 5.37 | 4.39 | 4.15 | 6.09 | 5.01 | 3.96 | 3.89 | 3.86 |
| 24 h | 8.11 | 5.52 | 5.25 | 5.24 | 5.23 | 6.23 | 5.18 | 5.23 | 5.22 | 5.20 |
| EC50 8.8 mg/L | 8 h | 7.27 | 6.81 | 7.46 | 6.64 | 6.06 | 6.74 | 5.75 | 5.39 | 4.72 | 4.40 |
| 24 h | 9.15 | 8.30 | 8.97 | 8.82 | 8.45 | 8.12 | 5.53 | 5.25 | 5.25 | 5.24 |
| EC50 35.4 mg/L | 8 h | 7.99 | 8.12 | 8.17 | 8.11 | 7.93 | 7.66 | 7.80 | 8.07 | 7.99 | 7.77 |
| 24 h | 9.18 | 9.05 | 9.05 | 9.07 | 9.14 | 9.21 | 9.11 | 9.04 | 9.06 | 9.10 |
| kgrowth, kdeath −40% | 8 h | 6.78 | 6.93 | 7.20 | 6.90 | 6.48 | 6.39 | 5.93 | 6.58 | 6.20 | 5.76 |
| 24 h | 8.28 | 8.64 | 9.09 | 8.96 | 8.70 | 7.12 | 5.74 | 7.38 | 7.00 | 6.53 |
| kgrowth −40% | 8 h | 6.53 | 6.68 | 6.95 | 6.65 | 6.23 | 6.14 | 5.68 | 6.33 | 5.95 | 5.51 |
| 24 h | 7.58 | 7.99 | 8.67 | 8.42 | 8.05 | 6.38 | 4.99 | 6.64 | 6.26 | 5.78 |
Higher initial
bact. load (S) | 8 h | 9.17 | 9.19 | 9.22 | 9.17 | 9.03 | 9.00 | 8.66 | 8.96 | 8.80 | 8.50 |
| 24 h | 9.05 | 9.02 | 9.06 | 9.04 | 9.02 | 8.97 | 8.82 | 8.82 | 8.84 | 8.88 |
Higher initial
bact. load (SR) | 8 h | 9.16 | 9.19 | 9.22 | 9.17 | 9.02 | 8.99 | 8.65 | 8.95 | 8.79 | 8.49 |
| 24 h | 9.04 | 9.02 | 9.06 | 9.04 | 9.02 | 8.97 | 8.83 | 8.82 | 8.84 | 8.88 |
Table 2.
fT>MIC at 8 h and 24 h after start of therapy based on PKPD profiles covering 95% of patients.
Table 2.
fT>MIC at 8 h and 24 h after start of therapy based on PKPD profiles covering 95% of patients.
| | | | | fT>MIC (P0.95 Profile) |
|---|
| | | | | TDD ~3000 mg/Day | TDD ~6000 mg/Day |
|---|
| Model | Population | Scenario | fT>MIC
time | II 1000 mg
q8h | CI 3000 mg/24h | II 2000 mg
q8h | CI 6000 mg/24 h |
|---|
| | | | | 0.5 h | 3 h | No LD | LD
500 | LD
1000 | 0.5 h | 3 h | No LD | LD
500 | LD
1000 |
|---|
Li 2006
[21] | Infected adults | Default (Plasma, CLCR 83 mL/min, MIC 16 mg/L) | 8 h | 9.2 | 0 | 0 | 0.6 | 10.4 | 15.2 | 30.4 | 0 | 1.9 | 12.7 |
| 24 h | 9.2 | 0 | 0 | 0.2 | 3.5 | 15.4 | 31.2 | 0 | 0.7 | 4.2 |
Doh 2010
[20] | Burns | Plasma | 8 h | 11.9 | 0 | 0 | 4.4 | 14.2 | 19.6 | 33.8 | 0 | 5.8 | 18.1 |
| 24 h | 12.0 | 0 | 0 | 1.5 | 4.7 | 19.7 | 34.4 | 0 | 1.9 | 6.0 |
| Delattre 2012 [23] | Sepsis | Plasma | 8 h | 2.1 | 0 | 0 | 0 | 6.9 | 22.9 | 32.7 | 0 | 0 | 19.2 |
| 24 h | 9.0 | 0 | 0 | 0 | 2.6 | 23.3 | 25.0 | 0 | 0 | 6.9 |
| Lung | 8 h | 0 | 0 | 0 | 0 | 0 | 0 | 0 | 0 | 0 | 0 |
| 24 h | 0 | 0 | 0 | 0 | 0 | 0 | 0 | 0 | 0 | 0 |
| Roberts 2009 [22] | Sepsis | Plasma | 8 h | 11.5 | 0 | 0 | 0 | 17.1 | 25.6 | 37.7 | 0 | 1.9 | 31.2 |
| 24 h | 12.2 | 0 | 0 | 0 | 5.7 | 25.6 | 38.1 | 0 | 0.7 | 10.5 |
| Lung | 8 h | 0 | 0 | 0 | 0 | 0 | 0.8 | 0 | 0 | 0 | 0 |
| 24 h | 0 | 0 | 0 | 0 | 0 | 2.9 | 0 | 0 | 0 | 0 |
Lu 2016
[18] | Neurosurgery | Plasma | 8 h | 9.4 | 0 | 0 | 1 | 10.6 | 15.2 | 27.5 | 0 | 1.2 | 12.3 |
| 24 h | 9.5 | 0 | 0 | 0.3 | 3.5 | 15.3 | 27.6 | 0 | 0.4 | 4.1 |
Cerebrospinal
fluid | 8 h | 0 | 0 | 0 | 0 | 0 | 0 | 0 | 0 | 0 | 0 |
| 24 h | 0 | 0 | 0 | 0 | 0 | 0 | 0 | 0 | 0 | 0 |
| Wittau 2015 [19] | Obese | Plasma | 8 h | 12.9 | 0 | 0 | 0 | 17.1 | 25.4 | 35.6 | 0 | 0 | 28.1 |
| 24 h | 13.0 | 0 | 0 | 0 | 5.7 | 25.6 | 36.1 | 0 | 0 | 9.4 |
s.c. interstitial
space fluid | 8 h | 1.9 | 0 | 0 | 0 | 2.5 | 6.7 | 7.3 | 0 | 0 | 3.5 |
| 24 h | 6.0 | 0 | 0 | 0 | 2.5 | 20.1 | 22.5 | 0 | 0 | 3.5 |
Peritoneal
fluid | 8 h | 4.0 | 0 | 0 | 0 | 5.3 | 8.3 | 11.4 | 0 | 0 | 8.4 |
| 24 h | 12.2 | 0 | 0 | 0 | 5.3 | 24.9 | 34.7 | 0 | 0 | 8.4 |
Li 2006
[21] | Infected
adults | CLCR 30 mL/min | 8 h | 29.0 | 34.4 | 0 | 34.0 | 98.3 | 58.5 | 70.9 | 74.4 | 97.3 | 99.0 |
| 24 h | 16.0 | 17.2 | 0 | 1.5 | 8.3 | 32.0 | 46.9 | 80.9 | 93.4 | 99.2 |
| CLCR 250 mL/min | 8 h | 5.8 | 0 | 0 | 0 | 6.2 | 8.8 | 0 | 0 | 0 | 6.5 |
| 24 h | 5.8 | 0 | 0 | 0 | 2.1 | 8.8 | 0 | 0 | 0 | 2.2 |
| EC50 4.4 mg/L | 8 h | 24.4 | 43.8 | 75.6 | 99.2 | 99.8 | 35.8 | 54.6 | 94.0 | 99.2 | 99.8 |
| 24 h | 24.6 | 43.9 | 91.9 | 99.7 | 99.9 | 36.5 | 54.8 | 98.0 | 99.7 | 99.9 |
| EC50 8.8 mg/L | 8 h | 15.2 | 30.4 | 0 | 15.7 | 25.4 | 24.4 | 43.8 | 75.6 | 97.7 | 99.2 |
| 24 h | 15.4 | 31.2 | 0 | 4.2 | 8.5 | 24.5 | 43.9 | 91.9 | 99.2 | 99.7 |
| EC50 35.4 mg/L | 8 h | 0.2 | 0 | 0 | 0 | 0.4 | 9.2 | 0 | 0 | 0 | 0.6 |
| 24 h | 0.8 | 0 | 0 | 0 | 0.1 | 9.2 | 0 | 0 | 0 | 0.2 |
| kgrowth, kdeath −40% | 8 h | 9.2 | 0 | 0 | 0.6 | 10.4 | 15.2 | 30.4 | 0 | 1.9 | 12.7 |
| 24 h | 9.2 | 0 | 0 | 0.2 | 3.5 | 15.4 | 31.2 | 0 | 0.7 | 4.2 |
| kgrowth −40% | 8 h | 9.2 | 0 | 0 | 0.6 | 10.4 | 15.2 | 30.4 | 0 | 1.9 | 12.7 |
| 24 h | 9.2 | 0 | 0 | 0.2 | 3.5 | 15.4 | 31.2 | 0 | 0.7 | 4.2 |
Higher initial
bact. load (S) | 8 h | 9.2 | 0 | 0 | 0.6 | 10.4 | 15.2 | 30.4 | 0 | 1.9 | 12.7 |
| 24 h | 9.2 | 0 | 0 | 0.2 | 3.5 | 15.4 | 31.2 | 0 | 0.7 | 4.2 |
Higher initial
bact. load (SR) | 8 h | 9.2 | 0 | 0 | 0.6 | 10.4 | 15.2 | 30.4 | 0 | 1.9 | 12.7 |
| 24 h | 9.2 | 0 | 0 | 0.2 | 3.5 | 15.4 | 31.2 | 0 | 0.7 | 4.2 |
Table 3.
Most favourable dosing regimens (total daily dose ≥6000 mg) with respect to total bacterial load and fT>MIC at 8 h and 24 h based on plasma PKPD profiles (covering 95% of patients) for the investigated scenarios.
Table 3.
Most favourable dosing regimens (total daily dose ≥6000 mg) with respect to total bacterial load and fT>MIC at 8 h and 24 h based on plasma PKPD profiles (covering 95% of patients) for the investigated scenarios.
| Time | 0.5 h | 3 h | CI | CI + LD500mg | CI + LD1000mg |
|---|
| 24 h | | Infected adults (8.30/31.2) | | | |
| 8 h | | Infected adults (30.4), * | | | Infected adults (6.64) |
| 24 h | | Burns (7.75/34.4) | | | * |
| 8 h | | Burns (33.8) | | | Burns (6.28) |
| 24 h | | Sepsis I (25.0), * | | | Sepsis I (7.14) |
| 8 h | | Sepsis I (32.7) | | | Sepsis I (6.07) |
| 24 h | | Sepsis II (38.1) | | | Sepsis II (6.56) |
| 8 h | | Sepsis II (37.7) | | | Sepsis II (5.66) |
| 24 h | * | Neurosurgery (8.89/27.6) | * | * | * |
| 8 h | * | Neurosurgery (7.07/27.5) | | | * |
| 24 h | | Obese (36.1), * | | | Obese (7.07) |
| 8 h | | Obese (35.6) | | | Obese (5.86) |
| 24 h | | * | * | CLCL 30 mL/min (5.25) | CLCL 30 mL/min (5.25/99.2) |
| 8 h | | | | ^ | CLCL 30 mL/min (4.63/99.0) |
| 24 h | CLCR 250 mL/min (8.8), * | * | CLCR 250 mL/min (9.04) | * | * |
| 8 h | CLCR 250 mL/min (8.8), * | CLCR 250 mL/min (7.67) | * | * | * |
| 24 h | | EC50 4.4 mg/L (5.18) | * | *, ^ | EC50 4.4 mg/L (99.9), * |
| 8 h | | | *, ^ | *, ^ | EC50 4.4 mg/L (3.86/99.8), ^ |
| 24 h | | | * | *, ^ | EC50 8.8 mg/L (5.24/99.7) |
| 8 h | | | | ^ | EC50 8.8 mg/L (4.40/99.2) |
| 24 h | EC50 35.4 mg/L (9.2), * | * | EC50 35.4 mg/L (9.04) | * | * |
| 8 h | EC50 35.4 mg/L (7.66/9.2) | * | | * | * |
| 24 h | | kgrowth,death −40% (5.74/31.2) | | | |
| 8 h | | kgrowth,death −40% (30.4), * | | | kgrowth,death −40% (5.76) |
| 24 h | | kgrowth −40% (4.99/31.2) | | | |
| 8 h | | kgrowth,death −40% (30.4), * | | | kgrowth −40% (5.51) |
| 24 h | * | Higher BL (S) (8.82/31.2) | Higher BL (S) (8.82) | * | * |
| 8 h | | Higher BL (S) (30.4), * | | * | Higher BL (S) (8.50) |
| 24 h | * | Higher BL (SR) (31.2), * | Higher BL (SR) (8.82) | * | * |
| 8 h | | Higher BL (SR) (30.4), * | | * | Higher BL (SR) (8.49) |
2.1. Evaluation of Total Bacterial Load
2.1.1. Patient-Related Characteristics and Site of Infection
Given the typical patient characteristics of the six populations, the highest bacterial load was observed for a general mixed population [
21] with CLCR = 250 mL/min and for neurosurgery patients [
18], whereas lowest bacterial counts were observed for a general mixed population with CLCR = 30 mL/min and for critically ill patients [
23]. Given the default MIC of the resistant strain (MIC = 16 mg/L), 3-h infusions generally performed better than (or comparably well as) standard 0.5-h infusions with respect to bacterial reduction at 24 h (see
Figure S2 for all six populations).
At 8 h after start of dosing (i.e., after one dose in case of intermittent dosing), bacterial reduction by a 3-h infusion was frequently still below that achieved by a 0.5-h infusion, although this trend was reversed at 24 h (see above).
Most Favourable Regimens
The
continuous-infusion regimen with highest loading dose (CI+LD
1000mg) resulted in the lowest bacterial load (or in bacterial counts comparable to after 3-h infusions) at 24 h for most scenarios, both when assessing the median bacterial load value (B
tot_median_24h) or the 95th percentile of B
tot values (B
tot_P0.95_24h). For example, B
tot_P0.95_24h was lowest (‘best’) given the high-dose CI
6000mg+LD
1000mg regimen in critically ill (sepsis I and II [
22,
23]) and obese patients [
19] (B
tot_P0.95_24h = 7.1, 6.6, 7.1 log10 CFU/mL). However, in patients exhibiting lowest concentration-time profiles (neurosurgery patients [
18], obese patients [
19], patients with CLCR = 250 mL/min [
21]), and–when considering the P
0.95 profile in the population–also in burns patients [
20] and a mixed infected population [
21], the 3h
TDD6000mg-infusion regimen was slightly superior, i.e., resulted in lowest bacterial counts after 24 h (although even then bacterial regrowth was observed in the general mixed population [
21], in burns patients [
20] and neurosurgery patients [
18]: B
tot_P0.95_24h = 8.3, 7.8, 8.9 log10 CFU/mL).
Least Favourable Regimens
Standard short (0.5-h) infusions appeared as the least favourable dosing regimen for the ARU552 strain (MIC = 16 mg/L) at 24 h (see
Figure S1: standard 0.5h
TDD3000mg dosing for the default scenario and
Figure S2: 0.5h
TDD6000mg versus prolonged and continuous infusion regimens). Continuous infusion without loading dose performed worst with respect to bacterial reduction at 8 h after start of treatment (e.g., in neurosurgery patients), particularly given a low total daily dose (CI
3000mg) and high-dose scenarios associated with low exposure (e.g., obese patients).
Evaluation at 24 h versus 8 h and Impact of a Loading Dose
Addition of a
loading dose to CI regimens foremost improved bacterial killing at 8 h after start of dosing. CI+LD
1000mg resulted in higher bacterial reduction after 8 h than a 3-h
2000mg infusion. However, CI+LD
500mg notably resulted in lower bacterial reduction after 8 h than a 3-h
2000mg infusion for low-exposure scenarios (e.g., CLCR = 250 mL/min) and for P
0.95 scenarios, despite the higher dose administered during 8 h (2375 mg versus 2000 mg). At 8 h, continuous infusion without loading dose performed worst (together with 0.5-h infusions for some median profiles). B
tot_P0.95 patterns differed between 8 h and 24 h, insofar as bacterial loads commonly appeared lower at 8 h and differences between the ten studied dosage regimens for the same scenario were often less pronounced at 8 h (see
Figure 1 and
Figure S3). B
tot_median patterns also revealed overall lower bacterial load after 8 h versus 24 h. Contrary to B
tot_P0.95, higher B
tot_median values were obtained for CI + LD
500mg when based on the first 8 h versus 24 h (B
tot_median_8h > B
tot_median_24h, but B
tot_P0.95_8h < B
tot_P0.95_24h).
Site of Infection
For scenarios with extensive regrowth (e.g., low-dose regimens in critically ill patients or peripheral sites of infection), no marked difference was observable between the different dosing strategies. For example, the bacterial load after 24 h was high at peripheral infection sites (i.e., lung, cerebrospinal fluid, subcutaneous tissue and peritoneal fluid) and barely allowed for a comparison of dosage regimens; just a slight trend favouring the CI + LD1000mg or the 3-h infusion regimens could be observed.
2.1.2. Pathogen-Related Characteristics
Given the ARU552 strain with MIC = 16 mg/L, continuous infusion with a loading dose (CI + LD
1000mg) appeared as the most favourable regimen for the median profile of the default scenario (general mixed population [
21]). To achieve an as low as possible bacterial load for the P
0.95 profile in the population, a 3-h infusion regimen seemed more appropriate after 24 h. When assuming lower MIC values and thus higher susceptibility, the same trend (with CI+LD performing well) could be observed (MIC = 8 mg/L: CI
6000mg; MIC = 4 mg/L: CI
3000mg). Again, for the EC
50 = 4.4 mg/L scenario and when looking at the P
0.95 profile of the population, 3-h infusion regimens became comparable to CI + LD regimens. Interestingly, for pathogens with assumed MIC = 4 mg/L, low-dose 3-h infusions appeared more favourable than high-dose 0.5-h infusions to suppress bacterial growth for the P
0.95 profile in the population at 24 h. However, 0.5-h infusions performed slightly better than 3-h infusions for high-dose scenarios with EC
50 = 4.4 mg/L, although for both of these scenarios marked bacterial suppression occurred (B
tot for 0.5-h/3-h infusions: 4.7/5.0 log10 CFU/mL).
At 8 h and for more susceptible strains (MIC = 4–8 mg/L), all CI6000mg regimens–and given MIC = 4 mg/L even CI3000mg + LD1000mg and CI3000mg + LD500mg regimens–were superior to intermittent 0.5-h and 3-h dosing regimens. Consistent with Btot_P0.95_24h values, highest (least favourable) Btot_median_24h values were attained by low-dose continuous-infusion regimens across the diverse scenarios for resistant P. aeruginosa with MIC = 16 mg/L, while for pathogens with higher antibacterial sensitivity (MIC = 8 mg/L), continuous-infusion regimens were superior or comparable to intermittent dosing regimens with respect to Btot_median_24h.
Modification of the strain virulence, i.e., assumption of a 40% reduction of the growth rate (±death rate) constant resulted in overall lower bacterial counts compared to the default scenario for all dosing regimens. Continuous infusions without loading dose performed worst at 24 h, revealing the importance of high concentrations to suppress bacterial growth for these scenarios. Intermittent 3-h infusions appeared more favourable than continuous infusion after 24 h for the P0.95 profile in the population. For the low-dose scenario, 0.5-h infusions resulted in lower bacterial counts than 3-h infusions (Btot for 0.5-h/3-h infusions: 7.6/8.0 log10 CFU/mL).
When assuming a higher initial bacterial load of 8 log10 CFU/mL instead of 6 log10 CFU/mL, CI6000mg + LD1000mg best suppressed bacterial growth given the median CFU profile in the population, and 3hTDD6000mg performed comparably well after 24 h given the P0.95 profile in the population. The same pattern was obtained when assuming a fraction of cells in the resting state at the start of treatment.
In contrast to the resistant ARU strain, the ATCC strain (MIC = 1 mg/L) was markedly suppressed by all ten investigated dosing regimens, with the low-dose standard 0.5-h infusion scheme again resulting in the overall highest bacterial counts (3.6 log10 CFU/mL) for the P0.95 CFU profile after 24 h. Assuming higher MIC values (MIC = 4 mg/L and MIC = 8 mg/L) by scaling the slope parameter accordingly suggested that no bacteriostasis was achieved after 24 h with any investigated dosing regimen. For MIC = 2 mg/L and MIC = 4 mg/L, low-dose standard 0.5-h infusions performed worst with respect to bacterial killing after 24 h, whereas high-dose CI6000mg + LD1000mg infusions performed best. Similarly, CI6000mg + LD1000mg performed best and standard 0.5-h3000mg infusions worst for all MIC = 1–8 mg/L at 8 h (rather than 24 h) after start of treatment.
2.2. Evaluation of fT>MIC
Apart from bacterial load, the ten different dosing regimens were additionally evaluated with respect to fT>MIC values, thus merely considering the shape of the concentration-time profile and the minimum inhibitory concentration of the pathogen.
2.2.1. Patient-Related Characteristics and Site of Infection
Given MIC = 16 mg/L of the resistant strain, all five low-dose dosing regimens resulted in insufficient fT>MIC values (<20%) at 24 h for all median concentration-time profiles of the six investigated patient populations. Only when assuming renal impairment (CLCR = 30 mL/min) or higher bacterial susceptibility (EC50 = 4.4 or 8.8 mg/L) were higher fT>MIC values (>30%) reached. For these three scenarios, CI6000mg + LD1000mg appeared as the most favourable regimen (resulting in highest fT>MIC values), even when considering the P0.95 concentration-time profile in the population.
Most Favourable Regimens
For most scenarios, the high-dose continuous-infusion regimens CI
6000mg + LD
1000mg performed best when considering the median pharmacokinetic profile of the patient population (
fT
>MIC_median_24h). In the case of two exceptions, i.e., the presence of high clearance (neurosurgery and obese patients) and CLCR = 250 mL/min (mixed adult population), intermittent infusion regimens (3-h > 1-h) performed better. The
fT
>MIC value reached by the P
0.95 concentration-time profile in the population was highest (at both 24 h and 8 h) given the high-dose 3h
TDD6000mg infusion regimen (
fT
>MIC_PI0.95_24h = 38.1% (sepsis II patients [
22])–27.6% (neurosurgery patients [
18])), followed by the 0.5 h
TDD6000mg infusion regimen. Thus, for example, 95%
fT
>MIC values of the simulated critically ill population described by Roberts et al. [
22] were ≥38%, whereas the probability to attain a target of
fT
>MIC = 40% appeared largely insufficient (≪90%) in the neurosurgery patient population with meningitis [
18].
Least Favourable Regimens
Given the typical patient features of the six populations, low-dose CI3000mg regimens (even with loading dose) resulted in the lowest fT>MIC_P0.95 values of all investigated dosing scenarios. In contrast, high-dose CI6000mg regimens resulted in the highest fT>MIC_P0.95 values, if infected patients displayed impaired renal function (CLCR = 30 mL/min, mixed adult population).
Evaluation at 24 h versus 8 h and Impact of a Loading Dose
fT
>MIC_P0.95 and
fT
>MIC_median patterns did not differ considerably when based on 24 h or 8 h (
Figure 1 and
Figure S3). Continuous-infusion regimens with loading dose resulted in slightly higher
fT
>MIC_P0.95 when based on the first 8 h versus 24 h. Contrary to
fT
>MIC_P0.95, CI+LD
500mg resulted in lower
fT
>MIC_median when based on the first 8 h versus 24 h.
2.2.2. Pathogen-Related Characteristics
Of all pathogen-related characteristics investigated, solely the minimum inhibitory concentration affects fT>MIC. High-dose continuous-infusion regimens were associated with higher fT>MIC_P0.95 and fT>MIC_median_24h than intermittent dosing regimens for pathogens with assumed higher sensitivity (EC50 = 4.4 mg/L and 8.85 mg/L~MIC = 4 mg/L and 8 mg/L). CI3000-6000mg regimens (MIC = 4 mg/L) or CI6000mg regimens (MIC = 8 mg/L) overall performed best.
The lowest fT>MIC_median_24h values were attained by low-dose continuous-infusion regimens (without loading dose) across the diverse scenarios for resistant P. aeruginosa with MIC = 16 mg/L. Just for pathogens with higher antibacterial sensitivity (MIC = 4–8 mg/L), all (including low-dose) continuous-infusion regimens were superior to intermittent dosing regimens with respect to fT>MIC_median_24h and all high-dose continuous-infusion regimens were superior with respect to fT>MIC_P0.95_24h.
Previous studies have suggested exceeding the MIC by four times (and using
fT
>4∙MIC), particularly for severely ill patients. When targeting
fT
>4∙MIC, values of
fT
>4∙MIC < 20% were observed for all scenarios unless assuming higher susceptibility (MIC = 4 mg/L; see
Figure S4).
2.3. Comparison fT>MIC and Total Bacterial Load (Btot)
fT
>MIC showed higher consistency between 8 h and 24 h than B
tot (
Figure 1 and
Figure S3). A discrepancy between conclusions based on
fT
>MIC and B
tot was more pronounced at 8 h than at 24 h, particularly for dosing regimens including a loading dose. For example,
fT
>MIC_P0.95_8h was highest for 3h
TDD6000mg for most scenarios, whereas B
tot_P0.95_8h was lowest (‘best’) for the CI
6000mg + LD regimen (
Figure S3). Administration of a loading dose foremost improved bacterial killing and B
tot at 8 h but resulted in similar
fT
>MIC compared to other dosing regimens.
For a dosing regimen to be considered adequate, suppression of bacterial growth (i.e., at least bacteriostasis) or, when referring to PK/PD indices, a target of at least
fT
>MIC = 50% has been suggested for clinical settings.
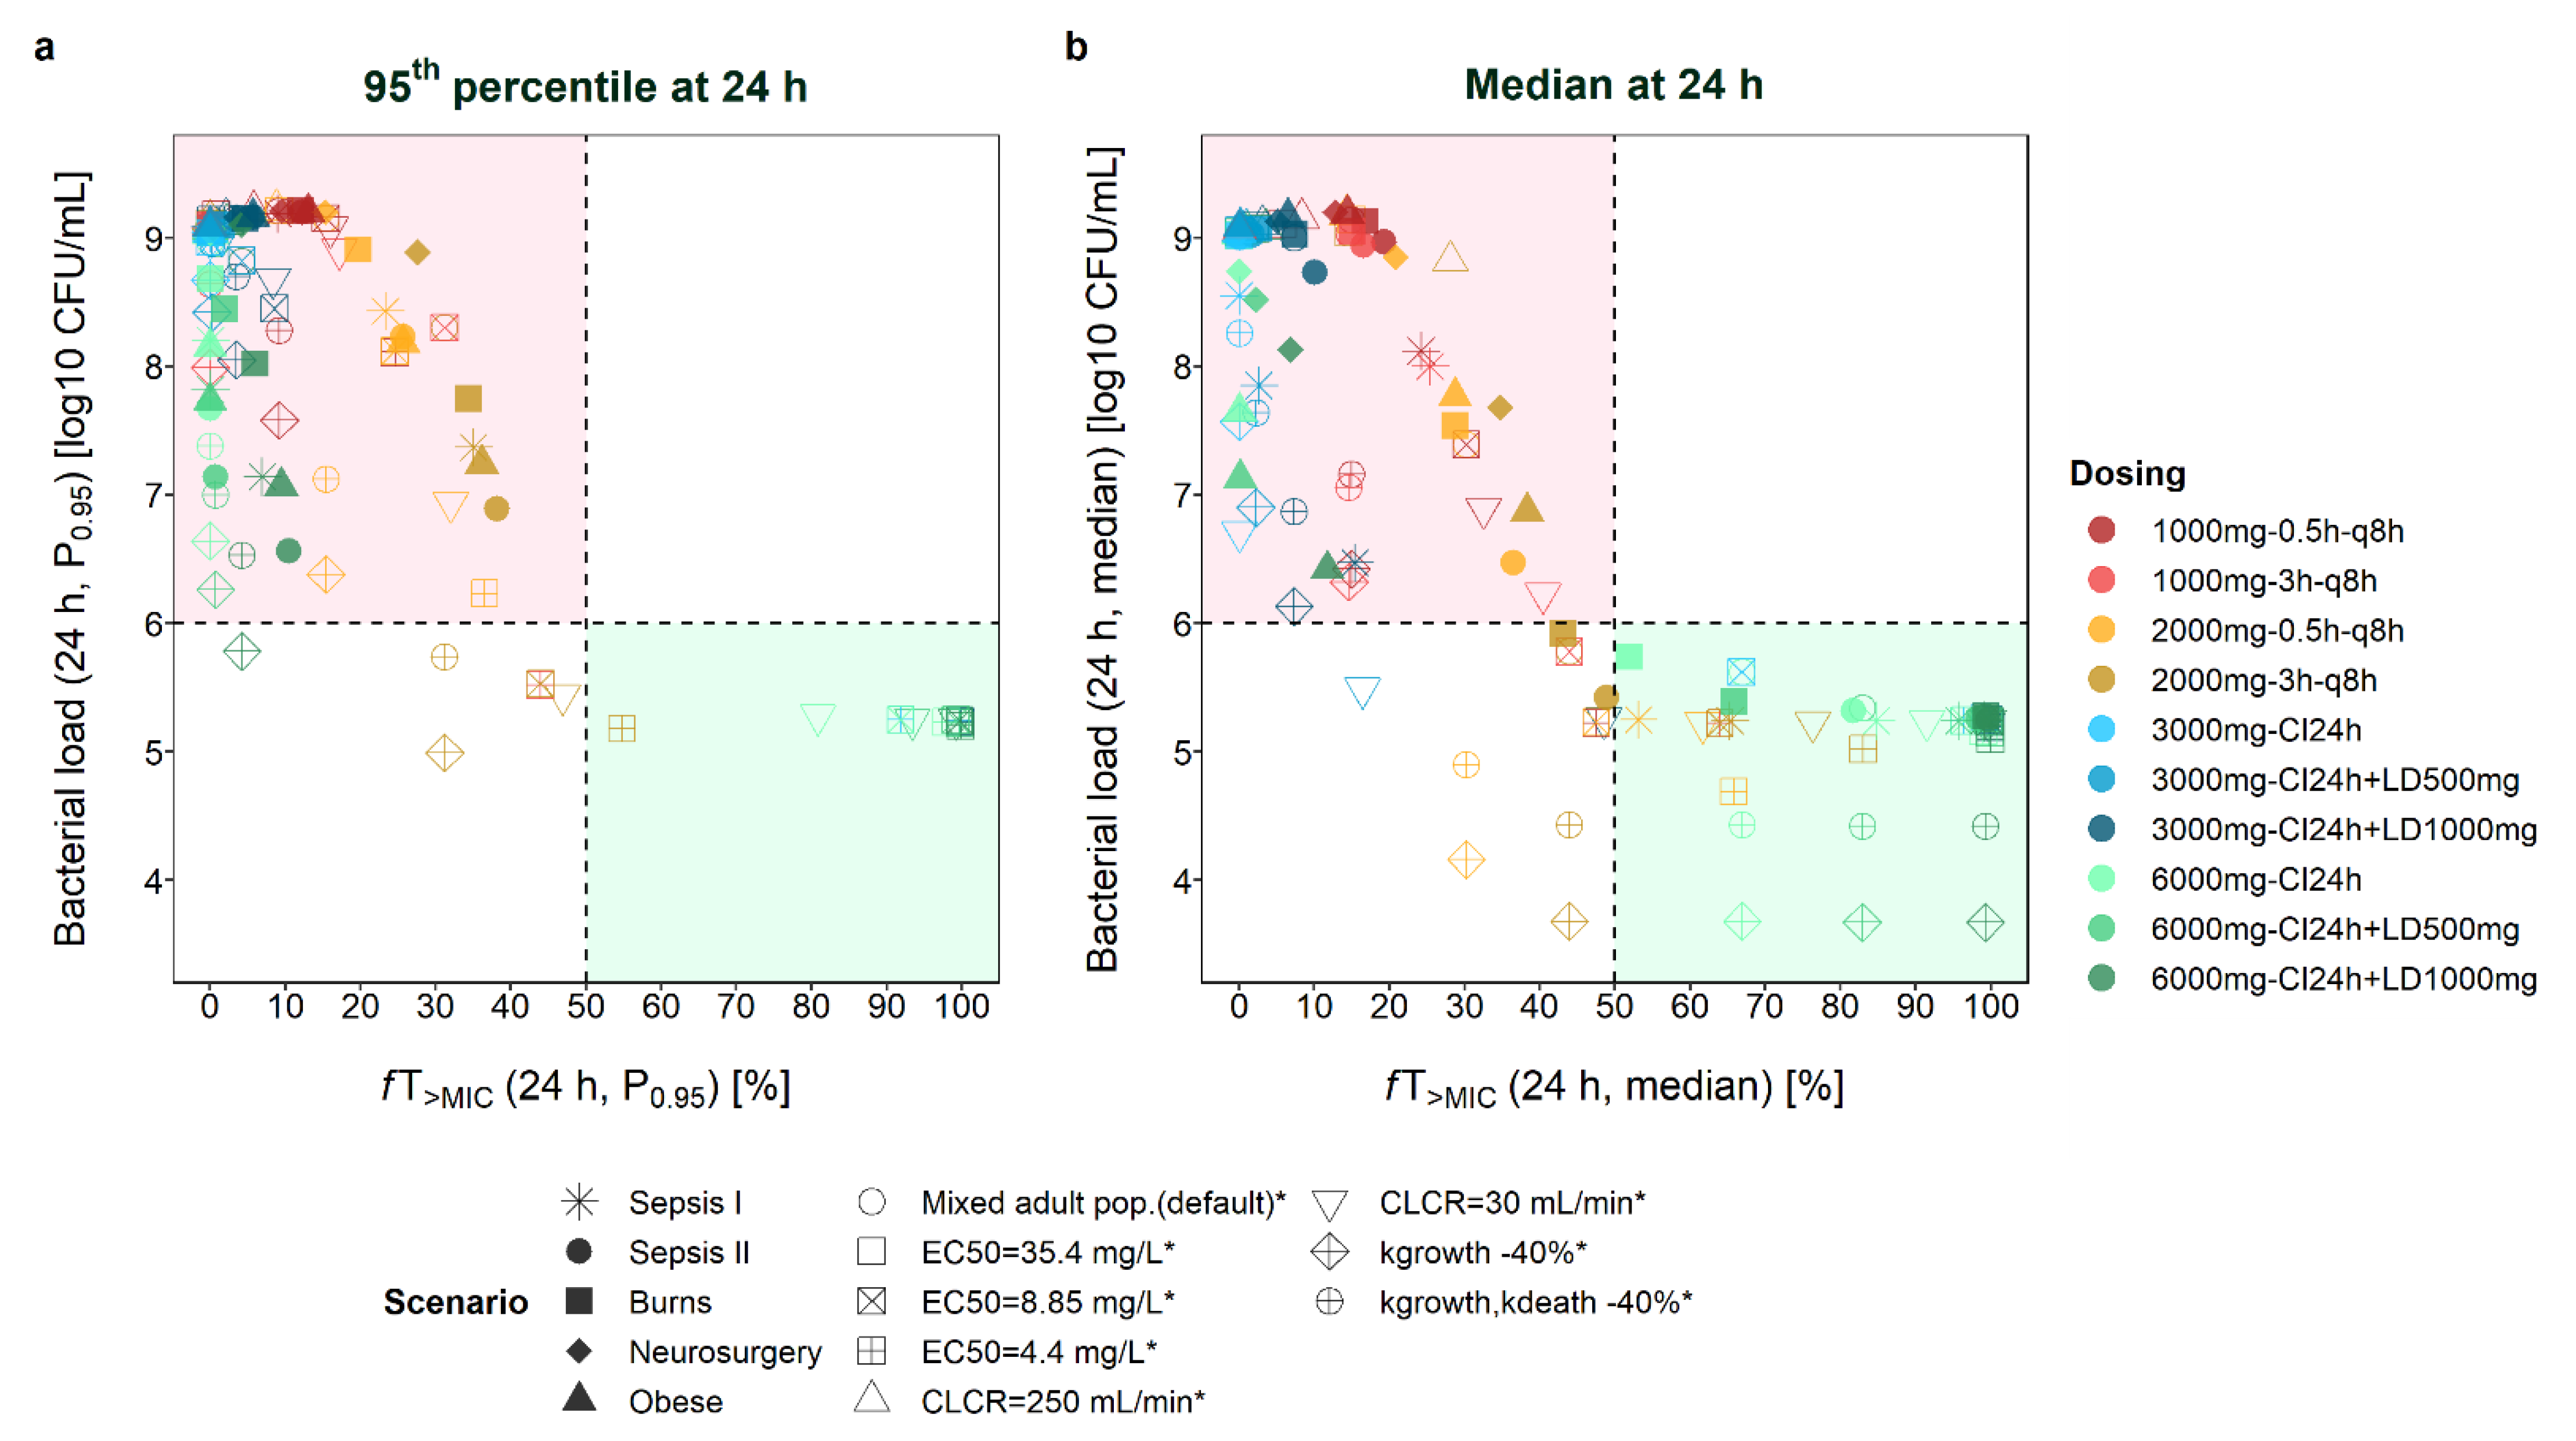
Figure 2 compares the attainment of these two thresholds for scenarios with an initial inoculum of 6 log CFU/mL (targets: bacterial load ≤ 6 log10 CFU/mL and
fT
>MIC ≥ 50%). It becomes evident that even when the same
fT
>MIC values were obtained for several scenarios, markedly different B
tot values could be observed. When looking at median profiles at 24 h after start of dosing (
Figure 2b), all scenarios leading to bacterial growth (>6 log10 CFU/mL) were associated with
fT
>MIC < 50%. In other words, all scenarios leading to
fT
>MIC>50% (even
fT
>MIC > 40%) over 24 h resulted in bacteriostasis. For most scenarios,
fT
>MIC values between 20% and 50% resulted in a higher bacterial load after 24 h compared to the start of treatment. However, for some scenarios, bacterial suppression was achieved even for lower
fT
>MIC values, i.e., for a mixed adult population with CLCR = 30 mL/min and CI
3000mg + LD
500mg dosing (
fT
>MIC = 16.5%, B
tot = 5.5 log10 CFU/mL), for scenarios assuming a 40% lower growth rate and high-dose intermittent infusion (3h
TDD6000mg, 0.5h
TDD6000mg), and for several scenarios with
fT
>MIC = 40–50% (e.g., adult patient with CLCR = 30 mL/min and CI
3000mg + LD
1000mg dosing:
fT
>MIC = 48.6%, B
tot = 5.3 log10 CFU/mL; median profile for burns/critically ill (sepsis II [
22])/mixed adult population and 3h
TDD6000mg dosing; scenarios with EC
50 = 4.4 mg/L and 0.5-h dosing, or EC
50 = 8.8 mg/L and 3-h dosing).
The assessment of P
0.95 profiles rather than median profiles revealed a similar picture, with most scenarios resulting in insufficient drug exposure and bacterial killing (
Figure 2a). Scenarios leading to
fT
>MIC < 50% but still B
tot < 6 log10 CFU/mL again included scenarios assuming a lower growth rate of the pathogen (high-dose dosing regimens with prolonged infusions), and scenarios with EC
50 = 4.4 mg/L (3h
TDD6000mg), EC
50 = 8.8 mg/L (3h
TDD6000mg), and CLCR = 30 mL/min (3h
TDD6000mg).
At 8 h after the start of treatment (
Figure S5), more scenarios led to B
tot < 6 log10 CFU/mL but
fT
>MIC < 50%, including scenarios with lower growth rates and beyond (e.g., burns patients: CI
6000mg+LD
500mg at 8 h:
fT
>MIC = 19.6%/B
tot = 5.7 log10 CFU/mL, at 24 h:
fT
>MIC = 65.9%/B
tot = 5.4 log10 CFU/mL). Last,
fT
>4∙MIC values > 50% were only attained when assuming EC
50 = 4.4 mg/L (
Figure S4). Thus, stasis was also observed for some scenarios with
fT
>4∙MIC < 20% (
Figure S6).
3. Discussion
Our study applied PKPD models to enable in vivo predictions of antibiotic concentrations and bacterial killing (i) for clinically relevant scenarios other than originally studied (‘what-if’ scenarios, e.g., in specific groups of patients, given specific patient characteristics, in specific compartments of the body or given novel dosage regimens); (ii) at any time point of interest; and (iii) assuming different bacterial susceptibility. These simulations can aid in identifying and pre-selecting promising scenarios to be investigated in clinical studies (e.g., resource-intensive randomised controlled trials). Furthermore, once a dosing scheme has been shown to be efficient in a group of patients, PKPD models could help to identify dosing regimens leading to a similar bacterial pharmacodynamic profile in a different target population.
Prolonged and continuous infusions have increasingly been promoted and used for antibiotics with ‘time-dependent’ activity, although its impact on clinical outcome is still a subject of research. A meta-analysis of 22 randomised trials associated prolonged infusions (≥3 h) of antipseudomonal beta-lactams with lower all-cause mortality than short-term infusion (≤60 min) for patients with sepsis [
24]. Similarly, two smaller meta-analyses reported a significant reduction of hospital mortality or improvement of clinical cure when using >1-h infusions in studies published in or after 2015 [
25] and lower mortality for extended infusions (≥3 h) [
26]. However, most of these studies did not differentiate between different types of prolonged infusions (e.g., 3-h or continuous infusion). Simulations with PKPD models allow for the systematic investigation of what-if scenarios, e.g., various lengths of infusions with or without a loading dose, and can help to create hypotheses regarding potentially efficacious dosing regimens. For example, the present analysis compared five different modes of administration, both as high-dose and low-dose regimens administered as 0.5-h, 3-h and continuous-infusion regimens (with and without a loading dose).
In our study, conclusions regarding which of these ten investigated intermittent and prolonged-infusion regimens seemed most favourable for a resistant P. aeruginosa strain (MIC = 16 mg/L) depended on several factors: First, the surrogate of efficacy chosen as the basis for comparison of dosing regimens played a role, i.e., total bacterial load (Btot) as a result of meropenem exposure (using the PKPD model), or fT>MIC (based on a PK/PD index-based approach, using merely the PK component of the model and MIC information), which was evaluated in the context of previously determined PK/PD targets as thresholds for efficacy. For instance, the benefit of a loading dose after 8 h became more apparent in Btot than fT>MIC. Given the P0.95 profile in the population, CI + LD1000mg appeared most favourable with respect to bacterial load at 8 h and 24 h for most scenarios, though 3hTDD6000mg performed best with respect to fT>MIC. The least favourable dosing regimens also differed depending on the measure of evaluation (Btot_P0.95_24h: 0.5-h infusion versus fT>MIC_P0.95_24h: CI without loading dose).
Second, the time of assessing B
tot or
fT
>MIC was crucial. For example, an initial effect of a loading dose on the bacterial load at 8 h was outweighed by regrowth at 24 h after the start of antibiotic treatment for some scenarios. Early antibiotic treatment is crucial to minimize the initial bacterial burden [
27]. The urgency of early effective antibiotic treatment depends on the clinical condition of the patient and the acuteness of the bacterial infection [
28,
29].
Third, the most appropriate dosing regimen for a scenario differed depending on whether the PKPD profiles representing the median or the 95th percentile of the population were studied. This observation is important when mimicking human exposure in in vitro time-kill experiments (e.g., hollow-fibre studies). These are often based on the concentration-time profile of the typical patient, i.e., the median representative in a population that was previously determined by a population pharmacokinetic model. The results of the present study call to mind to also consider variability in the population and, for example, to investigate PK(/PD) profiles representing the 95th percentile of a population.
In our study, high total daily dose and shorter infusion durations (3-h6000mg) tended to become advantageous for scenarios associated with lower meropenem concentrations (CLCR = 250 mL/min, high clearance) and consequently when assessing the 95th percentile of the pharmacokinetic and pharmacodynamic profiles (Btot, fT>MIC), lower bacterial susceptibility (MIC ≥ 16 mg/L) and assumed lower growth (±death) rate. Hence, the lower the antibiotic concentrations in relation to the MIC were, the more important higher doses or, in case of unchanged doses, the height of concentration peaks following short infusions became. In contrast, continuous infusion appeared to become more favourable for scenarios associated with higher meropenem concentrations (CLCR = 30 mL/min), assessment of the median fT>MIC and Btot, and higher bacterial susceptibility (MIC ≤ 8 mg/L). Notably, prolonged-infusion dosing like 3-h and CI + LD regimens were largely superior to the approved standard intermittent 0.5-h infusions administered every eight hours.
Our study investigated total daily doses of 3000 mg, corresponding to the approved standard dosing regimen for infections caused by
P. aeruginosa (1000 mg every eight hours) [
3], up to clinically feasible total daily doses of 6875 mg (CI
6000mg + LD
1000mg). The higher total daily dose on the first day compared to the following days of antibiotic treatment (e.g., 6875 mg versus 6000 mg) was owing to assumed unchanged infusion rates after the loading dose across the entire treatment period, as clinically feasible and previously accepted in randomised controlled trials [
30]. Maximum doses of 6000 mg/day, e.g., three times 2000 mg over 0.5 h or 3 h for meningitis, have previously been recommended [
11]. Apart from that, off-label continuous regimens with 6000 mg daily preceded by loading doses of 2000 mg, or even 3500 mg every 6 h, have been reported [
31,
32].
In our simulation study, median concentrations up to 30.9 mg/L (CLCR = 30 mL/min; CI
6000mg), followed by 24.6 mg/L (critically ill, Sepsis I [
23]; CI
6000mg) were simulated at 24 h and the corresponding concentrations covering 90% of the population were 18.2–55.0 mg/L and 24.6–47.3 mg/L, respectively. An arbitrary safety threshold of 100–120 mg/L, thus higher than the meropenem concentrations simulated in our study, has previously been suggested to be tolerable [
33]. A retrospective study on beta-lactam toxicity during intermittent infusions associated minimum concentrations > 64.2 mg/L and >44.5 mg/L with a 50% risk of developing neurotoxicity and nephrotoxicity, respectively [
34]. Another retrospective review of critically ill patients receiving meropenem doses of ≤6000 mg/day did not identify additional toxicities [
35].
Varied pathogen susceptibility (different MIC values), also reflecting potential uncertainty in the MIC determination was mimicked by scaling EC
50 accordingly. The rationale for this approach, i.e., the ability of the model to predict new strains based on their MIC only, has previously been shown for both other mutants and clinical isolates [
36]. The MIC was assumed to be constant over the investigated 24-h observation period. For longer clinical trials, regular MIC measurements (rather than baseline only) could be valuable.
Lower growth and death rates have been demonstrated in vivo compared to in vitro [
6], though these differences also depend on the mechanism of action. Given a 40% reduced growth (±death rate) for the resistant
P. aeruginosa strain, the same antibiotic dose appeared more effective compared to the default strain. Further studies are warranted to confirm this finding specifically for meropenem and strains with slower bacterial growth.
Most scenarios of our analysis considered plasma concentration-time profiles and thus strictly bloodstream infections. For four populations (critically ill, neurosurgery and obese patients), peripheral locations of infection (lung, cerebrospinal fluid, interstitial space fluid, peritoneal fluid) were additionally investigated. However, the comparison of dosing regimens for these peripheral sites of infection was not straightforward due to a predicted overall high bacterial load, and no difference could be identified between models capturing both rate and extent, and those capturing only the extent of antibiotic exposure.
Some limitations of our analysis shall be acknowledged. The focus of the present work lies in comparisons of total bacterial load following different dosage regimens relative to a reference dosage regimen and relative to a reference population/scenario–rather than based on absolute bacterial counts (e.g., whether bacteriostasis is reached or not). Details of a bacterial infection like bacterial load at the start of treatment or bacterial growth and death rates might not be directly transferable from in vitro to in vivo scenarios, e.g., due to a different supply of nutrients. Bacterial density in humans might be variable depending on the type of infection or disease severity. Our analysis assumed an initial bacterial load of 6 log10 CFU/mL in agreement with in vitro experiments, or an inoculum of 8 log10 CFU/mL at the start of meropenem treatment [
36]. Previous studies suggest that this magnitude might also be plausible for humans (2–10 log10 CFU/mL), as demonstrated in patients with suspected ventilator-associated pneumonia (6.2 log10 CFU/mL in bronchoalveolar lavage fluid [
37]), diabetic foot ulcers [
38] and patients receiving platelet transfusions [
39].
The reliability of the transferability of in vitro growth characteristics to human in vivo conditions to achieve a direct translation of the bacterial burden in patients is still a subject of research. One study, for example, analysed the same bacterial strain in vitro and in vivo and showed that model parameters may need to be adjusted to enable quantitative translation of the bacterial concentrations [
40]. However, PKPD models allow for the drawing of inferences regarding which dosing regimen and shape of human concentration-time profile influence bacterial killing in the most favourable way. To verify efficacious and safe dosing in challenging clinical situations with special and highly variable patient populations, poorly susceptible pathogens and long treatment durations, model-informed precision dosing has been proven promising in several studies [
41].
Selected scenarios were investigated based on one PKPD model. Different PKPD models might result in different conclusions and further conceivable scenarios could be interesting to investigate, e.g., antibiotic combinations. As the pharmacodynamic component of the PKPD model relied on in vitro time-kill curves, potential effects of the immune system on the bacterial dynamics were not considered in the present simulations. In this respect, the simulated scenarios might represent ‘worst-case’ scenarios in terms of bacterial eradication. Consistent with the in vitro experiments underlying the PKPD model for meropenem and to avoid extrapolation, our simulation study merely covered two strains of
P. aeruginosa and the first day of treatment, not least due to the importance of early adequate therapy, particularly in patients with severe infections [
29,
42]. In scenarios with
fT
>MIC values of close to 100%, no regrowth was observed in the first 24 h; however, regrowth could not be excluded for longer durations of observation. As emergence of resistance might occur after 24 h, conclusions might change when evaluating longer periods of antibiotic treatment, e.g., one week of therapy. Hollow-fibre studies enable the observing of time-kill patterns for longer periods of time and could provide the basis for such extended PKPD studies [
43].
4. Materials and Methods
The objectives were exemplified by a PKPD model describing meropenem effects over time against a resistant
P. aeruginosa strain (ARU552, MIC = 16 mg/L) and a more susceptible
P. aeruginosa strain (ATCC27853, MIC = 1 mg/L) [
42]. The database originated from 24-h static and dynamic in vitro time-kill curve experiments. The PKPD model comprised two bacterial subpopulations, each with compartments for growing and resting bacteria, and included different drug effect models for the two strains (ARU552: sigmoid E
max model; ATCC27853: power model). The model has previously successfully been shown to predict data from PK/PD index studies in mice without re-estimation of model parameters [
9,
44].
Bacterial growth and killing during meropenem exposure were translated to humans, with the drug effect in the model driven by the pharmacokinetic profiles of different patients based on six previously published population pharmacokinetic models (see
Table S1). The investigated patient populations comprised adults with intra-abdominal or lung infections [
21], critically ill [
22,
23], burns [
20], obese [
19], and neurosurgery patients [
18], thus reflecting diverse indications of meropenem. Two critically ill populations were included in the analysis, sepsis patients (Clearance CL = 9.87 L/h given creatinine clearance CLCR = 100 mL/min), and sepsis patients without renal dysfunction (CL = 13.6 L/h, median CLCR~100 mL/min) exhibiting overall lower concentrations. Only two-compartment models that had been developed based on a solid data base, i.e., rich in number of patients and/or samples per patient, were selected. Antibiotic concentration-time profiles and bacterial counts over time were simulated based on unbound meropenem concentrations (assuming an unbound fraction of 98% [
3]) over 24 h since the start of antibiotic treatment.
A mixed adult infected population (CLCR = 83 mL/min [
21]), original pharmacodynamic parameters of the model [
42], and an initial bacterial load of 10
6 colony forming units (CFU) per mL were chosen as a default scenario, which was compared to diverse alternative scenarios. These comprised varied patient-related characteristics (e.g., disease, CLCR values of the default population varied to 30 mL/min and 250 mL/min instead of 83 mL/min). Most scenarios considered plasma concentration-time profiles and thus strictly bloodstream infections. Apart from that, different peripheral sites of infection were investigated, including lung, cerebrospinal or peritoneal fluid and subcutaneous tissue (see
Table S1). If covered by the model, differences in both rate and extent of drug distribution compared to the plasma compartment were considered. For example, the model for neurosurgery patients included a separate compartment for cerebrospinal fluid [
18]. In the model for obese patients, rapid equilibrium between the central compartment and the compartments for subcutaneous (SC) tissue and peritoneal fluid (PF) was implemented and concentrations of the central compartment (C
CC) were thus scaled accordingly (C
SC = C
CC∙0.72 and C
PF = C
CC∙0.94). Penetration from plasma to lung was assumed to be 30% in critically ill patients [
22,
23], as previously reported for critically ill patients with nosocomial [
45] and ventilator-associated pneumonia [
46].
Apart from patient characteristics, tweaked pathogen-related features of the resistant strain, including EC
50, growth rate, kill rate, and start inoculum, were investigated. Different MIC values, scaled by varying the EC
50 value for the resistant
P. aeruginosa strain or the slope parameter for the ATCC27853 strain accordingly, were simulated with the PKPD model using the pharmacokinetic component of the default (mixed adult) patient population. In line with the in vitro experiments underlying the model, initial bacterial density was set to 6 log10 CFU/mL for most scenarios and bacteria were assumed to be in the susceptible and growing state at the start of treatment. Additional simulations were performed based on a higher initial inoculum of 8 log10 CFU/mL, with all bacteria assumed as susceptible or else with a certain fraction of bacteria in the resting state at the start of treatment. For the latter scenario, 3.4% of bacteria were initially assumed as resting (as this proportion was found in the resting state after an initial bacterial load of 100 CFU/mL had reached 8 log10 CFU/mL after 21.8 h). The growth rate and the death rate constants of the resistant strain were kept unchanged or were lowered by 40%, as had been observed previously in vivo compared to in vitro [
6] (see
Table S1 for an overview of investigated scenarios).
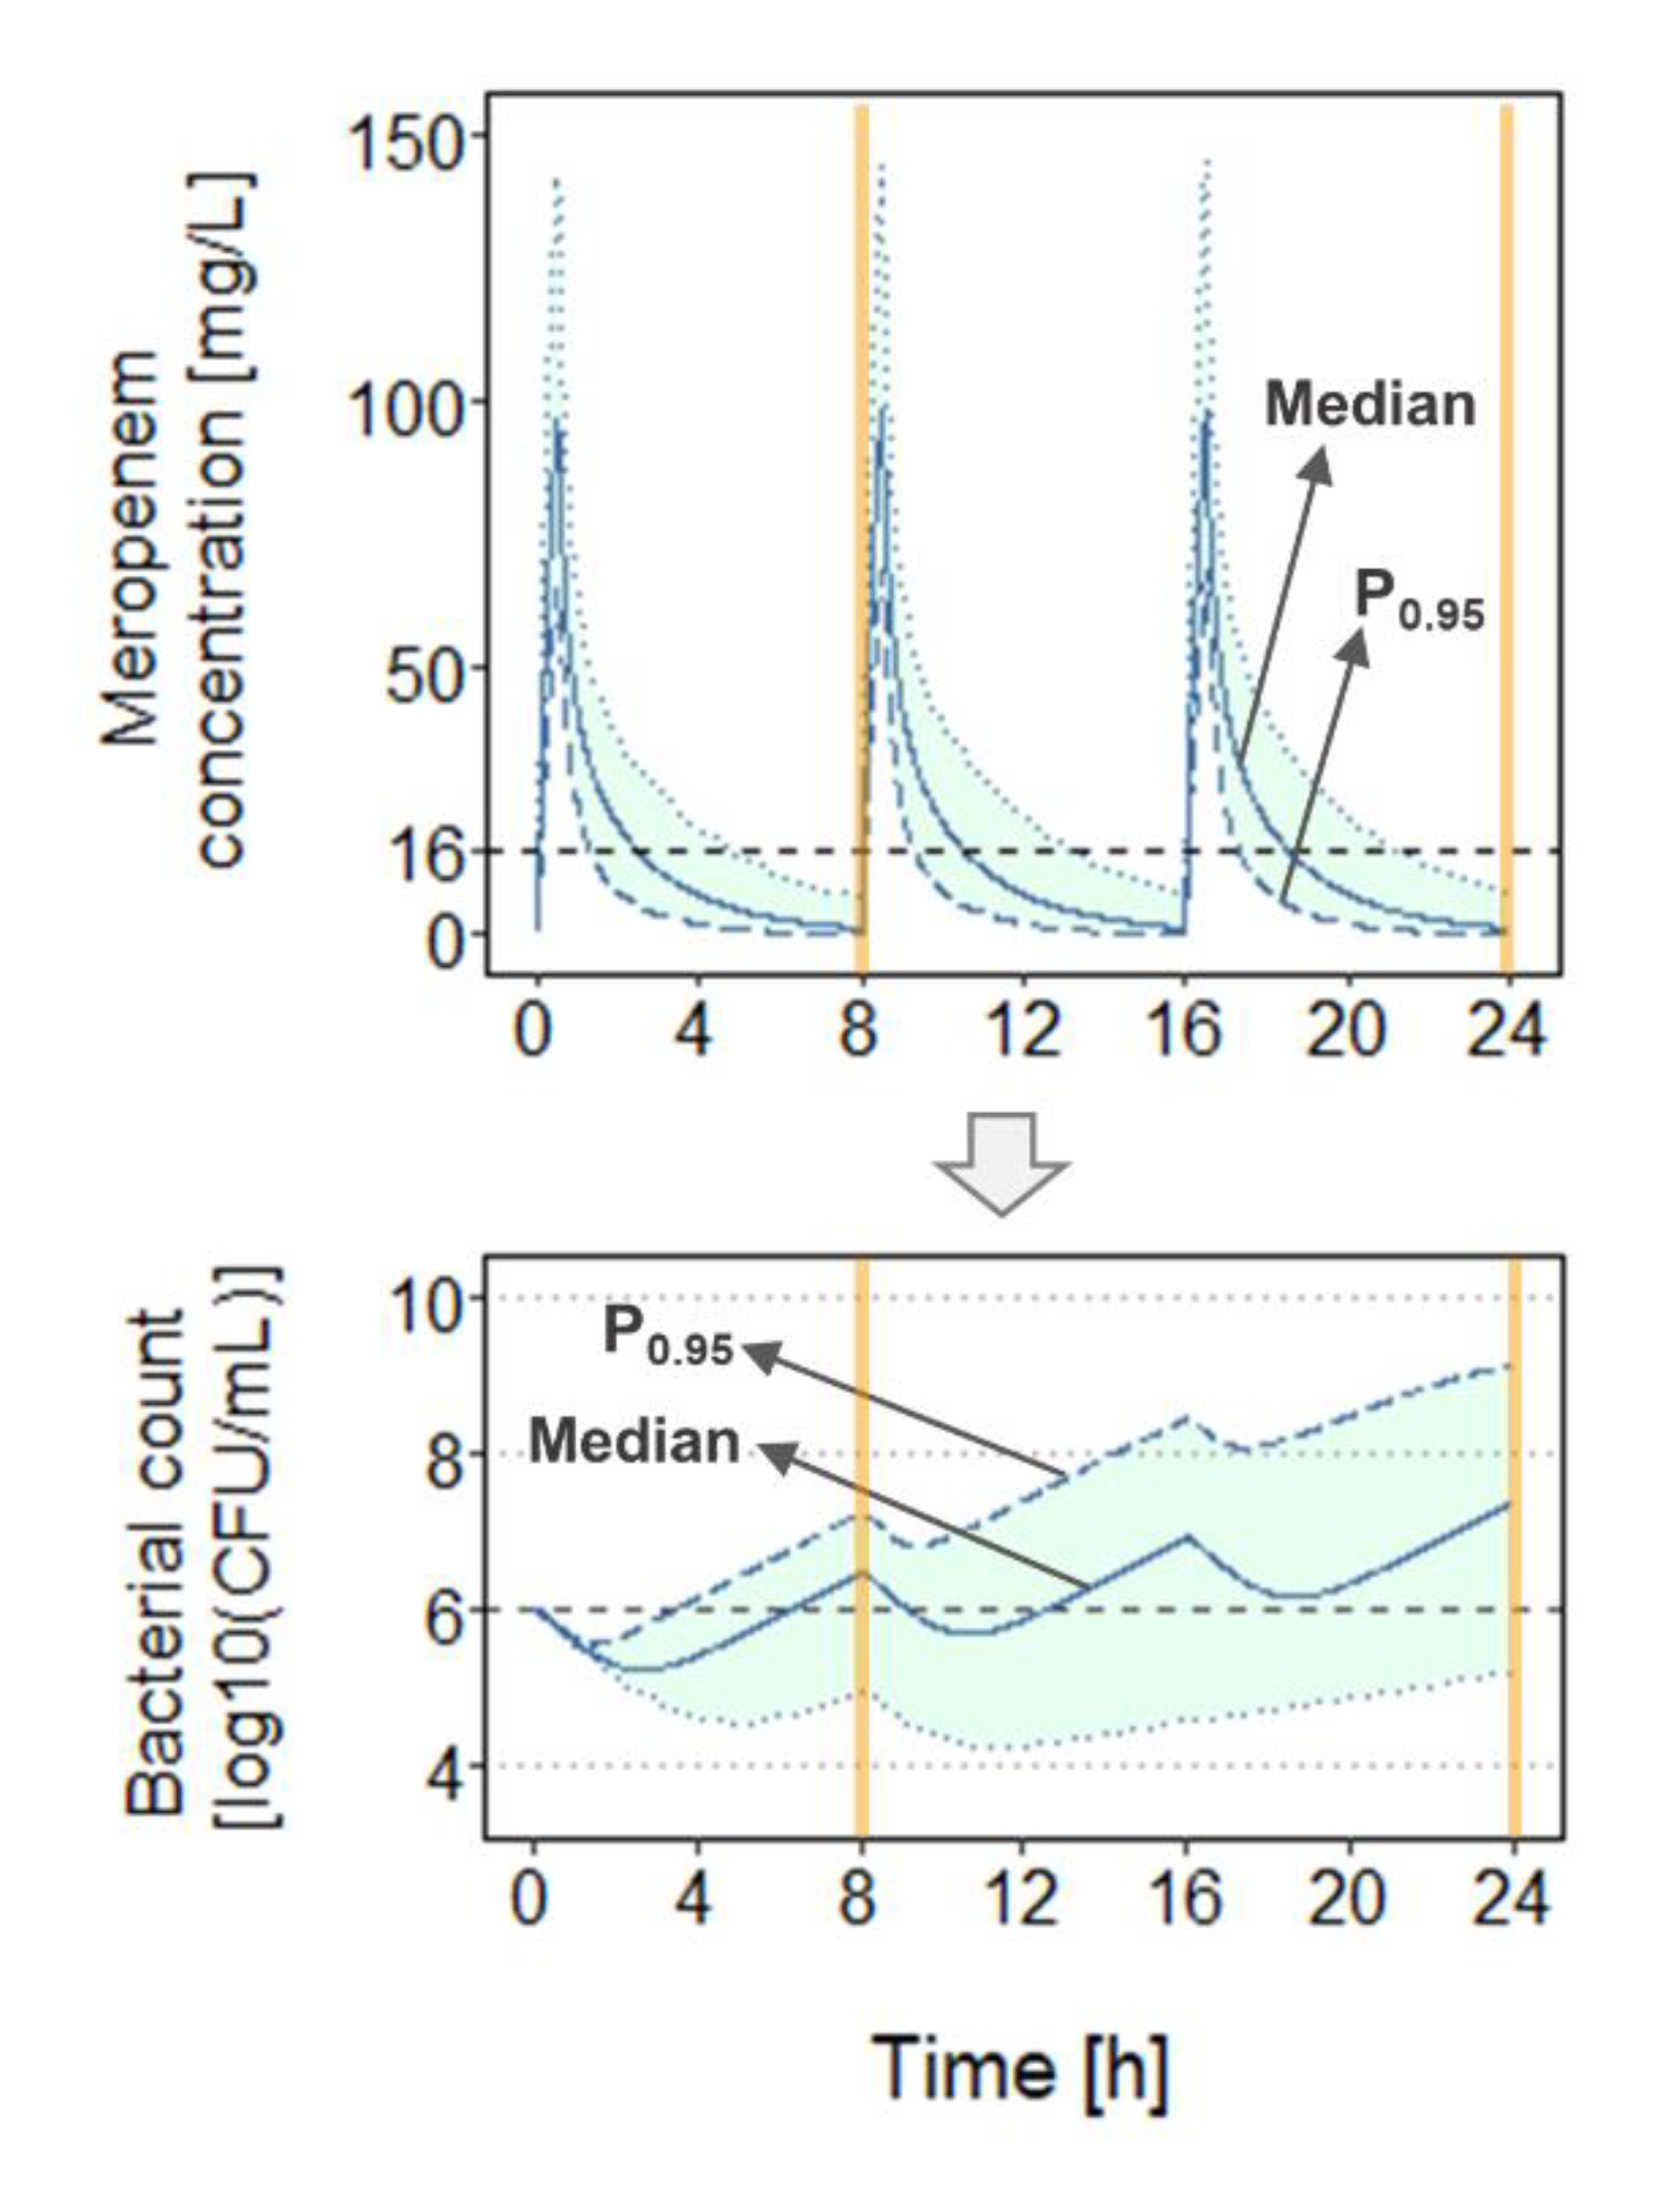
For each scenario, total bacterial load (B
tot) and
fT
>MIC were determined at 8 h and 24 h after start of dosing (
Figure 3) for ten dosage regimens, i.e., total daily doses (TDD) of 3000 mg and 6000 mg, each administered as 0.5-h (0.5h
TDD3000mg = 0.5h
1000mg every 8 h (q8h), or 0.5h
TDD6000mg = 0.5h
2000mg q8h), as 3-h (3h
TDD3000mg or 3h
TDD6000mg), or continuous infusion over 24 h without (CI
3000mg, CI
6000mg) or with a loading dose (500 mg or 1000 mg as 0.5-h infusion: CI
3000mg + LD
500mg, CI
3000mg + LD
1000mg, CI
6000mg + LD
500mg, CI
6000mg + LD
1000mg). In this work, dosage regimens involving a TDD of 6000 mg (or higher in case of a loading dose) will be referred to as ‘high-dose’ regimens and schemes involving a TDD of 3000 mg as ‘low-dose’ regimens. Continuous-infusion regimens including a loading dose were simulated as usually handled in clinical practice, i.e., with continuous infusion starting directly after the first short infusion (loading dose) with a constant target rate. The present study adopted
fT
>MIC > 50% as a clinical target for efficacy [
13] and bacteriostasis as a criterion for evaluating bacterial growth and kill. Simulations (
n = 1000 for each scenario) were conducted considering between-patient pharmacokinetic variability and using R3.6.1 (mrgsolve package) [
47]. For each abovementioned scenario, the median and the 95th percentile (P
0.95) of the concentration-time profiles (and
fT
>MIC values), as well as of the bacterial count-time profiles (and B
tot values) were investigated (
Figure 3). P
0.95 was chosen not least as the 95th percentile of a study population is commonly used in simulations underlying the probability of target attainment (PTA) analyses to determine efficacious antibiotic doses.


