
Infections in G6PD-Deficient Hospitalized Patients—Prevalence, Risk Factors, and Related Mortality

 , ,
, ,
Abstract
:1. Introduction
2. Methods
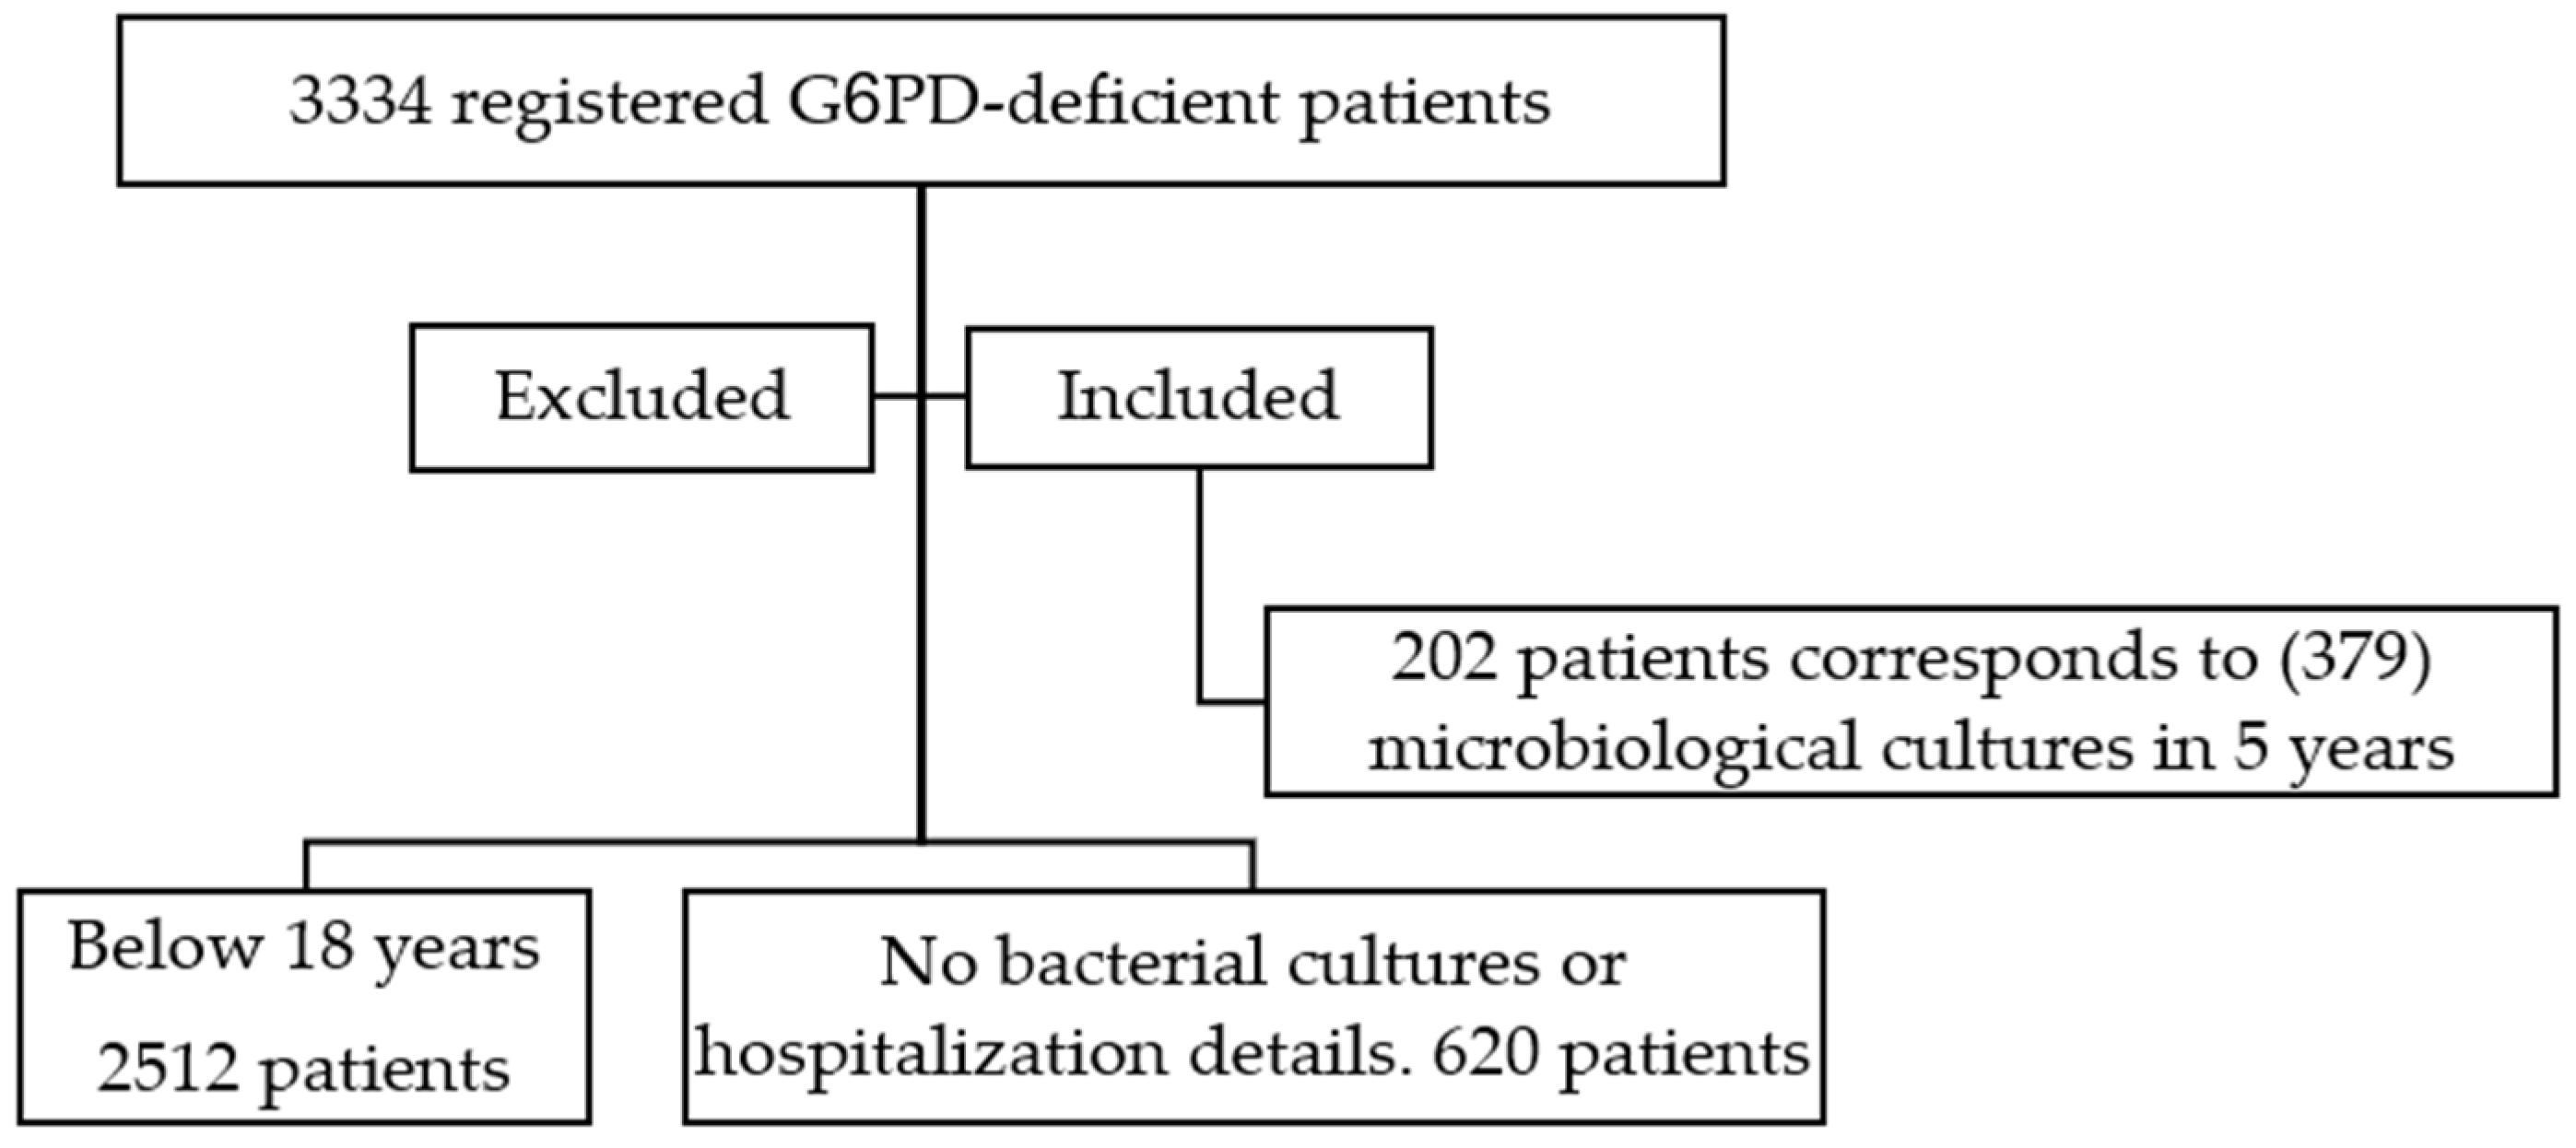
2.1. Study Population
2.2. Definitions
2.3. Statistical Analysis
3. Results
3.1. Patients’ Demographics
3.2. Infection Patterns
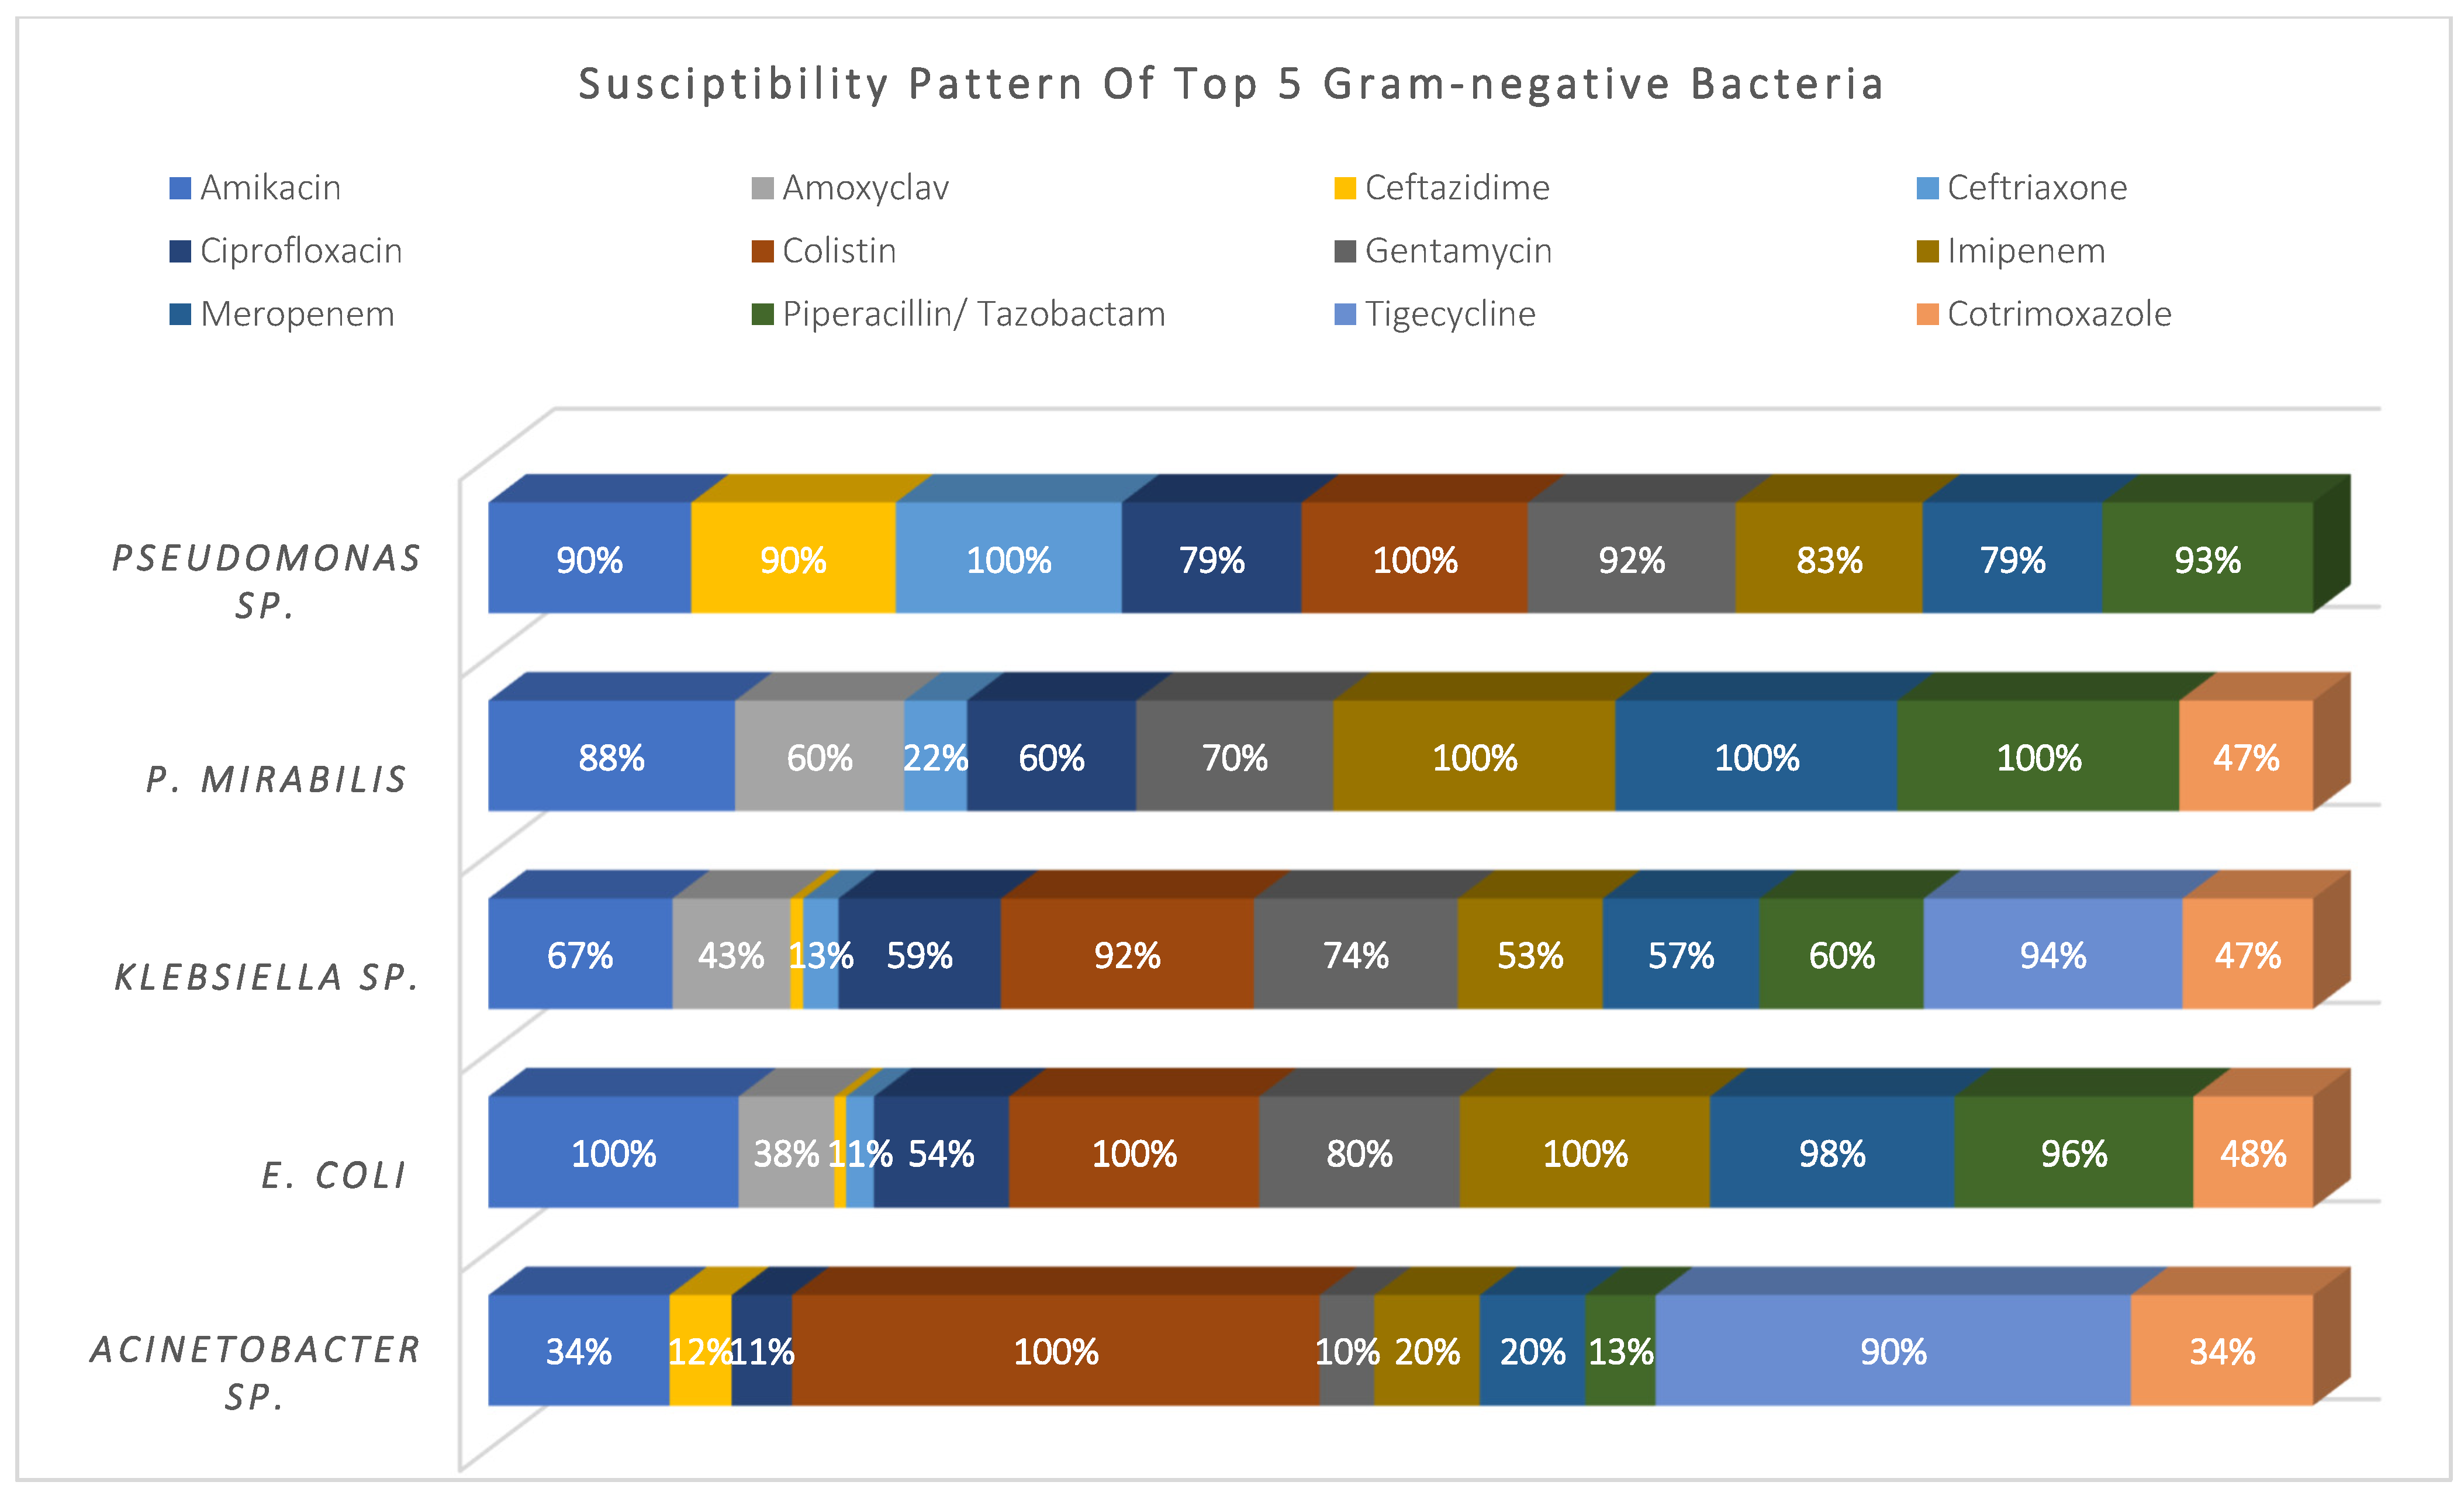
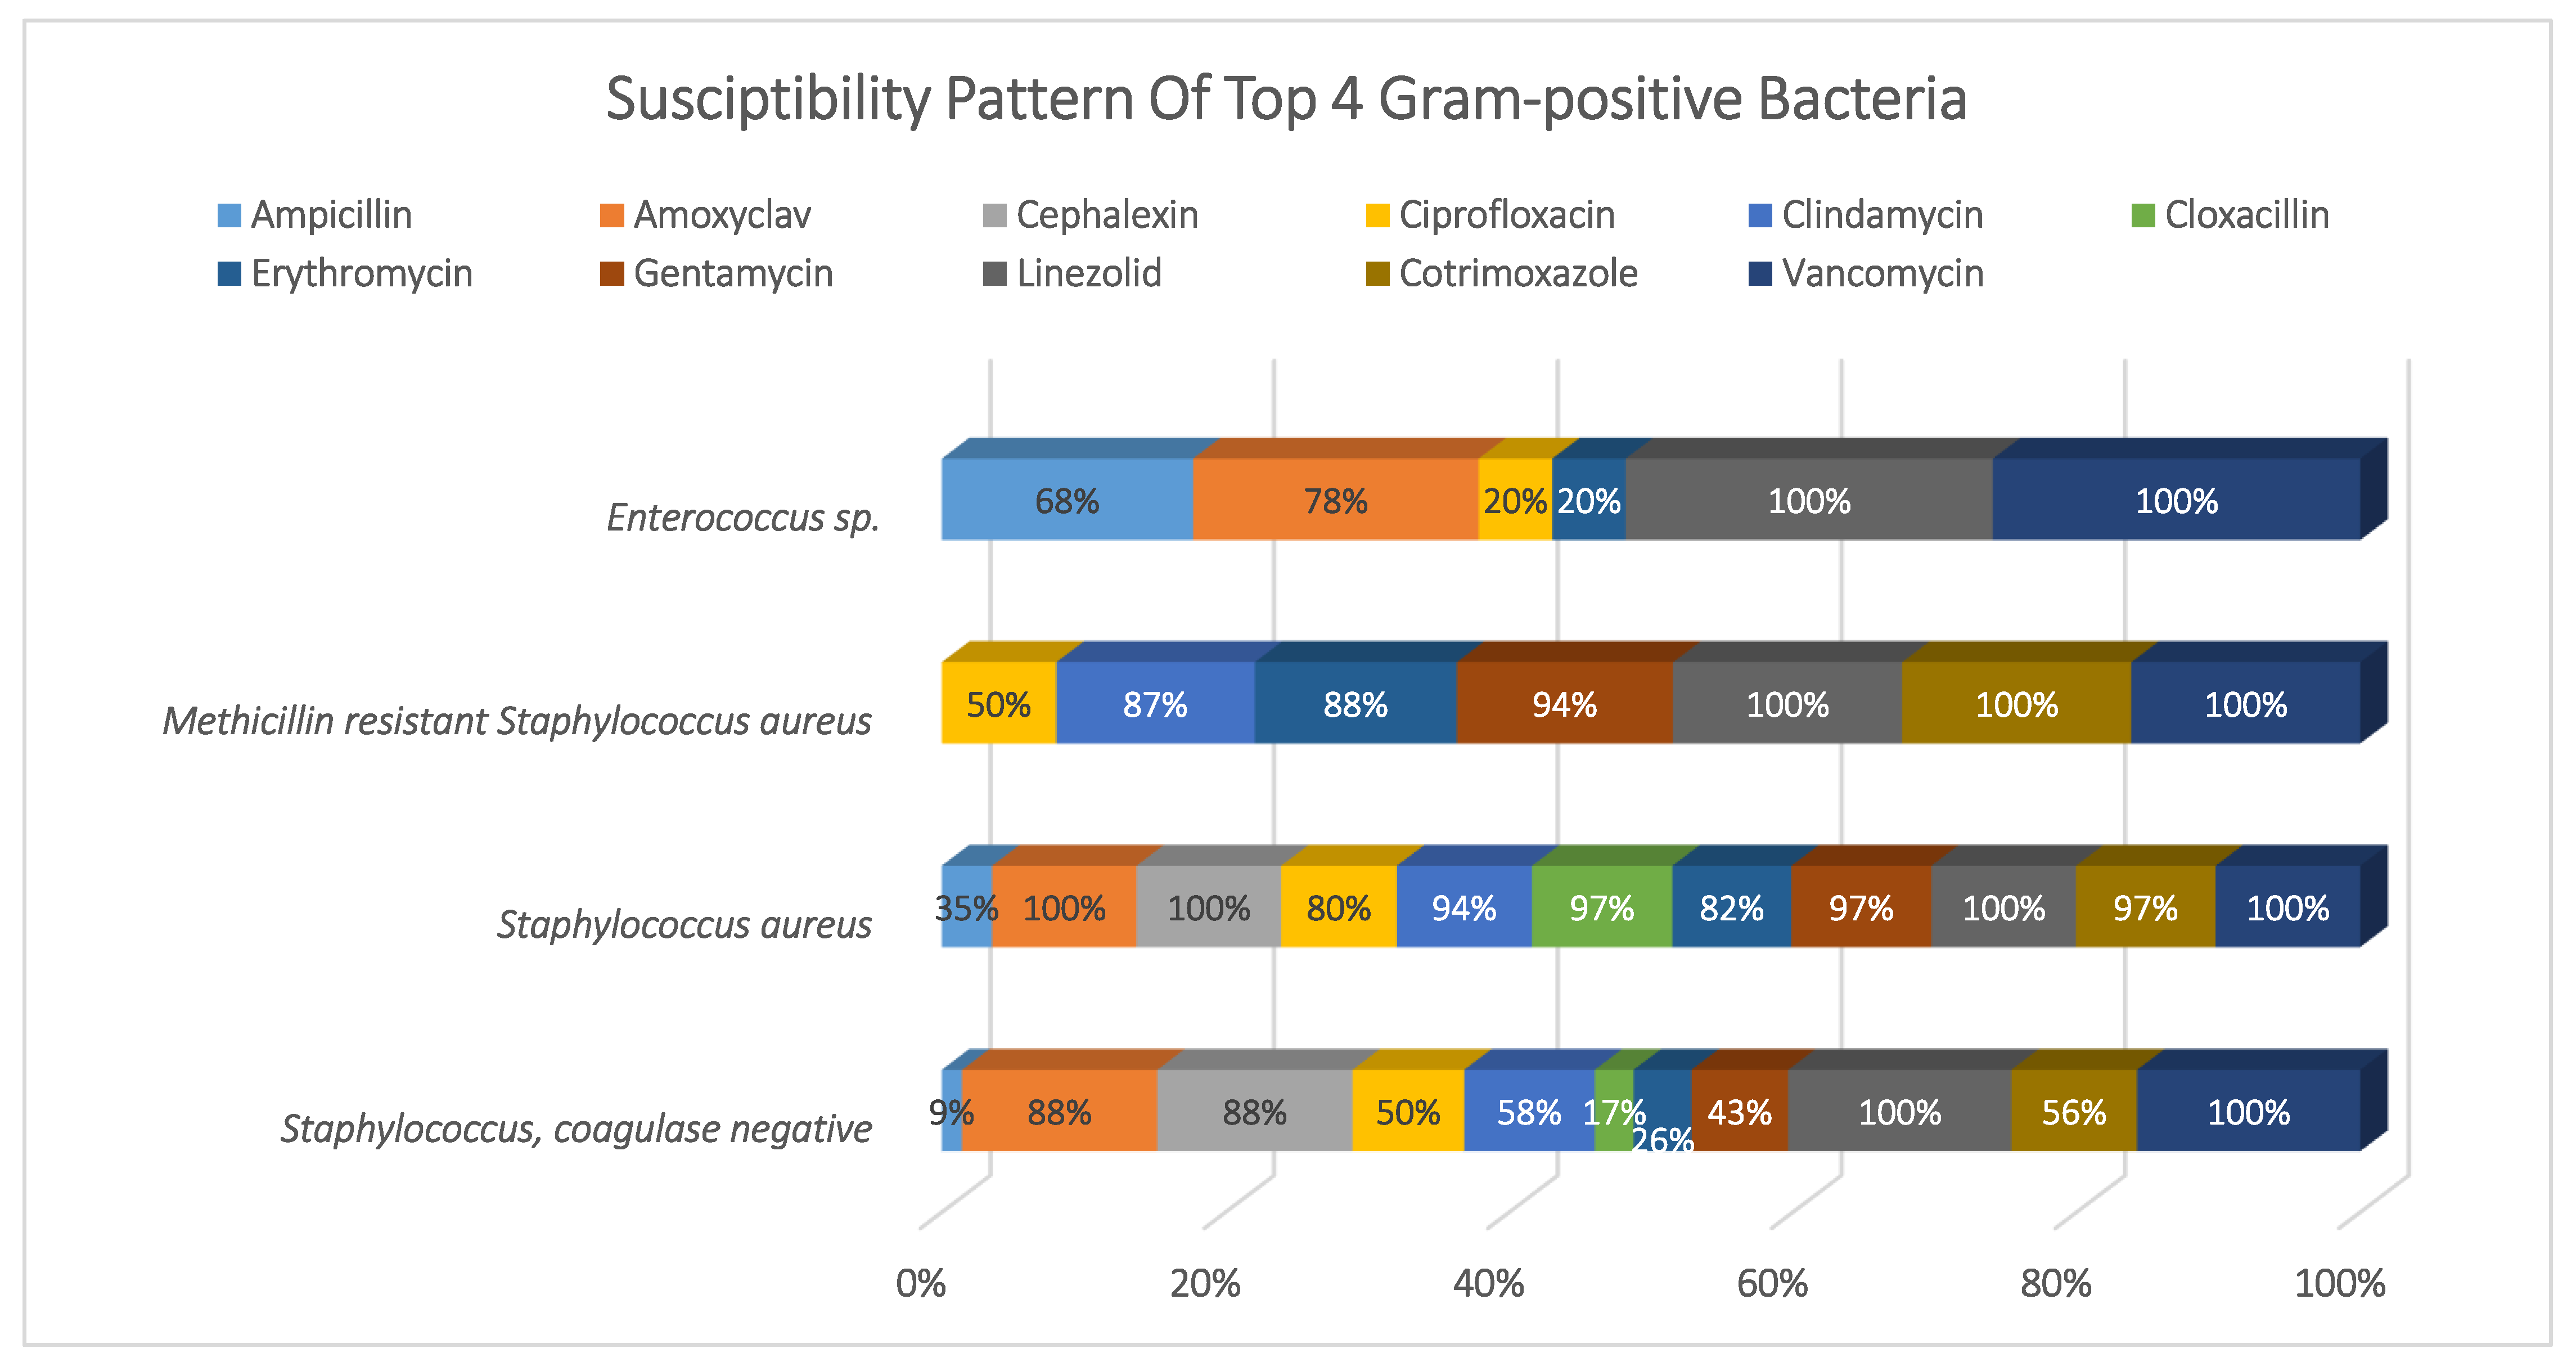
3.3. Susceptibility Pattern
3.4. Antimicrobial Treatment
3.5. MDR-Related Infections
3.6. Hospital-Acquired Infections (HAIs)
3.7. Fourteen-Day Mortality Risk Factors
3.8. Twenty-Eight-Day Mortality Risk Factors
4. Discussion
4.1. Risk Factors for MDR-Related Infections
4.2. Risk Factors for HAI
4.3. Risk Factors for Mortality
5. Conclusions
Author Contributions
Funding
Institutional Review Board Statement
Informed Consent Statement
Data Availability Statement
Conflicts of Interest
Abbreviations
| BU | Burn unit |
| CAIs | Community-acquired infections |
| CCD | Chronic cardiac diseases |
| CCU | Cardiac care unit |
| CI | Confidence intervals |
| CLSI | Clinical And Laboratory Standards Institute |
| CoNS | Staphylococcus, coagulase-negative |
| CRD | Chronic respiratory disease |
| CRE | Carbapenem-resistant Enterobacterales |
| CRF | Chronic renal failure |
| CRP | C-reactive protein |
| DM | Diabetes mellitus |
| ESBL | Extended-spectrum β-lactamase bacteria |
| G6PD | Glucose-6-phosphate dehydrogenase |
| HAIs | Hospital-acquired infections |
| ICU | Intensive care unit |
| IQR | Interquartile ranges |
| LMWH | Low molecular weight heparin |
| LOS | Length of stay |
| MDR | Multidrug-resistant |
| MRSA | Methicillin-resistant Staphylococcus aureus |
| NADP | Nicotinamide adenine dinucleotide phosphate |
| NETs | Neutrophil extracellular traps |
| OR | Odds ratio |
| p | Probability value |
| RBCs | Red blood cells |
| ROS | Reactive oxygen species |
| SARS-CoV-2 | Severe acute respiratory syndrome coronavirus 2019 |
| WBC | White blood cell count |
Appendix A

| Included (n = 379) | N (%) | Hospital-Acquired Infections (n = 167) | MDR Infection (n = 153) | ||||
|---|---|---|---|---|---|---|---|
| N (%) | p OR | CI | N % | p Value OR | CI | ||
| Gender | |||||||
| Male | 265 69.9% | 109 65.3% | 0.67 | (0.43, 1.05) | 101 66.0% | 0.173 0.73 | (0.47, 1.14) |
| Female | 114 30.1% | 58 34.7% | 0.080 1.48 | (0.95, 2.30) | 52 34.0% | 1.36 | (0.87, 2.12) |
| Age on admission-Median (IQR) | 59.9 (41–77) | 59 (36.5–77) | 0.399 1.00 | (0.99, 1.01) | 63 (41–77) | 0.848 1.00 | (0.99, 1.01) |
| ≤ 60 Years | 190 50.1% | 86 51.5% | 0.637 1.10 | (0.74, 1.65) | 73 47.7% | 0.438 0.85 | (0.56, 1.28) |
| > 60 years | 189 49.9% | 81 48.5% | 0.91 | (0.60, 1.36) | 80 52.3% | 1.18 | (0.78, 1.77) |
| Length of stay (LOS) Median (IQR) | 12 (5–31) | 34 (17–60) | 0.000 1.10 | (1.08, 1.13) | 22 (8–41.5) | 0.000 1.01 | (1.01, 1.02) |
| ≤ 14 days | 184 48.5% | 28 16.8% | 0.05 | (0.03, 0.09) | 59 38.6% | 0.42 | (0.27, 0.63) |
| > 14 days | 195 51.5% | 139 83.2% | 0.000 18.42 | (10.92, 31.07) | 94 61.4% | 0.000 2.41 | (1.58, 3.67) |
| Admission Diagnosis | |||||||
| Infectious disease diagnosis | 273 72.0% | 115 68.9% | 0.223 0.76 | (0.48, 1.19) | 113 73.9% | 0.515 1.17 | (0.74, 1.85) |
| Non-infectious diagnosis | 106 28.0% | 52 31.1% | 1.32 | (0.84, 2.08) | 40 26.1% | 0.86 | (0.54, 1.36) |
| Discharge outcome | |||||||
| Death | 105 27.7% | 73 43.7% | 0.000 4.37 | (2.69, 7.09) | 47 30.7% | 0.281 1.28 | (0.81, 2.02) |
| Recovery | 274 72.3% | 94 56.3% | 0.23 | (0.14, 0.37) | 106 69.3% | 0.78 | (0.49, 1.23) |
| Time to death | |||||||
| 14-day mortality | 55 52.4% | 33 19.8% | 0.011 2.13 | (1.19, 3.81) | 21 13.7% | 0.721 0.90 | (0.50, 1.62) |
| 28-day mortality | 22 21.0% | 14 8.4% | 0.063 2.33 | (0.95, 5.70) | 9 5.9% | 0.952 1.02 | (0.43, 2.46) |
| >28-day mortality | 28 26.7% | 26 15.6% | 0.000 19.36 | (4.52, 82.87) | 17 11.1% | 0.026 2.44 | (1.11, 5.37) |
| Admission ward | |||||||
| Critical care area | 117 30.9% | 94 56.3% | 0.000 10.58 | (6.23, 17.98) | 64 41.8% | 0.000 2.35 | (1.50, 3.66) |
| Medical ward | 146 38.5% | 42 25.1% | 0.000 0.35 | (0.22, 0.54) | 50 32.7% | 0.055 0.66 | (0.43, 1.01) |
| Surgical ward | 116 30.6% | 31 18.6% | 0.000 0.34 | (0.21, 0.55) | 39 25.5% | 0.076 0.66 | (0.42, 1.04) |
| Underlying Comorbid conditions | |||||||
| Number of comorbid conditions Median (IQR) | 3 (2–4) | 3 (2–4) | 0.010 1.21 | (1.05, 1.40) | 2 (0–3) | 0.032 1.17 | (1.01, 1.36) |
| Any comorbidity | 338 89.2% | 149 89.2% | 0.982 1.01 | (0.52, 1.94) | 139 90.8% | 0.391 1.35 | (0.68, 2.66) |
| Chronic Cardiac Diseases | 282 83.4% | 137 82.0% | 0.003 2.11 | (1.29, 3.44) | 124 81.0% | 0.016 1.84 | (1.12, 3.02) |
| Diabetes | 254 75.1% | 104 62.3% | 0.082 0.68 | (0.44, 1.05) | 99 64.7% | 0.431 0.84 | (0.54, 1.29) |
| Chronic renal failure | 228 67.5% | 108 64.7% | 0.112 1.40 | (0.92, 2.13) | 100 65.4% | 0.089 1.44 | (0.95, 2.21) |
| Others | 179 53.0% | 87 52.1% | 0.093 1.42 | (0.94, 2.13) | 79 51.6% | 0.158 1.35 | (0.89, 2.03) |
| Chronic Resp. Disease | 70 20.7% | 43 25.7% | 0.001 2.38 | (1.39, 4.05) | 34 22.2% | 0.123 1.51 | (0.89, 2.54) |
| Immuno-suppressed | 24 7.1% | 15 9.0% | 0.066 2.23 | (0.95, 5.22) | 9 5.9% | 0.767 0.88 | (0.37, 2.06) |
| Sickle Cell | 19 5.6% | 3 1.8% | 0.019 0.22 | (0.06, 0.78) | 7 4.6% | 0.748 0.86 | (0.33, 2.22) |
| Active malignancy | 14 4.1% | 9 5.4% | 0.131 2.36 | (0.78, 7.17) | 5 3.3% | 0.718 0.81 | (0.27, 2.48) |
| HIV follow-up | 1 0.3% | 0 0.0% | 0.970 ** | ** | 0 0.0% | 0.970 ** | ** |
| Other Risk Factors | |||||||
| Invasive procedure during admission | 285 75.2% | 137 82.0% | 0.000 8.15 | (4.26, 15.59) | 101 66.0% | 0.150 1.43 | (0.88, 2.33) |
| Need for blood transfusion | 212 55.9% | 155 92.8% | 0.000 8.34 | (5.14, 13.55) | 121 79.1% | 0.001 2.01 | (1.37, 3.08) |
| Surgery 90-day history | 39 10.3% | 15 9.0% | 0.458 0.77 | (0.39, 1.53) | 15 9.8% | 0.798 0.91 | (0.46, 1.81) |
| Medication | |||||||
| Analgesics | 283 74.7% | 131 78.4% | 0.135 1.44 | (0.89, 2.31) | 115 75% | 0.856 1.04 | (0.65, 1.68) |
| Proton pump inhibitor | 269 71.0% | 143 85.6% | 0.000 4.07 | (2.44, 6.79) | 116 76% | 0.088 1.50 | (0.94, 2.38) |
| Heparin/LMWH | 241 63.6% | 138 82.6% | 0.000 5.04 | (3.12, 8.16) | 114 75% | 0.000 2.28 | (1.45, 3.57) |
| Diuretics | 206 54.4% | 108 64.7% | 0.000 2.13 | (1.40, 3.23) | 94 61% | 0.023 1.62 | (1.07, 2.467) |
| Cortico-steroids | 124 32.7% | 79 47.3% | 0.000 3.33 | (2.13, 5.21) | 52 34% | 0.665 1.10 | (0.71, 1.70) |
| Inotropes | 123 32.5% | 78 46.7% | 0.000 1.40 | (0.92, 2.13) | 54 35% | 0.332 1.24 | (0.80, 1.92) |
| Vasodilators | 104 27.4% | 59 35.3% | 0.002 2.03 | (1.28, 3.20) | 37 24% | 0.243 0.76 | (0.47, 1.21) |
| Albumin | 66 17.4% | 45 26.9% | 0.000 3.25 | (2.08, 5.09) | 24 16% | 0.466 0.8151 | (0.47, 1.41) |
| Culture sample type | |||||||
| Skin and soft tissue | 103 27.2% | 30 18.0% | 0.747 0.93 | (0.59, 1.46) | 35 22.9% | 0.122 0.69 | (0.43, 1.11) |
| Urine | 96 25.3% | 0 0.0% | 0.264 1.30 | (0.82, 2.07) | 47 30.7% | 0.048 1.60 | (1.00, 2.55) |
| Respiratory | 91 24.0% | 46 27.5% | 0.154 1.41 | (0.88, 2.26) | 33 21.6% | 0.360 0.80 | (0.49, 1.29) |
| Blood | 88 23.2% | 44 26.3% | 0.033 0.58 | (0.35, 0.96) | 38 24.8% | 0.540 1.16 | (0.72, 1.89) |
| Body fluids | 1 0.3% | 47 28.1% | ** ** | ** | 0 0.0% | ** ** | ** |
| Organism causing infections | |||||||
| Gram-positive bacteria | 107 28.2% | 28 16.8% | 0.000 0.34 | (0.21, 0.55) | 38 24.8% | 0.195 0.74 | (0.46, 1.17) |
| Gram-negative bacteria | 227 59.9% | 123 73.7% | 0.000 2.90 | (1.88, 4.49) | 115 75.2% | 0.000 3.08 | (1.96, 4.83) |
| Fungal | 31 8.2% | 15 9.0% | 0.613 1.21 | (0.58, 2.52) | ** ** | ** ** | ** |
| SARS-CoV-19 | 14 3.7% | 1 0.6% | 0.022 0.09 | (0.01, 0.71) | ** ** | ** ** | ** |
| Resistant Phenotype for bacterial infections (n-334) | |||||||
| Sens | 181 54.2% | 76 45.5% | 0.000 0.35 | (0.23, 0.53) | ** ** | ** ** | ** |
| MDR | 67 20.1% | 48 28.7% | 0.000 4.10 | (2.29, 7.31) | 67 43.8% | ** ** | ** |
| ESBL | 50 15.0% | 25 15.0% | 0.365 1.32 | (0.73, 2.39) | 50 32.7% | ** ** | ** |
| CRE | 24 7.2% | 17 10.2% | 0.008 3.32 | (1.34, 8.20) | 24 15.7% | ** ** | ** |
| MRSA | 12 3.6% | 1 0.6% | 0.035 0.11 | (0.01, 0.86) | 12 7.8% | ** ** | ** |
| Place of Acquisition | |||||||
| Community | 212 55.9% | ** ** | ** ** | ** | 62 40.5% | 0.35 | (0.23, 0.53) |
| Hospital | 167 44.1% | ** ** | ** ** | ** | 91 59.5% | 0.000 2.90 | (1.89, 4.43) |
| 90 days ocurrence of any infection | 136 35.9% | 61 36.5% | 0.817 1.05 | (0.69, 1.60) | 59 38.6% | 0.371 1.21 | (0.79, 1.86) |
| Prior exposure to antimicrobials | 158 41.7% | 60 35.9% | 0.044 0.65 | (0.43, 0.99) | 69 45.1% | 0.268 1.26 | (0.83, 1.92) |
| 90-day exposure to Cephalosporins | 105 66.5% | 32 19.2% | 0.001 0.45 | (0.28, 0.73) | 46 30.1% | 0.398 1.22 | (0.77, 1.92) |
| 90-day exposure to B-lactams | 70 44.3% | 34 20.4% | 0.203 1.44 | (0.82, 2.52) | 32 20.9% | 0.314 1.31 | (0.78, 2.21) |
| 90-day exposure to Quinolones | 64 40.5% | 25 15.0% | 0.377 0.78 | (0.45, 1.35) | 32 20.9% | 0.087 1.60 | (0.93, 2.75) |
| 90-day exposure to B-lactam/B-lactamase | 58 36.7% | 30 18.0% | 0.203 1.44 | (0.82, 2.52) | 27 17.6% | 0.298 1.35 | (0.77, 2.37) |
| 90-day exposure to Macrolides | 34 21.5% | 15 9.0% | 0.995 1.00 | (0.49, 2.04) | 19 12.4% | 0.057 1.99 | (0.98, 4.06) |
| 90-day exposure to Glycopeptides | 33 20.9% | 7 4.2% | 0.008 0.31 | (0.13, 0.74) | 17 11.1% | 0.175 1.64 | (0.80, 3.36) |
| 90-day exposure to Nitroimidazole | 29 18.4% | 18 10.8% | 0.046 2.21 | (1.01, 4.81) | 16 10.5% | 0.095 1.91 | (0.89, 4.10) |
| 90-day exposure to Aminoglycosides | 25 15.8% | 4 2.4% | 0.007 0.22 | (0.08, 0.66) | 8 5.2% | 0.380 0.68 | (0.29, 1.61) |
| 90-day exposure to Tetracyclines | 19 12.0% | 2 1.2% | 0.009 0.14 | (0.03, 0.61) | 8 5.2% | 0.874 1.08 | (0.42, 2.75) |
| 90-day exposure to Glycylcycline | 3 1.9% | 1 0.6% | 0.709 0.63 | (0.06, 7.04) | 2 1.3% | 0.374 2.98 | (0.27, 33.16) |
| 90-day exposure to Oxazolidinones | 2 1.3% | 0 0.0% | ** ** | ** | 1 0.7% | 0.782 1.48 | (0.09, 23.85) |
| 90-day exposure to Colistin | 1 0.6% | 0 0.0% | ** ** | ** | 0 ** | ** ** | ** |
| Antimicrobial treatment | |||||||
| Monotherapy | 250 66.0% | 119 71.3% | 0.054 1.53 | (0.99, 2.37) | 92 60.1% | 0.65 | (0.42, 0.99) |
| Combined therapy | 129 34.0% | 48 28.7% | 0.65 | (0.42, 1.01) | 61 39.9% | 0.049 1.54 | (1.00, 2.37) |
| Cephalosporin-based therapy | 157 41.4% | 34 20.4% | 0.003 0.53 | (0.35, 0.81) | 46 30.1% | 0.000 0.45 | (0.29, 0.69) |
| B-lactam/B-lactamase inhibitor-based therapy | 131 34.6% | 35 21.0% | 0.781 1.06 | (0.69, 1.63) | 65 42.5% | 0.008 1.79 | (1.16, 2.75) |
| Pip/Taz based therapy | 99 26.1% | 31 18.6% | 0.206 1.35 | (0.85, 2.13) | 58 37.9% | 0.000 2.75 | (1.72, 4.41) |
| Quinolones-based therapy | 45 11.9% | 10 6.0% | 0.708 1.13 | (0.60, 2.10) | 17 11.1% | 0.706 0.88 | (0.47, 1.68) |
| Vancomycin-based therapy | 38 10.0% | 5 3.0% | 0.010 0.36 | (0.17, 0.78) | 16 10.5% | 0.818 1.08 | (0.55, 2.14) |
| B-lactam-based treatment | 37 9.8% | 10 6.0% | 0.105 1.76 | (0.89, 3.499) | 24 15.7% | 0.002 3.05 | (1.49, 6.19) |
| Tetracycline-based treatment | 30 7.9% | 7 4.2% | 0.111 0.52 | (0.23, 1.16) | 12 7.8% | 0.966 0.98 | (0.46, 2.11) |
| Macrolide-based treatment | 28 7.4% | 1 0.6% | 0.040 0.40 | (0.16, 0.96) | 7 4.6% | 0.091 0.47 | (0.19, 1.13) |
| Meropenem based therapy | 28 7.4% | 8 4.8% | 0.029 2.44 | (1.09, 5.44) | 22 14.4% | 0.000 6.16 | (2.43, 15.58) |
| Colistin-based therapy | 24 6.3% | 8 4.8% | 0.000 7.07 | (2.37, 21.13) | 20 13.1% | 0.000 8.35 | (2.79, 24.94) |
| Aminoglycosides-based therapy | 22 5.8% | 1 0.6% | 0.759 0.87 | (0.36, 2.09) | 9 5.9% | 0.958 1.02 | (0.43, 2.46) |
| Tigecycline-based therapy | 10 2.6% | 7 4.2% | 0.037 5.28 | (1.11, 25.22) | 8 5.2% | 0.022 6.18 | (1.29, 29.51) |
| Linezolid based therapy | 2 0.5% | 2 1.2% | ** ** | ** | 2 1.3% | ** ** | ** |
| 90-day previous infections | 87 23.0% | 30 18.0% | 0.934 0.98 | (0.60, 1.59) | 39 25.5% | 0.335 1.27 | (0.78, 2.06) |
| Gram-negative | 48 55.2% | 16 18.4% | 0.328 0.73 | (0.39, 1.37) | 21 13.7% | 0.610 1.17 | (0.64, 2.16) |
| Gram-positive | 34 39.1% | 10 11.5% | 0.474 0.77 | (0.37, 1.58) | 14 9.2% | 0.920 1.04 | (0.51, 2.12) |
| SARS-CoV-19 | 20 23.0% | 15 17.2% | 0.001 27.09 | (3.59, 204.55) | 14 9.2% | 0.009 3.69 | (1.39, 9.84) |
| Fungal | 4 4.6% | 2 2.3% | 0.810 1.27 | (0.18, 9.13) | 2 1.3% | 0.695 1.48 | (0.21, 10.65) |
| Concomitant infections | |||||||
| Polymicrobial infections (Yes) | 224 59.1% | 101 60.5% | 0.000 9.00 | (5.42, 14.95) | 99 64.7% | 0.068 1.48 | (0.97, 2.26) |
| Gram-negative | 169 75.4% | 90 53.9% | 0.000 7.60 | (4.81, 12.02) | 78 51.0% | 0.040 1.54 | (1.02, 2.33) |
| Gram-positive | 106 47.3% | 51 30.5% | 0.000 2.97 | (1.87, 4.73) | 50 32.7% | 0.094 1.47 | (0.94, 2.32) |
| Fungal | 59 26.3% | 24 14.4% | 0.000 3.85 | (2.10, 7.07) | 37 24.2% | 0.000 2.96 | (1.66, 5.26) |
| SARS-CoV-19 | 7 3.1% | 3 1.8% | 0.163 3.24 | (0.62, 16.92) | 3 2.0% | 0.892 1.11 | (0.24, 5.03) |
| Time between admission and sampling Median (IQR) | 2 (0–15) | 17 (10–29) | 0.000 52.51 | (14.02, 196.66) | 7 (1–25.5) | 0.000 1.03 | (1.01, 1.03) |
| Included (n = 379) | 14-Day Mortality (n = 55) | 28-Day Mortality (n = 22) | |||||
|---|---|---|---|---|---|---|---|
| N (%) | N (%) | p OR | CI | N (%) | p OR | CI | |
| Gender | |||||||
| Male | 265 69.9% | 51 92.7% | 0.000 6.55 | (2.31, 18.60) | 16 73% | 0.768 1.16 | (0.44, 3.04) |
| Female | 114 30.1% | 4 7.3% | 0.15 | (0.05, 0.43) | 6 27% | 0.86 | (0.33, 2.27) |
| Age on admission-Median (IQR) | 59.9 (41–77) | 74 (65.81.5) | 0.000 1.04 | (1.02, 1.06) | 78 (69.4–84.2) | 0.000 1.05 | (1.02, 1.09) |
| ≤60 Years | 190 50.1% | 10 18.2% | 0.18 | (0.09, 0.37) | 3 14% | 0.14 | (0.04, 0.49) |
| >60 years | 189 49.9% | 45 81.8% | 0.000 5.63 | (2.74, 11.55) | 19 86% | 0.002 6.97 | (2.03, 23.95) |
| Length of stay (LOS) Median (IQR) | 12 (5–31) | 15 (4–22) | 0.043 0.99 | (0.97, 0.99) | 33 (26–39.3) | 0.021 1.01 | (1.00, 1.02) |
| ≤14 days | 184 48.5% | 27 49.1% | 0.90 | (0.51, 1.59) | 0 0% | ** ** | ** |
| >14 days | 195 51.5% | 28 50.9% | 0.705 1.12 | (0.63, 1.99) | 22 100% | ** ** | ** |
| Admission Diagnosis | |||||||
| Infectious disease diagnosis | 273 72.0% | 43 78.2% | 0.274 1.46 | (0.74, 2.90) | 19 86% | 0.136 2.57 | (0.74, 8.87) |
| Non-infectious diagnosis | 106 28.0% | 12 21.8% | 0.68 | (0.35, 1.35) | 3 14% | 0.39 | (0.11, 1.34) |
| Admission ward | |||||||
| Critical care area | 117 30.9% | 26 47.3% | 0.005 2.30 | (1.28, 4.11) | 8 36% | 0.566 1.30 | (0.53, 3.19) |
| Medical ward | 146 38.5% | 27 49.1% | 0.084 1.66 | (0.93, 2.95) | 14 64% | 0.017 2.98 | (1.22, 7.29) |
| Surgical ward | 116 30.6% | 2 3.6% | 0.000 0.07 | (0.02, 0.29) | 0 0% | ** ** | ** |
| Underlying Comorbid conditions | |||||||
| Number of comorbid conditions Median (IQR) | 3 (2–4) | 3 (2–4) | 0.000 1.54 | (1.22, 1.95) | 2 (2.8–4) | 0.003 1.72 | (1.19, 2.48) |
| Any comorbidity | 338 89.2% | 54 98.2% | 0.000 1.54 | (1.22, 1.95) | 22 100% | ** ** | ** |
| Chronic Cardiac Diseases | 282 83.4% | 49 89.1% | 0.010 3.19 | (1.32, 7.7025) | 20 91% | 0.086 3.63 | (0.83, 15.81) |
| Diabetes | 254 75.1% | 38 69.1% | 0.724 1.12 | (0.60, 2.07) | 19 86% | 0.059 3.29 | (0.95, 11.33) |
| Chronic renal failure | 228 67.5% | 43 78.2% | 0.004 2.69 | (1.37, 5.30) | 17 77% | 0.100 2.35 | (0.85, 6.52) |
| Others | 179 53.0% | 35 63.6% | 0.009 2.19 | (1.21, 3.95) | 13 59% | 0.255 1.66 | (0.69, 3.99) |
| Chronic Resp. Disease | 70 20.7% | 12 21.8% | 0.490 1.28 | (0.64, 2.58) | 11 50% | 0.000 5.05 | (2.09, 12.19) |
| Immuno-suppressed | 24 7.1% | 7 12.7% | 0.042 2.63 | (1.04, 6.68) | 1 5% | 0.724 0.69 | (0.09, 5.37) |
| Sickle Cell | 19 5.6% | 1 1.8% | 0.265 0.31 | (0.04, 2.41) | 0 0% | ** ** | ** |
| Active malignancy | 14 4.1% | 6 10.9% | 0.005 4.84 | (1.61, 14.54) | 1 5% | 0.828 1.26 | (0.16, 10.10) |
| HIV follow-up | 1 0.3% | 1 1.8% | ** ** | ** | 0 0% | ** ** | ** |
| Other Risk Factors | |||||||
| Invasive procedure during admission | 285 75.2% | 53 96.4% | 0.001 10.51 | (2.51, 44.01) | 22 100% | ** ** | ** |
| Need for blood transfusion | 212 55.9% | 36 65.5% | 0.126 1.59 | (0.88, 2.89) | 20 91% | 0.004 8.59 | (1.98, 37.32) |
| Surgery 90-day history | 39 10.3% | 4 7.3% | 0.429 0.65 | (0.22, 1.90) | 0 0% | ** ** | ** |
| Medication | |||||||
| Analgesics | 283 74.7% | 39 70.9% | 0.489 0.80 | (0.42, 1.51) | 13 59% | 0.090 0.47 | (0.19, 1.13) |
| Proton pump inhibitor | 269 71.0% | 47 85.5% | 0.013 2.70 | (1.23, 5.92) | 22 100% | ** ** | ** |
| Heparin/LMWH | 241 63.6% | 48 87.3% | 0.000 4.65 | (2.04, 10.60) | 22 100% | ** ** | ** |
| Diuretics | 206 54.4% | 37 67.3% | 0.040 1.89 | (1.03, 3.45) | 19 86% | 0.005 5.76 | (1.67, 19.80) |
| Cortico-steroids | 124 32.7% | 23 41.8% | 0.122 1.59 | (0.88, 2.85) | 8 36% | 0.708 1.19 | (0.48, 2.91) |
| Inotropes | 123 32.5% | 49 89.1% | 0.000 27.59 | (11.37, 66.95) | 20 91% | 0.000 24.66 | (5.66, 107.4) |
| Vasodilators | 104 27.4% | 19 34.5% | 0.204 1.48 | (0.81, 2.73) | 5 23% | 0.611 0.77 | (0.28, 2.13) |
| Albumin | 66 17.4% | 24 43.6% | 0.000 5.20 | (2.79, 9.70) | 7 32% | 0.074 2.36 | (0.92, 6.03) |
| Culture sample type | |||||||
| Skin and soft tissue | 103 27.2% | 6 10.9% | 0.005 0.29 | (0.12, 0.69) | 8 36% | 0.322 1.58 | (0.64, 3.88) |
| Urine | 96 25.3% | 13 23.6% | 0.755 0.90 | (0.46, 1.76) | 2 9% | 0.090 0.2798 | (0.06, 1.22) |
| Respiratory | 91 24.0% | 15 27.3% | 0.541 1.22 | (0.64, 2.34) | 7 32% | 0.380 1.52 | (0.60, 3.84) |
| Blood | 88 23.2% | 21 38.2% | 0.005 2.37 | (1.29, 4.35) | 5 23% | 0.955 0.97 | (0.35, 2.71) |
| Body fluids | 1 0.3% | 0 0.0% | ** ** | ** | 0 0% | ** ** | ** |
| Organism causing infections | |||||||
| Gram-positive bacteria | 107 28.2% | 17 30.9% | 0.634 1.16 | (0.62, 2.17) | 12 55% | 0.556 0.74 | (0.26, 2.05) |
| Gram-negative bacteria | 227 59.9% | 30 54.5% | 0.382 0.77 | (0.44, 1.38) | 5 23% | 0.599 0.79 | (0.33, 1.88) |
| Fungal | 31 8.2% | 5 9.1% | 0.790 1.15 | (0.42, 3.12) | 3 14% | 0.343 1.86 | (0.52, 6.65) |
| SARS-CoV-19 | 14 3.7% | 3 5.5% | 0.458 1.64 | (0.44, 6.08) | 2 9% | 0.186 2.88 | (0.60, 13.73) |
| Resistant Phenotype for bacterial infections (n-334) | |||||||
| Sens | 181 54.2% | 34 61.8% | 0.721 1.11 | (0.62, 2.00) | 13 59% | 0.958 0.98 | (0.41, 2.34) |
| MDR | 67 20.1% | 14 25.5% | 0.105 1.75 | (0.89, 3.43) | 5 23% | 0.524 1.40 | (0.50, 3.94) |
| ESBL | 50 15.0% | 3 5.5% | 0.079 0.34 | (0.10, 1.13) | 4 18% | 0.479 1.50 | (0.49, 4.64) |
| CRE | 24 7.2% | 3 5.5% | 0.773 0.83 | (0.24, 2.89) | 0 0% | ** ** | ** |
| MRSA | 12 3.6% | 1 1.8% | 0.543 0.53 | (0.07, 4.16) | 0 0% | ** ** | ** |
| Place of Acquisition | |||||||
| Community | 212 55.9% | 22 40.0% | 0.47 | (0.26, 0.84) | 8 36% | 0.43 | (0.18, 1.05) |
| Hospital | 167 44.1% | 33 60.0% | 0.011 2.13 | (1.19, 3.81) | 14 64% | 0.063 2.33 | (0.96, 5.70) |
| 90 days occurrence of any infection | 136 35.9% | ** ** | ** ** | ** | ** ** | ** ** | ** |
| Prior exposure to antimicrobials | 158 41.7% | 20 36.4% | 0.387 0.77 | (0.43, 1.39) | 14 64% | 0.037 2.59 | (1.06, 6.33) |
| 90 days exposure to Cephalosporins | 105 66.5% | 16 80.0% | 0.804 1.08 | (0.58, 2.04) | 11 79% | 0.020 2.80 | (1.17, 6.67) |
| 90 days exposure to B-lactams | 70 44.3% | 5 25.0% | 0.060 0.40 | (0.15, 1.04) | 9 64% | 0.008 3.36 | (1.37, 8.21) |
| 90 days exposure to quinolones | 64 40.5% | 8 40.0% | 0.617 0.81 | (0.36, 1.82) | 5 36% | 0.454 1.49 | (0.53, 4.18) |
| 90 days exposure to B-lactam/B-lactamase | 58 36.7% | 12 60.0% | 0.150 1.69 | (0.83, 3.47) | 8 57% | 0.007 3.51 | (1.40, 8.79) |
| 90 days exposure to Macrolides | 34 21.5% | 2 10.0% | 0.152 0.34 | (0.08, 1.48) | 6 43% | 0.004 4.41 | (1.60, 12.15) |
| 90 days exposure to Glycopeptides | 33 20.9% | 4 20.0% | 0.684 0.80 | (0.27, 2.37) | 0 0% | ** ** | ** |
| 90 days exposure to Nitroimidazole | 29 18.4% | 7 35.0% | 0.132 2.00 | (0.81, 4.94) | 3 21% | 0.286 2.01 | (0.56, 7.24) |
| 90 days exposure to Aminoglycosides | 25 15.8% | 4 20.0% | 0.827 1.13 | (0.37, 3.43) | 0 0% | ** ** | ** |
| 90 days exposure to Tetracyclines | 19 12.0% | 3 15.0% | 0.871 1.11 | (0.31, 3.95) | 0 0% | ** ** | ** |
| 90 days exposure to glycylcycline | 3 1.9% | 0 0.0% | ** ** | ** | 0 0% | ** ** | ** |
| 90 days exposure to Oxazolidinones | 2 1.3% | 0 0.0% | ** ** | ** | 0 0% | ** ** | ** |
| 90 days exposure to Colistin | 1 0.6% | 0 0.0% | ** ** | ** | 0 0% | ** ** | ** |
| Antimicrobial treatment | |||||||
| Monotherapy | 250 66.0% | 33 60.0% | 0.74 | (0.41, 1.33) | 16 73% | 0.492 1.40 | (0.54, 3.67) |
| Combined therapy | 129 34.0% | 22 40.0% | 0.314 1.35 | (0.75, 2.43) | 6 27% | 0.71 | (0.27, 1.87) |
| Cephalosporin-based therapy | 157 41.4% | 28 50.9% | 0.124 1.57 | (0.88, 2.78) | 8 36% | 0.620 0.80 | (0.33, 1.95) |
| B-lactam/B-lactamase inhibitor-based therapy | 131 34.6% | 23 41.8% | 0.223 1.44 | (0.80, 2.58) | 10 45% | 0.272 1.63 | (0.685, 3.87) |
| Pip/Taz based therapy | 99 26.1% | 16 29.1% | 0.588 1.19 | (0.63, 2.24) | 7 32% | 0.532 1.34 | (0.53, 3.40) |
| Quinolones-based therapy | 45 11.9% | 1 1.8% | 0.036 0.12 | (0.02, 0.87) | 1 5% | 0.296 0.34 | (0.04, 2.58) |
| Vancomycin-based therapy | 38 10.0% | 5 9.1% | 0.803 0.88 | (0.33, 2.37) | 4 18% | 0.199 2.11 | (0.68, 6.59) |
| B-lactam-based treatment | 37 9.8% | 4 7.3% | 0.503 0.69 | (0.24, 2.04) | 0 0% | ** ** | ** |
| Antifungal treatment | 31 8.2% | 5 9.1% | 0.790 1.15 | (0.42, 3.12) | 3 14% | 0.343 1.86 | (0.52, 6.65) |
| Tetracycline-based treatment | 30 7.9% | 2 3.6% | 0.219 0.40 | (0.09, 1.72) | 0 0% | ** ** | ** |
| Macrolide-based treatment | 28 7.4% | 8 14.5% | 0.033 2.59 | (1.08, 6.21) | 2 9% | 0.754 1.27 | (0.28, 5.75) |
| Meropenem based therapy | 28 7.4% | 3 5.5% | 0.555 0.69 | (0.20, 2.37) | 0 0% | ** ** | ** |
| Colistin-based therapy | 24 6.3% | 3 5.5% | 0.773 0.83 | (0.24, 2.89) | 2 9% | 0.587 1.52 | (0.33, 6.94) |
| Aminoglycosides-based therapy | 22 5.8% | 5 9.1% | 0.266 1.81 | (0.64, 5.11) | 1 5% | 0.795 0.76 | (0.09, 5.94) |
| Tigecycline-based therapy | 10 2.6% | 0 0.0% | ** ** | ** | 0 0% | ** ** | ** |
| Linezolid based therapy | 2 0.5% | 0 0.0% | ** ** | ** | 0 0% | ** ** | ** |
| 90-day previous infections | 87 23.0% | 5 9.1% | 0.012 0.30 | (0.11, 0.77) | 5 23% | 0.979 0.99 | (0.35, 2.76) |
| Gram-negative | 48 55.2% | 5 100.0% | 0.392 0.65 | (0.25, 1.73) | 2 40% | 0.606 0.68 | (0.15, 2.99) |
| Gram-positive | 34 39.1% | 2 40.0% | 0.152 0.34 | (0.08, 1.48) | 0 0% | ** ** | ** |
| SARS-CoV-19 | 20 23.0% | 0 0.0% | ** ** | ** | 3 60% | 0.086 3.16 | (0.85, 11.72) |
| Fungal | 4 4.6% | 0 0.0% | ** ** | ** | 0 0% | ** ** | ** |
| Concomitant infections | |||||||
| Polymicrobial infections (Yes) | 224 59.1% | 38 69.1% | 0.106 1.66 | (0.89, 3.06) | 22 100% | ** ** | ** |
| Gram-negative | 169 75.4% | 27 71.1% | 0.468 1.24 | (0.69, 2.19) | 18 82% | 0.001 6.14 | (2.04, 18.51) |
| Gram-positive | 106 47.3% | 10 26.3% | 0.084 0.53 | (0.26, 1.09) | 15 68% | 0.000 6.26 | (2.48, 15.85) |
| Fungal | 59 26.3% | 6 15.8% | 0.306 0.63 | (0.26, 1.54) | 10 45% | 0.000 5.24 | (2.15, 12.78) |
| SARS-CoV-19 | 7 3.1% | 7 18.4% | 0.961 ** | ** | 0 0% | ** ** | ** |
| Time between admission and sampling Median (IQR) | 2 (0–15) | 8 (0–17) | 0.799 1.00 | (0.99, 1.02) | 12 (1–23.5) | 0.009 1.02 | (1.01, 1.03) |
References
- Beutler, E. G6PD: Population genetics and clinical manifestations. Blood Rev. 1996, 10, 45–52. [Google Scholar] [CrossRef]
- Wood, T. Physiological functions of the pentose phosphate pathway. Cell Biochem. Funct. 1986, 4, 241–247. [Google Scholar] [CrossRef]
- Cappellini, M.D.; Fiorelli, G. Glucose-6-phosphate dehydrogenase deficiency. Lancet 2008, 371, 64–74. [Google Scholar] [CrossRef]
- Meissner, F.; Seger, R.A.; Moshous, D.; Fischer, A.; Reichenbach, J.; Zychlinsky, A. Inflammasome activation in NADPH oxidase defective mononuclear phagocytes from patients with chronic granulomatous disease. Blood 2010, 116, 1570–1573. [Google Scholar] [CrossRef] [PubMed] [Green Version]
- Rada, B.K.; Geiszt, M.; Káldi, K.; Timar, C.; Ligeti, E. Dual role of phagocytic NADPH oxidase in bacterial killing. Blood 2004, 104, 2947–2953. [Google Scholar] [CrossRef] [PubMed]
- Bianchi, M.; Niemiec, M.J.; Siler, U.; Urban, C.F.; Reichenbach, J. Restoration of anti-Aspergillus defense by neutrophil extracellular traps in human chronic granulomatous disease after gene therapy is calprotectin-dependent. J. Allergy Clin. Immunol. 2011, 127, 1243–1252. [Google Scholar] [CrossRef]
- Gonzalez, A.; Hung, C.-Y.; Cole, G.T. Absence of phagocyte NADPH oxidase 2 leads to severe inflammatory response in lungs of mice infected with Coccidioides. Microb. Pathog. 2011, 51, 432–441. [Google Scholar] [CrossRef] [Green Version]
- Nathan, C. Neutrophils and immunity: Challenges and opportunities. Nat. Rev. Immunol. 2006, 6, 173–182. [Google Scholar] [CrossRef]
- Clark, M.; Root, R.K. Glucose-6-phosphate dehydrogenase deficiency and infection: A study of hospitalized patients in Iran. Yale J. Biol. Med. 1979, 52, 169–179. [Google Scholar]
- Thwe, P.M.; Ortiz, D.A.; Wankewicz, A.L.; Hornak, J.P.; Williams-Bouyer, N.; Ren, P. The Brief Case: Recurrent Chromobacterium violaceum Bloodstream Infection in a Glucose-6-Phosphate Dehydrogenase (G6PD)-Deficient Patient with a Severe Neutrophil Defect. J. Clin. Microbiol. 2020, 58, 2. [Google Scholar] [CrossRef] [Green Version]
- Hsieh, Y.-T.; Lin, M.-H.; Ho, H.-Y.; Chen, L.-C.; Chen, C.-C.; Shu, J.-C. Glucose-6-Phosphate Dehydrogenase (G6PD)-Deficient Epithelial Cells Are Less Tolerant to Infection by Staphylococcus aureus. PLoS ONE 2013, 8, e79566. [Google Scholar] [CrossRef] [PubMed]
- Abu-Osba, Y.K.; Mallouh, A.A.; Hann, R.W. Incidence and causes of sepsis in glucose-6-phosphate dehydrogenase-deficient newborn infants. J. Pediatr. 1989, 114, 748–752. [Google Scholar] [CrossRef]
- Cooper, M.R.; DeChatelet, L.R.; McCall, C.E.; La Via, M.F.; Spurr, C.L.; Baehner, R.L. Complete Deficiency of Leukocyte Glucose-6-Phosphate Dehydrogenase with Defective Bactericidal Activity. J. Clin. Investig. 1972, 51, 769–778. [Google Scholar] [CrossRef] [PubMed] [Green Version]
- Yang, C.-H.; Chen, K.-J.; Wang, C.-K. Community-acquired Acinetobacter pneumonia: A case report. J. Infect. 1997, 35, 316–318. [Google Scholar] [CrossRef]
- Mallouh, A.A.; Abu-Osba, Y.K. Bacterial infections in children with glucose-6-phosphate dehydrogenase deficiency. J. Pediatr. 1987, 111 Pt 1, 850–852. [Google Scholar] [CrossRef]
- Harthan, A.A.; Heger, M.L. Stenotrophomonas Infection in a Patient with Glucose-6-Phosphate Dehydrogenase Deficiency. J. Pediatr. Pharmacol. Ther. 2013, 18, 137–141. [Google Scholar] [CrossRef] [Green Version]
- Lodha, A.; Kamaluddeen, M.S.; Kelly, E.; Amin, H. Clostridium difficile infection precipitating hemolysis in glucose-6-phosphate dehydrogenase-deficient preterm twins causing severe neonatal jaundice. J. Perinatol. 2008, 28, 77–78. [Google Scholar] [CrossRef] [Green Version]
- WHO Working Group. Glucose-6-phosphate dehydrogenase deficiency. Bull World Health Organ. 1989, 67, 601–611. [Google Scholar]
- Nkhoma, E.T.; Poole, C.; Vannappagari, V.; Hall, S.A.; Beutler, E. The global prevalence of glucose-6-phosphate dehydrogenase deficiency: A systematic review and meta-analysis. Blood Cells Mol. Dis. 2009, 42, 267–278. [Google Scholar] [CrossRef]
- Al Riyami, A.A.; Suleiman, A.J.; Afifi, M.; Al Lamki, Z.M.; Daar, S. A community-based study of common hereditary blood disorders in Oman. EMHJ East. Mediterr. Health J. 2001, 7, 1004–1011. [Google Scholar] [CrossRef]
- Falagas, M.E.; Koletsi, P.K.; Bliziotis, I.A. The diversity of definitions of multidrug-resistant (MDR) and pandrug-resistant (PDR) Acinetobacter baumannii and Pseudomonas aeruginosa. J. Med Microbiol. 2006, 55 Pt 12, 1619–1629. [Google Scholar] [CrossRef] [Green Version]
- Clinical and Laboratory Standards Institute, Standards Development Policies and Process October 2013. Available online: https://www.cdc.gov/labtraining/trainingcourses/master/antimicrobial-susceptibility-clsi-standards.html (accessed on 28 February 2022).
- Al-Riyami, A.; Ebrahim, G.J. Genetic Blood Disorders Survey in the Sultanate of Oman. J. Trop. Pediatr. 2003, 49 (Suppl. S1), i1–i20. [Google Scholar] [PubMed]
- Rostami-Far, Z.; Ghadiri, K.; Rostami-Far, M.; Shaveisi-Zadeh, F.; Amiri, A.; Zarif, B.R. Glucose-6-phosphate dehydrogenase deficiency (G6PD) as a risk factor of male neonatal sepsis. J. Med. Life 2016, 9, 34–38. [Google Scholar]
- Blot, S.; Vandijck, D.; Lizy, C.; Annemans, L.; Vogelaers, D. Estimating the Length of Hospitalization Attributable to Multidrug Antibiotic Resistance. Antimicrob. Agents Chemother. 2010, 54, 4046–4047. [Google Scholar] [CrossRef] [PubMed] [Green Version]
- Madrazo, M.; Esparcia, A.; López-Cruz, I.; Alberola, J.; Piles, L.; Viana, A.; Eiros, J.M.; Artero, A. Clinical impact of multidrug-resistant bacteria in older hospitalized patients with community-acquired urinary tract infection. BMC Infect. Dis. 2021, 21, 1232. [Google Scholar] [CrossRef] [PubMed]
- Nelson, R.E.; Hyun, D.; Jezek, A.; Samore, M.H. Mortality, Length of Stay, and Healthcare Costs Associated with Multidrug-Resistant Bacterial Infections Among Elderly Hospitalized Patients in the United States. Clin. Infect. Dis. 2022, 74, 1070–1080. [Google Scholar] [CrossRef]
- Tosi, M.; Roat, E.; De Biasi, S.; Munari, E.; Venturelli, S.; Coloretti, I.; Biagioni, E.; Cossarizza, A.; Girardis, M. Multidrug resistant bacteria in critically ill patients: A step further antibiotic therapy. J. Emerg. Crit. Care Med. 2018, 2, 103. [Google Scholar] [CrossRef]
- Khoharo, H.K.; Almani, S.A.; Naseer, A.; Maheshwari, S.K.; Maroof, P.; Naseer, R. Current trends of drug resistance patterns of Acinetobacter baumannii infection in blood transfusion-dependent thalassemia patients. J. Glob. Infect. Dis. 2017, 9, 135–138. [Google Scholar] [CrossRef]
- Muzaheed; Alzahrani, F.M.; Sattar Shaikh, S. Acinetobacter baumannii Infection in Transfusion Dependent Thalassemia Patients with Sepsis. BioMed Res. Int. 2017, 2017, 2351037. [Google Scholar]
- Gasperini, B.; Cherubini, A.; Lucarelli, M.; Espinosa, E.; Prospero, E. Multidrug-Resistant Bacterial Infections in Geriatric Hospitalized Patients before and after the COVID-19 Outbreak: Results from a Retrospective Observational Study in Two Geriatric Wards. Antibiotics 2021, 10, 95. [Google Scholar] [CrossRef]
- Tarazona-Castro, Y.; Troyes, L.; Martins-Luna, J.; Cabellos-Altamirano, F.; Aguilar-Luis, M.A.; Carrillo-Ng, H.; Valle, L.J.D.; Kiem, S.M.; Miranda, S.; Silva-Caso, W.; et al. Detection of SARS-CoV-2 IgM Antibodies in Febrile Patients from an Endemic Region of Dengue and Chikungunya. Int. J. Infect. Dis. 2022, 116, S53–S54. [Google Scholar] [CrossRef]
- Marino, A.; Pampaloni, A.; Scuderi, D.; Cosentino, F.; Moscatt, V.; Ceccarelli, M.; Gussio, M.; Celesia, B.M.; Bruno, R.; Borraccin, S.; et al. High-fow nasal cannula oxygenation and tocilizumab administration in patients critically ill with COVID-19: A report of three cases and a literature review. World Acad. Sci. J. 2020, 2, 23. [Google Scholar] [CrossRef]
- Mehta, Y.; Gupta, A.; Todi, S.; Myatra, S.; Samaddar, D.P.; Patil, V.; Bhattacharya, P.K.; Ramasubban, S. Guidelines for prevention of hospital acquired infections. Indian journal of critical care medicine: Peer-reviewed, official publication of. Indian Soc. Crit. Care Med. 2014, 18, 149–163. [Google Scholar]
- Liu, C.-P.; Shih, S.-C.; Wang, N.-Y.; Wu, A.Y.; Sun, F.-J.; Chow, S.-F.; Chen, T.-L.; Yan, T.-R. Risk factors of mortality in patients with carbapenem-resistant Acinetobacter baumannii bacteremia. J. Microbiol. Immunol. Infect. 2016, 49, 934–940. [Google Scholar] [CrossRef] [Green Version]

| Included (n = 379) | Included (n = 379) | ||||
|---|---|---|---|---|---|
| N | (%) | N | (%) | ||
| Male | 265 | 69.9% | Age on admission—Median (IQR) | 59.9 | (41–77) |
| Female | 114 | 30.1% | ≤60 Years | 190 | 50.1% |
| Length of stay (LOS) Median (IQR) | 12 | (5–31) | >60 years | 189 | 49.9% |
| ≤14 days | 184 | 48.5% | Admission Diagnosis | ||
| >14 days | 195 | 51.5% | Infectious disease diagnosis | 273 | 72.0% |
| Discharge outcome | Non-infectious diagnosis | 106 | 28.0% | ||
| Death | 105 | 27.7% | Admission ward | ||
| Recovery | 274 | 72.3% | Critical care area | 117 | 30.9% |
| 14-day mortality | 55 | 52.4% | Medical ward | 146 | 38.5% |
| 28-day mortality | 22 | 21.0% | Surgical ward | 116 | 30.6% |
| >28-day mortality | 28 | 26.7% | Other Risk Factors | ||
| Underlying Comorbid conditions | Invasive procedure during admission | 285 | 75.2% | ||
| Number of comorbid conditions | 3 | (2–4) | Need for blood transfusion | 212 | 55.9% |
| Any comorbidity | 338 | 89.2% | Surgery 90-day history | 39 | 10.3% |
| Chronic Cardiac Diseases | 282 | 83.4% | Medication received | ||
| Diabetes | 254 | 75.1% | Analgesics | 283 | 74.7% |
| Chronic renal failure | 228 | 67.5% | Proton pump inhibitor | 269 | 71.0% |
| Others | 179 | 53.0% | Heparin/LMWH | 241 | 63.6% |
| Chronic Resp. Disease | 70 | 20.7% | Diuretics | 206 | 54.4% |
| Immuno-suppressed | 24 | 7.1% | Cortico-steroids | 124 | 32.7% |
| Sickle Cell | 19 | 5.6% | Inotropes | 123 | 32.5% |
| Active malignancy | 14 | 4.1% | Vasodilators | 104 | 27.4% |
| HIV follow-up | 1 | 0.3% | Albumin | 66 | 17.4% |
| Culture sample type | Organism causing infections | ||||
| Skin and soft tissue | 103 | 27.2% | Gram-positive bacteria | 107 | 28.2% |
| Urine | 96 | 25.3% | Gram-negative bacteria | 227 | 59.9% |
| Respiratory | 91 | 24.0% | Fungal | 31 | 8.2% |
| Blood | 88 | 23.2% | SARS-CoV2 | 14 | 3.7% |
| Body fluids | 1 | 0.3% | Place of Acquisition | ||
| Bacterial Resistant Phenotype | Community-acquired infection | 212 | 55.9% | ||
| Sens | 181 | 54.2% | Hospital-acquired infection | 167 | 44.1% |
| MDR | 67 | 20.1% | 90 days occurrence of any infection | 136 | 35.9% |
| ESBL | 50 | 15.0% | 90-day previous infections | 87 | 23.0% |
| CRE | 24 | 7.2% | Gram-negative | 48 | 55.2% |
| MRSA | 12 | 3.6% | Gram-positive | 34 | 39.1% |
| Prior exposure to antimicrobials | 158 | 41.7% | SARS-CoV-2 | 20 | 23.0% |
| Cephalosporins | 105 | 66.5% | Fungal | 4 | 4.6% |
| β-lactams | 70 | 44.3% | Antimicrobial treatment | ||
| Quinolones | 64 | 40.5% | Monotherapy | 250 | 66.0% |
| β-lactam/β-lactamase | 58 | 36.7% | Combined therapy | 129 | 34.0% |
| Macrolides | 34 | 21.5% | Cephalosporin-based | 157 | 41.4% |
| Glycopeptides | 33 | 20.9% | B-lactam/B-lactamase inhibitor-based | 131 | 34.6% |
| Nitroimidazole | 29 | 18.4% | Pip/Taz based | 99 | 26.1% |
| Aminoglycosides | 25 | 15.8% | Quinolones-based | 45 | 11.9% |
| Tetracyclines | 19 | 12.0% | Vancomycin-based | 38 | 10.0% |
| Glycylcycline | 3 | 1.9% | B-lactam-based | 37 | 9.8% |
| Oxazolidinones | 2 | 1.3% | Antifungal treatment | 31 | 8.2% |
| Colistin | 1 | 0.6% | Tetracycline-based | 30 | 7.9% |
| Concomitant infections | Macrolide-based | 28 | 7.4% | ||
| Polymicrobial infections (Yes) | 224 | 59.1% | Meropenem based | 28 | 7.4% |
| Gram-negative | 169 | 75.4% | Colistin-based | 24 | 6.3% |
| Gram-positive | 106 | 47.3% | Aminoglycosides-based | 22 | 5.8% |
| Fungal | 59 | 26.3% | Tigecycline-based | 10 | 2.6% |
| SARS-CoV-2 | 7 | 3.1% | Linezolid based | 2 | 0.5% |
| Included (n = 379) | N (%) | Hospital-Acquired Infections (n = 167) | MDR Infection (n = 153) | ||||
|---|---|---|---|---|---|---|---|
| N | p | CI | N | p | CI | ||
| (%) | OR | % | OR | ||||
| Age on admission—median (IQR) | 59.9 | 59 | 0.399 | (0.99, 1.01) | 63 | 0.848 | (0.99, 1.01) |
| (41–77) | (36.5–77) | 1.00 | (41–77) | 1.00 | |||
| Age > 60 years | 189 | 81 | (0.60, 1.36) | 80 | (0.78, 1.77) | ||
| 49.9% | 48.5% | 0.91 | 52.3% | 1.18 | |||
| Length of stay (LOS) median (IQR) | 12 | 34 | 0.000 | (1.08, 1.13) | 22 | 0.000 | (1.01, 1.02) |
| (5–31) | (17–60) | 1.10 | (8–41.5) | 1.01 | |||
| LOS > 14 days | 195 | 139 | 0.000 | (10.92, 31.07) | 94 | 0.000 | (1.58, 3.67) |
| 51.5% | 83.2% | 18.42 | 61.4% | 2.41 | |||
| Admission to critical care area | 117 | 94 | 0.000 | (6.23, 17.98) | 64 | 0.000 | (1.50, 3.66) |
| 30.9% | 56.3% | 10.58 | 41.8% | 2.35 | |||
| Number of comorbid conditions Median (IQR) | 3 | 3 | 0.010 | (1.05, 1.40) | 2 | 0.032 | (1.01, 1.36) |
| (2–4) | (2–4) | 1.21 | (0–3) | 1.17 | |||
| Any comorbidity | 338 | 149 | 0.982 | (0.52, 1.94) | 139 | 0.391 | (0.68, 2.66) |
| 89.2% | 89.2% | 1.01 | 90.8% | 1.35 | |||
| Chronic Cardiac Diseases | 282 | 137 | 0.003 | (1.29, 3.44) | 124 | 0.016 | (1.12, 3.02) |
| 83.4% | 82.0% | 2.11 | 81.0% | 1.84 | |||
| Diabetes | 254 | 104 | 0.082 | (0.44, 1.05) | 99 | 0.431 | (0.54, 1.29) |
| 75.1% | 62.3% | 0.68 | 64.7% | 0.84 | |||
| Chronic renal failure | 228 | 108 | 0.112 | (0.92, 2.13) | 100 | 0.089 | (0.95, 2.21) |
| 67.5% | 64.7% | 1.40 | 65.4% | 1.44 | |||
| Chronic Resp. Disease | 70 | 43 | 0.001 | (1.39, 4.05) | 34 | 0.123 | (0.89, 2.54) |
| 20.7% | 25.7% | 2.38 | 22.2% | 1.51 | |||
| Immuno-suppressed | 24 | 15 | 0.066 | (0.95, 5.22) | 9 | 0.767 | (0.37, 2.06) |
| 7.1% | 9.0% | 2.23 | 5.9% | 0.88 | |||
| Active malignancy | 14 | 9 | 0.131 | (0.78, 7.17) | 5 | 0.718 | (0.27, 2.48) |
| 4.1% | 5.4% | 2.36 | 3.3% | 0.81 | |||
| Invasive procedure during admission | 285 | 137 | 0.000 | (4.26, 15.59) | 101 | 0.150 | (0.88, 2.33) |
| 75.2% | 82.0% | 8.15 | 66.0% | 1.43 | |||
| Need for blood transfusion | 212 | 155 | 0.000 | (5.14, 13.55) | 121 | 0.001 | (1.37, 3.08) |
| 55.9% | 92.8% | 8.34 | 79.1% | 2.01 | |||
| Surgery 90-day history | 39 | 15 | 0.458 | (0.39, 1.53) | 15 | 0.798 | (0.46, 1.81) |
| 10.3% | 9.0% | 0.77 | 9.8% | 0.91 | |||
| Infection due to Gram-positive bacteria | 107 | 28 | 0.000 | (0.21, 0.55) | 38 | 0.195 | (0.46, 1.17) |
| 28.2% | 16.8% | 0.34 | 24.8% | 0.74 | |||
| Infection due to Gram-negative bacteria | 227 | 123 | 0.000 | (1.88, 4.49) | 115 | 0.000 | (1.96, 4.83) |
| 59.9% | 73.7% | 2.90 | 75.2% | 3.08 | |||
| Community-acquired infections | 212 | * | * | * | 62 | 0.35 | (0.23, 0.53) |
| 55.9% | * | * | 40.5% | ||||
| Hospital-acquired infections | 167 | * | * | * | 91 | 0.000 | (1.89, 4.43) |
| 44.1% | * | * | 59.5% | 2.90 | |||
| Gram-negative 90-day previous infection | 48 | 16 | 0.328 | (0.39, 1.37) | 21 | 0.610 | (0.64, 2.16) |
| 55.2% | 18.4% | 0.73 | 13.7% | 1.17 | |||
| Gram-positive 90-day previous infection | 34 | 10 | 0.474 | (0.37, 1.58) | 14 | 0.920 | (0.51, 2.12) |
| 39.1% | 11.5% | 0.77 | 9.2% | 1.04 | |||
| SARS-CoV-2 90-day previous infection | 20 | 15 | 0.001 | (3.59, 204.55) | 14 | 0.009 | (1.39, 9.84) |
| 23.0% | 17.2% | 27.09 | 9.2% | 3.69 | |||
| Fungal 90-day previous infection | 4 | 2 | 0.810 | (0.18, 9.13) | 2 | 0.695 | (0.21, 10.65) |
| 4.6% | 2.3% | 1.27 | 1.3% | 1.48 | |||
| Included (n = 379) | N (%) | 14-Day Mortality (n = 55) | 28-Day Mortality (n = 22) | ||||
|---|---|---|---|---|---|---|---|
| N | p | CI | N | p | CI | ||
| (%) | OR | (%) | OR | ||||
| Male | 265 | 51 | 0.000 | (2.31, 18.60) | 16 | 0.768 | (0.44, 3.04) |
| 69.9% | 92.7% | 6.55 | 73% | 1.16 | |||
| Age on admission—Median (IQR) | 59.9 | 74 | 0.000 | (1.02, 1.06) | 78 | 0.000 | (1.02, 1.09) |
| (41–77) | (65.81.5) | 1.04 | (69–84) | 1.05 | |||
| >60 years | 189 | 45 | 0.000 | (2.74, 11.55) | 19 | 0.002 | (2.03, 23.95) |
| 49.9% | 81.8% | 5.63 | 86% | 6.97 | |||
| Length of stay (LOS) Median (IQR) | 12 | 15 | 0.043 | (0.97, 0.99) | 33 | 0.021 | (1.00, 1.02) |
| (5–31) | (4–22) | 0.99 | (26–39.3) | 1.01 | |||
| Admission to the critical care area | 117 | 26 | 0.005 | (1.28, 4.11) | 8 | 0.566 | (0.53, 3.19) |
| 30.9% | 47.3% | 2.30 | 36% | 1.30 | |||
| Admission to a medical ward | 146 | 27 | 0.084 | (0.93, 2.95) | 14 | 0.017 | (1.22, 7.29) |
| 38.5% | 49.1% | 1.66 | 64% | 2.98 | |||
| Number of comorbid conditions Median (IQR) | 3 | 3 | 0.000 | (1.22, 1.95) | 2 | 0.003 | (1.19, 2.48) |
| (2–4) | (2–4) | 1.54 | (2.8–4) | 1.72 | |||
| Any comorbidity | 338 | 54 | 0.000 | (1.22, 1.95) | 22 | * | * |
| 89.2% | 98.2% | 1.54 | 100% | * | |||
| Chronic Cardiac Diseases | 282 | 49 | 0.010 | (1.32, 7.7025) | 20 | 0.086 | (0.83, 15.81) |
| 83.4% | 89.1% | 3.19 | 91% | 3.63 | |||
| Chronic renal failure | 228 | 43 | 0.004 | (1.37, 5.30) | 17 | 0.100 | (0.85, 6.52) |
| 67.5% | 78.2% | 2.69 | 77% | 2.35 | |||
| Other comorbid conditions | 179 | 35 | 0.009 | (1.21, 3.95) | 13 | 0.255 | (0.69, 3.99) |
| 53.0% | 63.6% | 2.19 | 59% | 1.66 | |||
| Chronic Respiratory Disease | 70 | 12 | 0.490 | (0.64, 2.58) | 11 | 0.000 | (2.09, 12.19) |
| 20.7% | 21.8% | 1.28 | 50% | 5.05 | |||
| Immunosuppressed | 24 | 7 | 0.042 | (1.04, 6.68) | 1 | 0.724 | (0.09, 5.37) |
| 7.1% | 12.7% | 2.63 | 5% | 0.69 | |||
| Active malignancy | 14 | 6 | 0.005 | (1.61, 14.54) | 1 | 0.828 | (0.16, 10.10) |
| 4.1% | 10.9% | 4.84 | 5% | 1.26 | |||
| Invasive procedure during admission | 285 | 53 | 0.001 | (2.51, 44.01) | 22 | * | * |
| 75.2% | 96.4% | 10.51 | 100% | * | |||
| Need for blood transfusion | 212 | 36 | 0.126 | (0.88, 2.89) | 20 | 0.004 | (1.98, 37.32) |
| 55.9% | 65.5% | 1.59 | 91% | 8.59 | |||
| Bacteraemia | 88 | 21 | 0.005 | (1.29, 4.35) | 5 | 0.955 | (0.35, 2.71) |
| 23.2% | 38.2% | 2.37 | 23% | 0.97 | |||
| Hospital-acquired infections | 167 | 33 | 0.011 | (1.19, 3.81) | 14 | 0.063 | (0.96, 5.70) |
| 44.1% | 60.0% | 2.13 | 64% | 2.33 | |||
| Prior exposure to antimicrobials | 158 | 20 | 0.387 | (0.43, 1.39) | 14 | 0.037 | (1.06, 6.33) |
| 41.7% | 36.4% | 0.77 | 64% | 2.59 | |||
| 90-day exposure to Cephalosporins | 105 | 16 | 0.804 | (0.58, 2.04) | 11 | 0.020 | (1.17, 6.67) |
| 66.5% | 80.0% | 1.08 | 79% | 2.80 | |||
| 90-day exposure to β-lactams | 70 | 5 | 0.060 | (0.15, 1.04) | 9 | 0.008 | (1.37, 8.21) |
| 44.3% | 25.0% | 0.40 | 64% | 3.36 | |||
| 90-day exposure to β-lactam/β-lactamase | 58 | 12 | 0.150 | (0.83, 3.47) | 8 | 0.007 | (1.40, 8.79) |
| 36.7% | 60.0% | 1.69 | 57% | 3.51 | |||
| 90-day exposure to Macrolides | 34 | 2 | 0.152 | (0.08, 1.48) | 6 | 0.004 | (1.60, 12.15) |
| 21.5% | 10.0% | 0.34 | 43% | 4.41 | |||
| Concomitant infections with Gram-negative | 169 | 27 | 0.468 | (0.69, 2.19) | 18 | 0.001 | (2.04, 18.51) |
| 75.4% | 71.1% | 1.24 | 82% | 6.14 | |||
| Concomitant infections with Gram-positive | 106 | 10 | 0.084 | (0.26, 1.09) | 15 | 0.000 | (2.48, 15.85) |
| 47.3% | 26.3% | 0.53 | 68% | 6.26 | |||
| Concomitant infections with Fungi | 59 | 6 | 0.306 | (0.26, 1.54) | 10 | 0.000 | (2.15, 12.78) |
| 26.3% | 15.8% | 0.63 | 45% | 5.24 | |||
Publisher’s Note: MDPI stays neutral with regard to jurisdictional claims in published maps and institutional affiliations. |
© 2022 by the authors. Licensee MDPI, Basel, Switzerland. This article is an open access article distributed under the terms and conditions of the Creative Commons Attribution (CC BY) license (https://creativecommons.org/licenses/by/4.0/).
Share and Cite
Alrahmany, D.; Omar, A.F.; Al-Maqbali, S.R.S.; Harb, G.; Ghazi, I.M. Infections in G6PD-Deficient Hospitalized Patients—Prevalence, Risk Factors, and Related Mortality. Antibiotics 2022, 11, 934. https://doi.org/10.3390/antibiotics11070934
Alrahmany D, Omar AF, Al-Maqbali SRS, Harb G, Ghazi IM. Infections in G6PD-Deficient Hospitalized Patients—Prevalence, Risk Factors, and Related Mortality. Antibiotics. 2022; 11(7):934. https://doi.org/10.3390/antibiotics11070934
Chicago/Turabian StyleAlrahmany, Diaa, Ahmed F. Omar, Salima R. S. Al-Maqbali, Gehan Harb, and Islam M. Ghazi. 2022. "Infections in G6PD-Deficient Hospitalized Patients—Prevalence, Risk Factors, and Related Mortality" Antibiotics 11, no. 7: 934. https://doi.org/10.3390/antibiotics11070934
APA StyleAlrahmany, D., Omar, A. F., Al-Maqbali, S. R. S., Harb, G., & Ghazi, I. M. (2022). Infections in G6PD-Deficient Hospitalized Patients—Prevalence, Risk Factors, and Related Mortality. Antibiotics, 11(7), 934. https://doi.org/10.3390/antibiotics11070934