A Review on Surface-Enhanced Raman Scattering

 ,
,  ,
,  ,
,  ,
, 
Abstract
Index
- 1. Introduction
- 2. Origin of the SERS Enhancement
- 2.1.
- Electromagnetic Enhancement
- 2.1.1.
- Local Field Enhancement
- 2.1.2.
- Re-Radiation Enhancement
- 2.1.3.
- Expression for the SERS Enhancement in the Approximation
- 2.2.
- Chemical Enhancement
- 2.2.1.
- Computational Approach: Resonant and Non-Resonant Chemical Effect
- 2.2.2.
- Modelling Approach: Resonant Chemical Effect
- 3. Main Factors Affecting the SERS Enhancement and Its Experimental Determination
- 3.1.
- Materials for SERS
- 3.1.1.
- Metallic Materials
- 3.1.2.
- Non-Metallic Materials for SERS and Specific Mechanisms Involved in the Enhancement
- 3.2.
- The Role of Hot Spots
- 3.2.1.
- Anatomy of a Hot Spot: Spatial Distribution of the Local Field
- 3.3.
- Distance Dependence of the Electromagnetic Enhancement
- 3.4.
- Experimental Determination of the SERS Enhancement
- 4. Factors Affecting the Choice of the Excitation Wavelength in a SERS Experiment
- 4.1.
- SERS Enhancement
- 4.2.
- The Analyte Cross-Section
- 4.3.
- Fluorescence from the Analyte or Contaminants
- 4.4.
- Spectral Sensitivity of the Raman Instrument
- 4.5.
- Summary
- 5. Fabrication of SERS Substrates
- 5.1.
- Desired Features of SERS Substrates for Applications
- 5.2.
- Direct vs. Indirect Detection
- 5.3.
- Substrates for Direct Detection
- 5.3.1.
- Aggregated Nanoparticles in Solution (Unstructured Nanoparticles)
- 5.3.2.
- Nanoparticles Assembled on a Surface (Structured Nanoparticles)
- 5.3.3.
- Ordered Arrays of Nanoparticles (Structured Surfaces)
- 5.4.
- SERS Labels for Indirect Detection
- 5.5.
- Commercial Substrates
- 5.6.
- Some Analytical Aspects of SERS Substrates: Separation and Capturing Techniques
- 5.6.1.
- Separation Techniques
- 5.6.2.
- Capturing Techniques
- 6. Applications in the Biomedical Field
- 6.1.
- Direct Protocol
- 6.1.1.
- DNA Detection
- 6.1.2.
- Analysis of Cellular Functions and Components in the Cell Microenvironment
- 6.1.3.
- Protein Detection
- 6.1.4.
- Viruses and Bacteria
- 6.2.
- Indirect Protocol
- 6.2.1.
- DNA Detection
- 6.2.2.
- Analysis of Cellular Functions and Components in the Cell Microenvironment
- 6.2.3.
- Protein Detection
- 7. Conclusions and Outlook
- References
1. Introduction
2. Origin of the SERS Enhancement
- It originates from the localization of light at the surface of the substrate.
- It is a feature typical of the substrate and it is independent of the type of molecule.
- It is the strongest contribution to the SERS enhancement and it can reach very high values, around 1010 (see Table 1).
- In order to be effective, it requires the molecule to be placed not too far from the substrate (about 1 to 10 nm away from the surface). It is considered a long-range effect (compared to the length of a chemical bond).
- The chemical enhancement arises from a modification of the polarizability of a molecule (and hence of the Raman cross-sections of its vibrational modes), as a consequence of its physico-chemical interaction with the substrate.
- It depends on the type of molecule.
- The contribution of the chemical enhancement is normally considered much smaller than the electromagnetic one and, depending on the specific mechanism involved, its magnitude may reach 102–104 (see Table 1).
- It requires contact or a very small separation (a few Angstroms) [114] between the molecule and the substrate. It is considered a short-range effect.
2.1. Electromagnetic Enhancement
- The local field (or near field) enhancement. The excitation of surface plasmons induces a strong spatial localization and hence amplification of the laser light in small spatial regions, called hot spots. Therefore, the electromagnetic field experienced by the molecules residing in hot spots is much stronger than the field they would experience without the metallic substrate.
- The re-radiation enhancement. The presence of the metallic structure nearby the molecule modifies also the efficiency with which the molecule radiates Raman power; this occurs because the power radiated by a dipole (i.e., the molecule oscillating at the Raman frequency) depends on the environment in which it is embedded.
2.1.1. Local Field Enhancement
2.1.2. Re-Radiation Enhancement
2.1.3. Expression for the SERS Enhancement in the Approximation
2.2. Chemical Enhancement
- Non-resonant chemical effect. The interaction between the molecule and the metal does not lead to the formation of a new electronic state (the molecular orbitals lay at energies not close enough to the Fermi level of the metal); however, such interaction may induce an appreciable change in the geometrical and electronic structure of the molecule, that reveals as a mild modification of the Raman shifts and of the intensity of the vibrational modes.
- Resonant charge transfer chemical effect. The interaction between the molecule and the metal brings about the creation of a metal–molecule charge transfer (CT) state. If the Raman scattering is excited with a laser source in resonance or pre-resonance with this state, some Raman modes can be strongly enhanced, in particular those ones coupled to the allowed electronic transitions (resonant Raman scattering [111]).
2.2.1. Computational Approach: Resonant and Non-Resonant Chemical Effect
2.2.2. Modelling Approach: Resonant Chemical Effect
- The numerator of Equation (12) allows one to single out which vibrational modes are expected to be enhanced (“surface selection rules”).
- The denominator describes the relative contributions of the plasmonic, intramolecular, and charge transfer resonances to the observed intensity of the mode . It is composed by three factors:
- ○
- The first factor, , represents the plasmonic resonance. and are the real and imaginary part of the dielectric constant of the metal as a function of the frequency, respectively, and is the real dielectric constant of the medium in which the metallic structure is immersed. The medium is considered to be non-absorbing and, hence, is real.
- ○
- The second factor, , represents the intramolecular resonance: is the transition frequency between the ground state () and one of excited states localized on the molecule (), is a damping constant related to the bandwidth of the transition.
- ○
- The third factor, represents the contribution of the charge transfer state: is the transition frequency between the Fermi state () and one of the excited states localized on the molecule (), and is a damping constant related to the bandwidth of the transition.
3. Main Factors Affecting the SERS Enhancement and Its Experimental Determination
3.1. Materials for SERS
3.1.1. Metallic Materials
- Real part of the dielectric constant. Since the surrounding medium is supposed to be non-absorbing ( is real and positive), in order to fulfill the resonance condition () the material that forms the nanoparticle must possess .
- Imaginary part of the dielectric constant. When the resonance condition is satisfied then : therefore, the smaller , the higher the enhancement.
- The real part of the metals in figure is negative throughout the range 200–1200 nm and, hence, the resonance condition can be fulfilled in typical Raman excitation regions.
- The metal that possess the lowest losses in the visible region is silver, which is then the material expected to provide the largest enhancement. Going towards the near-infrared; however, the differences among silver, gold, and copper level out and the three metals are expected to perform similarly. This behavior stems from the fact that the onset of the interband transitions is around 300 nm for silver and around 600 nm for gold and copper, as evidenced by the rather steep increases of at those wavelengths [160]. Concerning aluminum, the onset for interband transition is located at approximately 880 nm, but in the ultra-violet (UV) region the losses are quite low and; therefore, it is considered a good material for UV SERS.
3.1.2. Non-Metallic Materials for SERS and Specific Mechanisms Involved in the Enhancement
3.2. The Role of Hot Spots
- strongly increases by reducing the gap size, in particular it amounts to at = 10 nm and to at = 2 nm; the power law dependence is reported to be approximately [222,223,224]. A single gold sphere is limited to . This behaviour explains why SERS is very often observed on aggregated nanoparticles and rarely on isolated nanoparticles. There are only very few cases in which aggregation inhibits or weakly enhances the Raman scattering; this may occur for example with hollow nanoparticles, because in this case the field enhancement generated between the nanoparticles can be counteracted by a reduction of the field inside the nanoparticles [81,225,226].
- An important distinction regards the use of a surface averaged or a single point : for example, at = 2 nm, calculated at the intersection of the axis with the surface of one of the nanoparticles, amounts to but, if averaged over the surface of the dimer, it is 300 times lower (Figure 12c). This suggests that the field is strongly localized in a small spatial region; this point will be described more in detail in Section 3.2.1.
3.2.1. Anatomy of a Hot Spot: Spatial Distribution of the Local Field
- varies dramatically as a function of the position, with significant variations with respect to the molecular scale. Considering the packing density of a typical SERS molecule (benzenethiol) on metals, whose maximum reported value is molecules/cm2 [126,228,229,230], it can be estimated that a single molecule occupies a spot with a diameter of 0.4 nm. This means that, at about 5 nm from the hottest point (corresponding to about 10 molecules), is already 10 times lower.
- Due to the strong spatial variations, the average enhancement is much lower than the maximum one:; in the example in Figure 12 the average is about 300 times lower that the maximum value.
- Typically, 0.64% of the surface (which means 0.64% of the molecules assuming uniform coverage) generates most of the SERS (let us say 80%) [231].
3.3. Distance Dependence of the Electromagnetic Enhancement
3.4. Experimental Determination of the SERS Enhancement
4. Factors Affecting the Choice of the Excitation Wavelength in a SERS Experiment
- Especially for biomedical applications, SERS spectra should be collected with an excitation wavelength that can propagate through the tissues. As shown in Figure 16a, there are three different spectral windows in which extinction is minimized: the first one is in between 650 and 950 nm (NIR-I), the second one from 1000 to 1350 nm (NIR-II), and the third one in between 1500 and 1800 nm (NIR-III) [275,276]. The individual contribution of human skin, blood, and fatty tissues to extinction is reported in Figure 16b [277]. The first window, compared to the other two, presents a higher level of tissue auto-fluorescence that adds up to the Raman signal as a broad background, reducing the signal to noise ratio (SNR).
- SERS spectra should be collected in the experimental conditions that optimize SNR. This has as obvious consequences: faster analysis and lower limits of detection. The SERS signal for dispersive Raman instruments, that are the most widely used [19], can be expressed as:
4.1. SERS Enhancement
4.2. The Analyte Cross-Section
4.3. Fluorescence from the Analyte or Contaminants
4.4. Spectral Sensitivity of the Raman Instrument
4.5. Summary
5. Fabrication of SERS Substrates
5.1. Desired Features of SERS Substrates for Applications
5.2. Direct vs. Indirect Detection
5.3. Substrates for Direct Detection
5.3.1. Aggregated Nanoparticles in Solution (Unstructured Nanoparticles)
5.3.2. Nanoparticles Assembled on a Surface (Structured Nanoparticles)
5.3.3. Ordered Arrays of Nanoparticles (Structured Surfaces)
5.4. SERS Labels for Indirect Detection
5.5. Commercial Substrates
- Sigma-Aldrich-Merck KGaA (Darmstadt, Germany) [361] sells silver and gold nanoparticles in solution with different shapes (spherical, rods, plates) and sizes, for example, gold spherical nanoparticles are available from 5 to 400 nm and nanorods are available with an absorption peak ranging from 550 to 1064 nm.
- Nanopartz (Loveland, Colorado, USA) [362] offers a wide selection of nanoparticles in solution (like spherical gold nanoparticles, nanorods, nanowires, and nanocubes), with different sizes, aspect ratios, and different types of capping.
- Nanocs (New York, USA) [363] commercializes mainly gold nanoparticles in solution with different sizes and different types of coating (i.e., bare, biotine, streptavine, dextrane, etc.); some types of silver nanoparticles are available as well.
- Silmeco (Copenhagen, Denmark) [364] offers solid SERS substrates formed by an array of silicon nanopillars, on top of which a silver or gold layer is deposited. The evaporation of the solvent causes the pillars to collapse on each other, forming hot spots (analogously to the substrates described by Ou et al. [357,358] and by Lee et al. [350]). Typically, but substrates can be customized, the SERS active area is 16 mm2 (4 × 4 mm). Several publications describe in detail these types of substrates [423,424].
- Horiba Scientific (Minami-ku Kyoto, Japan) [365] provides gold SERS substrates, formed by nanorods processed by dynamic oblique vacuum evaporation. The size of the active area is 4 × 3 mm or 5 × 7 mm.
- Ocean optics (Largo, Florida, USA) [366] offers gold and silver substrates, whose active area is a circle with a 5.5 mm diameter.
- AtoID (Vilnius, Lithuania) [367] commercializes gold and silver substrates fabricated by modifying the surface of soda lime glasses with ultra-short laser pulses, followed by deposition of a metal layer. The active area is 3 × 5 mm.
5.6. Some Analytical Aspects of SERS Substrates: Separation and Capturing Techniques
5.6.1. Separation Techniques
5.6.2. Capturing Techniques
6. Applications in the Biomedical Field
6.1. Direct Protocol
6.1.1. DNA Detection
6.1.2. Analysis of Cellular Functions and Components in the Cell Microenvironment
6.1.3. Protein Detection
6.1.4. Viruses and Bacteria
6.2. Indirect Protocol
6.2.1. DNA Detection
6.2.2. Analysis of Cellular Functions and Components in the Cell Microenvironment
6.2.3. Protein Detection
7. Conclusions and Outlook
Author Contributions
Funding
Acknowledgments
Conflicts of Interest
Abbreviations
| 2B2MP | 2-bromo-2-methylpropane |
| 4-ABT | 4-aminobenzenethiol |
| 4-MBA | 4-mercaptobenzoic acid |
| 4-MBT | 4-methylbenzenethiol |
| AFM | Atomic force microscopy |
| AFP | α-fetoprotein |
| Ag-FON | Silver film over nanospheres |
| AIDS | Acquired immune deficiency syndrome |
| APTMS | (3-Aminopropyl)trimethoxy silane |
| ATP | Adenosine triphosphate |
| AuNPs@SiNWAr | Silicon nanowire arrays decorated with Au nanoparticles |
| AZO | Aluminum-doped ZnO |
| BiASERS | Bi-analyte SERS |
| BPA | Bisphenol A |
| BPE | Trans-1,2-bis(4-pyridyl)-ethylene |
| BSA | Bovine serum albumin |
| BTA | Benzotriazole |
| BTZ | 3-methoxy-4-(5′-azobenzo-triazolyl) phenylamine |
| CARS | Coherent anti-Stokes Raman scattering |
| CCD | Charged coupled device |
| cDNA | Complementary DNA |
| CEA | Carcino-embryonic antigen |
| CFU | Colony forming unit |
| Chit | Chitosan |
| CT | Charge transfer |
| CV | Cyclic voltammetry |
| CV+ | Crystal Violet cation |
| DFT | Density functional theory |
| DMAB | 4,4-dimercaptoazobenzene |
| DNA | Deoxyribonucleic acid |
| DOX | Doxorubicin |
| DPSD | Double step potential deposition |
| ds-DNA | Double stranded DNA |
| DTNB | 5,5′-dithiobis(2-nitrobenzoic acid) |
| EBL | Electron beam lithography |
| ED | Electrochemical deposition |
| EDTA | Ethylenediaminetetraacetic acid |
| EGFR | Epithelial growth factor receptor |
| ELISA | Enzyme-linked immunosorbent assay |
| ER | Electrochemical roughening |
| FON | Film over nanosphere |
| GC | Gas chromatography |
| GERS | Graphene enhanced Raman scattering |
| GZO | Gallium-doped ZnO |
| hCG | Human chorionic gonadotropin |
| HIV | Human immunodeficiency viruses |
| HOMO | Highest occupied molecular orbital |
| HPLC | High pressure liquid chromatography |
| HRS | Hyper Raman scattering |
| IFI27 | Interferon alpha-inducible protein 27 |
| IFI44L | Interferon-induced protein 44-like |
| IgG | Immunoglobulin G |
| IL | Ionic liquid |
| InGaAs | Indium gallium arsenide |
| IR | Infrared |
| IRTP | Immortalized rat renal proximal tubule |
| IT | Indium tin oxide |
| LOD | Limit of detection |
| LSPR | Localized surface plasmon resonance |
| LSV | Linear sweep voltammetry |
| LUMO | Lowest occupied molecular orbital |
| MBA | Mercaptobenzoic acid |
| MDCKII | Madin–Darby canine kidney |
| MDR | Morphology dependent resonance |
| MIP | Molecularly imprinted polymer |
| miRNA | MicroRNA |
| MS | Molecular sentinel |
| MS-on-Chip | Molecular sentinel-on-chip |
| MWCNT | Multiwalled carbon nanotube |
| NIL | Nanoimprint lithography |
| NIR | Near infrared |
| NP | Nanoparticle |
| NR | Nanorod |
| PAMAM | Poly(amidoamine) |
| PAN | Polyacrylonitrile |
| PATP | p-aminothiophenol |
| PCB | Polychlorinated biphenyls |
| PCR | Polymerase chain reaction |
| PEG | Polyethylene glycol |
| PMMA | Poly(methyl methacrylate) |
| PSA | Prostate specific antigen |
| PVA | Poly(vinyl alcohol) |
| PVP | Polyvinylpyrrolidone |
| RDI | Relative diagnostic index |
| RIE | Reactive ion etching |
| RNA | Ribonucleic acid |
| ROS | Reactive oxygen species |
| SAM | Self-assembled monolayer |
| SCE | Saturated calomel electrode |
| SEM | Scanning electron microscopy |
| SERDS | Shifted excitation Raman difference spectroscopy |
| SERS | Surface-enhanced Raman scattering |
| SNR | Signal to noise ratio |
| SPR | Surface plasmon resonance |
| SRS | Stimulated Raman scattering |
| ssDNA | Single stranded DNA |
| SSE | Sequentially shifted excitation |
| SSRS | Subtracted shifted Raman spectroscopy |
| TAED | Template assisted electrochemical deposition |
| TCO | Transparent conductive oxide |
| TDVP | Temperature dependent vibrational pumping |
| TE | Transverse electric |
| TEM | Transmission electron microscopy |
| TERS | Tip enhanced Raman scattering |
| TLC | Thin layer chromatography |
| TM | Transverse magnetic |
| TNT | 2,4,6-Trinitrotoluene |
| UPD | Underpotential deposition |
| UV | Ultraviolet |
| UV-Vis | UV Visible |
| VEGF | Vascular endothelial growth factor |
| WGM | Whispering gallery mode |
References
- Fleischmann, M.; Hendra, P.J.; McQuillan, A.J. Raman spectra of pyridine adsorbed at a silver electrode. Chem. Phys. Lett. 1974, 26, 163–166. [Google Scholar] [CrossRef]
- Jeanmaire, D.L.; Van Duyne, R.P. Surface Raman spectroelectrochemistry. J. Electroanal. Chem. Interfacial Electrochem. 1977, 84, 1–20. [Google Scholar] [CrossRef]
- Albrecht, M.G.; Creighton, J.A. Anomalously intense Raman spectra of pyridine at a silver electrode. J. Am. Chem. Soc. 1977, 99, 5215–5217. [Google Scholar] [CrossRef]
- Moskovits, M. Surface roughness and the enhanced intensity of Raman scattering by molecules adsorbed on metals. J. Chem. Phys. 1978, 69, 4159–4161. [Google Scholar] [CrossRef]
- Moskovits, M. Surface-enhanced spectroscopy. Rev. Mod. Phys. 1985, 57, 783. [Google Scholar] [CrossRef]
- Le Ru, E.C.; Etchegoin, P.G. Principles of Surface Enhanced Raman Spectroscopy; Elsevier: Amsterdam, The Netherlands, 2009. [Google Scholar]
- Ding, S.-Y.; You, E.-M.; Tian, Z.-Q.; Moskovits, M. Electromagnetic theories of surface-enhanced Raman spectroscopy. Chem. Soc. Rev. 2017, 46, 4042–4076. [Google Scholar] [CrossRef] [PubMed]
- Aroca, R. Surface-Enhanced Vibrational Spectroscopy; John Wiley & Sons, Ltd.: Chicester, UK, 2006. [Google Scholar]
- Lombardi, J.R.; Birke, R.L. A Unified View of Surface-Enhanced Raman Scattering. Acc. Chem. Res. 2009, 42, 734–742. [Google Scholar] [CrossRef]
- Otto, A. The “chemical” (electronic) contribution to surface-enhanced Raman scattering. J. Raman Spectrosc. 2005, 36, 497–509. [Google Scholar] [CrossRef]
- Otto, A. Charge transfer in first layer enhanced Raman scattering and surface resistance. Q. Phys. Rev. 2017, 3, 1–14. [Google Scholar]
- Le Ru, E.C.; Etchegoin, P.G. Quantifying SERS enhancements. MRS Bull. 2013, 38, 631–640. [Google Scholar] [CrossRef]
- Eberhardt, K.; Stiebing, C.; Matthaüs, C.; Schmitt, M.; Popp, J. Advantages and limitations of Raman spectroscopy for molecular diagnostics: An update. Expert Rev. Mol. Diagn. 2015, 15, 773–787. [Google Scholar] [CrossRef]
- Zrimsek, A.B.; Wong, N.L.; Van Duyne, R.P. Single Molecule Surface-Enhanced Raman Spectroscopy: A Critical Analysis of the Bianalyte versus Isotopologue Proof. J. Phys. Chem. C 2016, 120, 5133–5142. [Google Scholar] [CrossRef]
- Nie, S.; Emory, S.R. Probing Single Molecules and Single Nanoparticles by Surface-Enhanced Raman Scattering. Science 1997, 275, 1102–1106. [Google Scholar] [CrossRef] [PubMed]
- Etchegoin, P.G.; Le Ru, E.C. A perspective on single molecule SERS: Current status and future challenges. Phys. Chem. Chem. Phys. 2008, 10, 6079–6089. [Google Scholar] [CrossRef] [PubMed]
- Kneipp, K.; Wang, Y.; Kneipp, H.; Perelman, L.T.; Itzkan, I.; Dasari, R.R.; Feld, M.S. Single Molecule Detection Using Surface-Enhanced Raman Scattering (SERS). Phys. Rev. Lett. 1997, 78, 1667–1670. [Google Scholar] [CrossRef]
- Adar, F.; Delhaye, M.; DaSilva, E. Evolution of Instrumentation for Detection of the Raman Effect as Driven by Available Technologies and by Developing Applications. J. Chem. Educ. 2007, 84, 50–60. [Google Scholar] [CrossRef]
- McCreery, R.L. Raman Spectroscopy for Chemical Analysis; Winefordner, J.D., Ed.; John Wiley & Sons, Inc.: New York, NY, USA, 2000. [Google Scholar]
- Demtröder, W. Laser Spectroscopy (Volume 1, Basic Principles), 4th ed.; Springer: Berlin/Heidelberg, Germany, 2008. [Google Scholar]
- Carron, K.; Cox, R. Qualitative Analysis and the Answer Box: A Perspective on Portable Raman Spectroscopy. Anal. Chem. 2010, 82, 3419–3425. [Google Scholar] [CrossRef] [PubMed]
- Le Ru, E.C.; Meyer, M.; Blackie, E.; Etchegoin, P.G. Advanced aspects of electromagnetic SERS enhancement factors at a hot spot. J. Raman Spectrosc. 2008, 39, 1127–1134. [Google Scholar] [CrossRef]
- Zhu, W.; Esteban, R.; Borisov, A.G.; Baumberg, J.J.; Nordlander, P.; Lezec, H.J.; Aizpurua, J.; Crozier, K.B. Quantum mechanical effects in plasmonic structures with subnanometre gaps. Nat. Commun. 2016, 7, 1–14. [Google Scholar] [CrossRef]
- Alessandri, I.; Lombardi, J.R. Enhanced Raman Scattering with Dielectrics. Chem. Rev. 2016, 116, 14921–14981. [Google Scholar] [CrossRef]
- Otto, A. Surface-enhanced Raman scattering: “Classical” and “Chemical” origins. In Light Scattering in Solids IV, Topics in Applied Physics; Cardona, M., Güntherodt, G., Eds.; Springer: Berlin/Heidelberg, Germany, 1984; p. 289. [Google Scholar]
- Kleinman, S.L.; Sharma, B.; Blaber, M.G.; Henry, A.I.; Valley, N.; Freeman, R.G.; Natan, M.J.; Schatz, G.C.; Van Duyne, R.P. Structure enhancement factor relationships in single gold nanoantennas by surface-enhanced raman excitation spectroscopy. J. Am. Chem. Soc. 2013, 135, 301–308. [Google Scholar] [CrossRef]
- Le Ru, E.C.; Grand, J.; Félidj, N.; Aubard, J.; Lévi, G.; Hohenau, A.; Krenn, J.R.; Blackie, E.; Etchegoin, P.G. Experimental verification of the SERS electromagnetic model beyond the E4 approximation: Polarization effects. J. Phys. Chem. C Lett. 2008, 112, 8117–8121. [Google Scholar] [CrossRef]
- Schmid, T.; Opilik, L.; Blum, C.; Zenobi, R. Nanoscale Chemical Imaging Using Tip-Enhanced Raman Spectroscopy: A Critical Review. Angew. Chem. 2013, 52, 5940–5954. [Google Scholar] [CrossRef] [PubMed]
- Kim, H.; Kosuda, K.M.; Van Duyne, R.P.; Stair, P.C. Resonance Raman and surface- and tip-enhanced Raman spectroscopy methods to study solid catalysts and heterogeneous catalytic reactions. Chem. Soc. Rev. 2010, 39, 4820–4844. [Google Scholar] [CrossRef]
- Pettinger, B.; Schambach, P.; Villag, C.J.; Scott, N. Tip-Enhanced Raman Spectroscopy: Near-Fields Acting on a Few Molecules. Annu. Rev. Phys. Chem. 2012, 63, 379–399. [Google Scholar] [CrossRef] [PubMed]
- Bailo, E.; Deckert, V. Tip-enhanced Raman scattering. Chem. Soc. Rev. 2008, 37, 921–930. [Google Scholar] [CrossRef] [PubMed]
- Yeo, B.; Stadler, J.; Schmid, T.; Zenobi, R.; Zhang, W. Tip-enhanced Raman Spectroscopy—Its status, challenges and future directions. Chem. Phys. Lett. 2009, 472, 1–13. [Google Scholar] [CrossRef]
- Gruenke, N.L.; Cardinal, M.F.; McAnally, M.O.; Frontiera, R.R.; Schatz, G.C.; Van Duyne, R.P. Ultrafast and nonlinear surface-enhanced Raman spectroscopy. Chem. Soc. Rev. 2016, 45, 2263. [Google Scholar] [CrossRef]
- Keller, E.L.; Brandt, N.C.; Cassabaum, A.A.; Frontiera, R.R. Ultrafast surface-enhanced Raman spectroscopy. Analyst 2015, 140, 4922–4931. [Google Scholar] [CrossRef]
- Mosier-Boss, P. Review of SERS Substrates for Chemical Sensing. Nanomaterials 2017, 7, 142. [Google Scholar] [CrossRef] [PubMed]
- Fan, M.; Andrade, G.F.S.; Brolo, A.G. A review on the fabrication of substrates for surface enhanced Raman spectroscopy and their applications in analytical chemistry. Anal. Chim. Acta 2011, 693, 7–25. [Google Scholar] [CrossRef] [PubMed]
- Lin, X.M.; Cui, Y.; Xu, Y.H.; Ren, B.; Tian, Z.-Q. Surface-enhanced raman spectroscopy: Substrate-related issues. Anal. Bioanal. Chem. 2009, 394, 1729–1745. [Google Scholar] [CrossRef] [PubMed]
- Fabris, L. SERS Tags: The Next Promising Tool for Personalized Cancer Detection? ChemNanoMat 2016, 2, 249–258. [Google Scholar] [CrossRef]
- Jones, M.R.; Osberg, K.D.; MacFarlane, R.J.; Langille, M.R.; Mirkin, C.A. Templated techniques for the synthesis and assembly of plasmonic nanostructures. Chem. Rev. 2011, 111, 3736–3827. [Google Scholar] [CrossRef] [PubMed]
- Reguera, J.; Langer, J.; Jiménez de Aberasturi, D.; Liz-Marzán, L.M. Anisotropic metal nanoparticles for surface enhanced Raman scattering. Chem. Soc. Rev. 2017, 46, 3866–3885. [Google Scholar] [CrossRef] [PubMed]
- Polavarapu, L.; Liz-Marzán, L.M. Towards low-cost flexible substrates for nanoplasmonic sensing. Phys. Chem. Chem. Phys. 2013, 15, 5288. [Google Scholar] [CrossRef]
- Grabar, K.C.; Freeman, R.G.; Hommer, M.B.; Natan, M.J. Preparation and Characterization of Au Colloid Monolayers. Anal. Chem. 1995, 67, 735–743. [Google Scholar] [CrossRef]
- Zhu, W.; Banaee, M.G.; Wang, D.; Chu, Y.; Crozier, K.B. Lithographically fabricated optical antennas with gaps well below 10 nm. Small 2011, 7, 1761–1766. [Google Scholar] [CrossRef]
- Forestiere, C.; Pasquale, A.J.; Capretti, A.; Miano, G.; Tamburrino, A.; Lee, S.Y.; Reinhard, B.M.; Dal Negro, L. Genetically engineered plasmonic nanoarrays. Nano Lett. 2012, 12, 2037–2044. [Google Scholar] [CrossRef]
- Yan, B.; Thubagere, A.; Premasiri, W.R.; Ziegler, L.D.; Negro, L.D.; Reinhard, B.M. Engineered SERS substrates with multiscale signal enhancement: Nanoparticle cluster arrays. ACS Nano 2009, 3, 1190–1202. [Google Scholar] [CrossRef]
- Cottat, M.; Lidgi-Guigui, N.; Tijunelyte, I.; Barbillon, G.; Hamouda, F.; Gogol, P.; Aassime, A.; Lourtioz, J.-M.; Bartenlian, B.; de la Chapelle, M.L. Soft UV nanoimprint lithography-designed highly sensitive substrates for SERS detection. Nanoscale Res. Lett. 2014, 9, 623. [Google Scholar] [CrossRef]
- Zhang, Y.; Zhao, S.; Zheng, J.; He, L. Surface-enhanced Raman spectroscopy (SERS) combined techniques for high-performance detection and characterization. Trends Anal. Chem. 2017, 90, 1–13. [Google Scholar] [CrossRef]
- Kämmer, E.; Olschewski, K.; Bocklitz, T.; Rösch, P.; Weber, K.; Cialla, D.; Popp, J. A new calibration concept for a reproducible quantitative detection based on SERS measurements in a microfluidic device demonstrated on the model analyte adenine. Phys. Chem. Chem. Phys. 2014, 16, 9056–9063. [Google Scholar] [CrossRef]
- Kämmer, E.; Olschewski, K.; Stöckel, S.; Rösch, P.; Weber, K.; Cialla-May, D.; Bocklitz, T.; Popp, J. Quantitative SERS studies by combining LOC-SERS with the standard addition method. Anal. Bioanal. Chem. 2015, 407, 8925–8929. [Google Scholar] [CrossRef]
- Shen, W.; Lin, X.; Jiang, C.; Li, C.; Lin, H.; Huang, J.; Wang, S.; Liu, G.; Yan, X.; Zhong, Q.; et al. Reliable quantitative SERS analysis facilitated by core-shell nanoparticles with embedded internal standards. Angew. Chem. Int. Ed. 2015, 54, 7308–7312. [Google Scholar] [CrossRef]
- Ricci, M.; Trombetta, E.; Castellucci, E.; Becucci, M. On the SERS quantitative determination of organic dyes. J. Raman Spectrosc. 2018, 49, 997–1005. [Google Scholar] [CrossRef]
- Fornasaro, S.; Bonifacio, A.; Marangon, E.; Buzzo, M.; Toffoli, G.; Rindzevicius, T.; Schmidt, M.S.; Sergo, V. Label-Free Quantification of Anticancer Drug Imatinib in Human Plasma with Surface Enhanced Raman Spectroscopy. Anal. Chem. 2018, 90, 12670–12677. [Google Scholar] [CrossRef]
- Goodacre, R.; Graham, D.; Faulds, K. Recent developments in quantitative SERS: Moving towards absolute quantification. TrAC Trends Anal. Chem. 2018, 102, 359–368. [Google Scholar] [CrossRef]
- Zheng, J.; He, L. Surface-Enhanced Raman Spectroscopy for the Chemical Analysis of Food. Compr. Rev. Food Sci. Food Saf. 2014, 13, 317–328. [Google Scholar] [CrossRef]
- Peksa, V.; Jahn, M.; Stolcova, L.; Schulz, V.; Proska, J.; Prochazka, M.; Weber, K.; Cialla-May, D.; Popp, J. Quantitative SERS analysis of azorubine (E 122) in sweet drinks. Anal. Chem. 2015, 87, 2840–2844. [Google Scholar] [CrossRef]
- Cheung, W.; Shadi, I.T.; Xu, Y.; Goodacre, R. Quantitative analysis of the banned food dye sudan-1 using surface enhanced raman scattering with multivariate chemometrics. J. Phys. Chem. C 2010, 114, 7285–7290. [Google Scholar] [CrossRef]
- Pilot, R. SERS detection of food contaminants by means of portable Raman instruments. J. Raman Spectrosc. 2018, 49, 954–981. [Google Scholar] [CrossRef]
- Hakonen, A.; Rindzevicius, T.; Schmidt, M.S.; Andersson, P.O.; Juhlin, L.; Svedendahl, M.; Boisen, A.; Käll, M. Detection of nerve gases using surface-enhanced Raman scattering substrates with high droplet adhesion. Nanoscale 2016, 8, 1305–1308. [Google Scholar] [CrossRef]
- Cialla-May, D.; Zheng, X.-S.; Weber, K.; Popp, J. Recent progress in surface-enhanced Raman spectroscopy for biological and biomedical applications: From cells to clinics. Chem. Soc. Rev. 2017, 46, 3857–4112. [Google Scholar] [CrossRef]
- Stöckel, S.; Kirchhoff, J.; Neugebauer, U.; Rösch, P.; Popp, J. The application of Raman spectroscopy for the detection and identification of microorganisms. J. Raman Spectrosc. 2016, 47, 89–109. [Google Scholar] [CrossRef]
- Pahlow, S.; Meisel, S.; Cialla-May, D.; Weber, K.; Rösch, P.; Popp, J. Isolation and identification of bacteria by means of Raman spectroscopy. Adv. Drug Deliv. Rev. 2015, 89, 105–120. [Google Scholar] [CrossRef]
- Cialla, D.; Pollok, S.; Steinbrücker, C.; Weber, K.; Popp, J. SERS-based detection of biomolecules. Nanophotonics 2014, 3, 383–411. [Google Scholar] [CrossRef]
- Walter, A.; März, A.; Schumacher, W.; Rösch, P.; Popp, J. Towards a fast, high specific and reliable discrimination of bacteria on strain level by means of SERS in a microfluidic device. Lab Chip 2011, 11, 1013–1021. [Google Scholar] [CrossRef]
- Petry, R.; Schmitt, M.; Popp, J. Raman Spectroscopy—A Prospective Tool in the Life Sciences. ChemPhysChem 2003, 4, 14–30. [Google Scholar] [CrossRef]
- Mosier-Boss, P.A. Review on SERS of Bacteria. Biosensors 2017, 7, 51. [Google Scholar] [CrossRef]
- Ngo, H.T.; Wang, H.N.; Burke, T.; Ginsburg, G.S.; Vo-Dinh, T. Multiplex detection of disease biomarkers using SERS molecular sentinel-on-chip. Anal. Bioanal. Chem. 2014, 406, 3335–3344. [Google Scholar] [CrossRef] [PubMed]
- Ngo, H.T.; Wang, H.-N.; Fales, A.M.; Nicholson, B.P.; Woods, C.W.; Vo-Dinh, T. DNA bioassay-on-chip using SERS detection for dengue diagnosis. Analyst 2014, 139, 5655–5659. [Google Scholar] [CrossRef] [PubMed]
- Zheng, X.S.; Jahn, I.J.; Weber, K.; Cialla-May, D.; Popp, J. Label-free SERS in biological and biomedical applications: Recent progress, current challenges and opportunities. Spectrochim. Acta Part A Mol. Biomol. Spectrosc. 2018, 197, 56–77. [Google Scholar] [CrossRef] [PubMed]
- Jaworska, A.; Fornasaro, S.; Sergo, V.; Bonifacio, A. Potential of Surface Enhanced Raman Spectroscopy (SERS) in Therapeutic Drug Monitoring (TDM). A critical review. Biosensors 2018, 6, 47. [Google Scholar] [CrossRef] [PubMed]
- Kircher, M.F.; De La Zerda, A.; Jokerst, J.V.; Zavaleta, C.L.; Kempen, P.J.; Mittra, E.; Pitter, K.; Huang, R.; Campos, C.; Habte, F.; et al. A brain tumor molecular imaging strategy using a new triple-modality MRI-photoacoustic-Raman nanoparticle. Nat. Med. 2012, 18, 829–834. [Google Scholar] [CrossRef] [PubMed]
- Zavaleta, C.L.; Smith, B.R.; Walton, I.; Doering, W.; Davis, G.; Shojaei, B.; Natan, M.J.; Gambhir, S.S. Multiplexed imaging of surface enhanced Raman scattering nanotags in living mice using noninvasive Raman spectroscopy. Proc. Natl. Acad. Sci. USA 2009, 106, 13511–13516. [Google Scholar] [CrossRef] [PubMed]
- Xie, W.; Schlücker, S. Surface-enhanced Raman spectroscopic detection of molecular chemo- and plasmo-catalysis on noble metal nanoparticles. Chem. Commun. 2018, 54, 2326–2336. [Google Scholar] [CrossRef] [PubMed]
- Xie, W.; Schlücker, S. Medical applications of surface-enhanced Raman scattering. Phys. Chem. Chem. Phys. 2013, 15, 5329–5344. [Google Scholar] [CrossRef]
- Schlücker, S. SERS Microscopy: Nanoparticle Probes and Biomedical Applications. ChemPhysChem 2009, 10, 1344–1354. [Google Scholar] [CrossRef]
- Madzharova, F.; Heiner, Z.; Kneipp, J. Surface Enhanced Hyper-Raman Scattering of the Amino Acids. J. Phys. Chem. C 2017, 121, 1235–1242. [Google Scholar] [CrossRef]
- Wang, Z.; Zong, S.; Wu, L.; Zhu, D.; Cui, Y. SERS-Activated Platforms for Immunoassay: Probes, Encoding Methods, and Applications. Chem. Rev. 2017, 117, 7910–7963. [Google Scholar] [CrossRef] [PubMed]
- Fikiet, M.A.; Khandasammy, S.R.; Mistek, E.; Ahmed, Y.; Halámková, L.; Bueno, J.; Lednev, I.K. Surface enhanced Raman spectroscopy: A review of recent applications in forensic science. Spectrochim. Acta Part A Mol. Biomol. Spectrosc. 2018, 197, 255–260. [Google Scholar] [CrossRef] [PubMed]
- Dong, J.C.; Zhang, X.G.; Briega-Martos, V.; Jin, X.; Yang, J.; Chen, S.; Yang, Z.L.; Wu, D.Y.; Feliu, J.M.; Williams, C.T.; et al. In situ Raman spectroscopic evidence for oxygen reduction reaction intermediates at platinum single-crystal surfaces. Nat. Energy 2019, 4, 60–67. [Google Scholar] [CrossRef]
- Xie, W.; Walkenfort, B.; Schlücker, S. Label-free SERS monitoring of chemical reactions catalyzed by small gold nanoparticles using 3D plasmonic superstructures. J. Am. Chem. Soc. 2013, 135, 1657–1660. [Google Scholar] [CrossRef] [PubMed]
- Moskovits, M.; Schatz, G.C.; Young, M.A.; Van Duyne, R.P.; Stockman, M.I.; Zou, S.; Schatz, G.C.; Xu, H.; Käll, M.; Corni, S.; et al. Surface-Enhanced Raman Scattering: Physics and Applications; Kneipp, K., Moskovits, M., Kneipp, H., Eds.; Springer: Berlin/Heidelberg, Germany, 2006. [Google Scholar]
- Pilot, R.; Signorini, R.; Fabris, L. Surface-Enhanced Raman spectroscopy: Principles, Substrates, and Applications. In Metal Nanoparticles and Clusters: Advances in Synthesis, Properties and Applications; Deepak, F.L., Ed.; Springer: Cham, Switzerland, 2018; pp. 89–164. [Google Scholar]
- Procházka, M. Surface-Enhanced Raman Spectroscopy. Bioanalytical, Biomolecular and Medical Applications; Springer International Publishing: Cham, Switzerland, 2016. [Google Scholar]
- Etchegoin, P.G.; Le Ru, E.C.; Wang, Y.; Wang, E.; Bell, S.E.J.; Stewart, A.; Pieczonka, N.P.W.; Moula, G.; Skarbek, A.R.; Aroca, R.F.; et al. Surface Enhanced Raman Spectroscopy: Analytical, Biophysical and Life Science Applications; Schlücker, S., Ed.; Wiley-VCH Verlag GmbH & Co. KGaA: Weinheim, Germany, 2011. [Google Scholar]
- Schatz, G.C.; Valley, N.A.; Kneipp, K.; Kneipp, H.; Chuntonov, L.; Haran, G.; Itoh, T.; Mai Takase, F.; Nagasawa, H.N.; Murakoshi, K.; et al. Frontiers of Surface-Enhanced Raman Scattering: Single Nanoparticles and Single Cells, 1st ed.; Ozaki, Y., Kneipp, K., Aroca, R., Eds.; John Wiley & Sons Ltd.: Chichester, UK, 2014. [Google Scholar]
- Natan, M.J. Concluding Remarks: Surface enhanced Raman scattering. Faraday Discuss. 2006, 132, 321. [Google Scholar] [CrossRef] [PubMed]
- Aitchison, H.; Aizpurua, J.; Arnolds, H.; Baumberg, J.; Bell, S.; Bonifacio, A.; Chikkaraddy, R.; Dawson, P.; de Nijs, B.; Deckert, V.; et al. Analytical SERS: General discussion. Faraday Discuss. 2017, 205, 561–600. [Google Scholar] [CrossRef] [PubMed]
- Baumberg, J.; Bell, S.; Bonifacio, A.; Chikkaraddy, R.; Chisanga, M.; Corsetti, S.; Delfino, I.; Eremina, O.; Fasolato, C.; Faulds, K.; et al. SERS in biology/biomedical SERS: General discussion. Faraday Discuss. 2017, 205, 429–456. [Google Scholar] [CrossRef]
- Lombardi, J.R. The theory of surface-enhanced Raman scattering on semiconductor nanoparticles; Toward the optimization of SERS sensors. Faraday Discuss. 2017, 205, 105–120. [Google Scholar] [CrossRef]
- Graham, D.; Goodacre, R.; Arnolds, H.; Masson, J.-F.; Schatz, G.; Baumberg, J.; Kim, D.-H.; Aizpurua, J.; Lum, W.; Silvestri, A.; et al. Theory of SERS enhancement: General discussion. Faraday Discuss. 2017, 205, 173–211. [Google Scholar] [CrossRef]
- Etchegoin, P.G. Editorial: Quo vadis surface-enhanced Raman scattering? Phys. Chem. Chem. Phys. 2009, 11, 7348–7349. [Google Scholar] [CrossRef]
- Alvarez-Puebla, R.A.; Yi Ling, X.; Candeloro, P.; De La Chapelle, M.L. Special issue on surface-enhanced Raman spectroscopy. J. Opt. 2015, 17, 27–30. [Google Scholar] [CrossRef][Green Version]
- Rossi, B.; Masciovecchio, C. GISR 2017: Present and future of Raman researches in Italy. J. Raman Spectrosc. 2018, 49, 909–912. [Google Scholar] [CrossRef]
- Graham, D.; Moskovits, M.; Tian, Z.Q. SERS-facts, figures and the future. Chem. Soc. Rev. 2017, 46, 3864–3865. [Google Scholar] [CrossRef] [PubMed]
- Schlücker, S. Surface-enhanced Raman Spectroscopy: Concepts and chemical applications. Angew. Chem. Int. Ed. 2014, 53, 4756–4795. [Google Scholar] [CrossRef] [PubMed]
- Sharma, B.; Frontiera, R.R.; Henry, A.-I.; Ringe, E.; Van Duyne, R.P. SERS: Materials, applications, and the future. Mater. Today 2012, 15, 16–25. [Google Scholar] [CrossRef]
- Zong, C.; Xu, M.; Xu, L.-J.; Wei, T.; Ma, X.; Zheng, X.-S.; Hu, R.; Ren, B. Surface-Enhanced Raman Spectroscopy for Bioanalysis: Reliability and Challenges. Chem. Rev. 2018, 118, 4946–4980. [Google Scholar] [CrossRef] [PubMed]
- Lee, H.K.; Lee, Y.H.; Koh, C.S.L.; Phan-Quang, G.C.; Han, X.; Lay, C.L.; Sim, H.Y.F.; Kao, Y.-C.; An, Q.; Ling, X.Y. Designing surface-enhanced Raman scattering (SERS) platforms beyond hotspot engineering: Emerging opportunities in analyte manipulations and hybrid materials. Chem. Soc. Rev. 2018. [Google Scholar] [CrossRef]
- Li, J.-F.; Liu, G.-K.; Liu, J.-Y.; Ding, S.-Y.; Wu, D.-Y.; Tian, Z.-Q.; Wang, Y.-H.; Panneerselvam, R. Surface-enhanced Raman spectroscopy: Bottlenecks and future directions. Chem. Commun. 2017, 54, 10–25. [Google Scholar] [CrossRef]
- Steuwe, C.; Kaminski, C.F.; Baumberg, J.J.; Mahajan, S. Surface enhanced coherent anti-stokes Raman scattering on nanostructured gold surfaces. Nano Lett. 2011, 11, 5339–5343. [Google Scholar] [CrossRef]
- Ichimura, T.; Hayazawa, N.; Hashimoto, M.; Inouye, Y.; Kawata, S. Local enhancement of coherent anti-Stokes Raman scattering by isolated gold nanoparticles. J. Raman Spectrosc. 2003, 34, 651–654. [Google Scholar] [CrossRef]
- Frontiera, R.R.; Henry, A.; Gruenke, N.L.; Van Duyne, R.P. Surface-Enhanced Femtosecond Stimulated Raman Spectroscopy. J. Phys. Chem. Lett. 2011, 2, 1199–1203. [Google Scholar] [CrossRef] [PubMed]
- Prince, R.C.; Frontiera, R.R.; Potma, E.O. Stimulated Raman Scattering: From Bulk to Nano. Chem. Rev. 2017, 117, 5070–5094. [Google Scholar] [CrossRef] [PubMed]
- Madzharova, F.; Heiner, Z.; Simke, J.; Kneipp, J. Gold Nanostructures for Plasmonic Enhancement of Hyper-Raman Scattering. J. Phys. Chem. C 2018, 122, 2931–2940. [Google Scholar] [CrossRef]
- Heiner, Z.; Kneipp, J.; Madzharova, F. Surface-enhanced hyper Raman hyperspectral imaging and probing in animal cells. Nanoscale 2017, 9, 8024–8032. [Google Scholar] [CrossRef] [PubMed]
- Madzharova, F.; Heiner, Z.; Kneipp, J. Surface enhanced hyper Raman scattering (SEHRS) and its applications. Chem. Soc. Rev. 2017, 46, 3980–3999. [Google Scholar] [CrossRef] [PubMed]
- Lakowicz, J.R.; Geddes, C.D.; Gryczynski, I.; Malicka, J.; Gryczynski, Z.; Aslan, K.; Lukomska, J.; Matveeva, E.; Zhang, J.; Badugu, R.; et al. Advances in surface-enhanced fluorescence. J. Fluoresc. 2004, 14, 425–441. [Google Scholar] [CrossRef] [PubMed]
- Aslan, K.; Gryczynski, I.; Malicka, J.; Matveeva, E.; Lakowicz, J.R.; Geddes, C.D. Metal-enhanced fluorescence: An emerging tool in biotechnology. Curr. Opin. Biotechnol. 2005, 16, 55–62. [Google Scholar] [CrossRef] [PubMed]
- Lakowicz, J.R. Principles of Fluorescence Spectroscopy, 3rd ed.; Springer: New York, NY, USA, 2006. [Google Scholar]
- Jeong, Y.; Kook, Y.; Lee, K.; Koh, W. Metal enhanced fluorescence (MEF) for biosensors: General approaches and a review of recent developments. Biosens. Bioelectron. 2018, 111, 102–116. [Google Scholar] [CrossRef]
- Neubrech, F.; Huck, C.; Weber, K.; Pucci, A.; Giessen, H. Surface-Enhanced Infrared Spectroscopy Using Resonant Nanoantennas. Chem. Rev. 2017, 117, 5110–5145. [Google Scholar] [CrossRef]
- Long, D.A. The Raman Effect a Unified Treatment of the Theory of Raman Scattering by Molecules; Wiley: Chichester, UK, 2002; ISBN 9780471490289. [Google Scholar]
- Tuschel, D. Raman Thermometry. Spectroscopy 2016, 31, 8–13. [Google Scholar]
- Meier, R.; Kip, B. Determination of the Local Temperature at a Sample during Raman Experiments Using Stokes and Anti-Stokes Raman Bands. Appl. Spectrosc. 2000, 44, 707–711. [Google Scholar]
- Muniz-Miranda, M.; Muniz-Miranza, F.; Pedone, A. Spectroscopic and Computational Studies on Ligand-Capped Metal Nanoparticles and Clusters. In Metal Nanoparticles and Clusters: Advances in Synthesis, Properties and Applications; Deepak, F.L., Ed.; Springer: Cham, Switzerland, 2018; pp. 55–87. [Google Scholar]
- Bantz, K.C.; Meyer, A.F.; Wittenberg, N.J.; Im, H.; Kurtuluş, O.; Lee, S.H.; Lindquist, N.C.; Oh, S.-H.; Haynes, C.L. Recent progress in SERS biosensing. Phys. Chem. Chem. Phys. 2011, 13, 11551–11567. [Google Scholar] [CrossRef]
- Le Ru, E.C.; Galloway, C.; Etchegoin, P.G. On the connection between optical absorption/extinction and SERS enhancements. Phys. Chem. Chem. Phys. 2006, 8, 3083–3087. [Google Scholar] [CrossRef]
- Dick, L.A.; McFarland, A.D.; Haynes, C.L.; Van Duyne, R.P. Metal film over nanosphere (MFON) electrodes for surface-enhanced Raman spectroscopy (SERS): Improvements in surface nanostructure stability and suppression of irreversible loss. J. Phys. Chem. B 2002, 106, 853–860. [Google Scholar] [CrossRef]
- Purcell, E.M. Spontaneous emission probabilities at radio frequencies. Phys. Rev. 1946, 69, 681. [Google Scholar]
- Drexhage, K.H.; Kuhn, H.; Schafer, F.P.; Sperling, W. Variation of the Fluorescence Decay Time of a Molecule in Front of a Mirror. Ber. Bunsenges. Phys. Chem. 1966, 20, 1179. [Google Scholar]
- Drexhage, K.H. Influence of a Dielectric Interface on Fluoresence Decay Time. J. Lumin. 1970, 1, 693–701. [Google Scholar] [CrossRef]
- Goy, P.; Raimond, J.M.; Gross, M.; Haroche, S. Observation of cavity-enhanced single-atom spontaneous emission. Phys. Rev. Lett. 1983, 50, 1903–1906. [Google Scholar] [CrossRef]
- Andrew, P.; Barnes, W.L. Förster energy transfer in an optical microcavity. Science 2000, 290, 785–788. [Google Scholar] [CrossRef]
- Novotny, L.; Hecht, B. Principles of Nano-Optics; Cambridge University Press: Cambridge, UK, 2007. [Google Scholar]
- Chance, R.R.; Prock, A.; Silbey, R. Molecular Fluorescence and Energy Transfer Near Interfaces. In Advance in Chemical Physics XXXVII; Prigogine, I., Rice, S.A., Eds.; John Wiley & Sons, Inc.: Hoboken, NJ, USA, 1978; pp. 2–65. [Google Scholar] [CrossRef]
- Le Ru, E.C.; Etchegoin, P.G. Rigorous justification of the |E|4 enhancement factor in Surface Enhanced Raman Spectroscopy. Chem. Phys. Lett. 2006, 423, 63–66. [Google Scholar] [CrossRef]
- McFarland, A.D.; Young, M.A.; Dieringer, J.A.; Van Duyne, R.P. Wavelength-scanned surface-enhanced Raman excitation spectroscopy. J. Phys. Chem. B 2005, 109, 11279–11285. [Google Scholar] [CrossRef]
- Michieli, N.; Pilot, R.; Russo, V.; Scian, C.; Todescato, F.; Signorini, R.; Agnoli, S.; Cesca, T.; Bozio, R.; Mattei, G. Oxidation effects on the SERS response of silver nanoprism arrays. RSC Adv. 2017, 7, 369–378. [Google Scholar] [CrossRef]
- Fazio, B.; D’Andrea, C.; Bonaccorso, F.; Irrera, A.; Calogero, G.; Vasi, C.; Gucciardi, P.G.; Allegrini, M.; Toma, A.; Chiappe, D.; et al. Re-radiation enhancement in polarized surface-enhanced resonant raman scattering of randomly oriented molecules on self-organized gold nanowires. ACS Nano 2011, 5, 5945–5956. [Google Scholar] [CrossRef]
- Mullin, J.; Valley, N.; Blaber, M.G.; Schatz, G.C. Combined quantum mechanics (TDDFT) and classical electrodynamics (Mie Theory) methods for calculating surface enhanced raman and hyper-raman spectra. J. Phys. Chem. A 2012, 116, 9574–9581. [Google Scholar] [CrossRef]
- Jensen, L.; Zhao, L.L.; Autschbach, J.; Schatz, G.C. Theory and method for calculating resonance Raman scattering from resonance polarizability derivatives. J. Chem. Phys. 2005, 123, 174110. [Google Scholar] [CrossRef]
- Chen, H.; Mcmahon, J.M.; Ratner, M.A.; Schatz, G.C. Classical Electrodynamics Coupled to Quantum Mechanics for Calculation of Molecular Optical Properties: A RT-TDDFT/FDTD Approach. J. Phys. Chem. C 2010, 114, 14384–14392. [Google Scholar] [CrossRef]
- Zhao, L.; Jensen, L.; Schatz, G.C. Pyridine-Ag20 cluster: A model system for studying surface-enhanced Raman scattering. J. Am. Chem. Soc. 2006, 128, 2911–2919. [Google Scholar] [CrossRef]
- Morton, S.M.; Jensen, L. Understanding the molecule surface chemical coupling in SERS. J. Am. Chem. Soc. 2009, 131, 4090–4098. [Google Scholar] [CrossRef]
- Jensen, L.; Aikens, C.M.; Schatz, G.C. Electronic structure methods for studying surface-enhanced Raman scattering. Chem. Soc. Rev. 2008, 37, 1061. [Google Scholar] [CrossRef]
- Kneipp, K. Chemical Contribution to SERS Enhancement: An Experimental Study on a Series of Polymethine Dyes on Silver Nanoaggregates. J. Phys. Chem. C 2016, 120, 21076–21081. [Google Scholar] [CrossRef]
- Birke, R.L.; Znamenskiy, V.; Lombardi, J.R. A charge-transfer surface enhanced Raman scattering model from time-dependent density functional theory calculations on a Ag10-pyridine complex. J. Chem. Phys. 2010, 132, 214707. [Google Scholar] [CrossRef]
- Lombardi, J.R.; Birke, R.L. A Unified Approach to Surface-Enhanced Raman Spectroscopy. J. Phys. Chem. C 2008, 112, 5605–5617. [Google Scholar] [CrossRef]
- Chenal, C.; Birke, R.L.; Lombardi, J.R. Determination of the degree of charge-transfer contributions to surface-enhanced Raman spectroscopy. ChemPhysChem 2008, 9, 1617–1623. [Google Scholar] [CrossRef]
- Atkins, P.W. Physical Chemistry; Oxford Univeristy Press: Oxford, UK, 1994. [Google Scholar]
- Muniz-Miranda, M.; Sbrana, G. Evidence for surface Ag+complex formation by an anion-induced effect in the SER spectra of phthalazine adsorbed on silver sols. J. Raman Spectrosc. 1996, 27, 105–110. [Google Scholar] [CrossRef]
- Cardini, G.; Muniz-Miranda, M. Density functional study on the adsorption of pyrazole onto silver colloidal particles. J. Phys. Chem. B 2002, 106, 6875–6880. [Google Scholar] [CrossRef]
- Heilbronner, E.; Hornung, V.; Pinkerton, F.H.; Thames, S.F. Photoelectron Spectra of Azabenzenes and Azanaphthalenes: III. The Orbital Sequence in Methyl- and Trimethylsilyl-Substituted Pyridines. Helv. Chim. Acta 1972, 55, 289–302. [Google Scholar] [CrossRef]
- Dweydari, A.W.; Mee, C.H.B. Work function measurements on (110), (100) and (111) surfaces of silver. Phys. Status Solidi A 1975, 27, 223–230. [Google Scholar] [CrossRef]
- Seki, H. SERS excitation profile of pyridine and CO on silver in UHV. J. Electroanal. Chem. 1983, 150, 425–436. [Google Scholar] [CrossRef]
- Yamada, H.; Nagata, H.; Toba, K.; Nakao, Y. Charge-transfer band and sers mechanism for the pyridine-Ag system. Surf. Sci. 1987, 182, 269–286. [Google Scholar] [CrossRef]
- Cañamares, M.V.; Chenal, C.; Birke, R.L.; Lombardi, J.R. DFT, SERS, and single-molecule SERS of crystal violet. J. Phys. Chem. C 2008, 112, 20295–20300. [Google Scholar] [CrossRef]
- Kleinman, S.L.; Ringe, E.; Valley, N.; Wustholz, K.L.; Phillips, E.; Scheidt, K.A.; Schatz, G.C.; Van Duyne, R.P. Single-molecule surface-enhanced raman spectroscopy of crystal violet isotopologues: Theory and experiment. J. Am. Chem. Soc. 2011, 133, 4115–4122. [Google Scholar] [CrossRef] [PubMed]
- Cho, S.J.; Ahn, Y.-H.; Maiti, K.K.; Dinish, U.S.; Fu, C.Y.; Thoniyot, P.; Olivo, M.; Chang, Y.-T. Combinatorial synthesis of a triphenylmethine library and their application in the development of Surface Enhanced Raman Scattering (SERS) probes. Chem. Commun. 2010, 46, 722–724. [Google Scholar] [CrossRef] [PubMed]
- Kneipp, J.; Kneipp, H.; Rajadurai, A.; Redmond, R.W.; Kneipp, K. Optical probing and imaging of live cells using SERS labels. J. Raman Spectrosc. 2009, 40, 1–5. [Google Scholar] [CrossRef]
- Kahn, A. Fermi level, work function and vacuum level. Mater. Horiz. 2016, 3, 7–10. [Google Scholar] [CrossRef]
- Sworakowski, J. How accurate are energies of HOMO and LUMO levels in small-molecule organic semiconductors determined from cyclic voltammetry or optical spectroscopy. Synth. Met. 2018, 235, 125–130. [Google Scholar] [CrossRef]
- Biagioni, P.; Huang, J.-S.; Hecht, B. Nanoantennas for visible and infrared radiation. Rep. Prog. Phys. 2011, 75, 24402. [Google Scholar] [CrossRef] [PubMed]
- Amendola, V.; Pilot, R.; Frasconi, M.; Maragò, O.M.; Iatì, M.A. Surface plasmon resonance in gold nanoparticles: A review. J. Phys. Condens. Matter 2017, 29, 203002. [Google Scholar] [CrossRef]
- Maier, S.A. Plasmonics: Fundamentals and Applications; Springer: New York, NY, USA, 2007; ISBN 978-0-387-37825-1. [Google Scholar]
- Raether, H. Surface Plasmons on Smooth and Rough Surfaces and on Gratings; Springer: Heidelberg, Germany, 1988. [Google Scholar]
- Bohren, C.F.; Huffman, D.R. Absorption and Scattering of Light by Small Particles, 1st ed.; John Wiley & Sons, Inc.: New York, NY, USA, 1983. [Google Scholar]
- West, P.R.; Ishii, S.; Naik, G.V.; Emani, N.K.; Shalaev, V.M.; Boltasseva, A. Searching for better plasmonic materials. Laser Photonics Rev. 2010, 4, 795–808. [Google Scholar] [CrossRef]
- Messinger, B.J.; Von Raben, K.U.; Chang, R.K.; Barber, P.W. Local fields at the surface of noble-metal microspheres. Phys. Rev. B 1981, 24, 649–657. [Google Scholar] [CrossRef]
- Aschroft, N.W.; Mermin, N.D. Solid State Physics; SC Publishing: Cambridge, UK, 1976. [Google Scholar]
- Cottancin, E.; Celep, G.; Lermé, J.; Pellarin, M.; Huntzinger, J.R.; Vialle, J.L.; Broyer, M. Optical properties of noble metal clusters as a function of the size: Comparison between experiments and a semi-quantal theory. Theor. Chem. Acc. 2006, 116, 514–523. [Google Scholar] [CrossRef]
- Ehrenreich, H.; Philipp, H.R. Optical Properties of Aluminum. Phys. Rev. 1963, 132, 1918–1928. [Google Scholar] [CrossRef]
- Johnson, P.B.; Christy, R.W. Optical Constants of the Noble Metals. Phys. Rev. B 1972, 6, 4370–4379. [Google Scholar] [CrossRef]
- Palik, E.D. Handbook of Optical Constants of Solids; Academic Press, Inc.: New York, NY, USA, 1985. [Google Scholar]
- Amendola, V.; Scaramuzza, S.; Agnoli, S.; Polizzi, S.; Meneghetti, M. Strong dependence of surface plasmon resonance and surface enhanced Raman scattering on the composition of Au-Fe nanoalloys. Nanoscale 2014, 6, 1423–1433. [Google Scholar] [CrossRef]
- Tian, Z.Q.; Ren, B.; Wu, D.Y. Surface-enhanced Raman scattering: From noble to transition metals and from rough surfaces to ordered nanostructures. J. Phys. Chem. B 2002, 106, 9463–9483. [Google Scholar] [CrossRef]
- Chen, J.; Wiley, B.; McLellan, J.; Xiong, Y.; Li, Z.Y.; Xia, Y. Optical properties of Pd-Ag and Pt-Ag nanoboxes synthesized via galvanic replacement reactions. Nano Lett. 2005, 5, 2058–2062. [Google Scholar] [CrossRef]
- Kunzmann, A.; Andersson, B.; Thurnherr, T.; Krug, H.; Scheynius, A.; Fadeel, B. Toxicology of engineered nanomaterials: Focus on biocompatibility, biodistribution and biodegradation. Biochim. Biophys. Acta Gen. Subj. 2011, 1810, 361–373. [Google Scholar] [CrossRef]
- Shukla, R.; Bansal, V.; Chaudhary, M.; Basu, A.; Bhonde, R.R.; Sastry, M. Biocompatibility of gold nanoparticles and their endocytotic fate inside the cellular compartment: A microscopic overview. Langmuir 2005, 21, 10644–10654. [Google Scholar] [CrossRef]
- Bondarenko, O.; Juganson, K.; Ivask, A.; Kasemets, K.; Mortimer, M.; Kahru, A. Toxicity of Ag, CuO and ZnO nanoparticles to selected environmentally relevant test organisms and mammalian cells in vitro: A critical review. Arch. Toxicol. 2013, 87, 1181–1200. [Google Scholar] [CrossRef]
- Ahamed, M.; Karns, M.; Goodson, M.; Rowe, J.; Hussain, S.M.; Schlager, J.J.; Hong, Y. DNA damage response to different surface chemistry of silver nanoparticles in mammalian cells. Toxicol. Appl. Pharmacol. 2008, 233, 404–410. [Google Scholar] [CrossRef]
- Mcmahon, M.D.; Lopez, R.; Meyer, H.M.; Feldman, L.C.; Haglund, R.F. Rapid tarnishing of silver nanoparticles in ambient laboratory air. Appl. Phys. B Lasers Opt. 2005, 80, 915–921. [Google Scholar] [CrossRef]
- Burge, D.K.; Bennett, J.M.; Peck, R.L.; Bennett, H.E. Growth of Surface Films on Silver. Surf. Sci. 1969, 16, 303–320. [Google Scholar] [CrossRef]
- Bennett, H.E.; Peck, R.L.; Burge, D.K.; Bennett, J.M. Formation and growth of tarnish on evaporated silver films. J. Appl. Phys. 1969, 40, 3351–3360. [Google Scholar] [CrossRef]
- Erol, M.; Han, Y.; Stanley, S.K.; Stafford, C.M.; Du, H.; Sukhishvili, S. SERS Not To Be Taken for Granted in the Presence of Oxygen. J. Am. Chem. Soc. 2009, 131, 7480–7481. [Google Scholar] [CrossRef]
- Han, Y.; Lupitskyy, R.; Chou, T.-M.; Stafford, C.M.; Du, H.; Sukhishvili, S. Effect of Oxidation on Surface-Enhanced Raman Scattering Activity of Silver Nanoparticles: A Quantitative Correlation. Anal. Chem. 2011, 83, 5873–5880. [Google Scholar] [CrossRef]
- Matikainen, A.; Nuutinen, T.; Itkonen, T.; Heinilehto, S.; Puustinen, J.; Hiltunen, J.; Lappalainen, J.; Karioja, P.; Vahimaa, P. Atmospheric oxidation and carbon contamination of silver and its effect on surface-enhanced Raman spectroscopy (SERS). Sci. Rep. 2016, 6, 4–9. [Google Scholar] [CrossRef]
- Chan, G.H.; Zhao, J.; Hicks, E.M.; Schatz, G.C.; Van Duyne, R.P. Plasmonic Properties of Copper Nanoparticles Fabricated by Nanosphere Lithography. Nano Lett. 2007, 7, 1947–1952. [Google Scholar] [CrossRef]
- Gérard, D.; Gray, S.K. Aluminium plasmonics. J. Phys. D Appl. Phys. 2015, 48, 184001. [Google Scholar] [CrossRef]
- Muniz-Miranda, M.; Gellini, C.; Giorgetti, E. Surface-Enhanced Raman Scattering from Copper Nanoparticles Obtained by Laser Ablation. J. Phys. Chem. C 2011, 115, 5021–5027. [Google Scholar] [CrossRef]
- Markin, A.V.; Markina, N.E.; Popp, J.; Cialla-May, D. Copper nanostructures for chemical analysis using surface-enhanced Raman spectroscopy. Trends Anal. Chem. 2018, 108, 247–259. [Google Scholar] [CrossRef]
- Dörfer, T.; Schmitt, M.; Popp, J. Deep-UV surface-enhanced Raman scattering. J. Raman Spectrosc. 2007, 38, 1379–1382. [Google Scholar] [CrossRef]
- Taguchi, A.; Hayazawa, N.; Furusawa, K.; Ishitobi, H.; Kawata, S. Deep-UV tip-enhanced Raman scattering. J. Raman Spectrosc. 2009, 40, 1324–1330. [Google Scholar] [CrossRef]
- Lay, C.L.; Sher, C.; Koh, L.; Wang, J.; Lee, Y.H.; Jiang, R.; Yang, Y.; Yang, Z.; Phang, I.Y.; Ling, X.Y. Aluminum nanostructures with strong visible-range SERS activity for versatile micropatterning of molecular security labels. Nanoscale 2018, 10, 575–581. [Google Scholar] [CrossRef]
- Tian, S.; Neumann, O.; McClain, M.J.; Yang, X.; Zhou, L.; Zhang, C.; Nordlander, P.; Halas, N.J. Aluminum nanocrystals: A sustainable substrate for quantitative SERS-Based DNA Detection. Nano Lett. 2017, 17, 5071–5077. [Google Scholar] [CrossRef]
- Knight, M.W.; King, N.S.; Liu, L.; Everitt, H.O.; Nordlander, P.; Halas, N.J. Aluminum for plasmonics. ACS Nano 2014, 8, 834–840. [Google Scholar] [CrossRef]
- McMahon, J.M.; Gray, S.K.; Schatz, G.C. Ultraviolet Plasmonics: The Poor Metals Al, Ga, In, Sn, Tl, Pb, and Bi. Phys. Chem. Chem. Phys. 2013, 15, 5415–5423. [Google Scholar] [CrossRef]
- Cardinal, M.F.; Vander Ende, E.; Hackler, R.A.; McAnally, M.O.; Stair, P.C.; Schatz, G.C.; Van Duyne, R.P. Expanding applications of SERS through versatile nanomaterials engineering. Chem. Soc. Rev. 2017, 46, 3886–3903. [Google Scholar] [CrossRef]
- Naik, G.V.; Shalaev, V.M.; Boltasseva, A. Alternative plasmonic materials: Beyond gold and silver. Adv. Mater. 2013, 25, 3264–3294. [Google Scholar] [CrossRef]
- Lombardi, J.R.; Birke, R.L. Theory of Surface-Enhanced Raman Scattering in Semiconductors. J. Phys. Chem. C 2014, 118, 11120–11130. [Google Scholar] [CrossRef]
- Demirel, G.; Usta, H.; Yilmaz, M.; Celik, M.; Alidagi, H.A.; Buyukserin, F. Surface-enhanced Raman spectroscopy (SERS): An adventure from plasmonic metals to organic semiconductors as SERS platforms. J. Mater. Chem. C 2018, 6, 5314–5335. [Google Scholar] [CrossRef]
- Ji, W.; Zhao, B.; Ozaki, Y. Semiconductor materials in analytical applications of surface-enhanced Raman scattering. J. Raman Spectrosc. 2016, 47, 51–58. [Google Scholar] [CrossRef]
- Han, X.X.; Ji, W.; Zhao, B.; Ozaki, Y. Semiconductor-enhanced Raman scattering: Active nanomaterials and applications. Nanoscale 2017, 9, 4847–4861. [Google Scholar] [CrossRef]
- Mahmoudi, M.; Lohse, S.E.; Murphy, C.J.; Fathizadeh, A.; Montazeri, A.; Suslick, K.S. Variation of Protein Corona Composition of Gold Nanoparticles Following Plasmonic Heating. Nano Lett. 2014, 14, 6–12. [Google Scholar] [CrossRef]
- Naik, G.V.; Schroeder, J.L.; Ni, X.; Kildishev, A.V.; Sands, T.D.; Boltasseva, A. Titanium nitride as a plasmonic material for visible and near-infrared wavelengths. Opt. Mater. Express 2012, 2, 478–489. [Google Scholar] [CrossRef]
- Patsalas, P.; Kalfagiannis, N.; Kassavetis, S. Optical properties and plasmonic performance of titanium nitride. Materials 2015, 8, 3128–3154. [Google Scholar] [CrossRef]
- Juneja, S.; Shishodia, M.S. Surface plasmon amplification in refractory transition metal nitrides based nanoparticle dimers. Opt. Commun. 2019, 433, 89–96. [Google Scholar] [CrossRef]
- Boltasseva, A. Empowering plasmonics and metamaterials technology with new material platforms. MRS Bull. 2014, 39, 461–468. [Google Scholar] [CrossRef]
- Guler, U.; Suslov, S.; Kildishev, A.V.; Boltasseva, A.; Shalaev, V.M. Colloidal Plasmonic Titanium Nitride Nanoparticles: Properties and Applications. Nanophotonics 2015, 4, 269–276. [Google Scholar] [CrossRef]
- Zhu, S.; Xiao, L.; Cortie, M.B. Surface enhanced Raman spectroscopy on metal nitride thin films. Vib. Spectrosc. 2016, 85, 146–148. [Google Scholar] [CrossRef]
- Kerker, M. The Scattering of Light and Other Electromagnetic Radiation; Loebl, E.M., Ed.; Academic Press, Inc.: New York, NY, USA, 1969. [Google Scholar]
- Tilley, R.J.D. Colour and Optical Properties of Materials, 2nd ed.; John Wiley & Sons, Ltd., Publication: Chichester, UK, 2011. [Google Scholar]
- Bakker, R.M.; Permyakov, D.; Yu, Y.F.; Markovich, D.; Paniagua-Domínguez, R.; Gonzaga, L.; Samusev, A.; Kivshar, Y.; Lukyanchuk, B.; Kuznetsov, A.I. Magnetic and electric hotspots with silicon nanodimers. Nano Lett. 2015, 15, 2137–2142. [Google Scholar] [CrossRef]
- Alessandri, I.; Biavardi, E.; Gianoncelli, A.; Bergese, P.; Dalcanale, E. Cavitands Endow All-Dielectric Beads With Selectivity for Plasmon-Free Enhanced Raman Detection of Nε-Methylated Lysine. ACS Appl. Mater. Interfaces 2016, 8, 14944–14951. [Google Scholar] [CrossRef]
- Bontempi, N.; Carletti, L.; De Angelis, C.; Alessandri, I. Plasmon-free SERS detection of environmental CO2 on TiO2 surfaces. Nanoscale 2016, 8, 3226–3231. [Google Scholar] [CrossRef]
- Bontempi, N.; Vassalini, I.; Alessandri, I. All-dielectric core/shell resonators: From plasmon-free SERS to multimodal analysis. J. Raman Spectrosc. 2018, 49, 943–953. [Google Scholar] [CrossRef]
- Caldarola, M.; Albella, P.; Cortés, E.; Rahmani, M.; Roschuk, T.; Grinblat, G.; Oulton, R.F.; Bragas, A.V.; Maier, S.A. Non-plasmonic nanoantennas for surface enhanced spectroscopies with ultra-low heat conversion. Nat. Commun. 2015, 6, 7915. [Google Scholar] [CrossRef]
- Albella, P.; Poyli, M.A.; Schmidt, M.K.; Maier, S.A.; Moreno, F.; Sáenz, J.J.; Aizpurua, J. Low-loss electric and magnetic field-enhanced spectroscopy with subwavelength silicon dimers. J. Phys. Chem. C 2013, 117, 13573–13584. [Google Scholar] [CrossRef]
- Wang, Y.; Sun, Z.; Wang, Y.; Hu, H.; Zhao, B.; Xu, W.; Lombardi, J.R. Surface-enhanced Raman scattering on mercaptopyridine-capped CdS microclusters. Spectrochim. Acta Part A Mol. Biomol. Spectrosc. 2007, 66, 1199–1203. [Google Scholar] [CrossRef]
- Islam, S.K.; Tamargo, M.; Moug, R.; Lombardi, J.R. Surface-enhanced raman scattering on a chemically etched ZnSe surface. J. Phys. Chem. C 2013, 117, 23372–23377. [Google Scholar] [CrossRef]
- Yang, L.; Jiang, X.; Ruan, W.; Zhao, B.; Xu, W.; Lombardi, J.R. Observation of enhanced Raman scattering for molecules adsorbed on TiO2nanoparticles: Charge-transfer contribution. J. Phys. Chem. C 2008, 112, 20095–20098. [Google Scholar] [CrossRef]
- Sun, Z.; Zhao, B.; Lombardi, J.R. ZnO nanoparticle size-dependent excitation of surface Raman signal from adsorbed molecules: Observation of a charge-transfer resonance. Appl. Phys. Lett. 2007, 91, 221106. [Google Scholar] [CrossRef]
- Ling, X.; Xie, L.; Fang, Y.; Xu, H.; Zhang, H.; Kong, J.; Dresselhaus, M.S.; Zhang, J.; Liu, Z. Can graphene be used as a substrate for Raman enhancement? Nano Lett. 2010, 10, 553–561. [Google Scholar] [CrossRef]
- Ling, X.; Moura, L.G.; Pimenta, M.A.; Zhang, J. Charge-transfer mechanism in graphene-enhanced Raman scattering. J. Phys. Chem. C 2012, 116, 25112–25118. [Google Scholar] [CrossRef]
- Ling, X.; Wu, J.; Xu, W.; Zhang, J. Probing the Effect of Molecular Orientation on the Intensity of Chemical Enhancement Using Graphene-Enhanced Raman Spectroscopy. Small 2012, 8, 1365–1372. [Google Scholar] [CrossRef]
- Barros, E.B.; Dresselhaus, M.S. Theory of Raman enhancement by two-dimensional materials: Applications for graphene-enhanced Raman spectroscopy. Phys. Rev. B 2014, 90, 35443. [Google Scholar] [CrossRef]
- Kleinman, S.L.; Frontiera, R.R.; Henry, A.-I.; Dieringer, J.A.; Van Duyne, R.P. Creating, characterizing, and controlling chemistry with SERS hot spots. Phys. Chem. Chem. Phys. 2013, 15, 21–36. [Google Scholar] [CrossRef]
- Le Ru, E.C.; Grand, J.; Sow, I.; Somerville, W.R.C.; Etchegoin, P.G.; Treguer-Delapierre, M.; Charron, G.; Félidj, N.; Lévi, G.; Aubard, J. A scheme for detecting every single target molecule with surface-enhanced raman spectroscopy. Nano Lett. 2011, 11, 5013–5019. [Google Scholar] [CrossRef]
- Ding, S.-Y.; Yi, J.; Li, J.-F.; Ren, B.; Wu, D.-Y.; Panneerselvam, R.; Tian, Z.-Q. Nanostructure-based plasmon-enhanced Raman spectroscopy for surface analysis of materials. Nat. Rev. Mater. 2016, 1, 16021. [Google Scholar] [CrossRef]
- Tong, L.; Xu, H.; Käll, M. Nanogaps for SERS applications. MRS Bull. 2014, 39, 163–168. [Google Scholar] [CrossRef]
- Xu, H.; Bjerneld, E.J.; Aizpurua, J.; Apell, P.; Gunnarsson, L.; Petronis, S.; Kasemo, B.; Larsson, C.; Höök, F.; Käll, M. Interparticle coupling effects in surface-enhanced Raman scattering. Proc. SPIE 2001, 4258, 35–42. [Google Scholar]
- Moskovits, M. Surface-enhanced Raman spectroscopy: A brief retrospective. J. Raman Spectrosc. 2005, 36, 485–496. [Google Scholar] [CrossRef]
- McMahon, J.M.; Li, S.; Ausman, L.K.; Schatz, G.C. Modeling the effect of small gaps in surface-enhanced Raman spectroscopy. J. Phys. Chem. C 2012, 116, 1627–1637. [Google Scholar] [CrossRef]
- McMahon, J.M.; Gray, S.K.; Schatz, G.C. Fundamental behavior of electric field enhancements in the gaps between closely spaced nanostructures. Phys. Rev. B Condens. Matter Mater. Phys. 2011, 83, 115428. [Google Scholar] [CrossRef]
- Huang, Y.; Zhou, Q.; Hou, M.; Ma, L.; Zhang, Z. Nanogap effects on near- and far-field plasmonic behaviors of metallic nanoparticle dimers. Phys. Chem. Chem. Phys. 2015, 17, 29293–29298. [Google Scholar] [CrossRef]
- Pilot, R.; Zoppi, A.; Trigari, S.; Deepak, F.L.; Giorgetti, E.; Bozio, R. Wavelength dispersion of the local field intensity in silver-gold nanocages. Phys. Chem. Chem. Phys. 2015, 17, 7355–7365. [Google Scholar] [CrossRef]
- Mahmoud, M.A.; El-Sayed, M.A. Aggregation of Gold Nanoframes Reduces, Rather Than Enhances, SERS Efficiency Due to the Trade-Off of the Inter- and Intraparticle Plasmonic Fields. Nano Lett. 2009, 9, 3025–3031. [Google Scholar] [CrossRef]
- Hajisalem, G.; Nezami, M.S.; Gordon, R. Probing the quantum tunneling limit of plasmonic enhancement by third harmonic generation. Nano Lett. 2014, 14, 6651–6654. [Google Scholar] [CrossRef]
- Gui, J.Y.; Stern, D.A.; Frank, D.G.; Lu, F.; Zapien, D.C.; Hubbard, A.T. Adsorption and Surface Structural Chemistry of Thiophenol, Benzyl Mercaptan, and Alkyl Mercaptans. Comparative Studies at Ag(111) and Pt(111) Electrodes by Means of Auger Spectroscopy, Electron Energy Loss Spectroscopy, Low-Energy Electron Diffraction and electrochemistry. Langmuir 1991, 7, 955–963. [Google Scholar] [CrossRef]
- Wan, L.-J.; Terashima, M.; Noda, H.; Osawa, M. Molecular Orientation and Ordered Structure of Benzenethiol Adsorbed on Gold(111). J. Phys. Chem. B 2000, 104, 3563–3569. [Google Scholar] [CrossRef]
- Whelan, C.M.; Smyth, M.R.; Barnes, C.J. HREELS, XPS, and Electrochemical Study of Benzenethiol Adsorption on Au(111). Langmuir 1999, 15, 116–126. [Google Scholar] [CrossRef]
- Le Ru, E.C.; Etchegoin, P.G.; Meyer, M. Enhancement factor distribution around a single surface-enhanced Raman scattering hot spot and its relation to single molecule detection. J. Chem. Phys. 2006, 125, 204701. [Google Scholar] [CrossRef]
- Camargo, P.H.C.; Rycenga, M.; Au, L.; Xia, Y. Isolating and probing the hot spot formed between two silver nanocubes. Angew. Chem. Int. Ed. 2009, 48, 2180–2184. [Google Scholar] [CrossRef]
- Chen, C.; Hutchison, J.A.; Clemente, F.; Kox, R.; Uji-I, H.; Hofkens, J.; Lagae, L.; Maes, G.; Borghs, G.; Van Dorpe, P. Direct evidence of high spatial localization of hot spots in surface-enhanced Raman scattering. Angew. Chem. Int. Ed. 2009, 48, 9932–9935. [Google Scholar] [CrossRef]
- Stiles, P.L.; Dieringer, J.A.; Shah, N.C.; Van Duyne, R.P. Surface-Enhanced Raman Spectroscopy. Annu. Rev. Anal. Chem. 2008, 1, 601–626. [Google Scholar] [CrossRef]
- Kovacs, G.J.; Loutfy, R.O.; Vincett, P.S.; Jennings, C.; Aroca, R. Distance dependence of SERS enhancement factor from Langmuir-Blodgett monolayers on metal island films: Evidence for the electromagnetic mechanism. Langmuir 1986, 2, 689–694. [Google Scholar] [CrossRef]
- Masango, S.S.; Hackler, R.A.; Large, N.; Henry, A.I.; McAnally, M.O.; Schatz, G.C.; Stair, P.C.; Van Duyne, R.P. High-Resolution Distance Dependence Study of Surface-Enhanced Raman Scattering Enabled by Atomic Layer Deposition. Nano Lett. 2016, 16, 4251–4259. [Google Scholar] [CrossRef]
- Compagnini, G.; Galati, C.; Pignataro, S. Distance dependence of surface enhanced Raman scattering probed by alkanethiol self-assembled monolayers. Phys. Chem. Chem. Phys. 1999, 1, 2351–2353. [Google Scholar] [CrossRef]
- Kennedy, B.J.; Spaeth, S.; Dickey, M.; Carron, K.T. Determination of the Distance Dependence and Experimental Effects for Modified SERS Substrates Based on Self-Assembled Monolayers Formed Using Alkanethiols. J. Phys. Chem. B 1999, 103, 3640–3646. [Google Scholar] [CrossRef]
- Marotta, N.E.; Beavers, K.R.; Bottomley, L.A. Limitations of Surface Enhanced Raman Scattering in Sensing DNA Hybridization Demonstrated by Label-Free DNA Oligos as Molecular Rulers of Distance-Dependent Enhancement. Anal. Chem. 2013, 85, 1440–1446. [Google Scholar] [CrossRef]
- Murray, C.A.; Allara, D.L. Measurement of the molecule–silver separation dependence of surface enhanced Raman scattering in multilayered structures. J. Chem. Phys. 1982, 76, 1290. [Google Scholar] [CrossRef]
- Stockman, M.I.; Kneipp, K.; Kneipp, H.; Kneipp, J.; Ross, M.B.; Blaber, M.G.; Schatz, G.C.; Goykhman, I.; Desiatov, B.; Levy, U.; et al. Plasmonics: Theory and Applications; Shahbazyan, T.V., Stockman, M.I., Eds.; Springer: New York, NY, USA, 2013. [Google Scholar]
- Pieczonka, N.P.W.; Aroca, R.F. Single molecule analysis by surfaced-enhanced Raman scattering. Chem. Soc. Rev. 2008, 37, 946–954. [Google Scholar] [CrossRef]
- Qian, X.-M.; Nie, S.M. Single-molecule and single-nanoparticle SERS: From fundamental mechanisms to biomedical applications. Chem. Soc. Rev. 2008, 37, 912–920. [Google Scholar] [CrossRef]
- Le Ru, E.C.; Blackie, E.J.; Meyer, M.; Etchegoin, P.G. Surface Enhanced Raman Scattering Enhancement Factors: A Comprehensive Study. J. Phys. Chem. C 2007, 111, 13794–13803. [Google Scholar] [CrossRef]
- Fang, Y.; Seong, N.-H.; Dlott, D.D. Measurement of the distribution of site enhancements in surface-enhanced Raman scattering. Science 2008, 321, 388–392. [Google Scholar] [CrossRef]
- Le Ru, E.C.; Meyer, M.; Etchegoin, P.G. Proof of single-molecule sensitivity in Surface Enhanced Raman Scattering (SERS) by means of a two-analyte technique. J. Phys. Chem. B 2006, 110, 1944–1948. [Google Scholar] [CrossRef]
- Blackie, E.; Le Ru, E.C.; Meyer, M.; Timmer, M.; Burkett, B.; Northcote, P.; Etchegoin, P.G. Bi-analyte SERS with isotopically edited dyes. Phys. Chem. Chem. Phys. 2008, 10, 4147–4153. [Google Scholar] [CrossRef]
- Maher, R.C.; Etchegoin, P.G.; Le Ru, E.C.; Cohen, L.F. A conclusive demonstration of vibrational pumping under surface enhanced Raman scattering conditions. J. Phys. Chem. B 2006, 110, 11757–11760. [Google Scholar] [CrossRef]
- Maher, R.C.; Cohen, L.F.; Le Ru, E.C.; Etchegoin, P.G. On the experimental estimation of Surface Enhanced Raman Scattering (SERS) cross sections by vibrational pumping. J. Phys. Chem. B 2006, 110, 19469–19478. [Google Scholar] [CrossRef]
- Pilot, R.; Bozio, R. Validation of SERS enhancement factor measurements. J. Raman Spectrosc. 2018, 49, 462–471. [Google Scholar] [CrossRef]
- Cai, W.B.; Ren, B.; Li, X.Q.; She, C.X.; Liu, F.M.; Cai, X.W.; Tian, Z.Q. Investigation of surface-enhanced Raman scattering from platinum electrodes using a confocal Raman microscope: Dependence of surface roughening pretreatment. Surf. Sci. 1998, 406, 9–22. [Google Scholar] [CrossRef]
- Haynes, C.L.; Van Duyne, R.P. Plasmon-Sampled Surface-Enhanced Raman Excitation Spectroscopy. J. Phys. Chem. B 2003, 107, 7426–7433. [Google Scholar] [CrossRef]
- Creus, A.H.; Carro, P.; Gonzáles, S.; Salvarezza, R.C.; Arvia, A.J. A New Electrochemical Method for Determining the Fractal Dimension of the Surface of Rough Metal Electrodeposits. J. Electrochem. Soc. 1992, 139, 1064–1070. [Google Scholar] [CrossRef]
- Durante, C.; Perazzolo, V.; Perini, L.; Favaro, M.; Granozzi, G.; Gennaro, A. Electrochemical activation of carbon–halogen bonds: Electrocatalysis at silver/copper nanoparticles. Appl. Catal. B Environ. 2014, 158–159, 286–295. [Google Scholar] [CrossRef]
- Weber, V.; Feis, A.; Gellini, C.; Pilot, R.; Salvi, P.R.; Signorini, R. Far- and near-field properties of gold nanoshells studied by photoacoustic and surface-enhanced Raman spectroscopies. Phys. Chem. Chem. Phys. 2015, 17, 21190–21197. [Google Scholar] [CrossRef]
- D’Andrea, C.; Irrera, A.; Fazio, B.; Foti, A.; Messina, E.; Maragò, O.M.; Kessentini, S.; Artoni, P.; David, C.; Gucciardi, P.G. Red shifted spectral dependence of the SERS enhancement in a random array of gold nanoparticles covered with a silica shell: Extinction versus scattering. J. Opt. 2015, 17, 114016. [Google Scholar] [CrossRef]
- Zayak, A.T.; Hu, Y.S.; Choo, H.; Bokor, J.; Cabrini, S.; Schuck, P.J.; Neaton, J.B. Chemical Raman enhancement of organic adsorbates on metal surfaces. Phys. Rev. Lett. 2011, 106, 23–26. [Google Scholar] [CrossRef]
- Biggs, K.B.; Camden, J.P.; Anker, J.N.; van Duyne, R.P. Surface-Enhanced Raman Spectroscopy of Benzenethiol Adsorbed from the Gas Phase onto Silver Film over Nanosphere Surfaces: Determination of the Sticking Probability and Detection Limit Time. J. Phys. Chem. A 2009, 113, 4581–4586. [Google Scholar] [CrossRef]
- Aggarwal, R.L.; Farrar, L.W.; Diebold, E.D.; Polla, D.L. Measurement of the absolute Raman scattering cross section of the 1584-cm—1 band of benzenethiol and the surface-enhanced Raman scattering cross section enhancement factor for femtosecond laser-nanostructured substrates. J. Raman Spectrosc. 2009, 2009, 1331–1333. [Google Scholar] [CrossRef]
- Joo, T.H.; Kim, M.S.; Kim, K. Surface-Enhanced Raman Scattering of Benzenethiol in Silver Sol. J. Raman Spectrosc. 1987, 18, 57–60. [Google Scholar] [CrossRef]
- Dollish, F.R.; Fateley, W.G.; Bentley, F.F. Characteristic Raman Frequencies of Organic Compounds; John Wiley & Sons, Inc: New York, NY, USA, 1974. [Google Scholar]
- Ferrari, A.C.; Robertson, J. Interpretation of Raman spectra of disordered and amorphous carbon. Phys. Rev. B 2000, 61, 14095–14107. [Google Scholar] [CrossRef]
- Álvarez-Puebla, R.A. Effects of the excitation wavelength on the SERS spectrum. J. Phys. Chem. Lett. 2012, 3, 857–866. [Google Scholar] [CrossRef]
- Yeo, B.S.; Schmid, T.; Zhang, W.; Zenobi, R. A Strategy to Prevent Signal Losses, Analyte Decomposition, and Fluctuating Carbon Contamination Bands in Surface-Enhanced Raman Spectroscopy. Appl. Spectrosc. 2008, 62, 708–713. [Google Scholar] [CrossRef]
- Huang, Y.F.; Zhu, H.P.; Liu, G.K.; Wu, D.Y.; Ren, B.; Tian, Z.Q. When the signal is not from the original molecule to be detected: Chemical transformation of para-Aminothiophenol on Ag during the SERS measurement. J. Am. Chem. Soc. 2010, 132, 9244–9246. [Google Scholar] [CrossRef]
- Huang, Y.F.; Wu, D.Y.; Zhu, H.P.; Zhao, L.B.; Liu, G.K.; Ren, B.; Tian, Z.Q. Surface-enhanced Raman spectroscopic study of p-aminothiophenol. Phys. Chem. Chem. Phys. 2012, 14, 8485–8497. [Google Scholar] [CrossRef]
- Jiang, R.; Zhang, M.; Qian, S.L.; Yan, F.; Pei, L.Q.; Jin, S.; Zhao, L.B.; Wu, D.Y.; Tian, Z.Q. Photoinduced surface catalytic coupling reactions of aminothiophenol derivatives investigated by SERS and DFT. J. Phys. Chem. C 2016, 120, 16427–16436. [Google Scholar] [CrossRef]
- Wu, D.Y.; Zhao, L.B.; Liu, X.M.; Huang, R.; Huang, Y.F.; Ren, B.; Tian, Z.Q. Photon-driven charge transfer and photocatalysis of p-aminothiophenol in metal nanogaps: A DFT study of SERS. Chem. Commun. 2011, 47, 2520–2522. [Google Scholar] [CrossRef]
- Huang, Y.F.; Zhang, M.; Zhao, L.B.; Feng, J.M.; Wu, D.Y.; Ren, B.; Tian, Z.Q. Activation of oxygen on gold and silver nanoparticles assisted by surface plasmon resonances. Angew. Chem. Int. Ed. 2014, 53, 2353–2357. [Google Scholar] [CrossRef]
- Tian, X.; Chen, L.; Xu, H.; Sun, M. Ascertaining genuine SERS spectra of p-aminothiophenol. RSC Adv. 2012, 2, 8289–8292. [Google Scholar] [CrossRef]
- Venkatachalam, R.S.; Boerio, F.J.; Roth, P.G. Formation of p, p′-azodibenzoate from p-aminobenzoic acid on silver island films during surface-enhanced Raman scattering. J. Raman Spectrosc. 1988, 19, 281–287. [Google Scholar] [CrossRef]
- Ramsey, J.; Ranganathan, S.; McCreery, R.L.; Zhao, J. Performance Comparisons of Conventional and Line-Focused Surface Raman Spectrometers. Appl. Spectrosc. 2001, 55, 767–773. [Google Scholar] [CrossRef]
- Hauer, P.; Grand, J.; Djorovic, A.; Willmott, G.R.; Le Ru, E.C. Spot Size Engineering in Microscope-Based Laser Spectroscopy. J. Phys. Chem. C 2016, 120, 21104–21113. [Google Scholar] [CrossRef]
- Tuschel, D. Selecting an Excitation Wavelength for Raman Spectroscopy. Spectroscopy 2016, 31, 14–23. [Google Scholar]
- Hemmer, E.; Benayas, A.; Légaré, F.; Vetrone, F. Exploiting the biological windows: Current perspectives on fluorescent bioprobes emitting above 1000 nm. Nanoscale Horiz. 2016, 1, 168–184. [Google Scholar] [CrossRef]
- Hemmer, E.; Venkatachalam, N.; Hyodo, H.; Hattori, A.; Ebina, Y.; Kishimotoac, H.; Soga, K. Upconverting and NIR emitting rare earth based nanostructures for NIR-bioimaging. Nanoscale 2013, 5, 11339–11361. [Google Scholar] [CrossRef]
- Smith, M.; Mancini, M.C.; Nie, S. Second window for in vivo imaging. Nat. Nanotechnol. 2009, 4, 710–711. [Google Scholar] [CrossRef]
- Feis, A.; Gellini, C.; Salvi, P.R.; Becucci, M. Photoacoustic excitation profiles of gold nanoparticles. Photoacoustics 2014, 2, 47–53. [Google Scholar] [CrossRef]
- Von Raben, K.U.; Chang, R.K.; Laube, B.L.; Barber, P.W. Wavelength Dependence of Surface-Enhanced Raman Scattering from Ag Colloids with Adsorbed CN-Complexes, SO3, and Pyridine. J. Phys. Chem. 1984, 88, 5290–5296. [Google Scholar] [CrossRef]
- Fornasiero, D.; Grieser, F. Analysis of the visible absorption and SERS excitation spectra of silver sols. J. Chem. Phys. 1987, 87, 3213. [Google Scholar] [CrossRef]
- Kerker, M.; Siiman, O.; Wang, O.S. Effect of aggregates on Extinction and Surface-Enhanced Raman Scattering Spectra of Colloidal Silver. J. Phys. Chem. 1984, 88, 3168–3170. [Google Scholar] [CrossRef]
- Feilchenfeld, H.; Siiman, O. Surface Raman Excitation and Enhancement Profiles for Chromate, Molybdate, and Tungstate on Colloidal Silver. J. Phys. Chem. 1986, 90, 2163–2168. [Google Scholar] [CrossRef]
- Le Ru, E.C.; Dalley, M.; Etchegoin, P.G. Plasmon resonances of silver colloids studied by surface enhanced Raman spectroscopy. Curr. Appl. Phys. 2006, 6, 411–414. [Google Scholar] [CrossRef]
- Guillot, N.; Shen, H.; Frémaux, B.; Péron, O.; Rinnert, E.; Toury, T.; de la Chapelle, M.L. Surface enhanced Raman scattering optimization of gold nanocylinder arrays: Influence of the localized surface plasmon resonance and excitation wavelength. Appl. Phys. Lett. 2010, 97, 23113. [Google Scholar] [CrossRef]
- Félidj, N.; Aubard, J.; Lévi, G.; Krenn, J.R.; Hohenau, A.; Schider, G.; Leitner, A.; Aussenegg, F.R. Optimized surface-enhanced Raman scattering on gold nanoparticle arrays. Appl. Phys. Lett. 2003, 82, 3095–3097. [Google Scholar] [CrossRef]
- Colas, F.; Cottat, M.; Gillibert, R.; Guillot, N.; Djaker, N.; Lidgi-Guigui, N.; Toury, T.; Barchiesi, D.; Toma, A.; Di Fabrizio, E.; et al. Red-Shift Effects in Surface Enhanced Raman Spectroscopy: Spectral or Intensity Dependence of the Near-Field? J. Phys. Chem. C 2016. [Google Scholar] [CrossRef]
- Doherty, M.D.; Murphy, A.; Pollard, R.J.; Dawson, P. Surface-enhanced Raman scattering from metallic nanostructures: Bridging the gap between the near-field and far-field responses. Phys. Rev. X 2013, 3, 1–12. [Google Scholar] [CrossRef]
- Becucci, M.; Bracciali, M.; Ghini, G.; Lofrumento, C.; Pietraperzia, G.; Ricci, M.; Tognaccini, L.; Trigari, S.; Gellini, C.; Feis, A. Silver nanowires as infrared-active materials for surface-enhanced Raman scattering. Nanoscale 2018, 10, 9329–9337. [Google Scholar] [CrossRef]
- Cacciola, A.; Iatì, M.A.; Saija, R.; Borghese, F.; Denti, P.; Maragò, O.M.; Gucciardi, P.G. Spectral shift between the near-field and far-field optoplasmonic response in gold nanospheres, nanoshells, homo- and hetero-dimers. J. Quant. Spectrosc. Radiat. Transf. 2017, 195, 97–106. [Google Scholar] [CrossRef]
- Zuloaga, J.; Nordlander, P. On the energy shift between near-field and far-field peak intensities in localized plasmon systems. Nano Lett. 2011, 11, 1280–1283. [Google Scholar] [CrossRef]
- Lakowicz, J.R. Radiative decay engineering: Biophysical and biomedical applications. Anal. Biochem. 2001, 298, 1–24. [Google Scholar] [CrossRef]
- Dulkeith, E.; Morteani, A.C.; Niedereichholz, T.; Klar, T.A.; Feldmann, J.; Levi, S.A.; van Veggel, F.C.J.M.; Reinhoudt, D.N.; Möller, M.; Gittins, D.I. Fluorescence quenching of dye molecules near gold nanoparticles: Radiative and nonradiative effects. Phys. Rev. Lett. 2002, 89, 203002. [Google Scholar] [CrossRef]
- Jennings, T.L.; Singh, M.P.; Strouse, G.F. Fluorescent lifetime quenching near d = 1.5 nm gold nanoparticles: Probing NSET validity. J. Am. Chem. Soc. 2006, 128, 5462–5467. [Google Scholar] [CrossRef]
- Rosi, F.; Paolantoni, M.; Clementi, C.; Doherty, B.; Miliani, C.; Brunetti, B.G.; Sgamellotti, A. Subtracted shifted Raman spectroscopy of organic dyes and lakes. J. Raman Spectrosc. 2010, 2009, 452–458. [Google Scholar] [CrossRef]
- Conti, C.; Botteon, A.; Bertasa, M.; Colombo, C.; Realini, M.; Sali, D. Portable Sequentially Shifted Excitation Raman spectroscopy as an innovative tool for in situ chemical interrogation of painted surfaces. Analyst 2016, 141, 4599–4607. [Google Scholar] [CrossRef]
- Matousek, P.; Towrie, M.; Parker, A.W. Fluorescence background suppression in Raman spectroscopy using combined Kerr gated and shifted excitation Raman difference techniques. J. Raman Spectrosc. 2002, 33, 238–242. [Google Scholar] [CrossRef]
- Cooper, J.B.; Abdelkader, M.; Wise, L. Sequentially Shifted Excitation Raman Spectroscopy: Novel Algorithm and Instrumentation for Fluorescence-Free Raman Spectroscopy in Spectral Space. Appl. Spectrosc. 2013, 67, 973–984. [Google Scholar] [CrossRef] [PubMed]
- Cooper, J.B.; Marshall, S.; Jones, R.; Abdelkader, M.; Wise, K.L. Spatially compressed dual-wavelength excitation Raman spectrometer. Appl. Opt. 2014, 53, 3333–3340. [Google Scholar] [CrossRef] [PubMed]
- Adar, F. Considerations of Grating Selection in Optimizing a Raman Specrograph. Spectroscopy 2013, 28. Available online: http://www.spectroscopyonline.com/considerations-grating-selection-optimizing-raman-spectrograph (accessed on 1 October 2013).
- Choquette, S.J.; Etz, E.S.; Hurst, W.S.; Blackburn, D.H.; Leigh, S.D. Relative intensity correction of Raman spectrometers: NIST SRMs 2241 through 2243 for 785 nm, 532 nm, and 488 nm/514.5 nm excitation. Appl. Spectrosc. 2007, 61, 117–129. [Google Scholar] [CrossRef] [PubMed]
- Ray, K.G.; McCreery, R.L. Simplified calibration of instrument response function for Raman spectrometers based on luminescent intensity standards. Appl. Spectrosc. 1997, 51, 108–116. [Google Scholar] [CrossRef]
- Frost, K.J.; McCreery, R.L. Calibration of Raman Spectrometer Instrument Response Function with Luminescence Standards: An Update. Appl. Spectrosc. 1998, 52, 1614–1618. [Google Scholar] [CrossRef]
- Brown, R.J.C.; Milton, M.J.T. Nanostructures and nanostructured substrates for surface-enhanced Raman scattering (SERS). J. Raman Spectrosc. 2008, 39, 1313–1326. [Google Scholar] [CrossRef]
- Bonifacio, A.; Cervo, S.; Sergo, V. Label-free surface-enhanced Raman spectroscopy of biofluids: Fundamental aspects and diagnostic applications. Anal. Bioanal. Chem. 2015, 407, 8265–8277. [Google Scholar] [CrossRef]
- Garcia-Rico, E.; Alvarez-Puebla, R.A.; Guerrini, L. Direct surface-enhanced Raman scattering (SERS) spectroscopy of nucleic acids: From fundamental studies to real-life applications. Chem. Soc. Rev. 2018, 47, 4909–4923. [Google Scholar] [CrossRef]
- Fabris, L. Gold-based SERS tags for biomedical imaging. J. Opt. 2015, 17, 114002. [Google Scholar] [CrossRef]
- Hakonen, A.; Andersson, P.O.; Stenbæk Schmidt, M.; Rindzevicius, T.; Käll, M. Explosive and chemical threat detection by surface-enhanced Raman scattering: A review. Anal. Chim. Acta 2015, 893, 1–13. [Google Scholar] [CrossRef] [PubMed]
- Fateixa, S.; Nogueira, H.I.S.; Trindade, T. Hybrid nanostructures for SERS: Materials development and chemical detection. Phys. Chem. Chem. Phys. 2015, 17, 21046–21071. [Google Scholar] [CrossRef] [PubMed]
- Ros, I.; Placido, T.; Amendola, V.; Marinzi, C.; Manfredi, N.; Comparelli, R.; Striccoli, M.; Agostiano, A.; Abbotto, A.; Pedron, D.; et al. SERS Properties of Gold Nanorods at Resonance with Molecular, Transverse, and Longitudinal Plasmon Excitations. Plasmonics 2014, 9, 581–593. [Google Scholar] [CrossRef] [PubMed]
- Halas, N.J.; Lal, S.; Link, S.; Chang, W.S.; Natelson, D.; Hafner, J.H.; Nordlander, P. A plethora of plasmonics from the laboratory for nanophotonics at Rice University. Adv. Mater. 2012, 24, 4842–4877. [Google Scholar] [CrossRef]
- Lohse, S.E.; Murphy, C.J. The quest for shape control: A history of gold nanorod synthesis. Chem. Mater. 2013, 25, 1250–1261. [Google Scholar] [CrossRef]
- Xia, Y.; Gilroy, K.D.; Peng, H.C.; Xia, X. Seed-Mediated Growth of Colloidal Metal Nanocrystals. Angew. Chem. Int. Ed. 2017, 56, 60–95. [Google Scholar] [CrossRef]
- Lohse, S.E.; Burrows, N.D.; Scarabelli, L.; Liz-Marzán, L.M.; Murphy, C.J. Anisotropic noble metal nanocrystal growth: The role of halides. Chem. Mater. 2014, 26, 34–43. [Google Scholar] [CrossRef]
- Dreaden, E.C.; Alkilany, A.M.; Huang, X.; Murphy, C.J.; El-Sayed, M.A. The golden age: Gold nanoparticles for biomedicine. Chem. Soc. Rev. 2012, 41, 2740–2779. [Google Scholar] [CrossRef] [PubMed]
- Sun, Y.; Xia, Y. Shape-Controlled Synthesis of Gold and Silver Nanoparticles. Science 2002, 298, 2176–2179. [Google Scholar] [CrossRef]
- Xia, Y.; Xiong, Y.; Lim, B.; Skrabalak, S.E. Shape-controlled synthesis of metal nanocrystals: Simple chemistry meets complex physics? Angew. Chem. Int. Ed. 2009, 48, 60–103. [Google Scholar] [CrossRef] [PubMed]
- Indrasekara, A.S.D.S.; Meyers, S.; Shubeita, S.; Feldman, L.C.; Gustafsson, T.; Fabris, L. Gold nanostar substrates for SERS-based chemical sensing in the femtomolar regime. Nanoscale 2014, 6, 8891–8899. [Google Scholar] [CrossRef] [PubMed]
- Rycenga, M.; Cobley, C.M.; Zeng, J.; Li, W.; Moran, C.H.; Zhang, Q.; Qin, D.; Xia, Y. Controlling the synthesis and assembly of silver nanostructures for plasmonic applications. Chem. Rev. 2011, 111, 3669–3712. [Google Scholar] [CrossRef] [PubMed]
- Wiley, B.; Sun, Y.; Xia, Y. Synthesis of silver nanostructures with controlled shapes and properties. Acc. Chem. Res. 2007, 40, 1067–1076. [Google Scholar] [CrossRef] [PubMed]
- Poletti, A.; Fracasso, G.; Conti, G.; Pilot, R.; Amendola, V. Laser generated gold nanocorals with broadband plasmon absorption for photothermal applications. Nanoscale 2015, 7, 13702–13714. [Google Scholar] [CrossRef]
- Burda, C.; Chen, X.; Narayanan, R.; El-Sayed, M.A. Chemistry and Properties of Nanocrystals of Different Shapes. Chem. Rev. 2005, 105, 1025–1102. [Google Scholar] [CrossRef]
- Turkevich, J.; Stevenson, P.C.; Hillier, J. The formation of colloidal gold. J. Phys. Chem. 1953, 57, 670–673. [Google Scholar] [CrossRef]
- Lee, P.C.; Meisel, D. Adsorption and Surface-Enhanced Raman of Dyes on Silver and Gold Sols. J. Phys. Chem. 1982, 86, 3391–3395. [Google Scholar] [CrossRef]
- Amendola, V.; Meneghetti, M. What controls the composition and the structure of nanomaterials generated by laser ablation in liquid solution? Phys. Chem. Chem. Phys. 2013, 15, 3027–3046. [Google Scholar] [CrossRef] [PubMed]
- Amendola, V.; Meneghetti, M. Laser ablation synthesis in solution and size manipulation of noble metal nanoparticles. Phys. Chem. Chem. Phys. 2009, 11, 3805–3821. [Google Scholar] [CrossRef] [PubMed]
- Vlčková, B.; Moskovits, M.; Pavel, I.; Šišková, K.; Sládková, M.; Šlouf, M. Single-molecule surface-enhanced Raman spectroscopy from a molecularly-bridged silver nanoparticle dimer. Chem. Phys. Lett. 2008, 455, 131–134. [Google Scholar] [CrossRef]
- Graham, D.; Thompson, D.G.; Smith, W.E.; Faulds, K. Control of enhanced Raman scattering using a DNA-based assembly process of dye-coded nanoparticles. Nat. Nanotechnol. 2008, 3, 548–551. [Google Scholar] [CrossRef] [PubMed]
- Guerrini, L.; Graham, D. Molecularly-mediated assemblies of plasmonic nanoparticles for Surface-Enhanced Raman Spectroscopy applications. Chem. Soc. Rev. 2012, 41, 7085–7107. [Google Scholar] [CrossRef] [PubMed]
- Foti, A.; D’Andrea, C.; Villari, V.; Micali, N.; Donato, M.G.; Fazio, B.; Maragò, O.M.; Gillibert, R.; de la Chapelle, M.L.; Gucciardi, P.G. Optical aggregation of gold nanoparticles for SERS detection of proteins and toxins in liquid environment: Towards ultrasensitive and selective detection. Materials 2018, 11, 440. [Google Scholar] [CrossRef] [PubMed]
- Giallongo, G.; Pilot, R.; Durante, C.; Rizzi, G.A.; Signorini, R.; Bozio, R.; Gennaro, A.; Granozzi, G. Silver Nanoparticle Arrays on a DVD-Derived Template: An easy&cheap SERS Substrate. Plasmonics 2011, 6, 725–733. [Google Scholar] [CrossRef]
- Freeman, R.G.; Grabar, K.C.; Allison, K.J.; Bright, R.M.; Davis, J.A.; Guthrie, A.P.; Hommer, M.B.; Jackson, M.A.; Smith, P.C.; Walter, D.G.; et al. Self-Assembled Metal Colloid Monolayers: An Approach to SERS Substrates. Science 1995, 267, 1629–1632. [Google Scholar] [CrossRef] [PubMed]
- Grabar, K.C.; Smith, P.C.; Musick, M.D.; Davis, J.A.; Walter, D.G.; Jackson, M.A.; Guthrie, A.P.; Natan, M.J. Kinetic control of interparticle spacing in Au colloid-based surfaces: Rational nanometer-scale architecture. J. Am. Chem. Soc. 1996, 118, 1148–1153. [Google Scholar] [CrossRef]
- Toderas, F.; Baia, M.; Baia, L.; Astilean, S. Controlling gold nanoparticle assemblies for efficient surface-enhanced Raman scattering and localized surface plasmon resonance sensors. Nanotechnology 2007, 18, 255702. [Google Scholar] [CrossRef]
- Betz, J.F.; Yu, W.W.; Cheng, Y.; White, I.M.; Rubloff, G.W. Simple SERS substrates: Powerful, portable, and full of potential. Phys. Chem. Chem. Phys. 2014, 16, 2224–2239. [Google Scholar] [CrossRef] [PubMed]
- Yu, W.W.; White, I.M. Inkjet Printed Surface Enhanced Raman Spectroscopy Array on Cellulose Paper. Anal. Chem. 2010, 82, 9626–9630. [Google Scholar] [CrossRef]
- Hoppmann, E.P.; Yu, W.W.; White, I.M. Highly sensitive and flexible inkjet printed SERS sensors on paper. Methods 2013, 63, 219–224. [Google Scholar] [CrossRef]
- Restaino, S.M.; White, I.M. Inkjet-printed paper surface enhanced Raman spectroscopy (SERS) sensors: Portable, low cost diagnostics for microRNA. In Proceedings of the 2016 IEEE Sensors, Orlando, FL, USA, 30 October–3 November 2016; pp. 1–3. [Google Scholar] [CrossRef]
- Wu, W.; Liu, L.; Dai, Z.; Liu, J.; Yang, S.; Zhou, L.; Xiao, X.; Jiang, C.; Roy, V.A.L. Low-Cost, Disposable, Flexible and Highly Reproducible Screen Printed SERS Substrates for the Detection of Various Chemicals. Sci. Rep. 2015, 5, 10208. [Google Scholar] [CrossRef]
- Qu, L.-L.; Li, D.W.; Xue, J.Q.; Zhai, W.L.; Fossey, J.S.; Long, Y.T. Batch fabrication of disposable screen printed SERS arrays. Lab Chip 2012, 12, 876–881. [Google Scholar] [CrossRef]
- Polavarapu, L.; La Porta, A.; Novikov, S.M.; Coronado-Puchau, M.; Liz-Marzán, L.M. Pen-on-paper approach toward the design of universal surface enhanced Raman scattering substrates. Small 2014, 10, 3065–3071. [Google Scholar] [CrossRef]
- Zhang, L.; Gong, X.; Bao, Y.; Zhao, Y.; Xi, M.; Jiang, C.; Fong, H. Electrospun nanofibrous membranes surface-decorated with silver nanoparticles as flexible and active/sensitive substrates for surface-enhanced Raman scattering. Langmuir 2012, 28, 14433–14440. [Google Scholar] [CrossRef]
- Yang, T.; Yang, H.; Zhen, S.J.; Huang, C.Z. Hydrogen-bond-mediated in situ fabrication of AgNPs/Agar/PAN electrospun nanofibers as reproducible SERS substrates. ACS Appl. Mater. Interfaces 2015, 7, 1586–1594. [Google Scholar] [CrossRef]
- He, D.; Hu, B.; Yao, Q.-F.; Wang, K.; Yu, S.-H. Large-Scale Synthesis of Flexible Free-Sensitivity: Electrospun PVA Nanofibers of Silver Nanoparticles. ACS Nano 2009, 3, 3993–4002. [Google Scholar] [CrossRef]
- Lee, M.R.; Lee, H.K.; Yang, Y.; Koh, C.S.L.; Lay, C.L.; Lee, Y.H.; Phang, I.Y.; Ling, X.Y. Direct Metal Writing and Precise Positioning of Gold Nanoparticles within Microfluidic Channels for SERS Sensing of Gaseous Analytes. ACS Appl. Mater. Interfaces 2017, 9, 39584–39593. [Google Scholar] [CrossRef]
- Xu, B.-B.; Ma, Z.-C.; Wang, L.; Zhang, R.; Niu, L.-G.; Yang, Z.; Zhang, Y.-L.; Zheng, W.-H.; Zhao, B.; Xu, Y.; et al. Localized flexible integration of high-efficiency surface enhanced Raman scattering (SERS) monitors into microfluidic channels. Lab Chip 2011, 11, 3347–3351. [Google Scholar] [CrossRef]
- Das, G.; Patra, N.; Gopalakrishnan, A.; Zaccaria, R.P.; Toma, A.; Thorat, S.; Di Fabrizio, E.; Diaspro, A.; Salerno, M. Fabrication of large-area ordered and reproducible nanostructures for SERS biosensor application. Analyst 2012, 137, 1785–1972. [Google Scholar] [CrossRef]
- Giallongo, G.; Durante, C.; Pilot, R.; Garoli, D.; Bozio, R.; Romanato, F.; Gennaro, A.; Rizzi, G.A.; Granozzi, G. Growth and optical properties of silver nanostructures obtained on connected anodic aluminum oxide templates. Nanotechnology 2012, 23, 325604. [Google Scholar] [CrossRef]
- Toccafondi, C.; Zaccaria, R.P.; Dante, S.; Salerno, M. Fabrication of Gold-Coated Ultra-Thin Anodic Porous Alumina Substrates for Augmented SERS. Materials 2016, 9, 403. [Google Scholar] [CrossRef] [PubMed]
- Marinaro, G.; Das, G.; Giugni, A.; Allione, M.; Torre, B.; Candeloro, P.; Kosel, J.; Di Fabrizio, E. Plasmonic nanowires for wide wavelength range molecular sensing. Materials 2018, 11, 827. [Google Scholar] [CrossRef]
- Lee, S.J.; Morrill, A.R.; Moskovits, M. Hot Spots in Silver Nanowire Bundles for Surface-Enhanced Raman Spectroscopy. J. Am. Chem. Soc. 2006, 128, 2200–2201. [Google Scholar] [CrossRef]
- Geng, F.; Zhao, H.; Fu, Q.; Mi, Y.; Miao, L.; Li, W. Gold nanochestnut arrays as ultra-sensitive SERS substrate for detecting trace pesticide residue. Nanotechnology 2018, 29, 295502. [Google Scholar] [CrossRef]
- De Angelis, F.; Gentile, F.; Mecarini, F.; Das, G.; Moretti, M.; Candeloro, P.; Coluccio, M.L.; Cojoc, G.; Accardo, A.; Liberale, C.; et al. Breaking the diffusion limit with super-hydrophobic delivery of molecules to plasmonic nanofocusing SERS structures. Nat. Photonics 2011, 5, 682–687. [Google Scholar] [CrossRef]
- De Angelis, F.; Das, G.; Patrizio, C.; Patrini, M.; Galli, M.; Bek, A.; Lazzarino, M.; Maksymov, I.; Liberale, C.; Andreani, L.C.; et al. Nanoscale chemical mapping using three-dimensional adiabatic compression of surface plasmon polaritons. Nat. Nanotechnol. 2009, 5, 67–72. [Google Scholar] [CrossRef]
- Chu, Y.; Banaee, M.G.; Crozier, K.B. Double-resonance plasmon substrates for surface-enhanced raman scattering with enhancement at excitation and stokes frequencies. ACS Nano 2010, 4, 2804–2810. [Google Scholar] [CrossRef]
- Kanipe, K.N.; Chidester, P.P.F.; Stucky, G.D.; Moskovits, M. Large Format Surface-Enhanced Raman Spectroscopy Substrate Optimized for Enhancement and Uniformity. ACS Nano 2016, 10, 7566–7571. [Google Scholar] [CrossRef] [PubMed]
- Siegfried, T.; Ekinci, Y.; Solak, H.H.; Martin, O.J.F.; Sigg, H. Fabrication of sub-10 nm gap arrays over large areas for plasmonic sensors. Appl. Phys. Lett. 2011, 99, 263302. [Google Scholar] [CrossRef]
- Hu, M.; Ou, F.S.; Wu, W.; Naumov, I.; Li, X.; Bratkovsky, A.M.; Williams, R.S.; Li, Z. Gold nanofingers for molecule trapping and detection. J. Am. Chem. Soc. 2010, 132, 12820–12822. [Google Scholar] [CrossRef] [PubMed]
- Ou, F.S.; Hu, M.; Naumov, I.; Kim, A.; Wu, W.; Bratkovsky, A.M.; Li, X.; Williams, R.S.; Li, Z. Hot-spot engineering in polygonal nanofinger assemblies for surface enhanced Raman spectroscopy. Nano Lett. 2011, 11, 2538–2542. [Google Scholar] [CrossRef] [PubMed]
- Zhang, C.; Yi, P.; Peng, L.; Lai, X.; Chen, J.; Huang, M.; Ni, J. Continuous fabrication of nanostructure arrays for flexible surface enhanced Raman scattering substrate. Sci. Rep. 2017, 7, 1–9. [Google Scholar] [CrossRef] [PubMed]
- Kahraman, M.; Daggumati, P.; Kurtulus, O.; Seker, E.; Wachsmann-Hogiu, S. Fabrication and characterization of flexible and tunable plasmonic nanostructures. Sci. Rep. 2013, 3, 3396. [Google Scholar] [CrossRef]
- Sigma Aldrich. Available online: https://www.sigmaaldrich.com/ (accessed on 14 April 2019).
- Nanopartz. Available online: https://www.nanopartz.com (accessed on 14 April 2019).
- Nanocs. Available online: http://www.nanocs.com (accessed on 14 April 2019).
- Silmeco. Available online: https://www.silmeco.com (accessed on 14 April 2019).
- Horiba. Available online: http://www.horiba.com/us/en/scientific/about-us/horiba-jobin-yvon/ (accessed on 14 April 2019).
- Ocean Optics. Available online: https://oceanoptics.com (accessed on 14 April 2019).
- AtoID. Available online: http://www.atoid.com (accessed on 14 April 2019).
- Pamies, R.; Cifre, J.G.H.; Espín, V.F.; Collado-González, M.; Baños, F.G.D.; De La Torre, J.G. Aggregation behaviour of gold nanoparticles in saline aqueous media. J. Nanopart. Res. 2014, 16, 2376. [Google Scholar] [CrossRef]
- Ohshima, H. Interaction of colloidal particles. In Colloid and Interface Science in Pharmaceutical Research and Development; Ohshima, H., Makino, K., Eds.; Elsevier: Amsterdam, The Netherlands, 2014; pp. 1–28. [Google Scholar]
- Tantra, R.; Brown, R.J.C.; Milton, M.J.T. Strategy to improve the reproducibility of colloidal SERS. J. Raman Spectrosc. 2007, 38, 1469–1479. [Google Scholar] [CrossRef]
- Meyer, M.; Le Ru, E.C.; Etchegoin, P.G. Self-limiting aggregation leads to long-lived metastable clusters in colloidal solutions. J. Phys. Chem. B 2006, 110, 6040–6047. [Google Scholar] [CrossRef] [PubMed]
- Lehmuskero, A.; Johansson, P.; Rubinsztein-Dunlop, H.; Tong, L.; Käll, M. Laser trapping of colloidal metal nanoparticles. ACS Nano 2015, 9, 3453–3469. [Google Scholar] [CrossRef]
- Durante, C.; Perazzolo, V.; Isse, A.A.; Favaro, M.; Granozzi, G.; Gennaro, A. Electrochemical Activation of Carbon-Halogen Bonds: Electrocatalysis at Palladium-Copper Nanoparticles. ChemElectroChem 2014, 1, 1370–1381. [Google Scholar] [CrossRef]
- Figueredo-Sobrinho, F.A.A.; Santos, L.P.M.; Leite, D.S.; Craveiro, D.C.; Santos, S.H.; Eguiluz, K.I.B.; Salazar-Banda, G.R.; Maciel, C.D.; Coutinho-Neto, M.D.; Homem-de-Mello, P.; et al. Morphological dependence of silver electrodeposits investigated by changing the ionic liquid solvent and the deposition parameters. Phys. Chem. Chem. Phys. 2016, 18, 7242–7250. [Google Scholar] [CrossRef]
- Tang, B.; Xu, S.; An, J.; Zhao, B.; Xu, W.; Lombardi, J.R. Kinetic effects of halide ions on the morphological evolution of silver nanoplates. Phys. Chem. Chem. Phys. 2009, 11, 10286. [Google Scholar] [CrossRef] [PubMed]
- Ibañez, D.; Izquierdo, D.; Fernandez-Blanco, C.; Heras, A.; Colina, A. Electrodeposition of silver nanoparticles in the presence of different complexing agents by time-resolved Raman spectroelectrochemistry. J. Raman Spectrosc. 2018, 49, 482–492. [Google Scholar] [CrossRef]
- Ju, W.; Favaro, M.; Durante, C.; Perini, L.; Agnoli, S.; Schneider, O.; Stimming, U.; Granozzi, G. Pd Nanoparticles deposited on nitrogen-doped HOPG: New Insights into the Pd-catalyzed Oxygen Reduction Reaction. Electrochim. Acta 2014, 141, 89–101. [Google Scholar] [CrossRef]
- Zou, S.Z.; Chen, Y.X.; Mao, B.W.; Ren, B.; Tian, Z.Q. SERS studies on electrodelelectrolyte interfacial water I. Ion effects in the negative potential region. J. Electroanal. Chem. 1997, 424, 19–24. [Google Scholar] [CrossRef]
- Ward Jones, S.E.; Campbell, F.W.; Baron, R.; Xiao, L.; Compton, R.G. Particle Size and Surface Coverage Effects in the Stripping Voltammetry of Silver Nanoparticles: Theory and Experiment. J. Phys. Chem. C 2008, 112, 17820–17827. [Google Scholar] [CrossRef]
- He, P.; Liu, H.; Li, Z.; Liu, Y.; Xu, X.; Li, J. Electrochemical Deposition of Silver in Room-Temperature Ionic Liquids and Its Surface-Enhanced Raman Scattering Effect. Langmuir 2004, 20, 10260–10267. [Google Scholar] [CrossRef] [PubMed]
- Dimitrov, A.T.; Jordanov, S.H.; Popov, K.I.; Pavlovic, M.G.; Radmilovic, V. Electrodeposition of Ag from nitrate solutions: Part I. Effect of phosphate ions on morphology. J. Appl. Electrochem. 1998, 28, 791–796. [Google Scholar] [CrossRef]
- Abbott, A.P.; El Ttaib, K.; Frisch, G.; Ryder, K.S.; Weston, D. The electrodeposition of silver composites using deep eutectic solvents. Phys. Chem. Chem. Phys. 2012, 14, 2443–2449. [Google Scholar] [CrossRef]
- Suryanto, B.H.R.; Gunawan, C.A.; Lu, X.; Zhao, C. Tuning the electrodeposition parameters of silver to yield micro/nano structures from room temperature protic ionic liquids. Electrochim. Acta 2012, 81, 98–105. [Google Scholar] [CrossRef]
- Fathi, F.; Schlitt, M.; Pedersen, D.B.; Kraatz, H.-B. Chemical Behavior of Electrochemically Generated Nanostructured Silver Surfaces. Langmuir 2011, 27, 12098–12105. [Google Scholar] [CrossRef]
- Acres, R.G.; Ellis, A.V.; Alvino, J.; Lenahan, C.E.; Khodakov, D.A.; Metha, G.F.; Andersson, G.G. Molecular Structure of 3-Aminopropyltriethoxysilane Layers Formed on Silanol-Terminated Silicon Surfaces. J. Phys. Chem. C 2012, 116, 6289–6297. [Google Scholar] [CrossRef]
- Vicente, A.T.; Araújo, A.; Mendes, M.J.; Nunes, D.; Oliveira, M.J.; Sanchez-Sobrado, O.; Ferreira, M.P.; Águas, H.; Fortunato, E.; Martins, R. Multifunctional cellulose-paper for light harvesting and smart sensing applications. J. Mater. Chem. C 2018, 6, 3143–3181. [Google Scholar] [CrossRef]
- Oliveira, M.J.; Quaresma, P.; De Almeida, M.P.; Araújo, A.; Pereira, E.; Fortunato, E.; Martins, R.; Franco, R.; Águas, H. Office paper decorated with silver nanostars-an alternative cost effective platform for trace analyte detection by SERS. Sci. Rep. 2017, 7, 1–14. [Google Scholar] [CrossRef]
- Ngo, Y.H.; Li, D.; Simon, G.P.; Garnier, G. Gold nanoparticle-paper as a three-dimensional surface enhanced raman scattering substrate. Langmuir 2012, 28, 8782–8790. [Google Scholar] [CrossRef]
- Dalla Marta, S.; Novara, C.; Giorgis, F.; Bonifacio, A.; Sergo, V. Optimization and characterization of paper-made Surface Enhanced Raman Scattering (SERS) substrates with Au and Ag NPs for quantitative analysis. Materials 2017, 10, 1365. [Google Scholar] [CrossRef]
- Webb, J.A.; Aufrecht, J.; Hungerford, C.; Bardhan, R. Ultrasensitive analyte detection with plasmonic paper dipsticks and swabs integrated with branched nanoantennas. J. Mater. Chem. C 2014, 2, 10446–10454. [Google Scholar] [CrossRef]
- Wang, C.; Liu, B.; Dou, X. Silver nanotriangles-loaded filter paper for ultrasensitive SERS detection application benefited by interspacing of sharp edges. Sens. Actuators B Chem. 2016, 231, 357–364. [Google Scholar] [CrossRef]
- Zhang, R.; Xu, B.B.; Liu, X.Q.; Zhang, Y.L.; Xu, Y.; Chen, Q.D.; Sun, H.B. Highly efficient SERS test strips. Chem. Commun. 2012, 48, 5913–5915. [Google Scholar] [CrossRef]
- Yu, W.W.; White, I.M. Inkjet-printed paper-based SERS dipsticks and swabs for trace chemical detection. Analyst 2013, 138, 1020–1025. [Google Scholar] [CrossRef]
- Greiner, A.; Wendorff, J.H. Electrospinning: A Fascinating Method for the Preparation of Ultrathin Fibers. Angew. Chem. Int. Ed. 2007, 46, 5670–5703. [Google Scholar] [CrossRef]
- Huang, Y.; Fang, Y.; Zhang, Z.; Zhu, L.; Sun, M. Nanowire-supported plasmonic waveguide for remote excitation of surface-enhanced Raman scattering. Light Sci. Appl. 2014, 3, e199. [Google Scholar] [CrossRef]
- Coca-López, N.; Hartmann, N.F.; Mancabelli, T.; Kraus, J.; Günther, S.; Comin, A.; Hartschuh, A. Remote excitation and detection of surface-enhanced Raman scattering from graphene. Nanoscale 2018, 10, 10498–10504. [Google Scholar] [CrossRef]
- Fang, Y.; Wei, H.; Hao, F.; Nordlander, P.; Xu, H. Raman Scattering Using Propagating Ag Nanowire Plasmons. Nano Lett. 2009, 9, 2049–2053. [Google Scholar] [CrossRef] [PubMed]
- Hutchison, J.A.; Centeno, S.P.; Odaka, H.; Fukumura, H.; Hofkens, J.; Uji-i, H. Subdiffraction limited, remote excitation of surface enhanced raman scattering. Nano Lett. 2009, 9, 995–1001. [Google Scholar] [CrossRef] [PubMed]
- Walcarius, A.; Sibottier, E.; Etienne, M.; Ghanbaja, J. Electrochemically assisted self-assembly of mesoporous silica thin films. Nat. Mater. 2007, 6, 602–608. [Google Scholar] [CrossRef] [PubMed]
- Masuda, H.; Fukuda, K. Ordered Metal Nanohole Arrays Made by a Two-Step Replication of Honeycomb Structures of Anodic Alumina. Science 1995, 268, 1466–1468. [Google Scholar] [CrossRef] [PubMed]
- Volgin, V.M.; Lyubimov, V.V.; Gnidina, I.V.; Davydov, A.D. Modeling of Formation of Nanostructured Metal Surfaces by Electrodeposition through a Monolayer Colloidal Crystal Mask. Procedia CIRP 2015, 37, 89–94. [Google Scholar] [CrossRef]
- Wang, H.H.; Liu, C.Y.; Wu, S.B.; Liu, N.W.; Peng, C.Y.; Chan, T.H.; Hsu, C.F.; Wang, J.K.; Wang, Y.L. Highly raman-enhancing substrates based on silver nanoparticle arrays with tunable sub-10 nm gaps. Adv. Mater. 2006, 18, 491–495. [Google Scholar] [CrossRef]
- Stewart, M.; Anderton, C.R.; Thompson, L.B.; Maria, J.; Gray, S.K.; Rogers, J.A.; Nuzzo, R.G. Nanostructured Plasmonic Sensors. Chem. Rev. 2008, 494–521. [Google Scholar] [CrossRef]
- Kahl, M.; Voges, E.; Kostrewa, S.; Viets, C.; Hill, W. Periodically structured metallic substrates for SERS. Sens.Actuators B Chem. 1998, 51, 285–291. [Google Scholar] [CrossRef]
- Sarangan, A. Nanofabrication. Principles to Laboratory Practice; CRC Press, Taylor & Francis Group: Boca Raton, FL, USA, 2017. [Google Scholar]
- Cui, Z. Nanofabrication. Principles, Capabilities and Limits; Springer: New York, NY, USA, 2008. [Google Scholar]
- Romanato, F.; Pilot, R.; Massari, M.; Ongarello, T.; Pirruccio, G.; Zilio, P.; Ruffato, G.; Carli, M.; Sammito, D.; Giorgis, V.; et al. Design, fabrication and characterization of plasmonic gratings for SERS. Microelectron. Eng. 2011, 88, 2717–2720. [Google Scholar] [CrossRef]
- Lu, C.; Lipson, R.H. Interference lithography: A powerful tool for fabricating periodic structures. Laser Photonics Rev. 2010, 4, 568–580. [Google Scholar] [CrossRef]
- Auzelyte, V.; Dais, C.; Farquet, P.; Grützmacher, D.; Heyderman, L.J.; Luo, F.; Olliges, S.; Padeste, C.; Sahoo, P.K.; Thomson, T.; et al. Extreme ultraviolet interference lithography at the Paul Scherrer Institut. J. Micro/Nanolith. MEMS MOEMS 2009, 8, 21204. [Google Scholar] [CrossRef]
- Rogers, J.A.; Nuzzo, R.G. Recent progress in soft lithography. Mater. Today 2005, 8, 50–56. [Google Scholar] [CrossRef]
- Xia, Y.; Whitesides, G.M. Soft Lithography. Angew. Chem. Int. Ed. 1998, 37, 550–575. [Google Scholar] [CrossRef]
- Qin, D.; Xia, Y.; Whitesides, G.M. Soft lithography for micro- and nanoscale patterning. Nat. Protoc. 2010, 5, 491–502. [Google Scholar] [CrossRef]
- Xia, Y.; Whitesides, G.M. Soft Lithography. Annu. Rev. Mater. Sci. 1998, 28, 153–184. [Google Scholar] [CrossRef]
- Lane, L.A.; Qian, X.; Nie, S. SERS Nanoparticles in Medicine: From Label-Free Detection to Spectroscopic Tagging. Chem. Rev. 2015, 115, 10489–10529. [Google Scholar] [CrossRef]
- Wang, Y.; Yan, B.; Chen, L. SERS Tags: Novel optical nanoprobes for bioanalysis. Chem. Rev. 2013, 113, 1391–1428. [Google Scholar] [CrossRef] [PubMed]
- Amendola, V.; Meneghetti, M.; Fiameni, S.; Polizzi, S.; Fracasso, G.; Boscaini, A.; Colombatti, M. SERS labels for quantitative assays: Application to the quantification of gold nanoparticles uptaken by macrophage cells. Anal. Methods 2011, 3, 849–856. [Google Scholar] [CrossRef][Green Version]
- Su, X.; Zhang, J.; Sun, L.; Koo, T.; Chan, S.; Sundararajan, N.; Yamakawa, M.; Berlin, A.A. Composite Organic—Inorganic Nanoparticles (COINs) with Chemically Encoded Optical Signatures. Nano Lett. 2005, 5, 49–54. [Google Scholar] [CrossRef]
- Braun, G.B.; Lee, S.J.; Laurence, T.; Fera, N.; Fabris, L.; Bazan, G.C.; Moskovits, M.; Reich, N.O. Generalized Approach to SERS-Active Nanomaterials via Controlled Nanoparticle Linking, Polymer Encapsulation, and Small-Molecule Infusion. J. Phys. Chem. C 2009, 113, 13622–13629. [Google Scholar] [CrossRef]
- Bertorelle, F.; Pinto, M.; Zappon, R.; Pilot, R.; Litti, L.; Fiameni, S.; Conti, G.; Gobbo, M.; Toffoli, G.; Colombatti, M.; et al. Safe core-satellite magneto-plasmonic nanostructures for efficient targeting and photothermal treatment of tumor cells. Nanoscale 2018, 10, 976–984. [Google Scholar] [CrossRef] [PubMed]
- Tang, X.; Dong, R.; Yang, L.; Liu, J. Fabrication of Au nanorod-coated Fe3O4 microspheres as SERS substrate for pesticide analysis by near-infrared excitation. J. Raman Spectrosc. 2015, 46, 470–475. [Google Scholar] [CrossRef]
- Qian, X.; Peng, X.-H.; Ansari, D.O.; Yin-Goen, Q.; Chen, G.Z.; Shin, D.M.; Yang, L.; Young, A.N.; Wang, M.D.; Nie, S. In vivo tumor targeting and spectroscopic detection with surface-enhanced Raman nanoparticle tags. Nat. Biotechnol. 2008, 26, 83–90. [Google Scholar] [CrossRef] [PubMed]
- Mulvaney, S.P.; Musick, M.D.; Keating, C.D.; Natan, M.J. Glass-coated, analyte-tagged nanoparticles: A new tagging system based on detection with surface-enhanced Raman scattering. Langmuir 2003, 19, 4784–4790. [Google Scholar] [CrossRef]
- Schmidt, M.S.; Hübner, J.; Boisen, A. Large area fabrication of leaning silicon nanopillars for Surface Enhanced Raman Spectroscopy. Adv. Mater. 2012, 24, 11–18. [Google Scholar] [CrossRef] [PubMed]
- Wu, K.; Rindzevicius, T.; Stenbæk Schmidt, M.; Mogensen, K.B.; Hakonen, A.; Boisen, A. Wafer-scale leaning silver nanopillars for molecular detection at ultra-low concentrations. J. Phys. Chem. C 2015, 119, 2053–2062. [Google Scholar] [CrossRef]
- Porter, M.D.; Lipert, R.J.; Siperko, L.M. SERS as a bioassay platform: Fundamentals, design, and applications. Chem. Rev. 2008, 37, 1001–1011. [Google Scholar] [CrossRef]
- Szlag, V.M.; Rodriguez, R.S.; He, J.; Hudson-smith, N.; Kang, H.; Le, N.; Reineke, T.M.; Haynes, C.L. Molecular Affinity Agents for Intrinsic Surface-Enhanced Raman Scattering (SERS) Sensors. ACS Appl. Mater. Interfaces 2018, 10, 31825–31844. [Google Scholar] [CrossRef]
- Heaps, D.A.; Griffiths, P.R. Off-line direct deposition gas chromatography/surface-enhanced Raman scattering and the ramifications for on-line measurements. Appl. Spectrosc. 2005, 59, 1305–1309. [Google Scholar] [CrossRef] [PubMed]
- Trachta, G.; Schwarze, B.; Sägmüller, B.; Brehm, G.; Schneider, S. Combination of high-performance liquid chromatography and SERS detection applied to the analysis of drugs in human blood and urine. J. Mol. Struct. 2004, 693, 175–185. [Google Scholar] [CrossRef]
- Sägmüller, B.; Schwarze, B.; Brehm, G.; Trachta, G.; Schneider, S. Identification of illicit drugs by a combination of liquid chromatography and surface-enhanced Raman scattering spectroscopy. J. Mol. Struct. 2003, 661–662, 279–290. [Google Scholar] [CrossRef]
- Wang, W.; Xu, M.; Guo, Q.; Yuan, Y.; Gu, R.; Yao, J. Rapid separation and on-line detection by coupling high performance liquid chromatography with surface-enhanced Raman spectroscopy. RSC Adv. 2015, 5, 47640–47646. [Google Scholar] [CrossRef]
- Farquharson, S.; Maksymiuk, P. Simultaneous chemical separation and surface-enhanced Raman spectral detection using silver-doped sol-gels. Appl. Spectrosc. 2003, 57, 479–482. [Google Scholar] [CrossRef]
- Lucotti, A.; Tommasini, M.; Casella, M.; Morganti, A.; Gramatica, F.; Zerbi, G. TLC-surface enhanced Raman scattering of apomorphine in human plasma. Vib. Spectrosc. 2012, 62, 286–291. [Google Scholar] [CrossRef]
- Vicario, A.; Sergo, V.; Toffoli, G.; Bonifacio, A. Surface-enhanced Raman spectroscopy of the anti-cancer drug irinotecan in presence of human serum albumin. Colloids Surf. B Biointerfaces 2015, 127, 41–46. [Google Scholar] [CrossRef]
- Lv, D.; Cao, Y.; Lou, Z.; Li, S.; Chen, X.; Chai, Y.; Lu, F. Rapid on-site detection of ephedrine and its analogues used as adulterants in slimming dietary supplements by TLC-SERS. Anal. Bioanal. Chem. 2015, 407, 1313–1325. [Google Scholar] [CrossRef]
- Grubisha, D.S.; Lipert, R.J.; Park, H.; Driskell, J.; Porter, M.D. Femtomolar Detection of Prostate-Specific Antigen: An Immunoassay Based on Surface-Enhanced Raman Scattering and Immunogold Labels. Anal. Chem. 2003, 75, 5936–5943. [Google Scholar] [CrossRef]
- Driskell, J.D.; Kwarta, K.M.; Lipert, R.J.; Porter, M.D.; Neill, J.D.; Ridpath, J.F. Low-Level Detection of Viral Pathogens by a Surface-Enhanced Raman Scattering Based Immunoassay. Anal. Chem. 2005, 77, 6147–6154. [Google Scholar] [CrossRef]
- Xu, S.; Ji, X.; Xu, W.; Li, X.; Wang, L.; Bai, Y.; Zhao, B.; Ozaki, Y. Immunoassay using probe-labelling immunogold nanoparticles with silver staining enhancement via surface-enhanced Raman scattering. Analyst 2004, 129, 63–68. [Google Scholar] [CrossRef] [PubMed]
- Kamińska, A.; Winkle, K.; Kowalska, A.; Witkowska, E. SERS-based Immunoassay in a Microfluidic System for the Multiplexed Recognition of Interleukins from Blood Plasma: Towards Picogram Detection. Sci. Rep. 2017, 7, 10656. [Google Scholar] [CrossRef] [PubMed]
- Gezer, P.G.; Liu, G.L.; Kokini, J.L. Talanta Development of a biodegradable sensor platform from gold coated zein nanophotonic fi lms to detect peanut allergen, Ara h1, using surface enhanced raman spectroscopy. Talanta 2016, 150, 224–232. [Google Scholar] [CrossRef] [PubMed]
- Li, M.; Zhang, J.; Suri, S.; Sooter, L.J.; Ma, D.; Wu, N. Detection of adenosine triphosphate with an aptamer biosensor based on surface-enhanced Raman scattering. Anal. Chem. 2012, 84, 2837–2842. [Google Scholar] [CrossRef] [PubMed]
- Kim, N.H.; Lee, S.J.; Moskovits, M. Aptamer-mediated surface-enhanced raman spectroscopy intensity amplification. Nano Lett. 2010, 10, 4181–4185. [Google Scholar] [CrossRef] [PubMed]
- Shafer-Peltier, K.E.; Haynes, C.L.; Glucksberg, M.R.; Van Duyne, R.P. Toward a Glucose Biosensor Based on Surface-Enhanced Raman Scattering. J. Am. Chem. Soc. 2003, 125, 588–593. [Google Scholar] [CrossRef] [PubMed]
- Olson, L.G.; Uibel, R.H.; Harris, J.M. C18-modified metal-colloid substrates for surface-enhanced Raman detection of trace-level polycyclic aromatic hydrocarbons in aqueous solution. Appl. Spectrosc. 2004, 58, 1394–1400. [Google Scholar] [CrossRef]
- Huang, Z.; Meng, G.; Huang, Q.; Chen, B.; Zhu, C.; Zhang, Z. Large-area Ag nanorod array substrates for SERS: AAO template-assisted fabrication, functionalization, and application in detection PCBs. J. Raman Spectrosc. 2013, 44, 240–246. [Google Scholar] [CrossRef]
- Wackerlig, J.; Lieberzeit, P.A. Molecularly imprinted polymer nanoparticles in chemical sensing—Synthesis, characterisation and application. Sens. Actuators B Chem. 2015, 207, 144–157. [Google Scholar] [CrossRef]
- Belbruno, J.J. Molecularly Imprinted Polymers. Chem. Rev. 2019, 119, 94–119. [Google Scholar] [CrossRef]
- Holthoff, E.L.; Stratis-Cullum, D.N.; Hankus, M.E. A nanosensor for TNT detection based on molecularly imprinted polymers and surface enhanced Raman scattering. Sensors 2011, 11, 2700–2714. [Google Scholar] [CrossRef]
- Xue, J.Q.; Li, D.W.; Qu, L.L.; Long, Y.T. Surface-imprinted core-shell Au nanoparticles for selective detection of bisphenol A based on surface-enhanced Raman scattering. Anal. Chim. Acta 2013, 777, 57–62. [Google Scholar] [CrossRef]
- Hu, Y.; Lu, X. Rapid Detection of Melamine in Tap Water and Milk Using Conjugated “One-Step” Molecularly Imprinted Polymers-Surface Enhanced Raman Spectroscopic Sensor. J. Food Sci. 2016, 81, N1272–N1280. [Google Scholar] [CrossRef]
- Driskell, J.D.; Seto, A.G.; Jones, L.P.; Jokela, S.; Dluhy, R.A.; Zhao, Y.P.; Tripp, R.A. Rapid microRNA (miRNA) detection and classification via surface-enhanced Raman spectroscopy (SERS). Biosens. Bioelectron. 2008, 24, 917–922. [Google Scholar] [CrossRef]
- Prado, E.; Colin, A.; Servant, L.; Lecomte, S. SERS spectra of oligonucleotides as fingerprints to detect label-free RNA in microfluidic devices. J. Phys. Chem. C 2014, 118, 13965–13971. [Google Scholar] [CrossRef]
- Morla-Folch, J.; Xie, H.; Alvarez-Puebla, R.A.; Guerrini, L. Fast Optical Chemical and Structural Classi fi cation of RNA. ACS Nano 2016, 10, 2834–2842. [Google Scholar] [CrossRef]
- Kneipp, K.; Haka, A.S.; Kneipp, H.; Badizadegan, K.; Yoshizawa, N.; Boone, C.; Shafer-Peltier, K.E.; Motz, J.T.; Dasari, R.R.; Feld, M.S. Surface-Enhanced Raman Spectroscopy in Single Living Cells Using Gold Nanoparticles. Appl. Spectrosc. 2002, 56, 150–154. [Google Scholar] [CrossRef]
- Kneipp, J.; Kneipp, H.; McLaughlin, M.; Brown, D.; Kneipp, K. In vivo molecular probing of cellular compartments with gold nanoparticles and nanoaggregates. Nano Lett. 2006, 6, 2225–2231. [Google Scholar] [CrossRef]
- Feng, S.; Chen, R.; Lin, J.; Pan, J.; Wu, Y.; Li, Y.; Chen, J.; Zeng, H. Gastric cancer detection based on blood plasma surface-enhanced Raman spectroscopy excited by polarized laser light. Biosens. Bioelectron. 2011, 26, 3167–3174. [Google Scholar] [CrossRef]
- Zhu, J.; Zhou, J.; Guo, J.; Cai, W.; Liu, B.; Wang, Z.; Sun, Z. Surface-enhanced Raman spectroscopy investigation on human breast cancer cells. Chem. Cent. J. 2013, 7, 1–5. [Google Scholar] [CrossRef]
- González-Solís, J.L.; Luévano-Colmenero, G.H.; Vargas-Mancilla, J. Surface enhanced Raman spectroscopy in breast cancer cells. Laser Ther. 2013, 22, 37–42. [Google Scholar] [CrossRef]
- Wang, J.; Koo, K.M.; Wee, E.J.H.; Wang, Y.; Trau, M. A nanoplasmonic label-free surface-enhanced Raman scattering strategy for non-invasive cancer genetic subtyping in patient samples. Nanoscale 2017, 9, 3496–3503. [Google Scholar] [CrossRef]
- Lussier, F.; Brulé, T.; Vishwakarma, M.; Das, T.; Spatz, J.P.; Masson, J.F. Dynamic-SERS optophysiology: A nanosensor for monitoring cell secretion events. Nano Lett. 2016, 16, 3866–3871. [Google Scholar] [CrossRef]
- Lecomte, S.; Wackerbarth, H.; Soulimane, T.; Buse, G.; Hildebrandt, P. Time-resolved surface-enhanced resonance Raman spectroscopy for studying electron-transfer dynamics of heme proteins. J. Am. Chem. Soc. 1998, 120, 7381–7382. [Google Scholar] [CrossRef]
- Xu, H.; Bjerneld, E.J.; Käll, M.; Börjesson, L. Spectroscopy of single hemoglobin molecules by surface enhanced raman scattering. Phys. Rev. Lett. 1999, 83, 4357–4360. [Google Scholar] [CrossRef]
- Han, X.X.; Jia, H.Y.; Wang, Y.F.; Lu, Z.C.; Wang, C.X.; Xu, W.Q.; Zhao, B.; Ozaki, Y. Analytical technique for label-free multi-protein detection based on Western blot and surface-enhanced Raman scattering. Anal. Chem. 2008, 80, 2799–2804. [Google Scholar] [CrossRef]
- Feng, M.; Tachikawa, H. Surface-enhanced resonance Raman spectroscopic characterization of the protein native structure. J. Am. Chem. Soc. 2008, 130, 7443–7448. [Google Scholar] [CrossRef]
- Wu, C.Y.; Lo, W.Y.; Chiu, C.R.; Yang, T.S. Surface enhanced Raman spectra of oligonucleotides induced by spermine. J. Raman Spectrosc. 2006, 37, 799–807. [Google Scholar] [CrossRef]
- Xu, L.J.; Zong, C.; Zheng, X.S.; Hu, P.; Feng, J.M.; Ren, B. Label-free detection of native proteins by surface-enhanced Raman spectroscopy using iodide-modified nanoparticles. Anal. Chem. 2014, 86, 2238–2245. [Google Scholar] [CrossRef]
- Efrima, S.; Bronk, B.V. Silver Colloids Impregnating or Coating Bacteria. J. Phys. Chem. B 1998, 102, 5947–5950. [Google Scholar] [CrossRef]
- Shanmukh, S.; Jones, L.; Driskell, J.; Zhao, Y.; Dluhy, R.; Tripp, R.A. Rapid and sensitive detection of respiratory virus molecular signatures using a silver nanorod array SERS substrate. Nano Lett. 2006, 6, 2630–2636. [Google Scholar] [CrossRef]
- Wang, Y.; Lee, K.; Irudayaraj, J. Silver Nanosphere SERS Probes for Sensitive Identification of Pathogens. J. Phys. Chem. C 2010, 114, 16122–16128. [Google Scholar] [CrossRef]
- Witkowska, E.; Korsak, D.; Kowalska, A.; Janeczek, A.; Kamińska, A. Strain-level typing and identification of bacteria—A novel approach for SERS active plasmonic nanostructures. Anal. Bioanal. Chem. 2018, 410, 5019–5031. [Google Scholar] [CrossRef]
- Wabuyele, M.B.; Vo-Dinh, T. Detection of human immunodeficiency virus type 1 DNA sequence using plasmonics nanoprobes. Anal. Chem. 2005, 77, 7810–7815. [Google Scholar] [CrossRef]
- Ngo, H.T.; Wang, H.N.; Fales, A.M.; Vo-Dinh, T. Label-free DNA biosensor based on SERS molecular sentinel on nanowave chip. Anal. Chem. 2013, 85, 6378–6383. [Google Scholar] [CrossRef]
- Wang, Z.; Zong, S.; Wang, Z.; Wu, L.; Chen, P.; Yun, B.; Cui, Y. Microfluidic chip based micro RNA detection through the combination of fluorescence and surface enhanced Raman scattering techniques. Nanotechnology 2017, 28, 1–8. [Google Scholar] [CrossRef]
- Guven, B.; Dudak, F.C.; Boyaci, I.H.; Tamer, U.; Ozsoz, M. SERS-based direct and sandwich assay methods for mir-21 detection. Analyst 2014, 139, 1141–1147. [Google Scholar] [CrossRef]
- Wei, X.; Su, S.; Guo, Y.; Jiang, X.; Zhong, Y.; Su, Y.; Fan, C.; Lee, S.T.; He, Y. A molecular beacon-based signal-off surface-enhanced Raman scattering strategy for highly sensitive, reproducible, and multiplexed DNA detection. Small 2013, 9, 2493–2499. [Google Scholar] [CrossRef]
- Ilkhani, H.; Hughes, T.; Li, J.; Zhong, C.J.; Hepel, M. Nanostructured SERS-electrochemical biosensors for testing of anticancer drug interactions with DNA. Biosens. Bioelectron. 2016, 80, 257–264. [Google Scholar] [CrossRef]
- Kang, T.; Yoo, S.M.; Yoon, I.; Lee, S.Y.; Kim, B. Patterned multiplex pathogen DNA detection by Au Particle-on-wire SERS sensor. Nano Lett. 2010, 10, 1189–1193. [Google Scholar] [CrossRef]
- Li, L.; Liu, C.; Cao, X.; Tan, L.; Lu, W. Multiplexing determination of cancer-associated biomarkers by surface-enhanced Raman scattering using ordered gold nanohoneycomb arrays. Bioanalysis 2017, 9, 1561–1572. [Google Scholar] [CrossRef]
- Sivanesan, A.; Witkowska, E.; Adamkiewicz, W.; Dziewit, Ł.; Kamińska, A.; Waluk, J. Nanostructured silver-gold bimetallic SERS substrates for selective identification of bacteria in human blood. Analyst 2014, 139, 1037–1043. [Google Scholar] [CrossRef]
- Wang, F.; Widejko, R.G.; Yang, Z.; Nguyen, K.T.; Chen, H.; Fernando, L.P.; Christensen, K.A.; Anker, J.N. Surface-Enhanced Raman Scattering Detection of pH with Silica-Encapsulated 4-Mercaptobenzoic Acid-Functionalized Silver Nanoparticles. Anal. Chem. 2012, 84, 8013–8019. [Google Scholar] [CrossRef]
- Kong, K.V.; Dinish, U.S.; Lau, W.K.O.; Olivo, M. Sensitive SERS-pH sensing in biological media using metal carbonyl functionalized planar substrates. Biosens. Bioelectron. 2014, 54, 135–140. [Google Scholar] [CrossRef]
- El-Said, W.A.; Kim, T.H.; Chung, Y.H.; Choi, J.W. Fabrication of new single cell chip to monitor intracellular and extracellular redox state based on spectroelectrochemical method. Biomaterials 2015, 40, 80–87. [Google Scholar] [CrossRef]
- Wang, G.; Lipert, R.J.; Jain, M.; Kaur, S.; Chakraboty, S.; Torres, M.P.; Batra, S.K.; Brand, R.E.; Porter, M.D. Detection of the Potential Pancreatic Cancer Marker MUC4 in Serum Using Surface-Enhanced Raman Scattering. Anal. Chem. 2011, 83, 2554–2561. [Google Scholar] [CrossRef]
- Krasnoslobodtsev, A.V.; Torres, M.P.; Kaur, S.; Vlassiouk, I.V.; Lipert, R.J.; Jain, M.; Batra, S.K.; Lyubchenko, Y.L. Nano-immunoassay with improved performance for detection of cancer biomarkers. Nanomed. Nanotechnol. Biol. Med. 2015, 11, 167–173. [Google Scholar] [CrossRef]
- Song, C.; Chen, J.; Zhao, Y.; Wang, L. Gold-modified silver nanorod arrays for SERS-based immunoassays with improved sensitivity. J. Mater. Chem. B 2014, 2, 7488–7494. [Google Scholar] [CrossRef]
- Ko, J.; Lee, S.; Lee, E.K.; Chang, S.I.; Chen, L.; Yoon, S.Y.; Choo, J. SERS-based immunoassay of tumor marker VEGF using DNA aptamers and silica-encapsulated hollow gold nanospheres. Phys. Chem. Chem. Phys. 2013, 15, 5379–5385. [Google Scholar] [CrossRef]
- Kavosi, B.; Salimi, A.; Hallaj, R.; Amani, K. A highly sensitive prostate-specific antigen immunosensor based on gold nanoparticles/PAMAM dendrimer loaded on MWCNTS/chitosan/ionic liquid nanocomposite. Biosens. Bioelectron. 2014, 52, 20–28. [Google Scholar] [CrossRef]
- Yang, K.; Hu, Y.; Dong, N.; Zhu, G.; Zhu, T.; Jiang, N. A novel SERS-based magnetic aptasensor for prostate specific antigen assay with high sensitivity. Biosens. Bioelectron. 2017, 94, 286–291. [Google Scholar] [CrossRef]
- Yoon, K.J.; Seo, H.K.; Hwang, H.; Pyo, D.; Eom, I.Y.; Hahn, J.H.; Jung, Y.M. Bioanalytical application of SERS immunoassay for detection of prostate-specific antigen. Bull. Korean Chem. Soc. 2010, 31, 1215–1218. [Google Scholar] [CrossRef]
- Owens, P.; Phillipson, N.; Perumal, J.; O’Connor, G.M.; Olivo, M. Sensing of p53 and EGFR biomarkers using high efficiency SERS substrates. Biosensors 2015, 5, 664–677. [Google Scholar] [CrossRef]
- Xu, L.; Yan, W.; Ma, W.; Kuang, H.; Wu, X.; Liu, L.; Zhao, Y.; Wang, L.; Xu, C. SERS encoded silver pyramids for attomolar detection of multiplexed disease biomarkers. Adv. Mater. 2015, 27, 1706–1711. [Google Scholar] [CrossRef]
- Zhang, Y.; Tang, Y.; Hsieh, Y.H.; Hsu, C.Y.; Xi, J.; Lin, K.J.; Jiang, X. Towards a high-throughput label-free detection system combining localized-surface plasmon resonance and microfluidics. Lab Chip 2012, 12, 3012–3015. [Google Scholar] [CrossRef]
- Jarvis, R.M.; Goodacre, R. Characterisation and identification of bacteria using SERS. Chem. Soc. Rev. 2018, 37, 873–1076. [Google Scholar] [CrossRef]
- Jamieson, L.E.; Asiala, S.M.; Gracie, K.; Faulds, K.; Graham, D. Bioanalytical Measurements Enabled by Surface-Enhanced Raman Scattering (SERS) Probes. Annu. Rev. Anal. Chem. 2017, 10, 415–437. [Google Scholar] [CrossRef]
- Giner-Casares, J.J.; Henriksen-Lacey, M.; Coronado-Puchau, M.; Liz-Marzán, L.M. Inorganic nanoparticles for biomedicine: Where materials scientists meet medical research. Mater. Today 2016, 19, 19–28. [Google Scholar] [CrossRef]
- Cao, Y.; Zhang, J.; Yang, Y.; Huang, Z.; Viet Long, N.; Fu, C. Engineering of SERS Substrates Based on Noble Metal Nanomaterials for Chemical and Biomedical Applications. Appl. Spectrosc. Rev. 2015, 50, 499–525. [Google Scholar] [CrossRef]
- Nima, Z.A.; Biswas, A.; Bayer, I.S.; Hardcastle, F.D.; Perry, D.; Ghosh, A.; Dervishi, E.; Biris, A.S. Applications of surface-enhanced Raman scattering in advanced bio-medical technologies and diagnostics. Drug Metab. Rev. 2014, 46, 155–175. [Google Scholar] [CrossRef]
- Fong, K.E.; Lanry, Y.L.-Y. Localized surface plasmon resonance: A unique property of plasmonic nanoparticles for nucleic acid detection. Nanoscale 2013, 5, 12043–12071. [Google Scholar] [CrossRef]
- Han, X.X.; Zhao, B.; Ozaki, Y. Label-free detection in biological applications of surface-enhanced Raman scattering. Trends Anal. Chem. 2012, 38, 67–78. [Google Scholar] [CrossRef]
- Wang, Y.; Irudayaraj, J. Surface-enhanced Raman spectroscopy at single-molecule scale and its implications in biology. Philos. Trans. R. Soc. B 2012, 368, 20120026. [Google Scholar] [CrossRef]
- Abalde-Cela, S.; Aldeanueva-Potel, P.; Mateo-Mateo, C.; Rodrίguez-Lorenzo, L.; Liz-Marzan, L.M.; Rodríguez-Lorenzo, L.; Alvarez-Puebla, R.A.; Liz-Marzán, L.M. Surface-enhanced Raman scattering biomedical applications of plasmonic colloidal particles. J. R. Soc. Interface 2010, 7, S435–S450. [Google Scholar] [CrossRef]
- Smith, W.E. Practical understanding and use of surface enhanced Raman scattering/surface enhanced resonance Raman scattering in chemical and biological analysis. Chem. Soc. Rev. 2008, 37, 955–964. [Google Scholar] [CrossRef]
- Vo-Dinh, T.; Stokes, D.L. Surface-Enhanced Raman Scattering (SERS) for Biomedical Diagnostics. In Biomedical Photonics Handbook; Vo-Dinh, T., Ed.; CRC Press: Boca Raton, FL, USA, 2003; p. 64. [Google Scholar]
- Kneipp, K.; Kneipp, H.; Itzkan, I.; Dasari, R.R.; Feld, M.S. Surface-enhanced Raman scattering and biophysics. J. Phys. Condens. Matter 2002, 14, R597–R624. [Google Scholar] [CrossRef]
- Dou, X.-M.; Ozaki, Y. Surface-enhanced Raman scattering of biological molecules on metal colloids: Basic studies and applications to quantitative assay. Rev. Anal. Chem. 1999, 18, 285–321. [Google Scholar] [CrossRef]
- Etchegoin, P.; Maher, R.C.; Cohen, L.F.; Hartigan, H.; Brown, R.J.C.; Milton, M.J.T.; Gallop, J.C. New limits in ultrasensitive trace detection by surface enhanced Raman scattering (SERS). Chem. Phys. Lett. 2003, 375, 84–90. [Google Scholar] [CrossRef]
- Kneipp, K.; Kneipp, H.; Kartha, V.B.; Manoharan, R.; Deinum, G.; Itzkan, I.; Dasari, R.R.; Feld, M.S. Detection and identification of a single DNA base molecule using surface-enhanced Raman scattering (SERS). Phys. Rev. E 1998, 57, 6281–6284. [Google Scholar] [CrossRef]
- Kneipp, J.; Kneipp, H.; Kneipp, K. SERS—A single-molecule and nanoscale tool for bioanalytics. Chem. Soc. Rev. 2008, 37, 1052–1060. [Google Scholar] [CrossRef]
- Aroca, R.F.; Alvarez-Puebla, R.A.; Pieczonka, N.; Sanchez-Cortez, S.; Garcia-Ramos, J.V. Surface-enhanced Raman scattering on colloidal nanostructures. Adv. Colloid Interface Sci. 2005, 116, 45–61. [Google Scholar] [CrossRef]
- Koglin, E.; Séquaris, J.M.; Valenta, P. Hydrogen-Deuterium exchange in Adenosine 5′-monophosphate Detected by Surface Enhanced raman Scattering (SERS). Z. Naturforsch. Sect. C J. Biosci. 1981, 36, 809–812. [Google Scholar] [CrossRef]
- Kneipp, K.; Wang, Y.; Dasari, R.R.; Feld, M.S. Near-infrared surface-enhanced Raman scattering (NIR-SERS) of neurotransmitters in colloidal silver solutions. Spectrochim. Acta 1995, 51A, 481–487. [Google Scholar] [CrossRef]
- Chumanov, G.; Cotton, T.M. Surface Enhanced Raman Scattering for Discovering and Scoring Single Base Differences in DNA. Proc. SPIE 1999, 3608, 204–210. [Google Scholar] [CrossRef]
- Zhang, Y.; Wang, G.; Yang, L.; Wang, F.; Liu, A. Recent advances in gold nanostructures based biosensing and bioimaging. Coord. Chem. Rev. 2018, 370, 1–21. [Google Scholar] [CrossRef]
- Murphy, C.J.; Gole, A.M.; Stone, J.W.; Sisco, P.N.; Alkilany, A.M.; Goldsmith, E.C.; Baxter, S.C. Gold Nanoparticles in Biology: Beyond Toxicity to Cellular Imaging. Acc. Chem. Res. 2008, 41, 1721–1730. [Google Scholar] [CrossRef]
- Han, X.X.; Zhao, B.; Ozaki, Y. Surface-enhanced Raman scattering for protein detection. Anal. Bioanal. Chem. 2009, 394, 1719–1727. [Google Scholar] [CrossRef]
- Lee, T.M.H. Over-the-counter biosensors: Past, present, and future. Sensors 2008, 8, 5535–5559. [Google Scholar] [CrossRef]
- Zhang, B.; Wang, H.; Lu, L.; Ai, K.; Zhang, G.; Cheng, X. Large-area silver-coated silicon nanowire arrays for molecular sensing using surface-enhanced raman spectroscopy. Adv. Funct. Mater. 2008, 18, 2348–2355. [Google Scholar] [CrossRef]
- Menon, S.G.; Goswami, P.C. A redox cycle within the cell cycle: Ring in the old with the new. Oncogene 2007, 26, 1101–1109. [Google Scholar] [CrossRef]
- Schafer, F.Q.; Buettner, G.R. Redox environment of the cell as viewed through the redox state of the glutathione disulfide/glutathione couple. Free Radic. Biol. Med. 2001, 30, 1191–1212. [Google Scholar] [CrossRef]
- Sarsour, E.H.; Kumar, M.G.; Chaudhuri, L.; Kalen, A.L.; Goswami, P.C. Redox Control of the Cell Cycle in Health and Disease. Antioxid. Redox Signal. 2009, 11, 2985–3011. [Google Scholar] [CrossRef]
- El-Said, W.A.; Kim, T.H.; Kim, H.; Choi, J.W. Detection of effect of chemotherapeutic agents to cancer cells on gold nanoflower patterned substrate using surface-enhanced Raman scattering and cyclic voltammetry. Biosens. Bioelectron. 2010, 26, 1486–1492. [Google Scholar] [CrossRef]
- Song, C.; Min, L.; Zhou, N.; Yang, Y.; Yang, B.; Zhang, L.; Su, S.; Wang, L. Ultrasensitive detection of carcino-embryonic antigen by using novel flower-like gold nanoparticle SERS tags and SERS-active magnetic nanoparticles. RSC Adv. 2014, 40, 41666–41669. [Google Scholar] [CrossRef]
- Diamandis, E.P.; Helle, S.I.; Yu, H.; Melegos, D.N.; Lundgren, S.; Lonning, P.E. Prognostic value of plasma prostate specific antigen after megestrol acetate treatment in patients with metastatic breast carcinoma. Cancer 1999, 85, 891–898. [Google Scholar] [CrossRef]
- Zhu, W.; Crozier, K.B. Quantum mechanical limit to plasmonic enhancement as observed by surface-enhanced Raman scattering. Nat. Commun. 2014, 5, 5228. [Google Scholar] [CrossRef]
- Schmidt, M.K.; Esteban, R.; González-Tudela, A.; Giedke, G.; Aizpurua, J. Quantum Mechanical Description of Raman Scattering from Molecules in Plasmonic Cavities. ACS Nano 2016, 10, 6291–6298. [Google Scholar] [CrossRef]
- Crocombe, R.A. Handheld spectrometers: The state of the art. SPIE 2013, 8726, 87260R. [Google Scholar] [CrossRef]
- Bedics, M.A.; Kearns, H.; Cox, J.M.; Mabbott, S.; Ali, F.; Shand, N.C.; Faulds, K.; Benedict, J.B.; Graham, D.; Detty, M.R. Extreme red shifted SERS nanotags. Chem. Sci. 2015, 6, 2302–2306. [Google Scholar] [CrossRef]
- Graham, D.; Kearns, H.; Ali, F.; Bedics, M.A.; Shand, N.C.; Faulds, K.; Detty, M.R.; Graham, D. Sensitive SERS nanotags for use with a hand-held 1064 nm Raman spectrometer. R. Soc. Open Sci. 2017, 4, 170422. [Google Scholar] [CrossRef]
- Zheng, J.; Pang, S.; Labuza, T.P.; He, L. Evaluation of surface-enhanced Raman scattering detection using a handheld and a bench-top Raman spectrometer: A comparative study. Talanta 2014, 129, 79–85. [Google Scholar] [CrossRef]
- Ellis, D.I.; Muhamadali, H.; Haughey, S.A.; Elliott, C.T.; Goodacre, R. Point-and-shoot: Rapid quantitative detection methods for on-site food fraud analysis—Moving out of the laboratory and into the food supply chain. Anal. Methods 2015, 7, 9401–9414. [Google Scholar] [CrossRef]


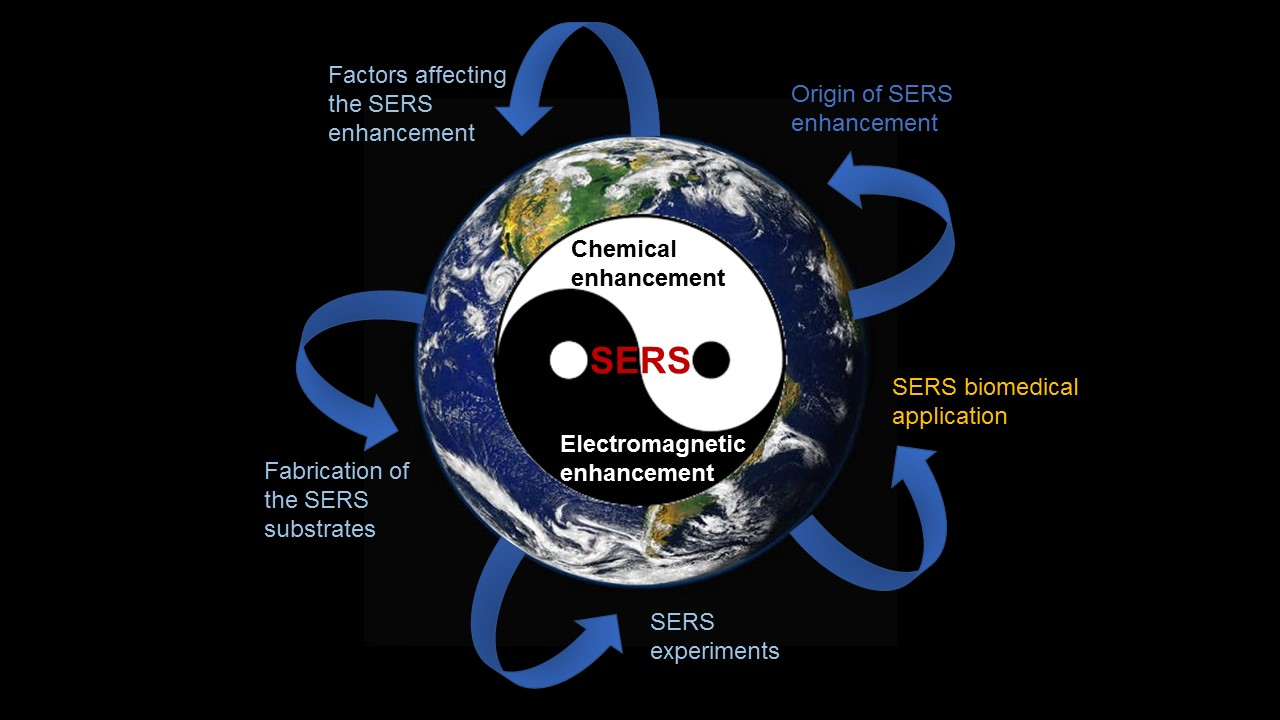
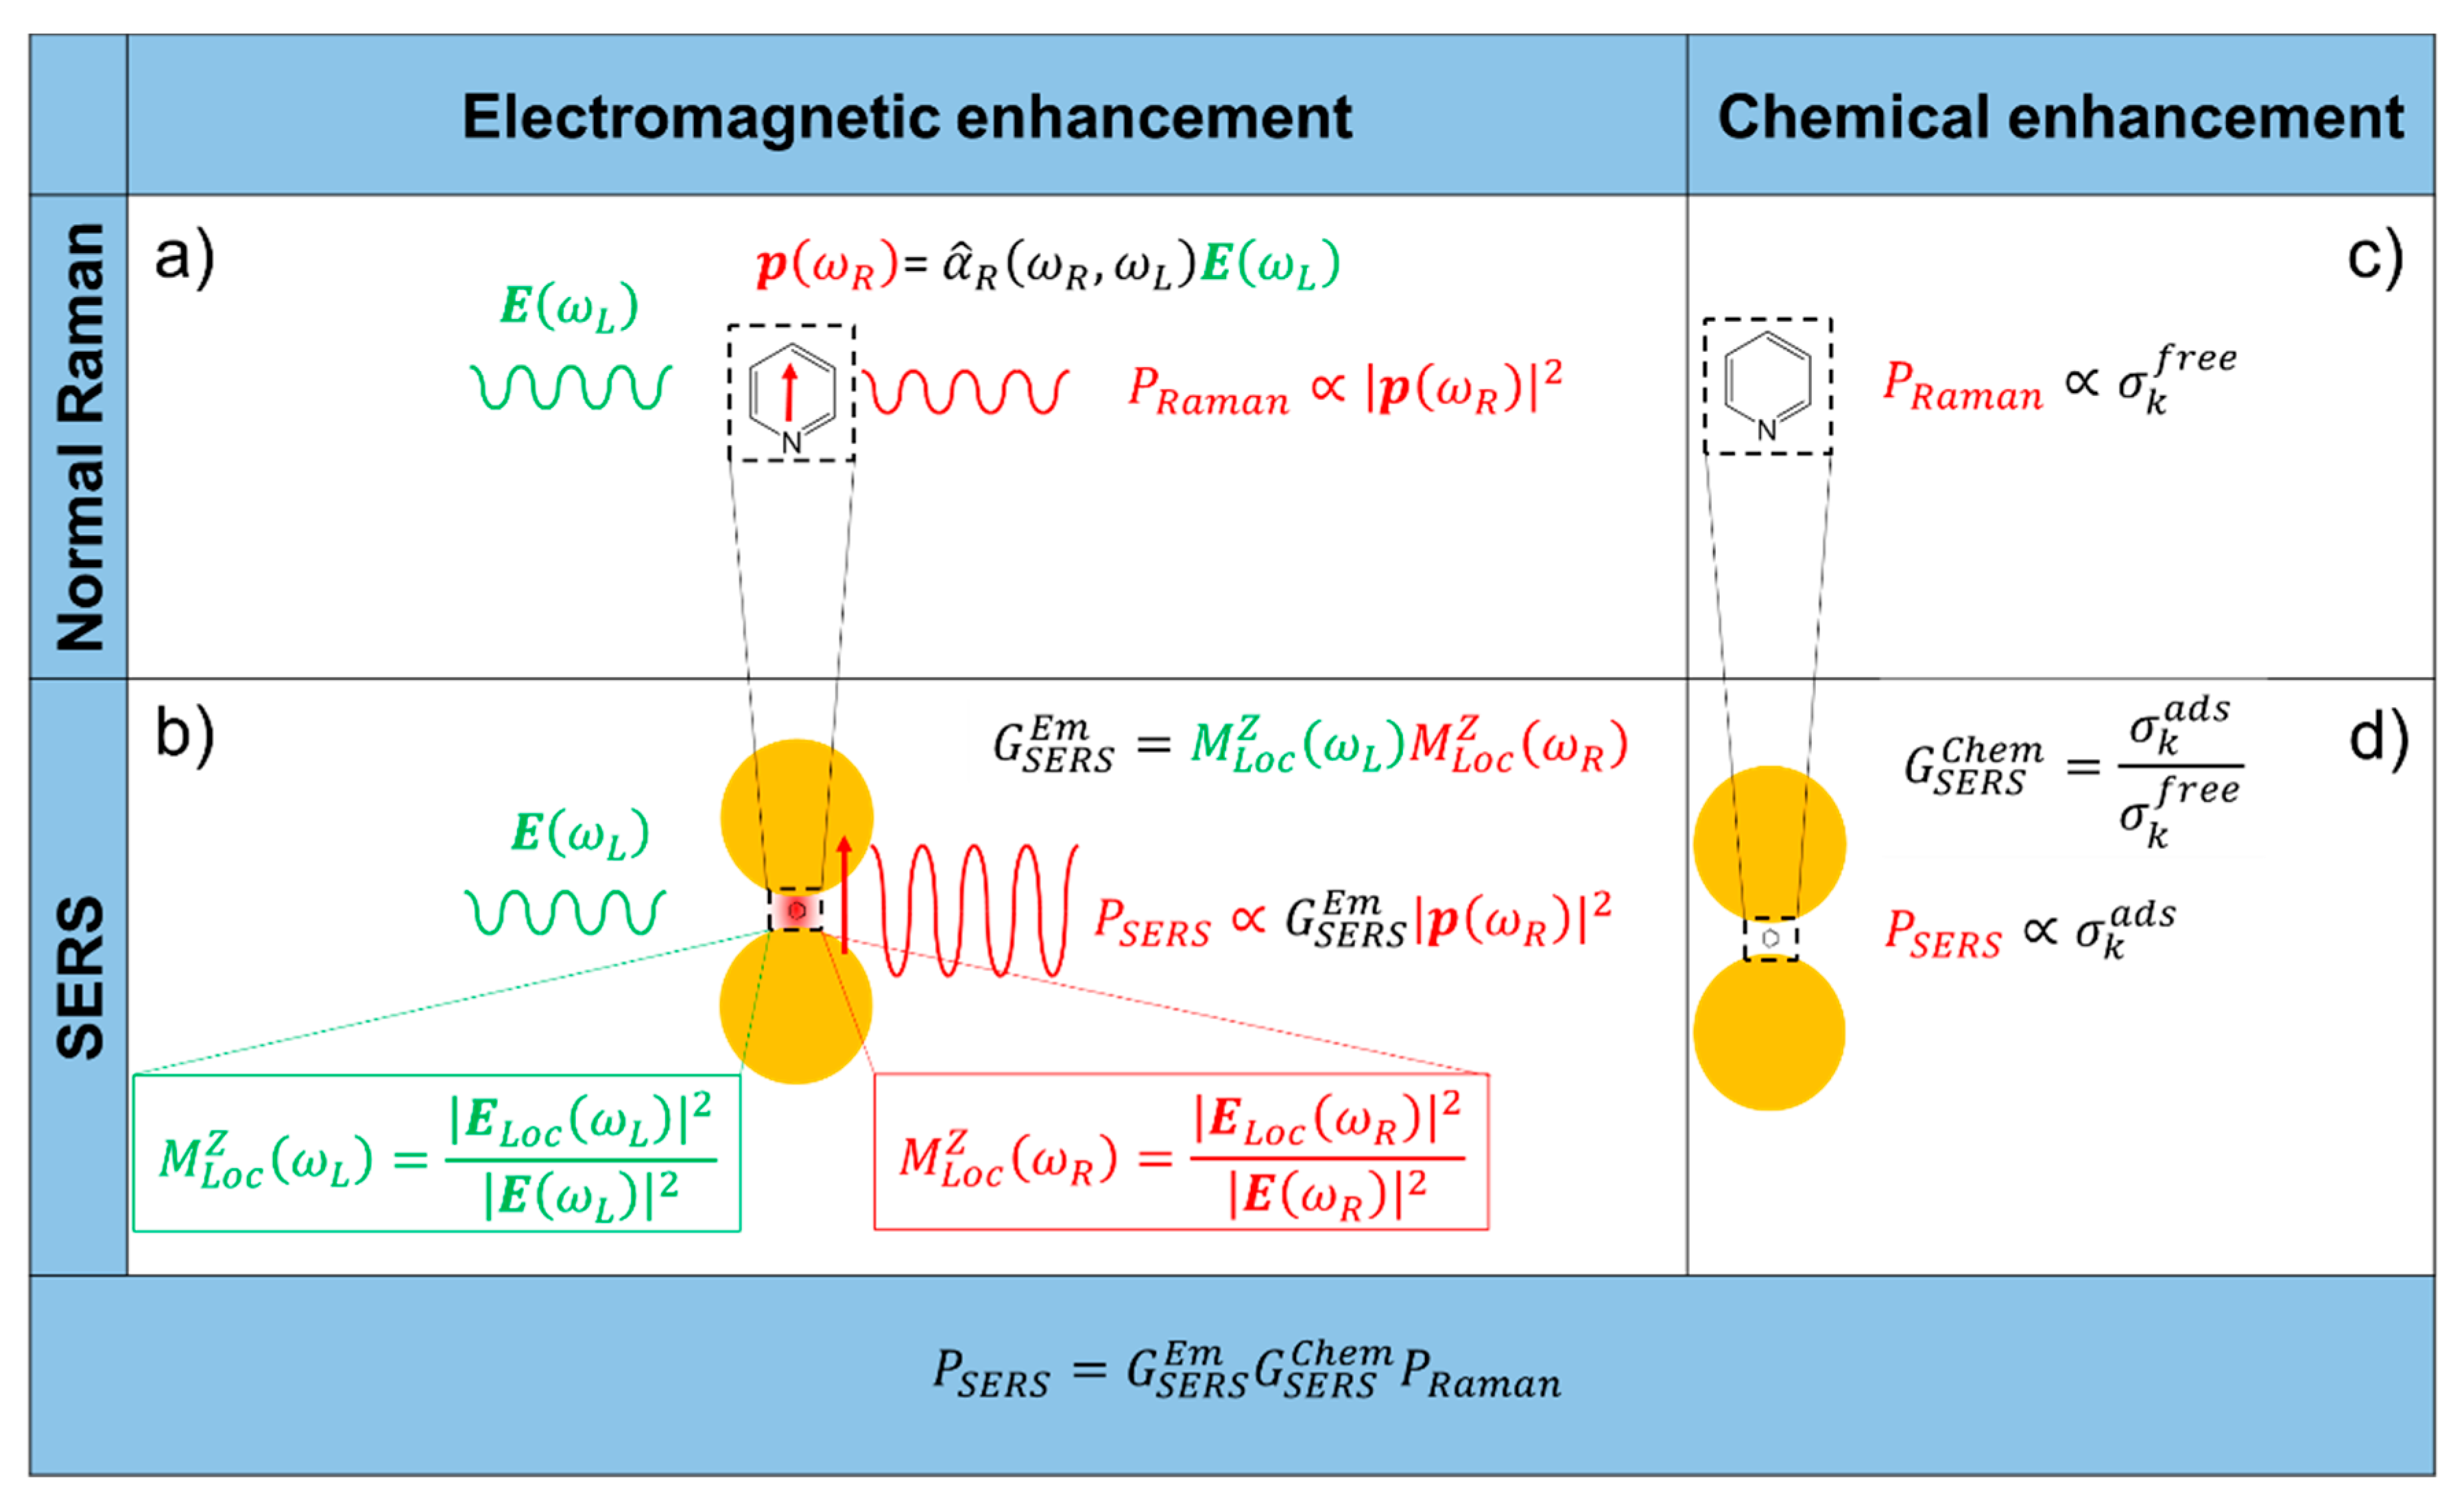
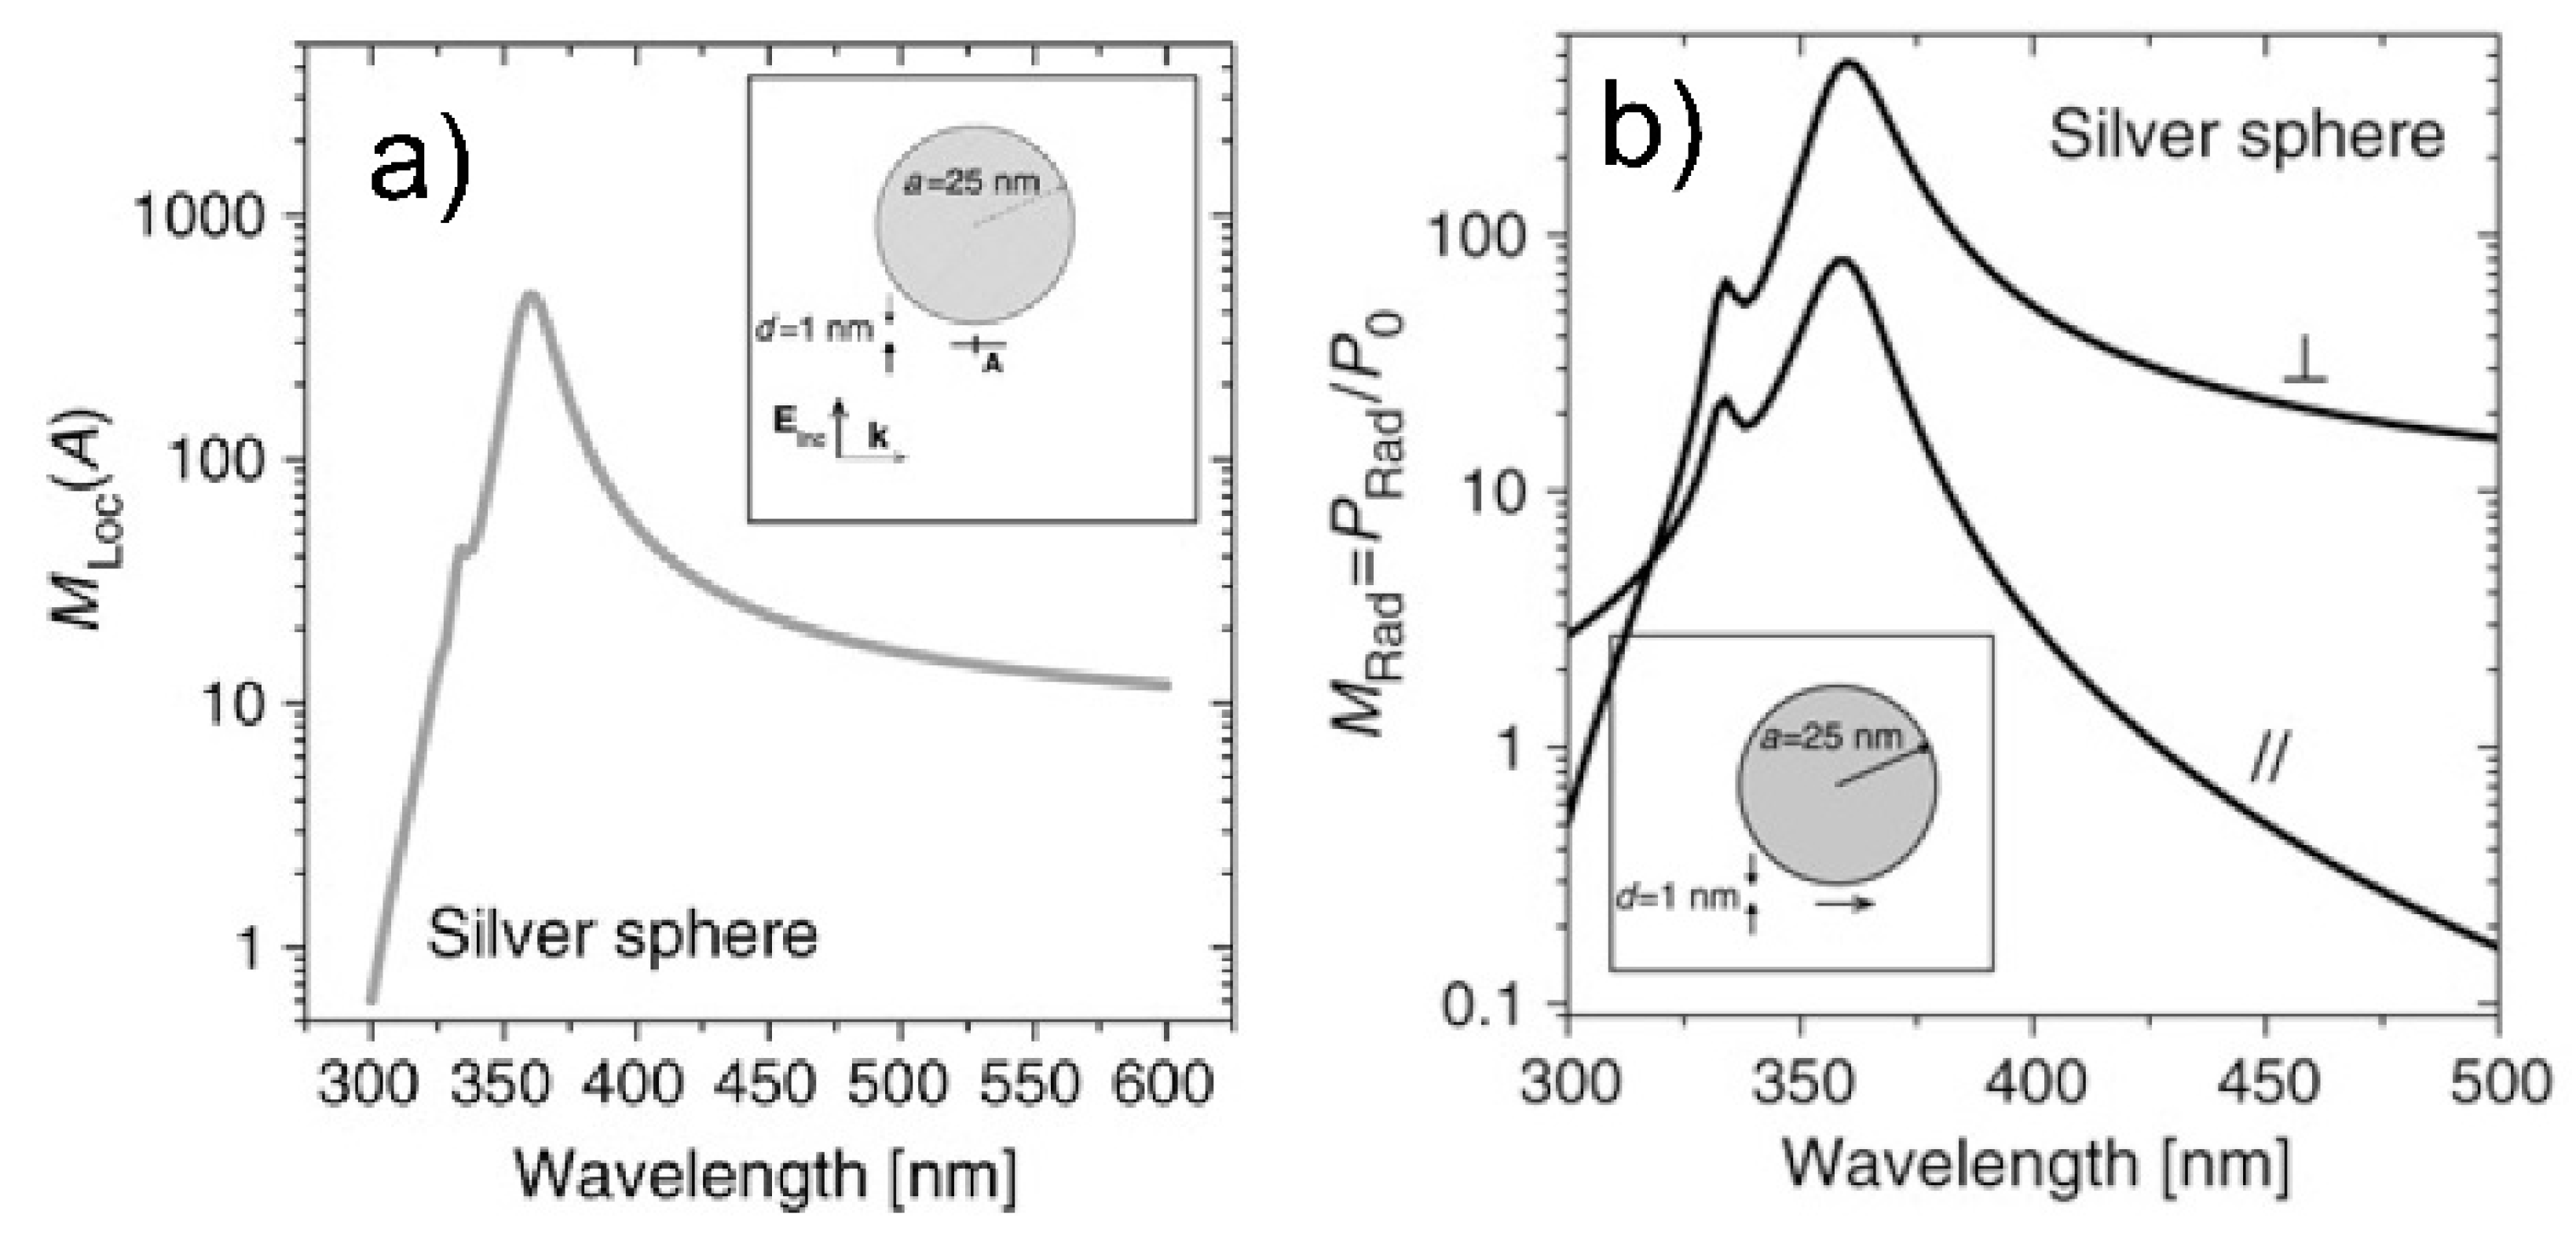
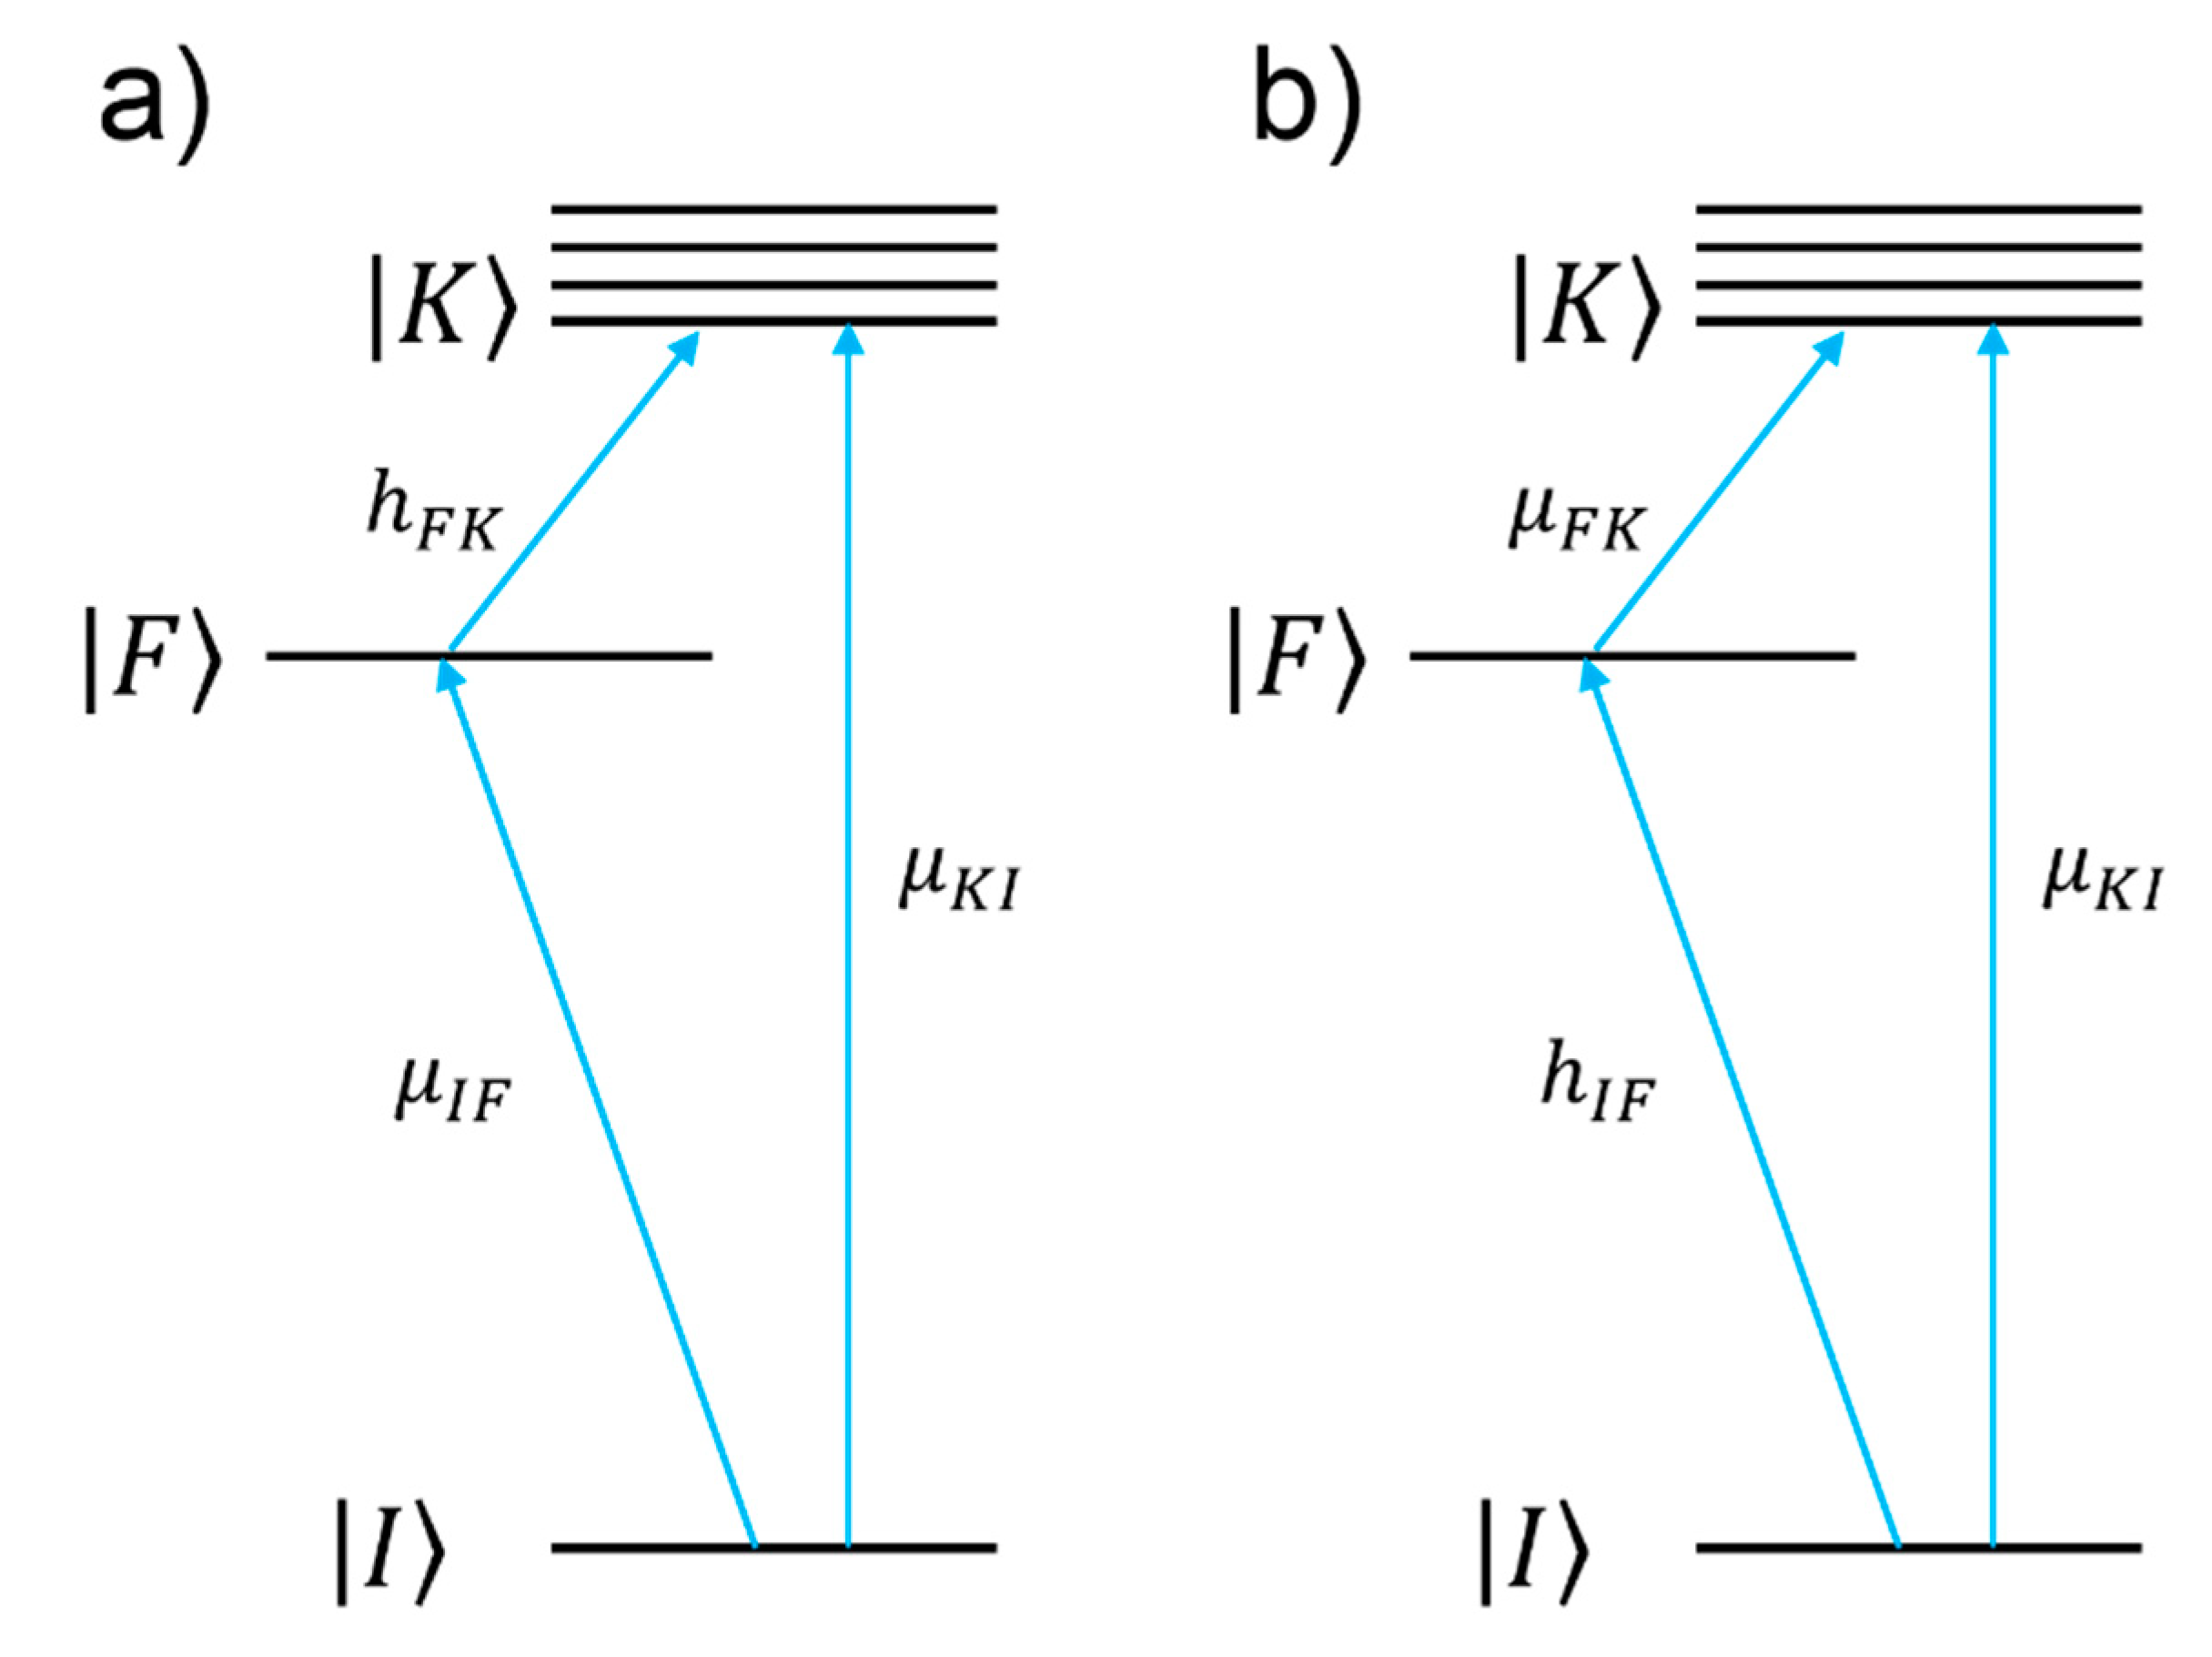
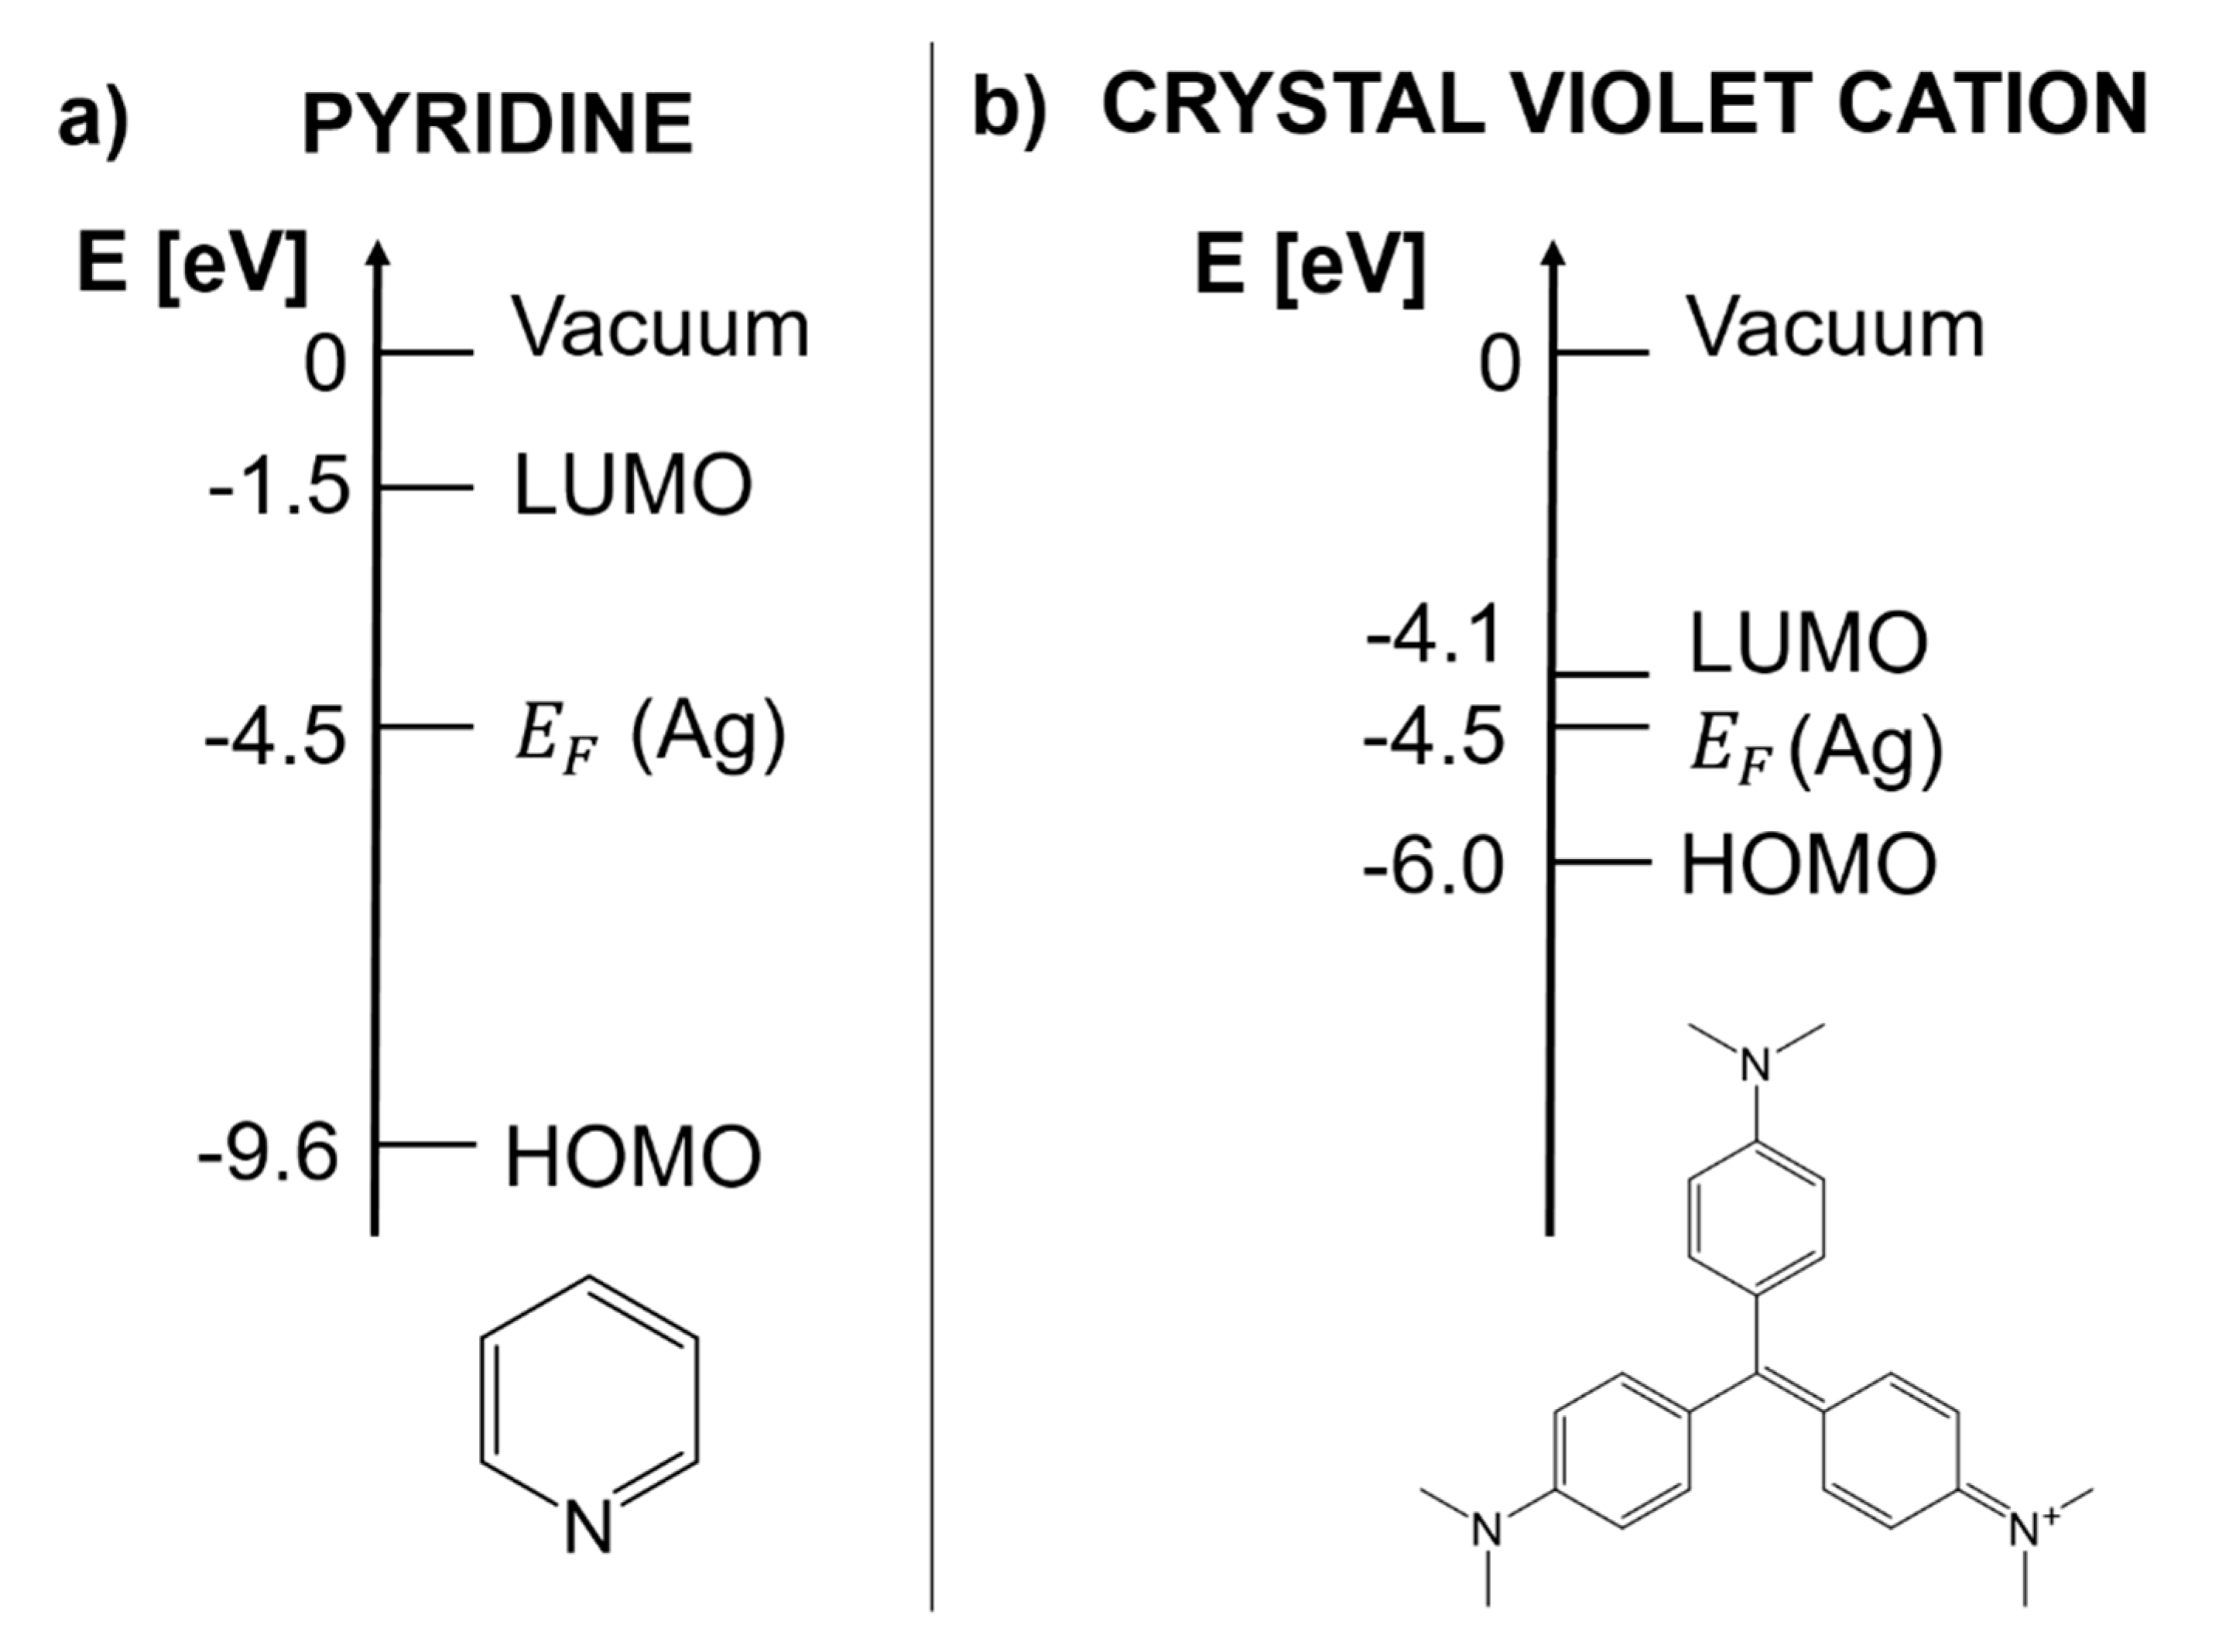
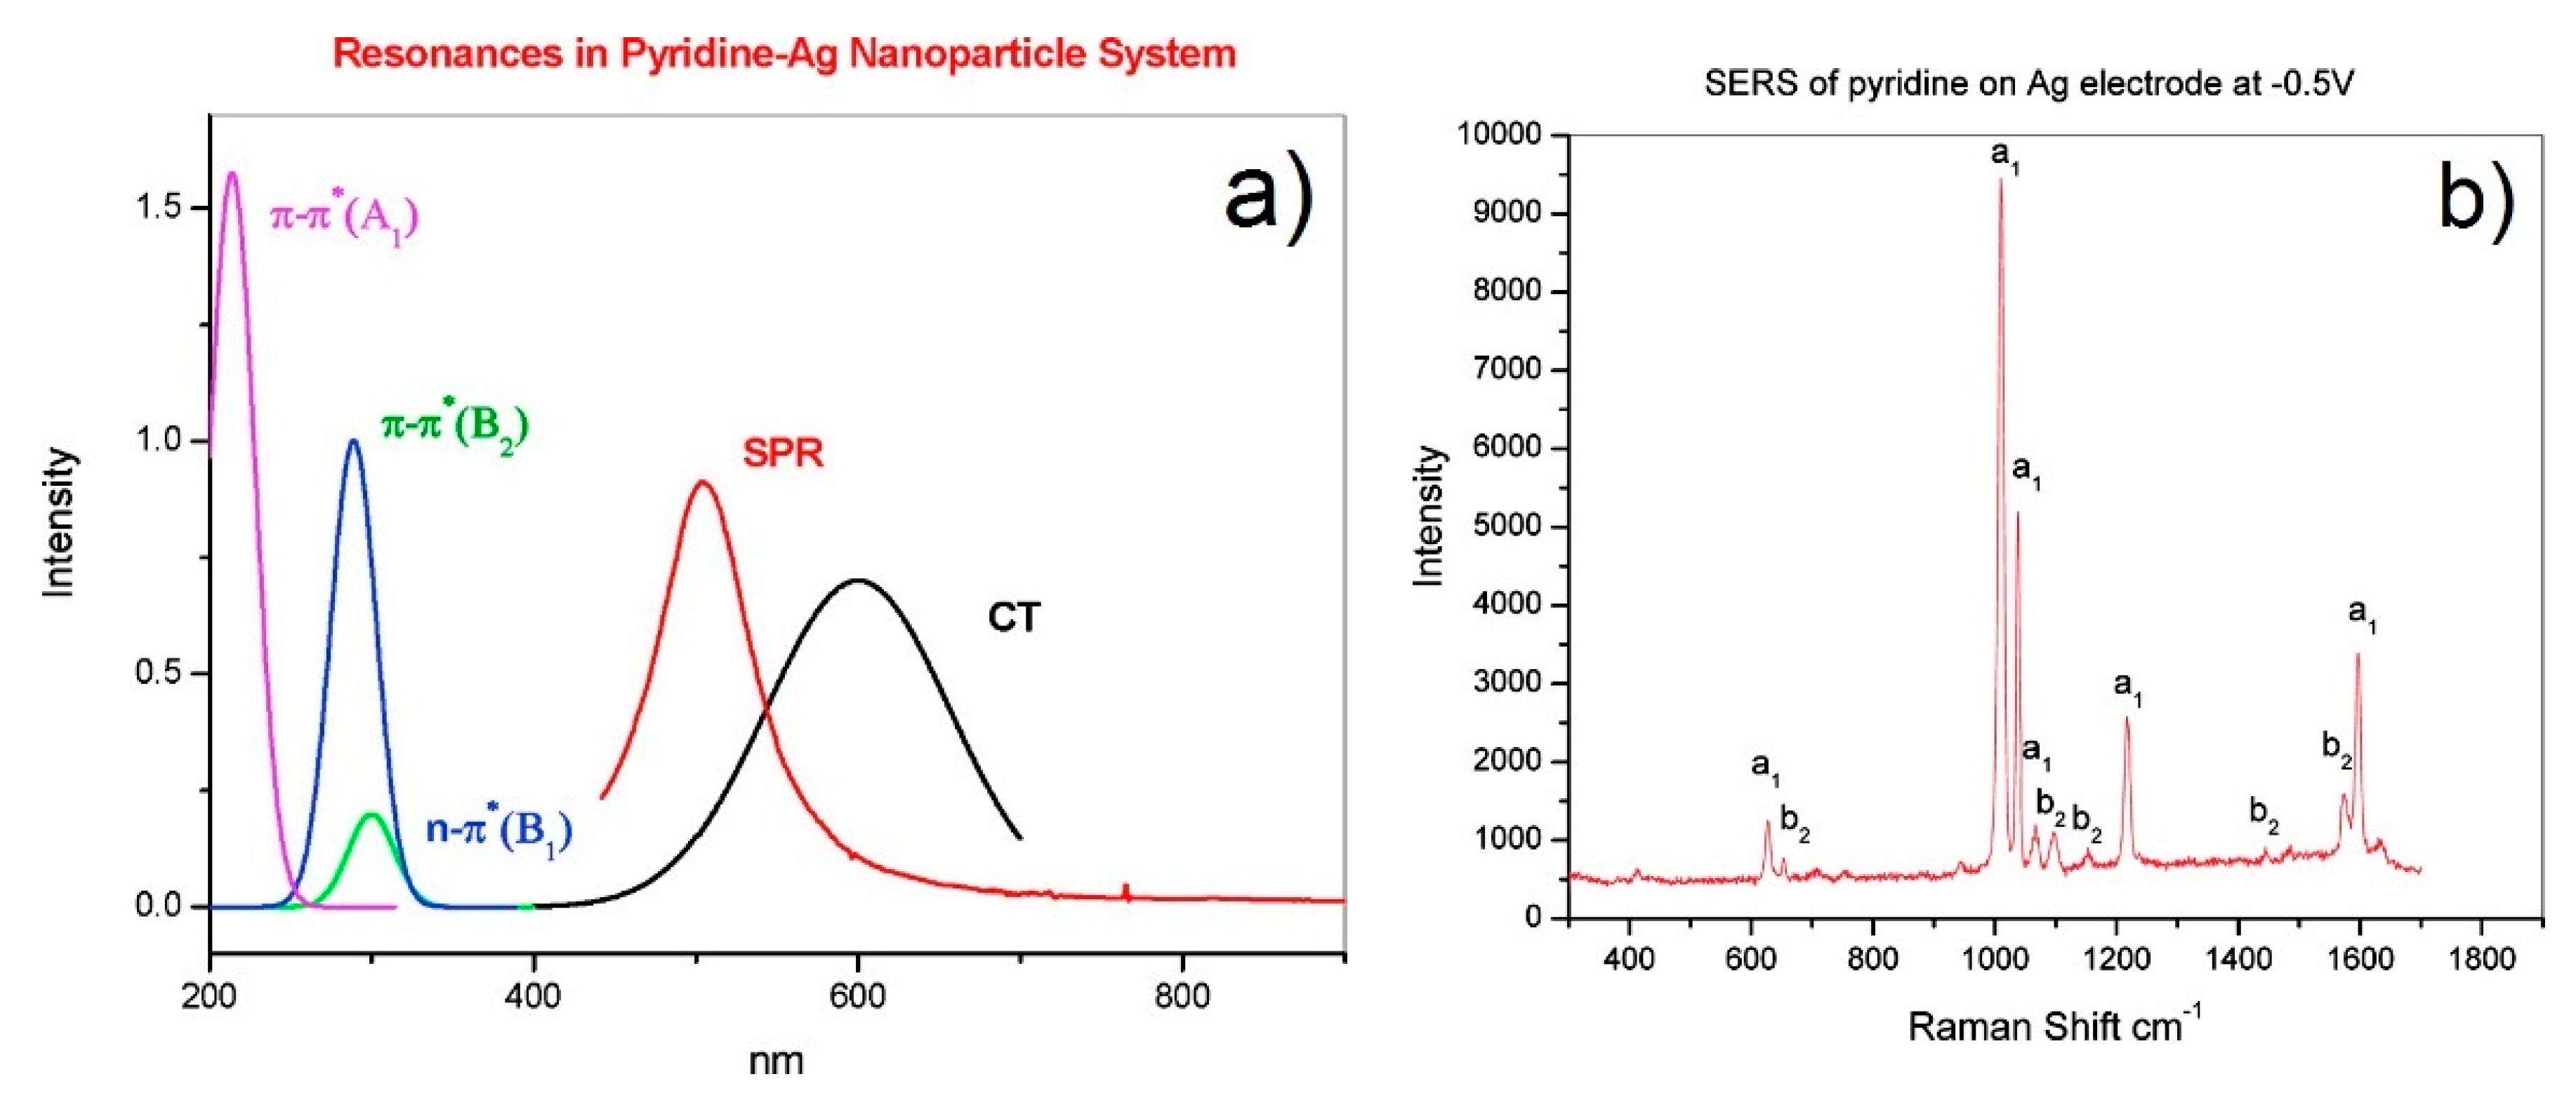
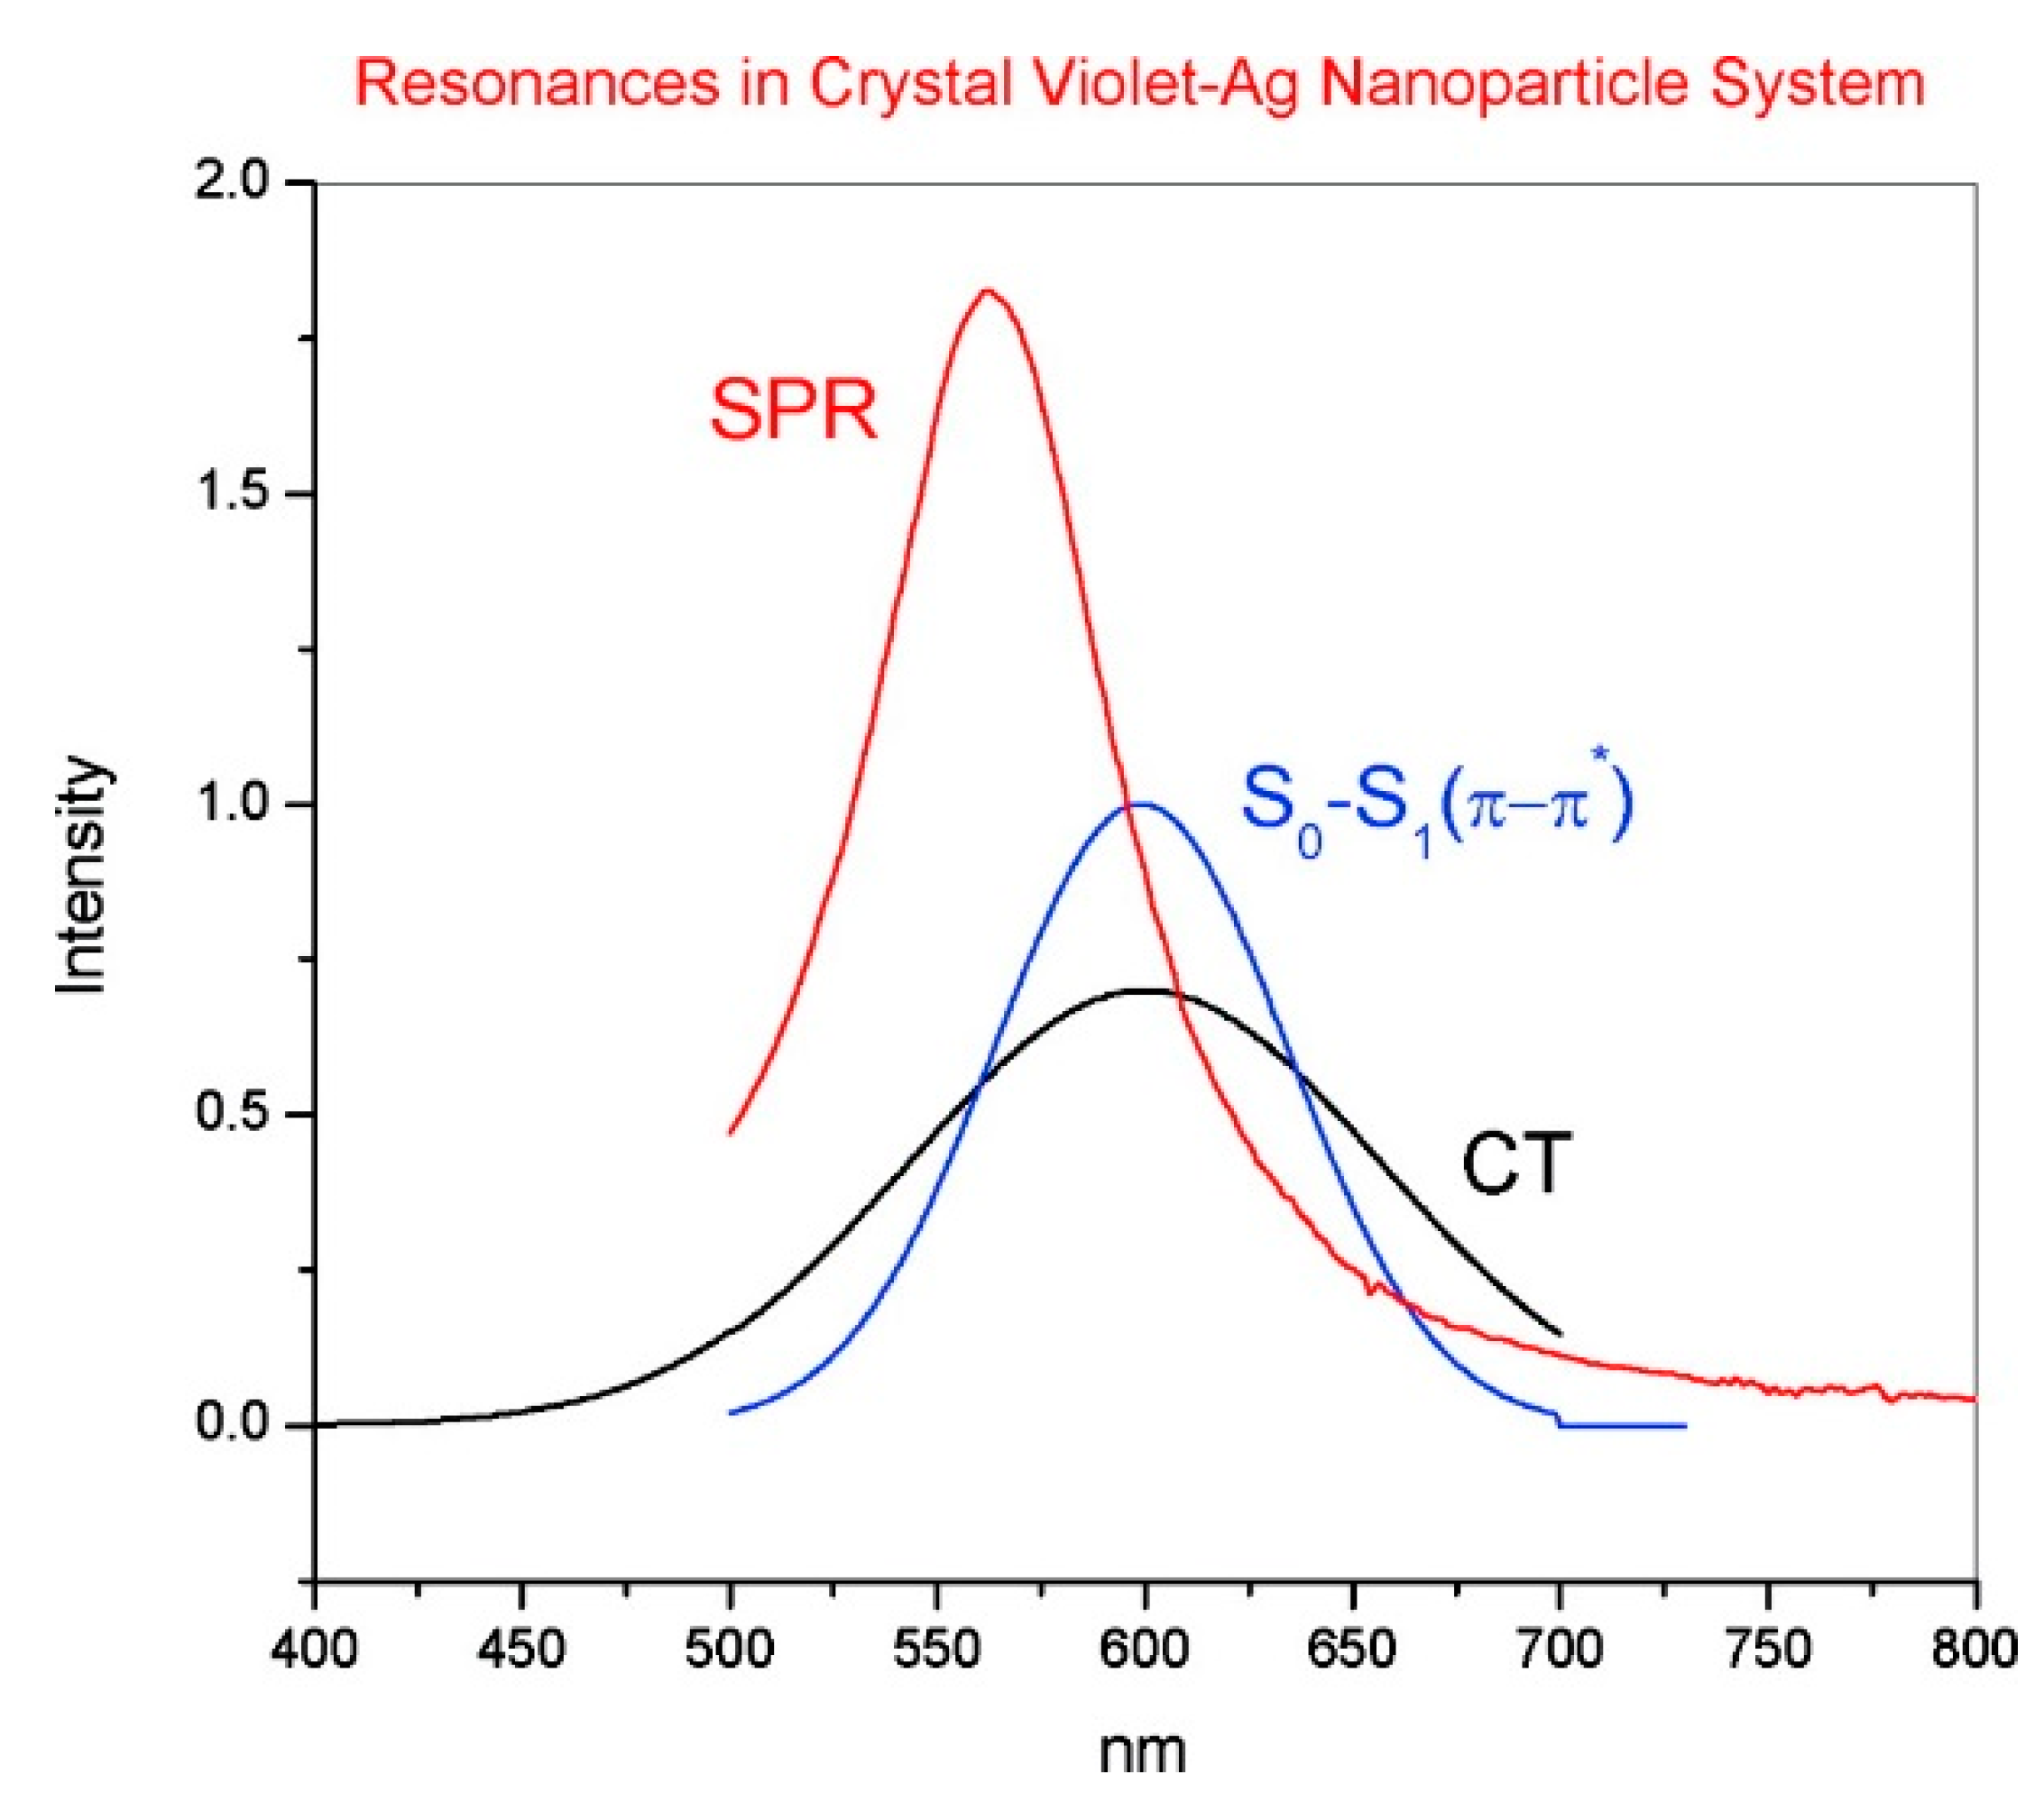
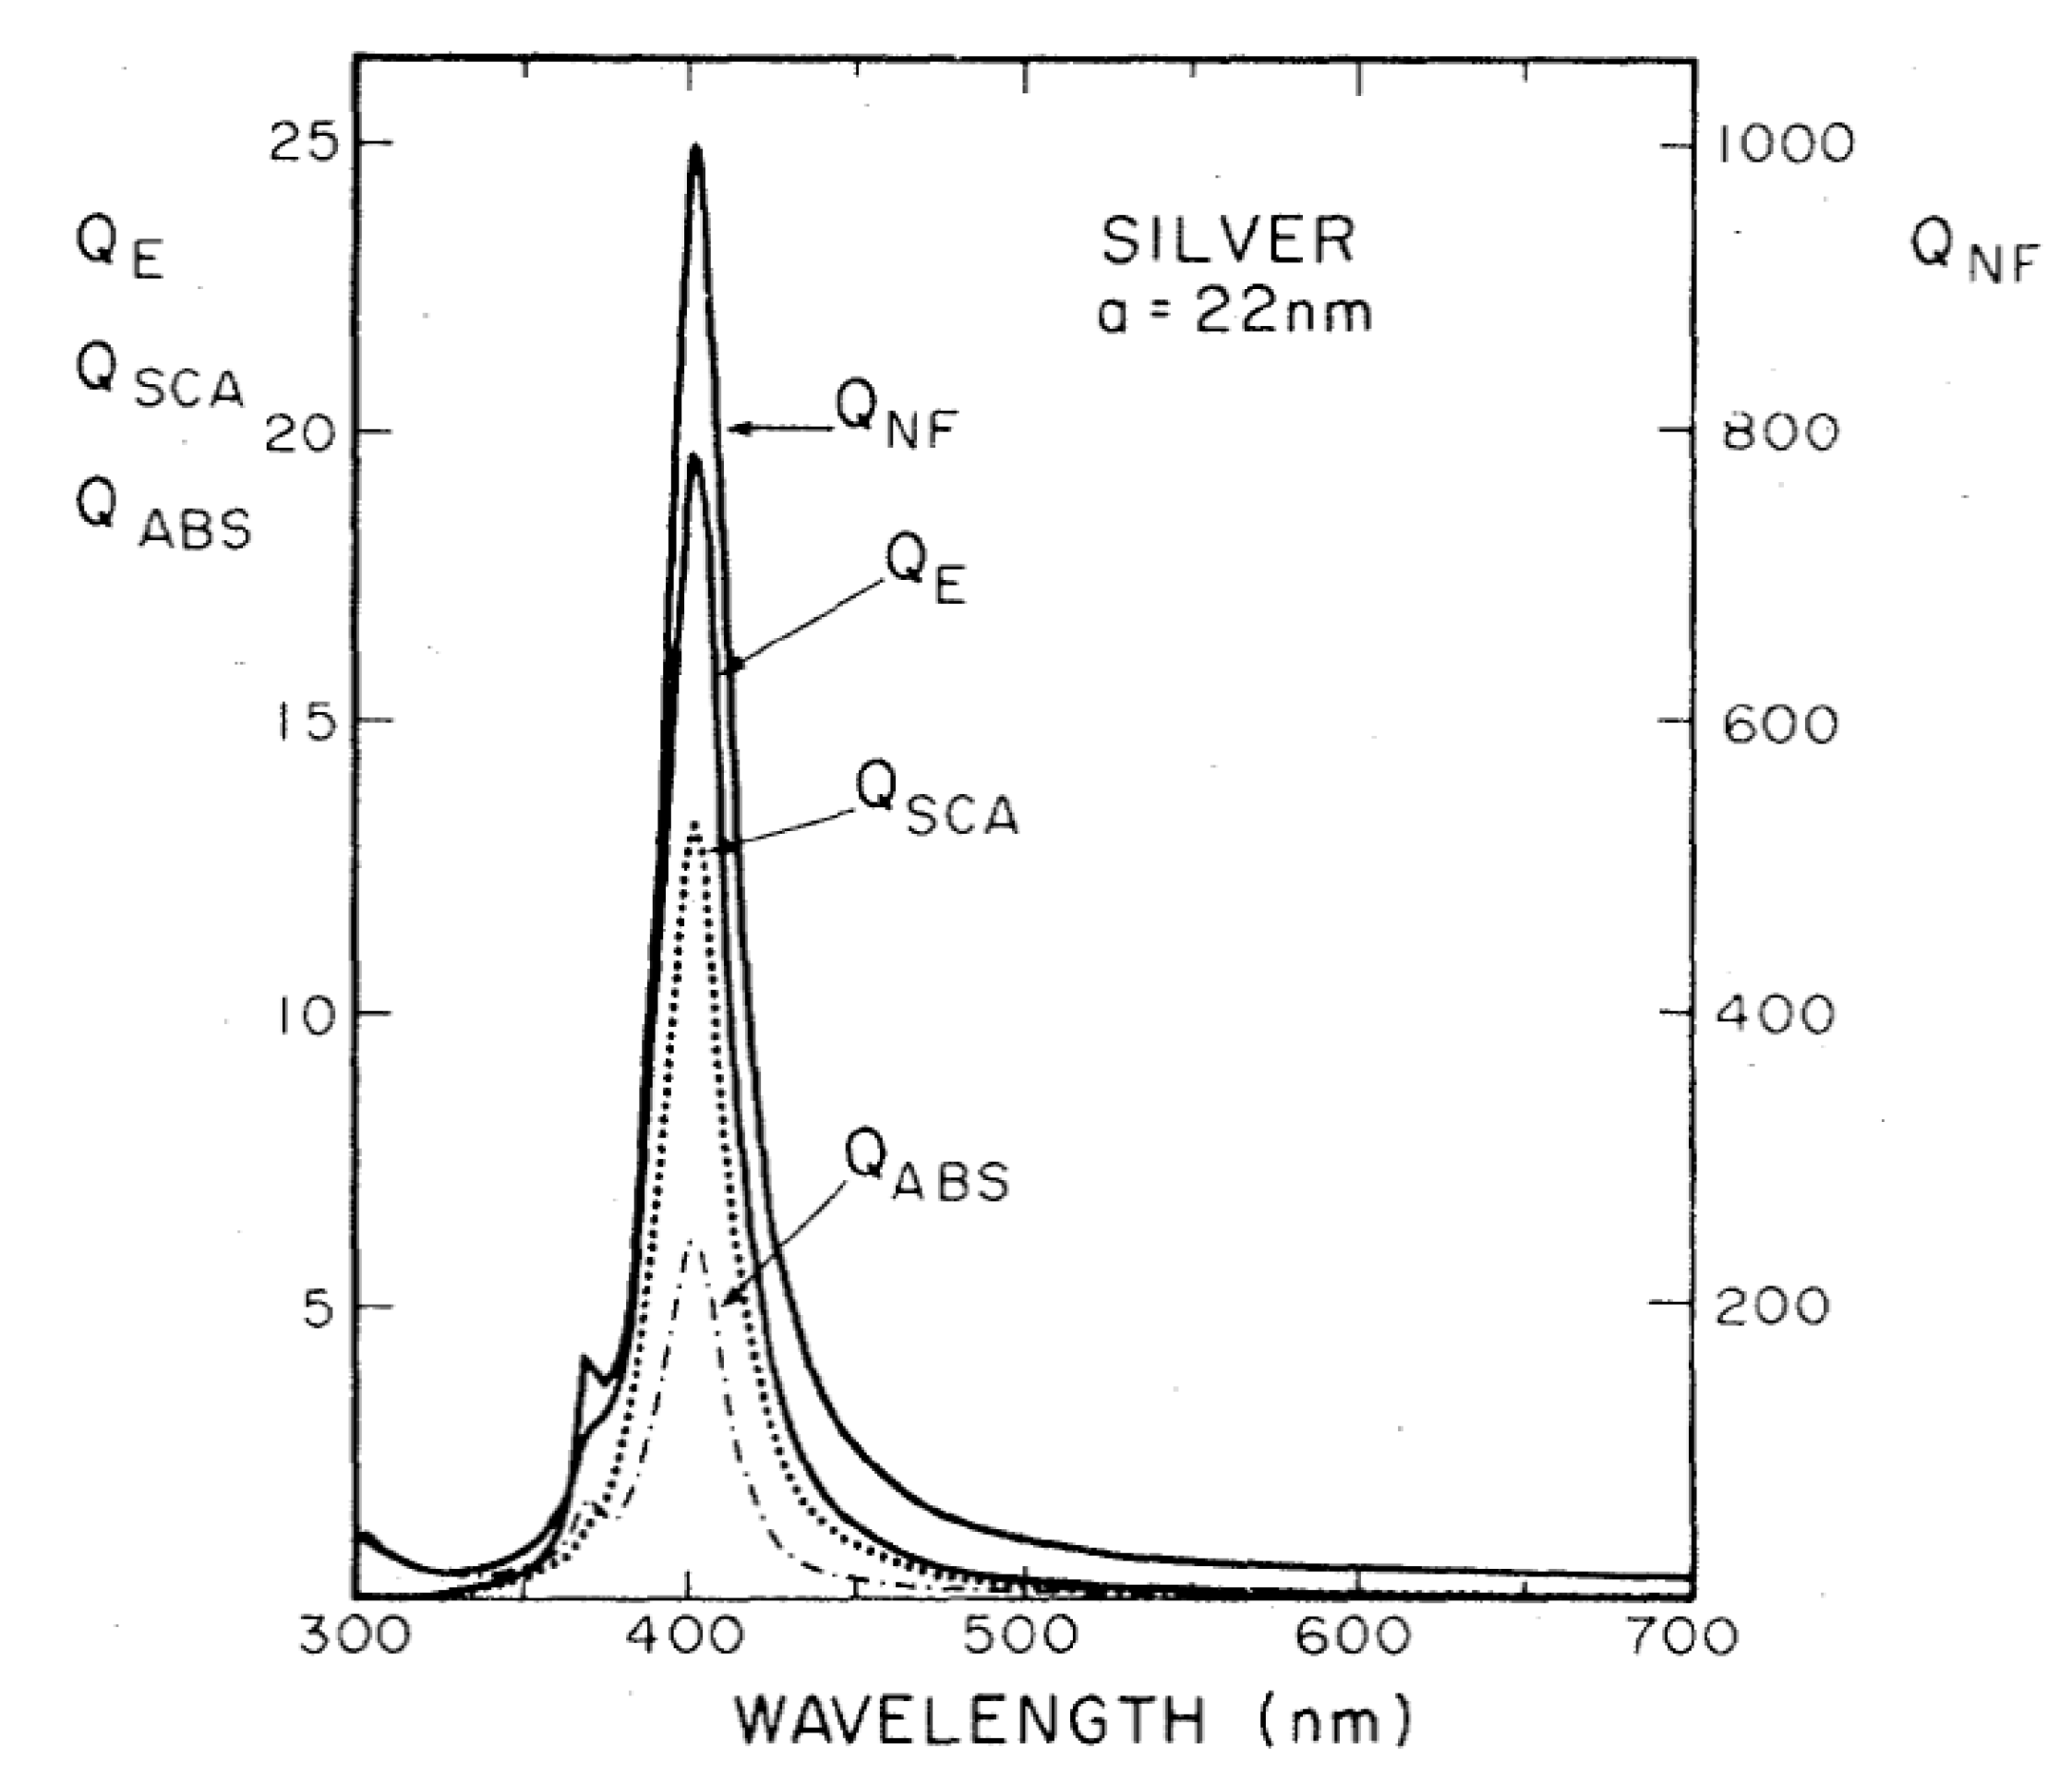
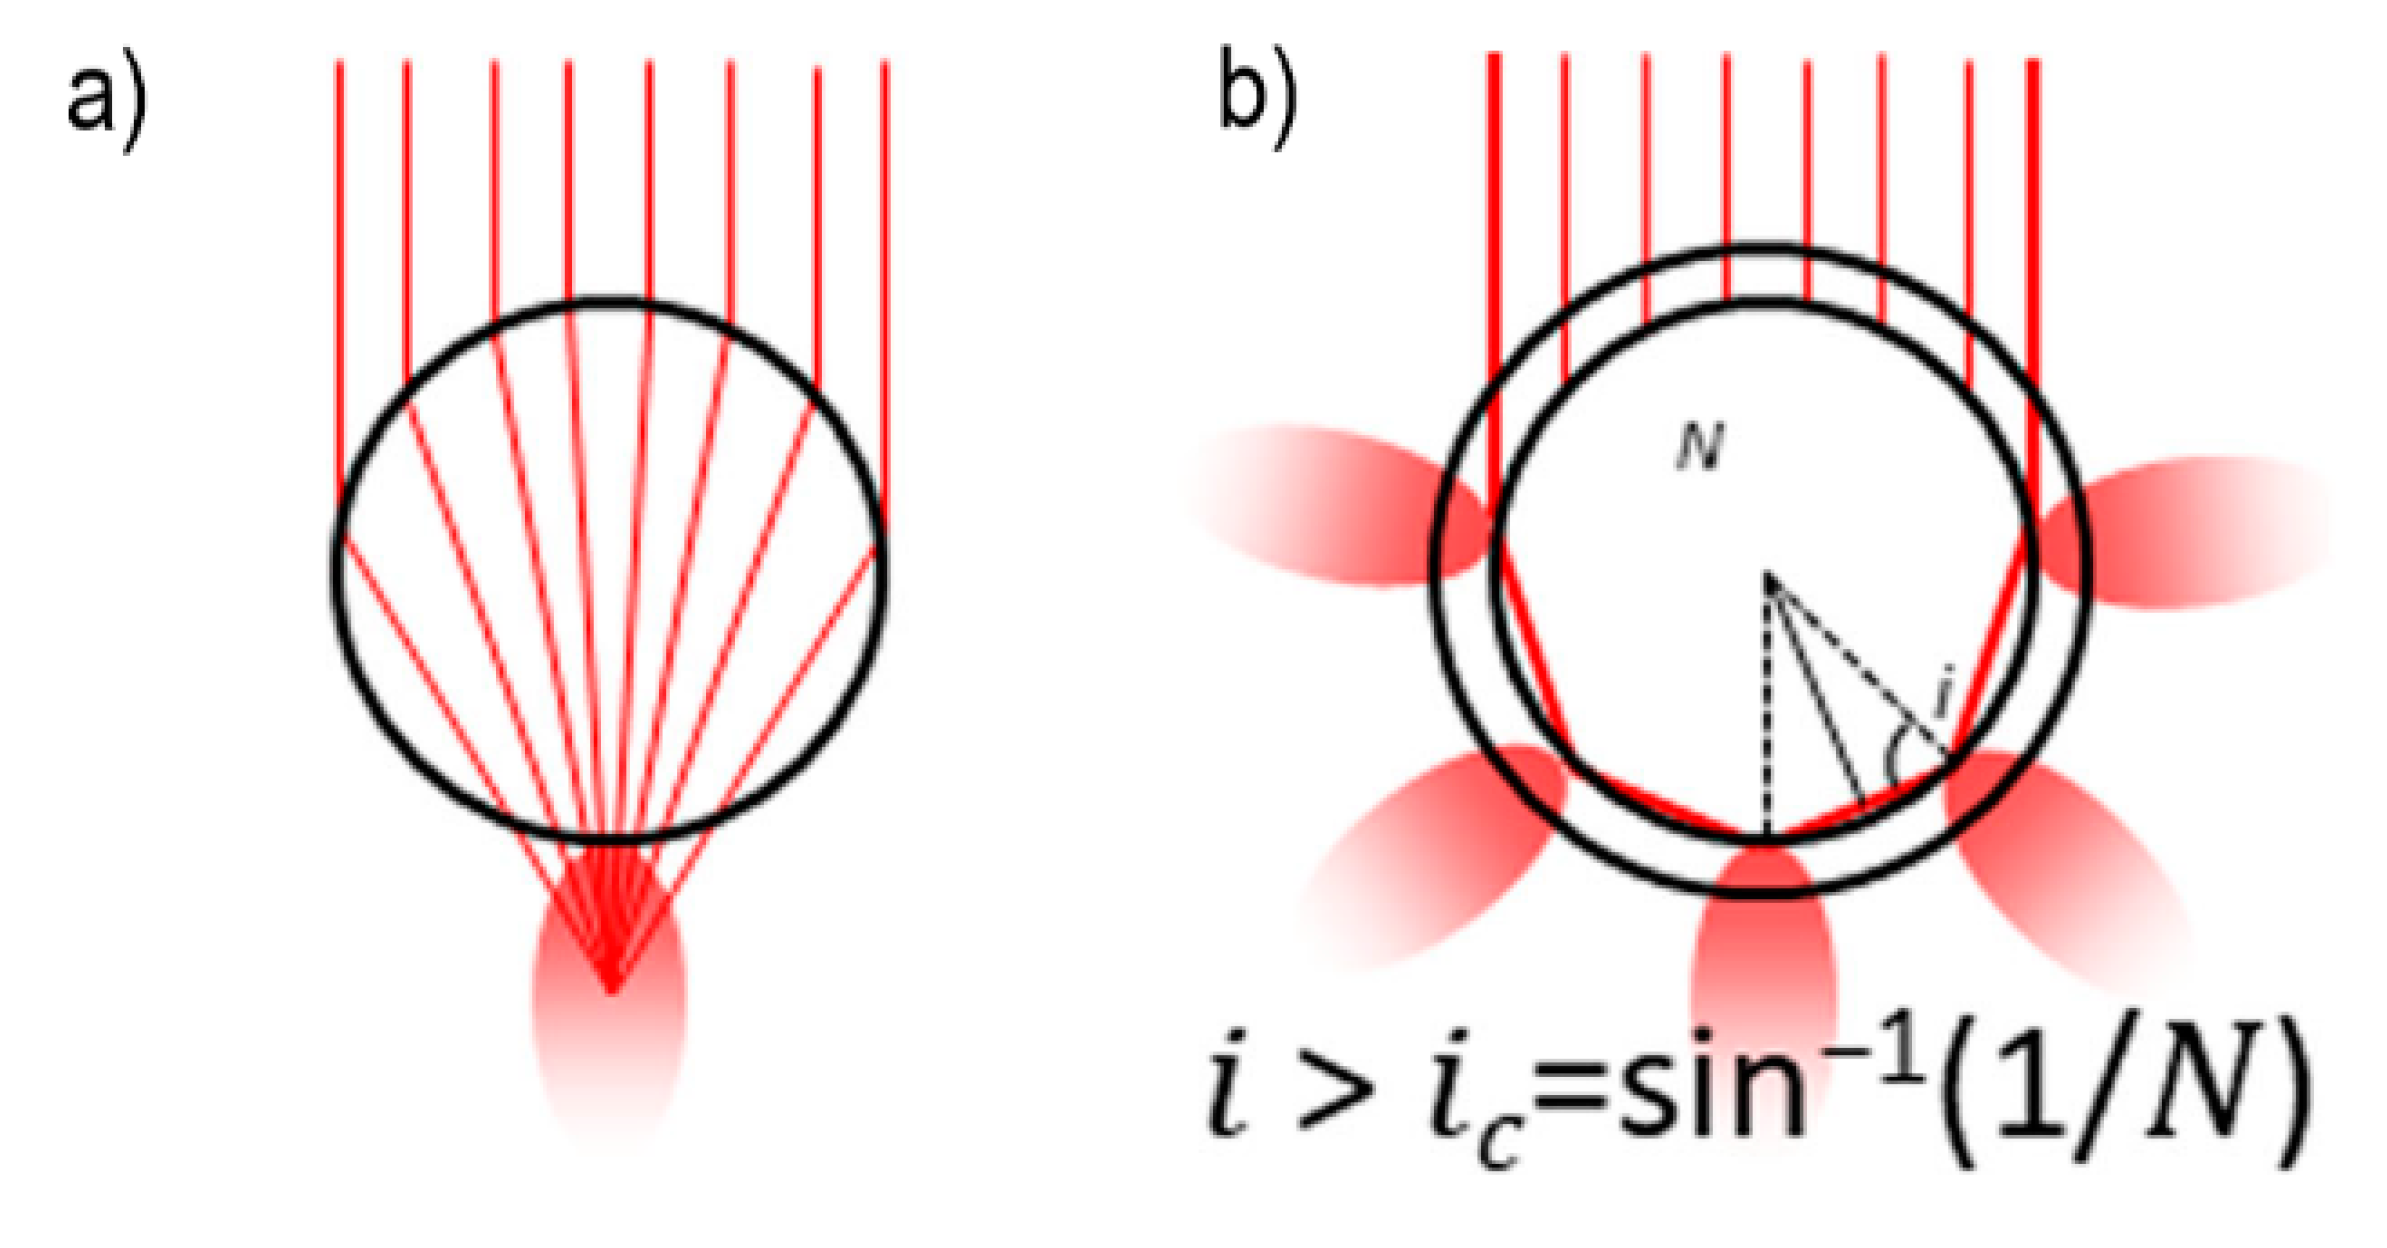
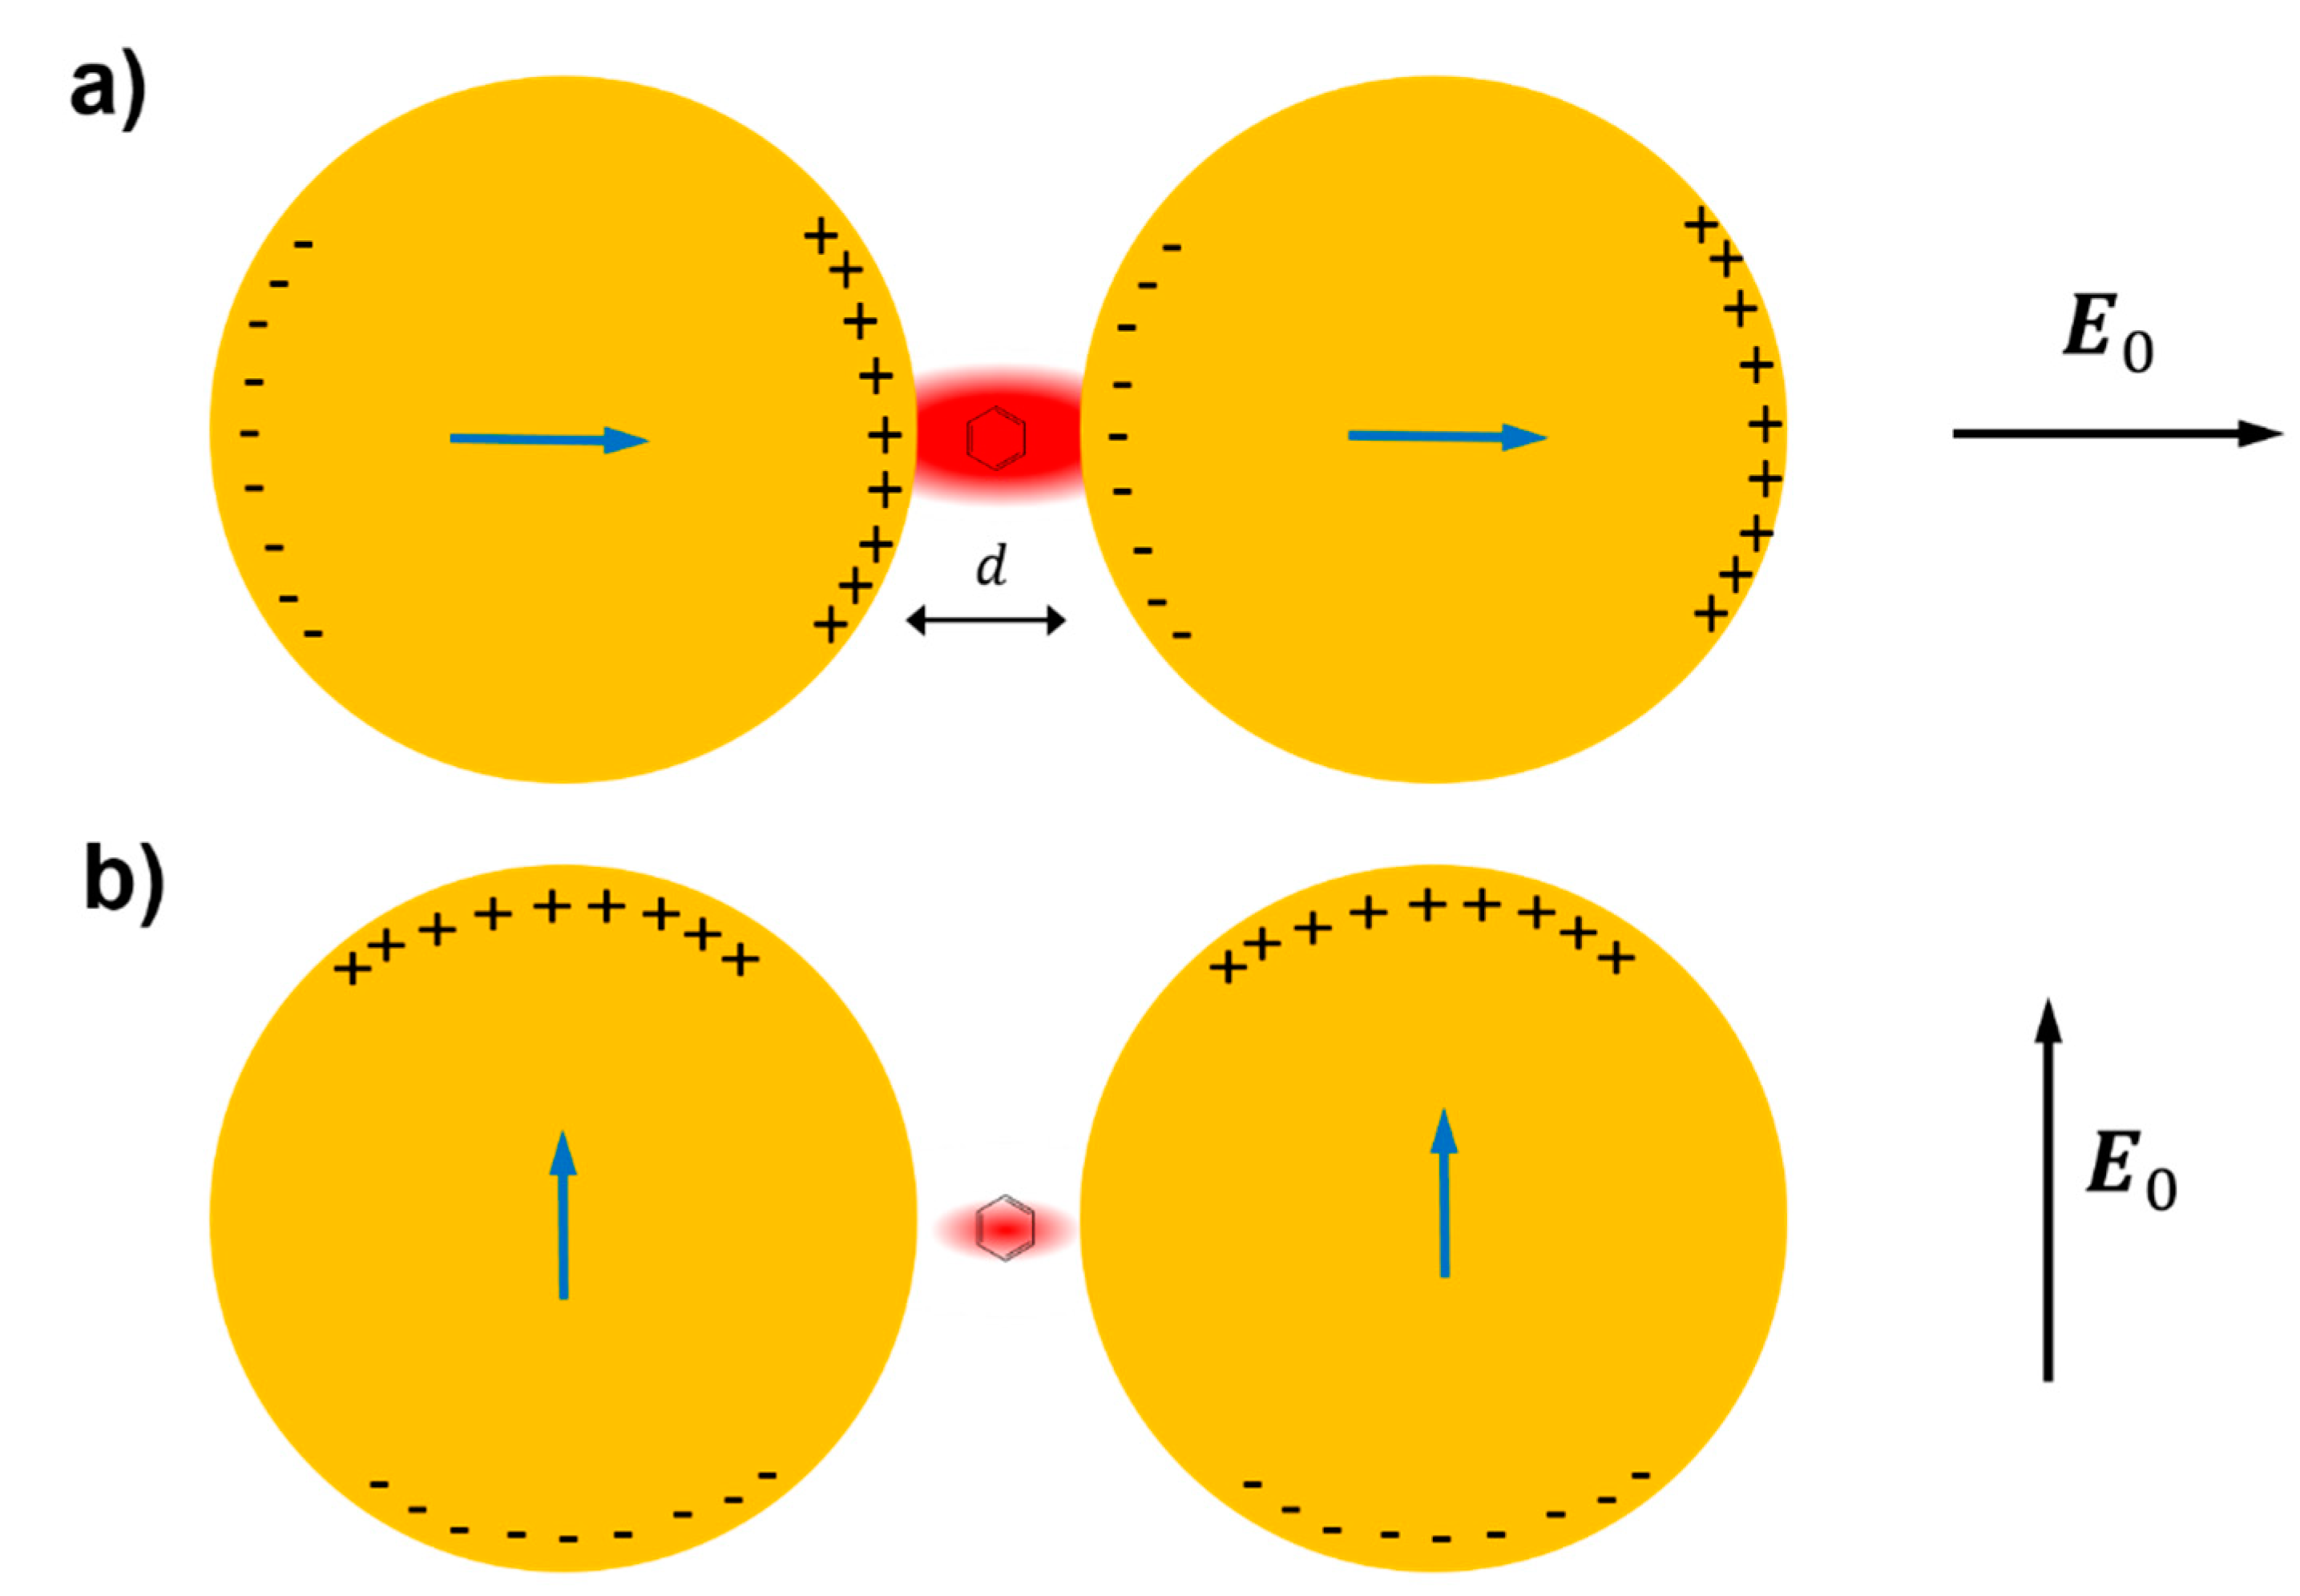
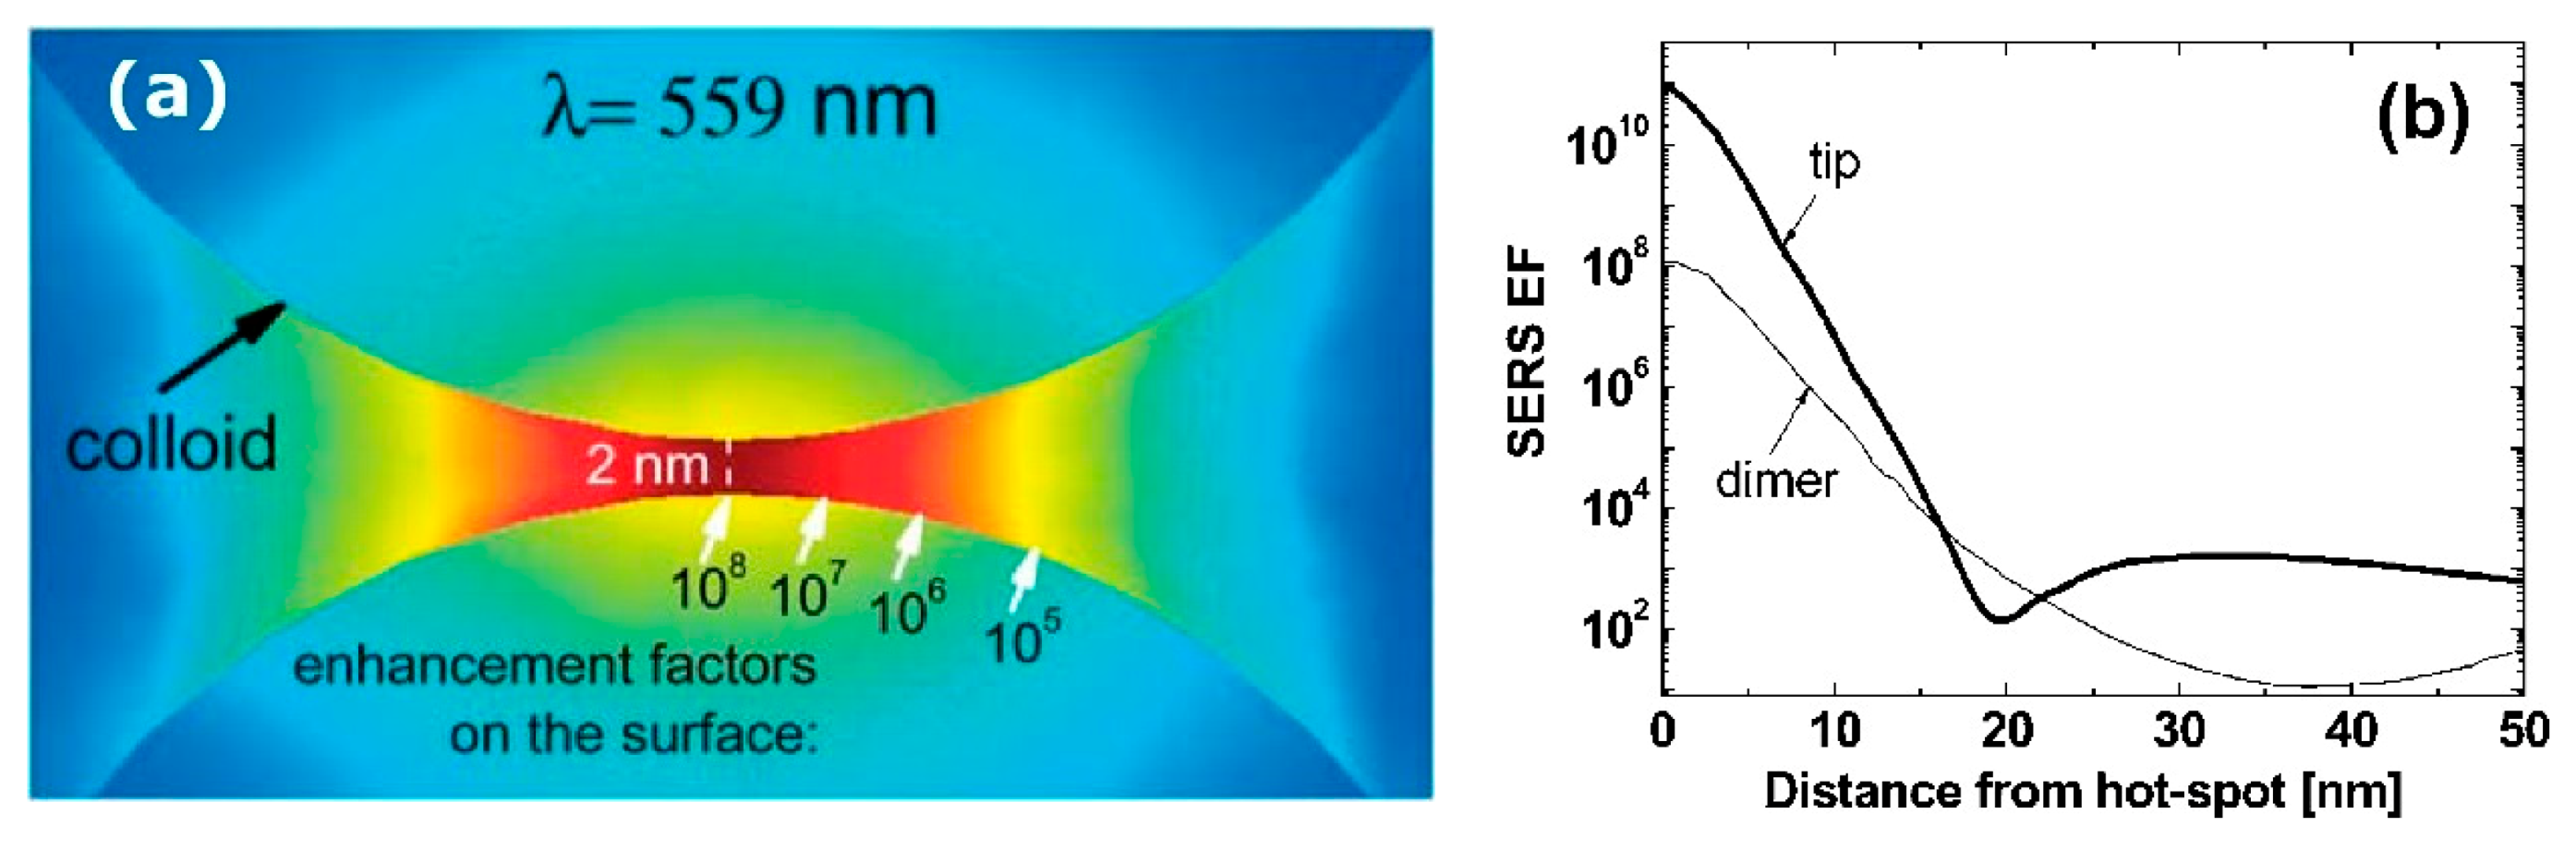
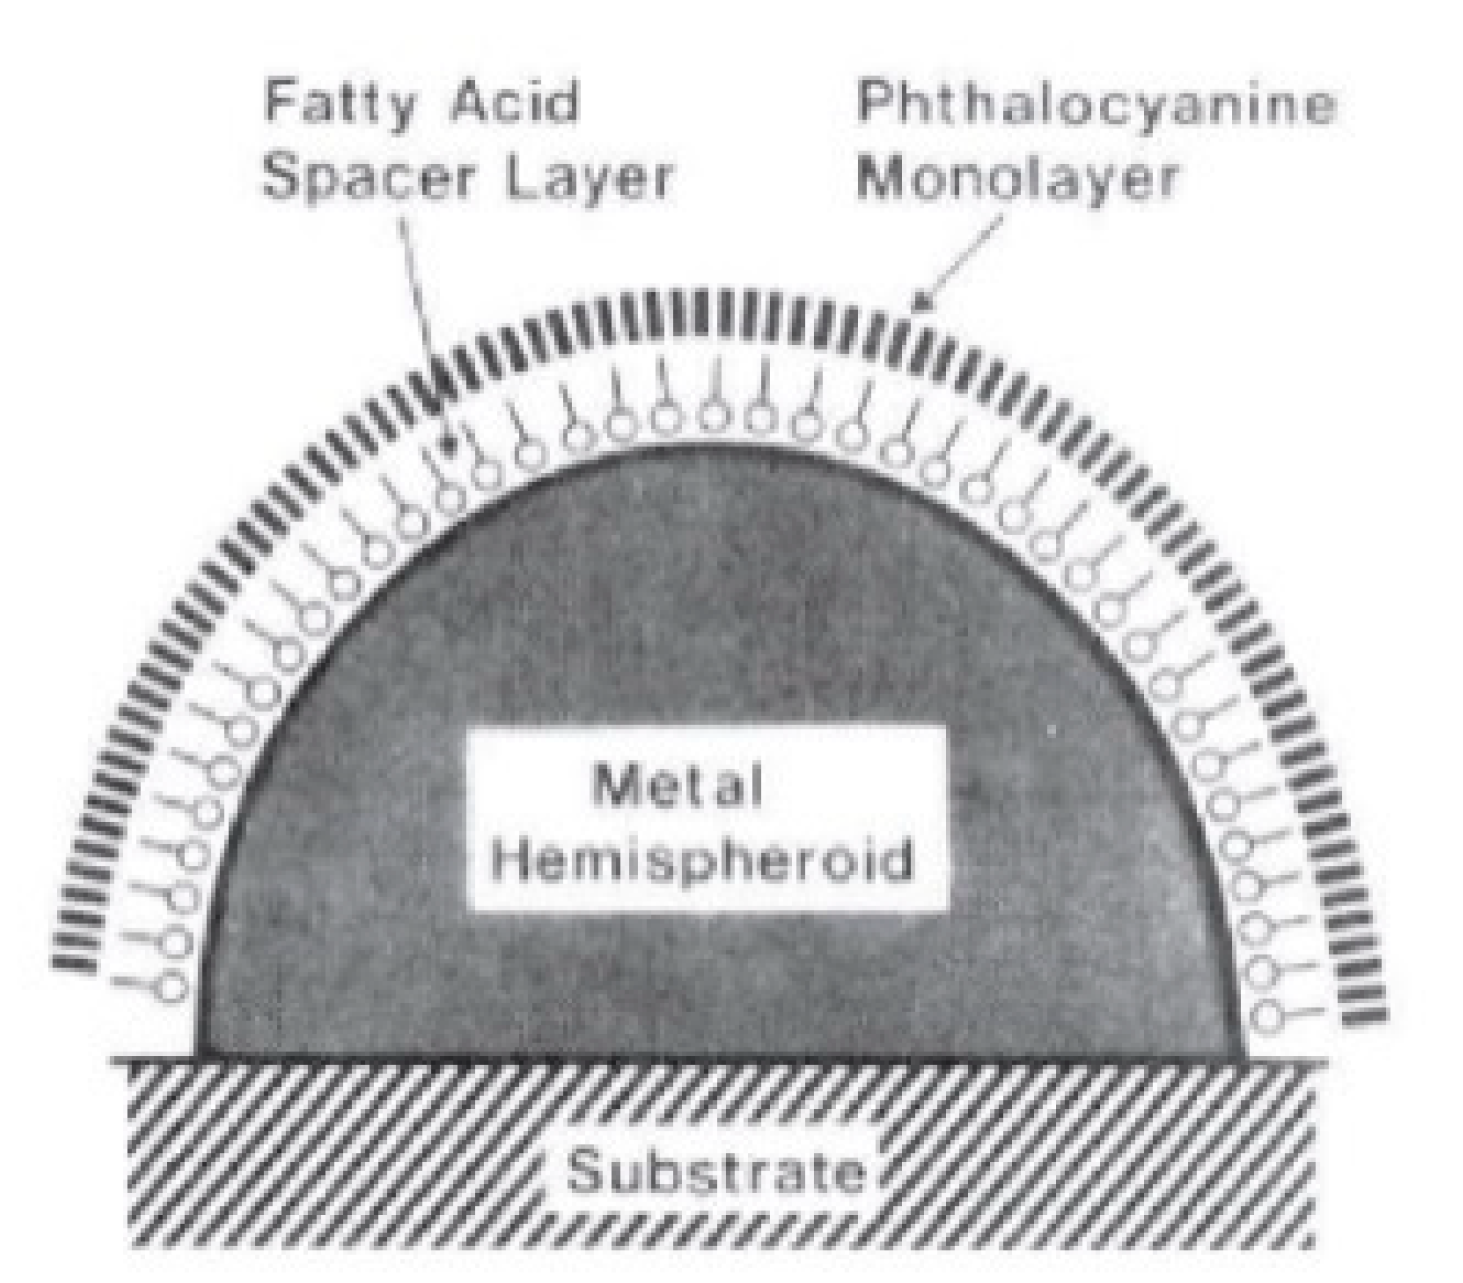
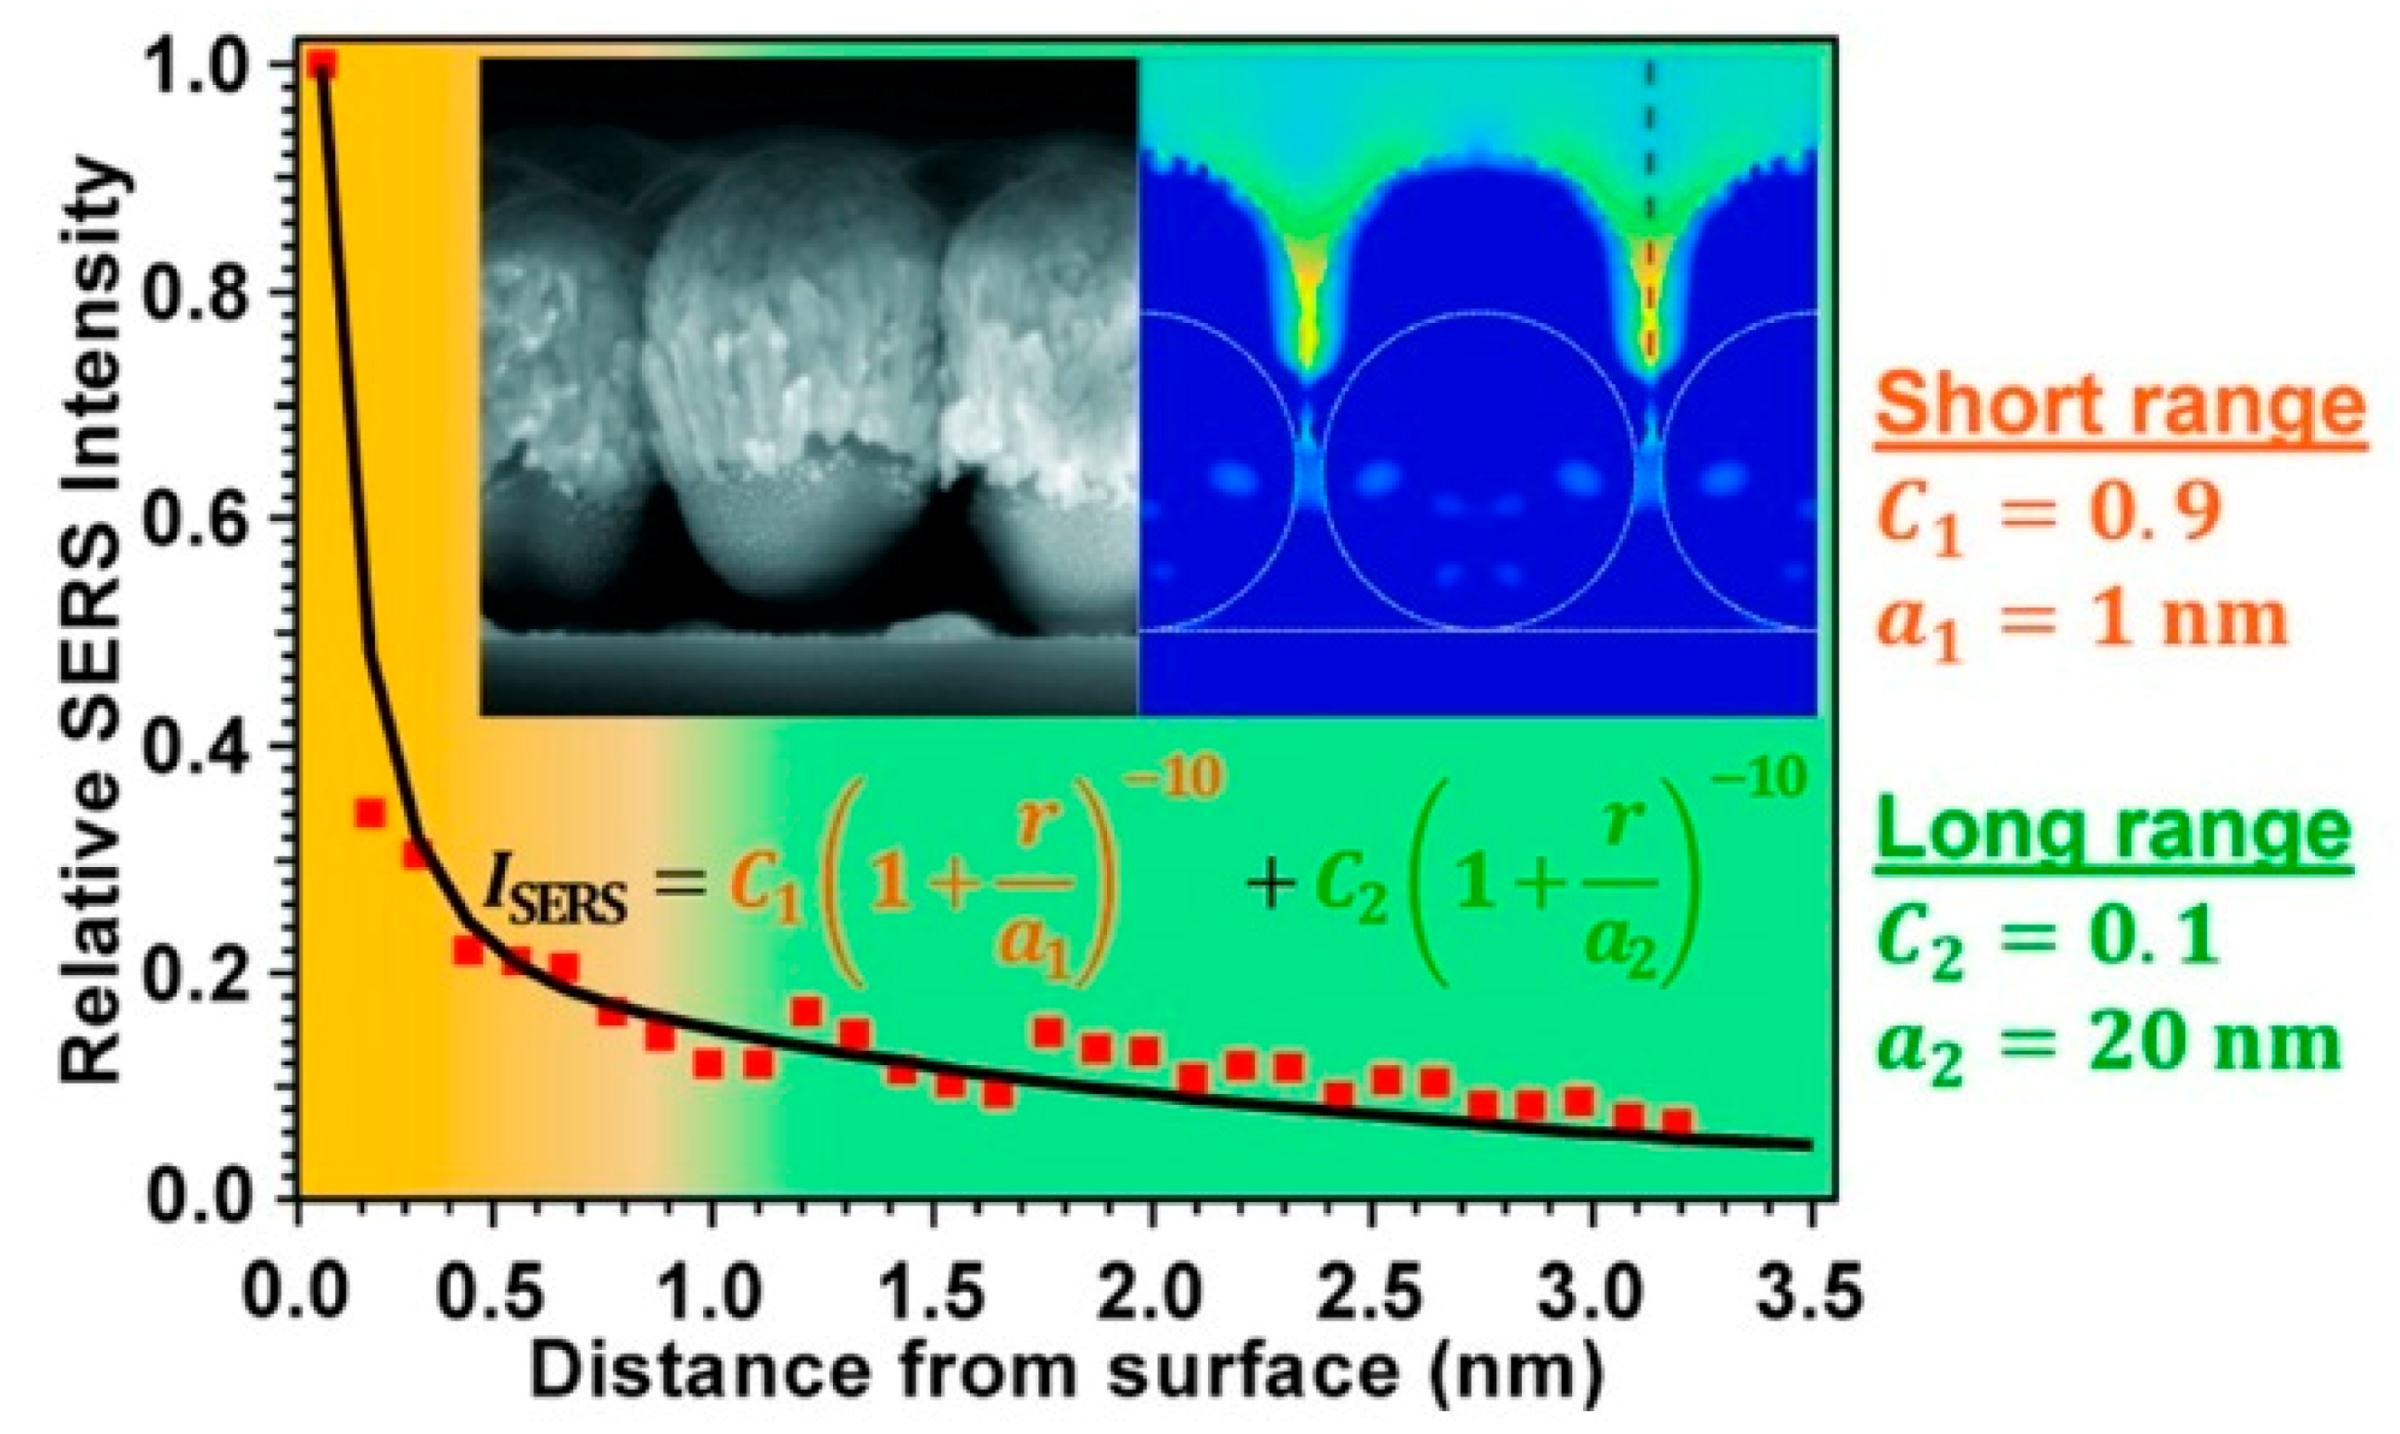
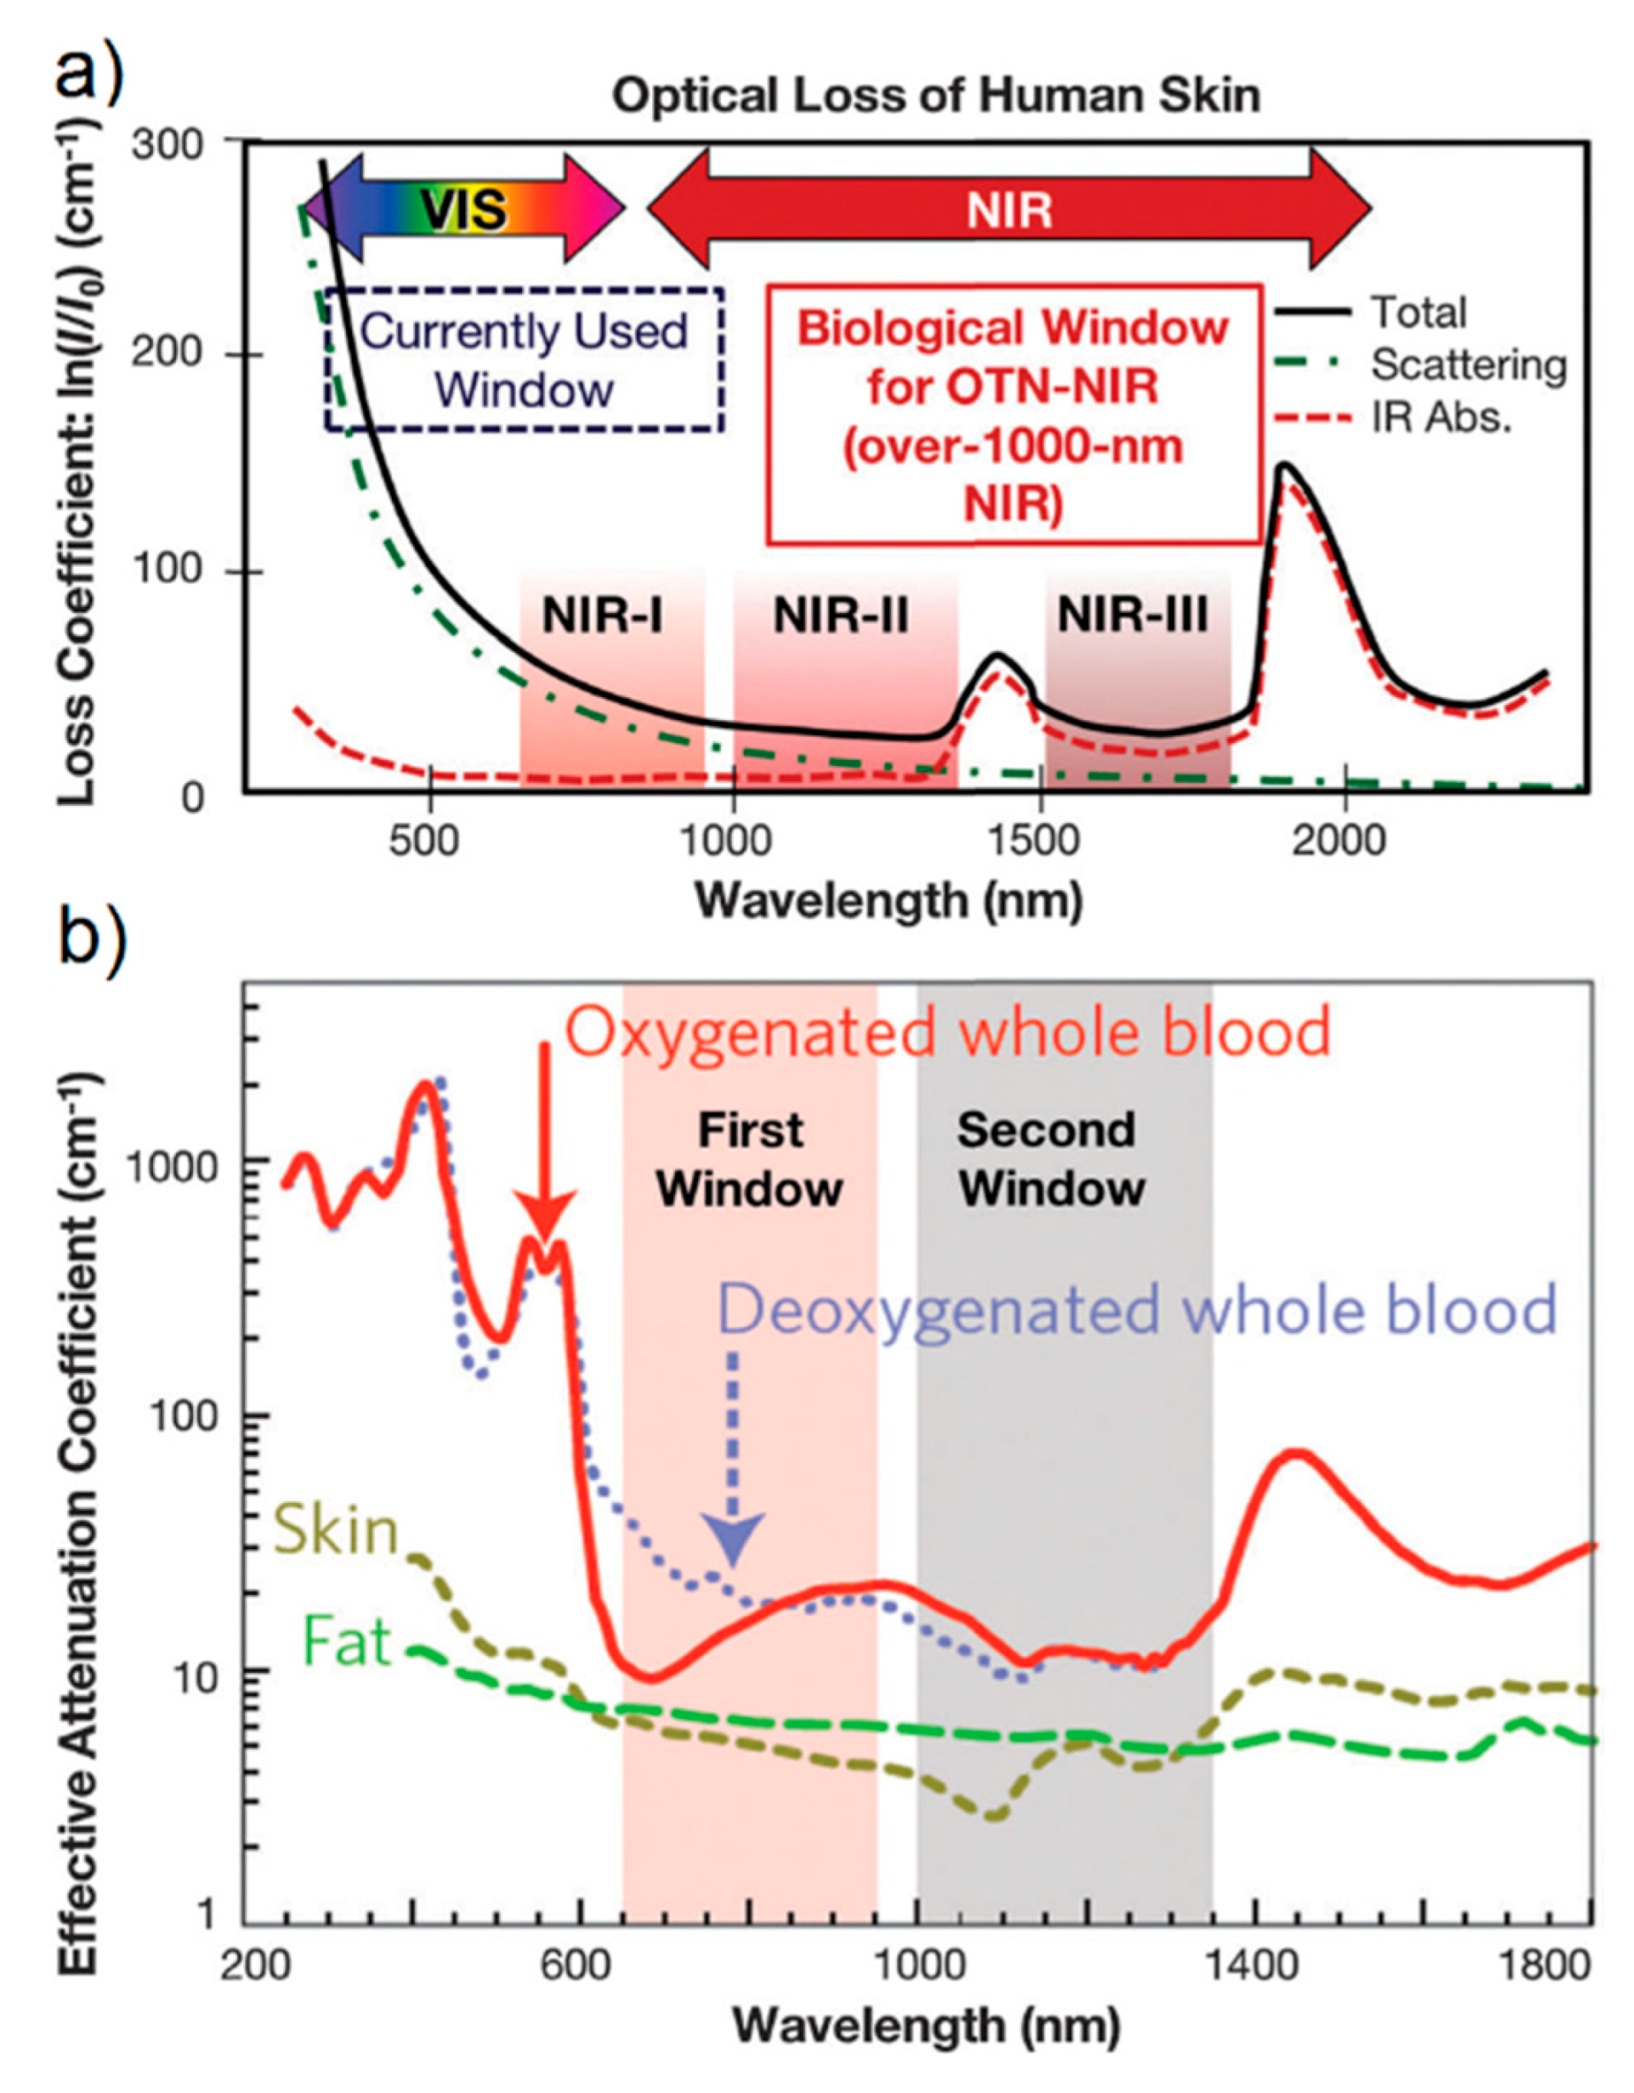
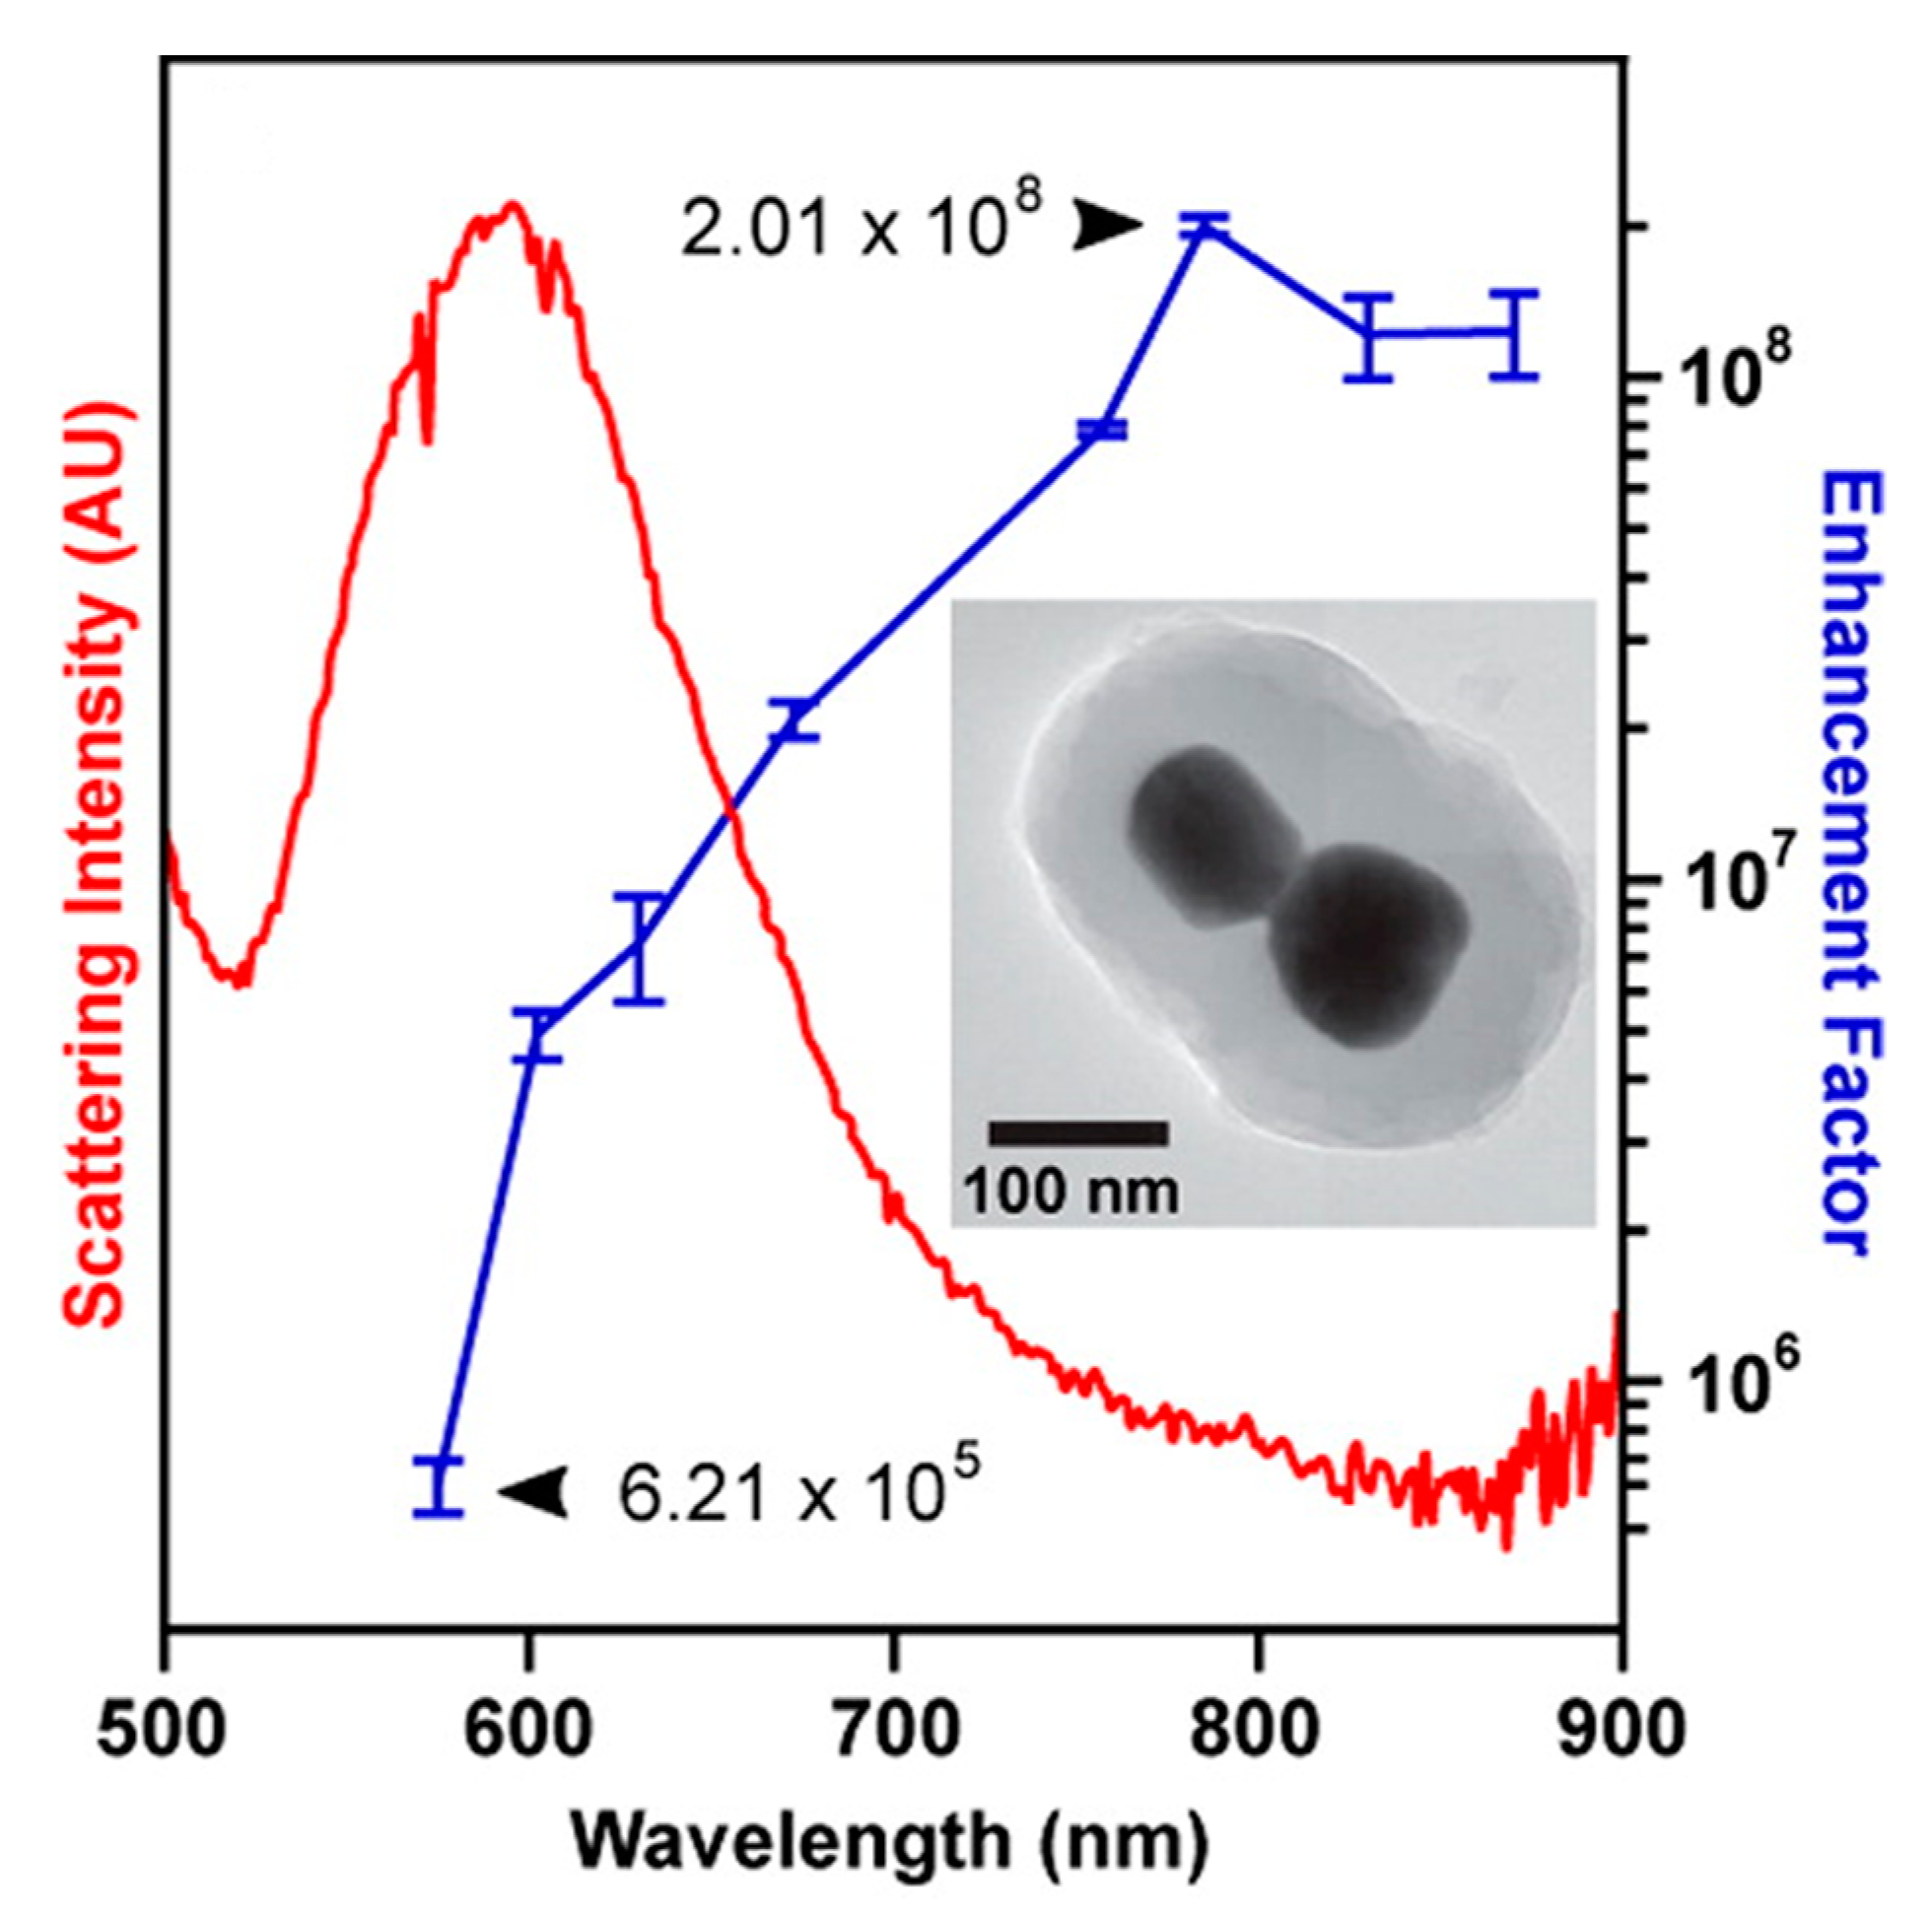
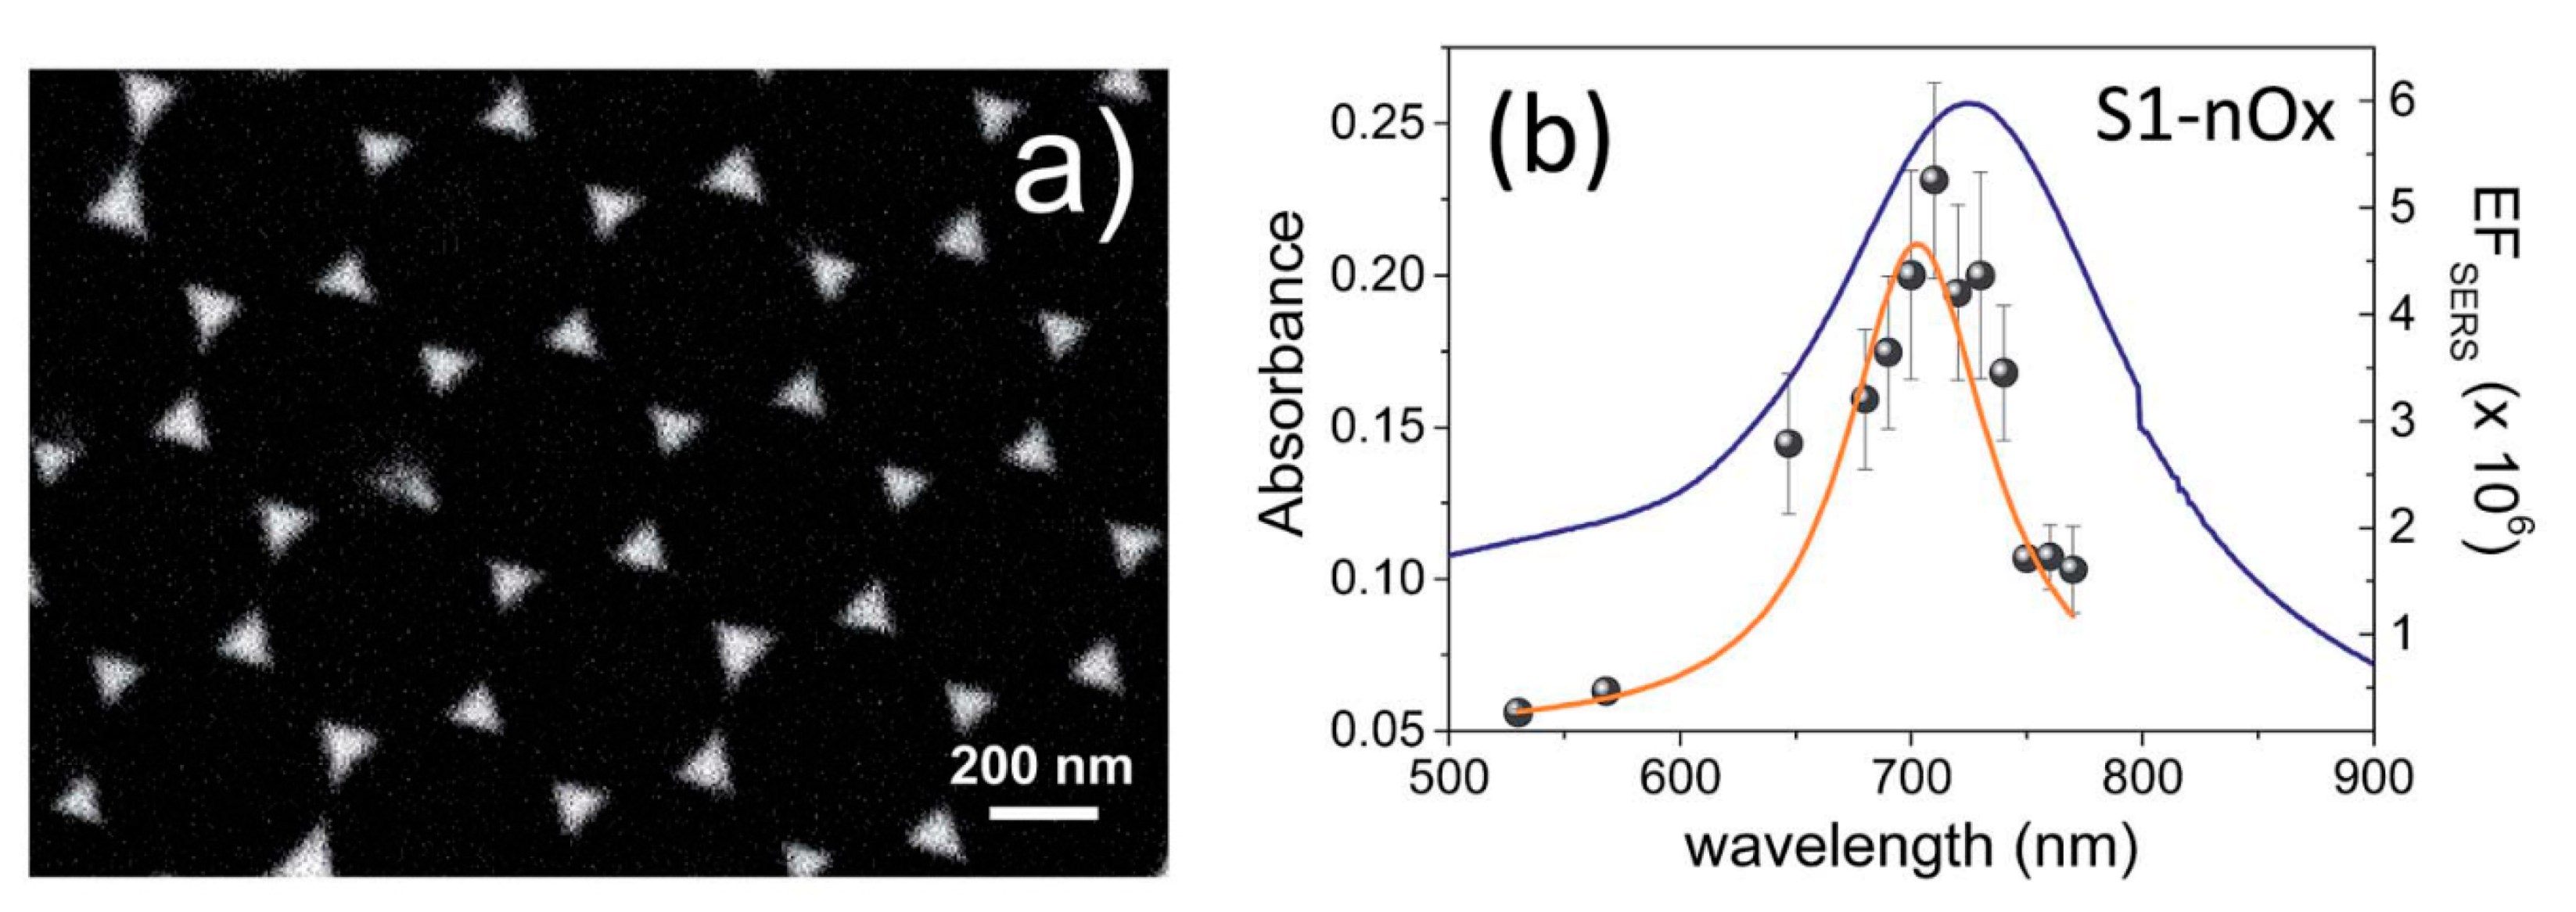
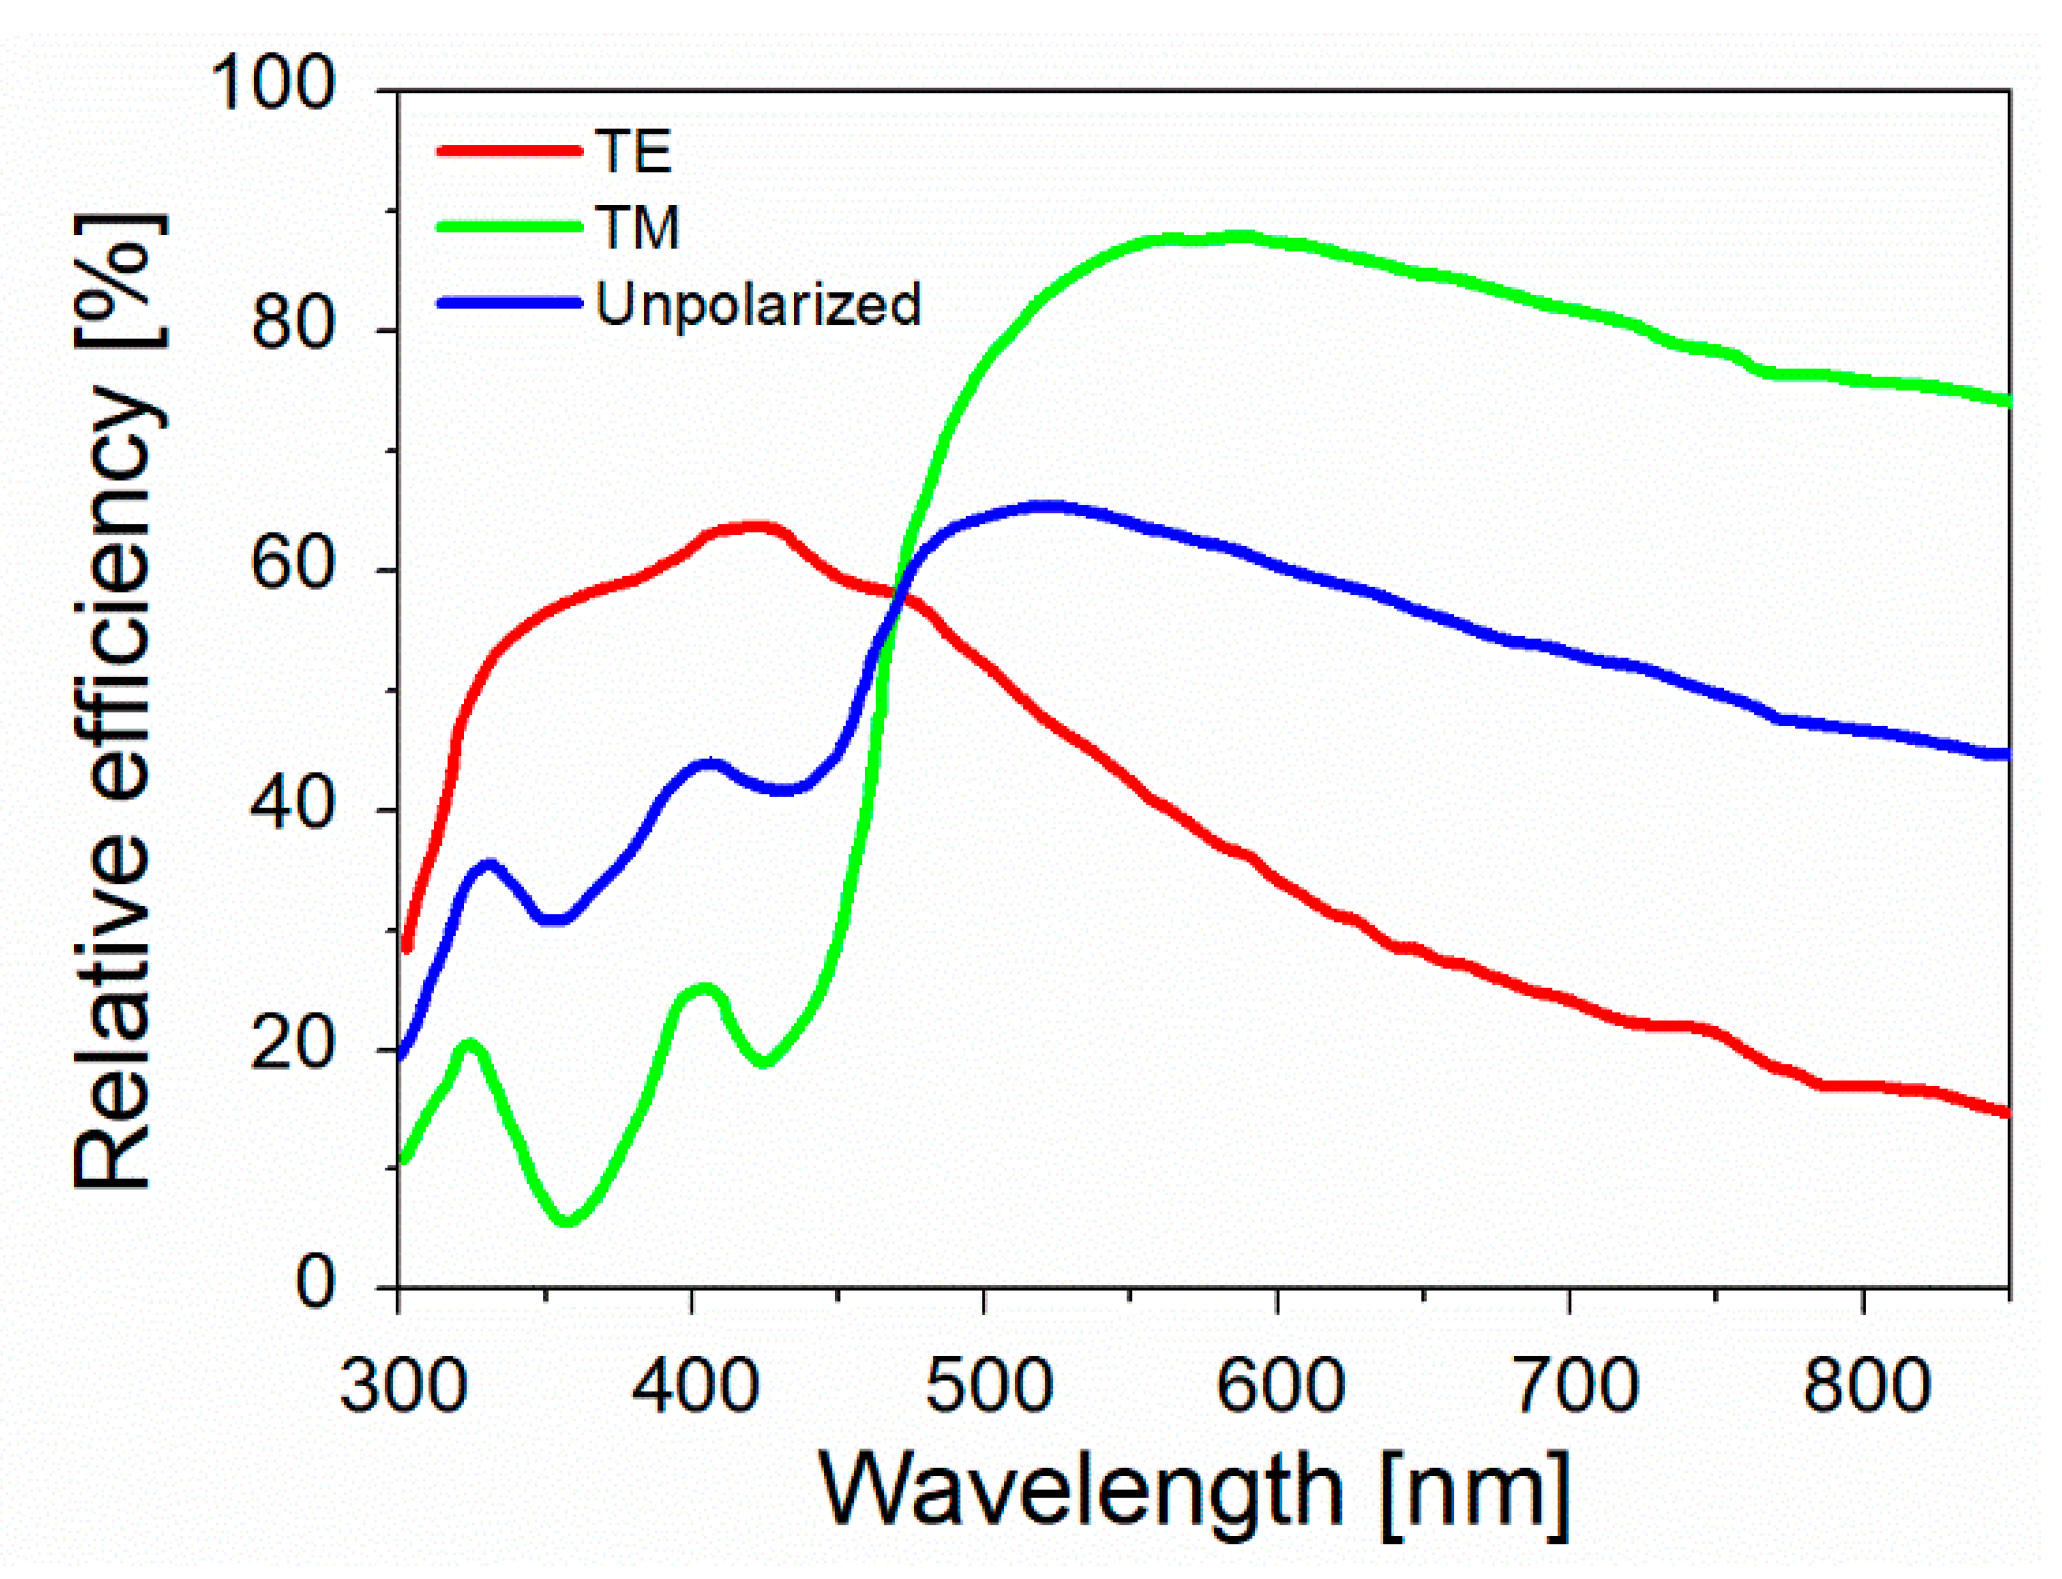
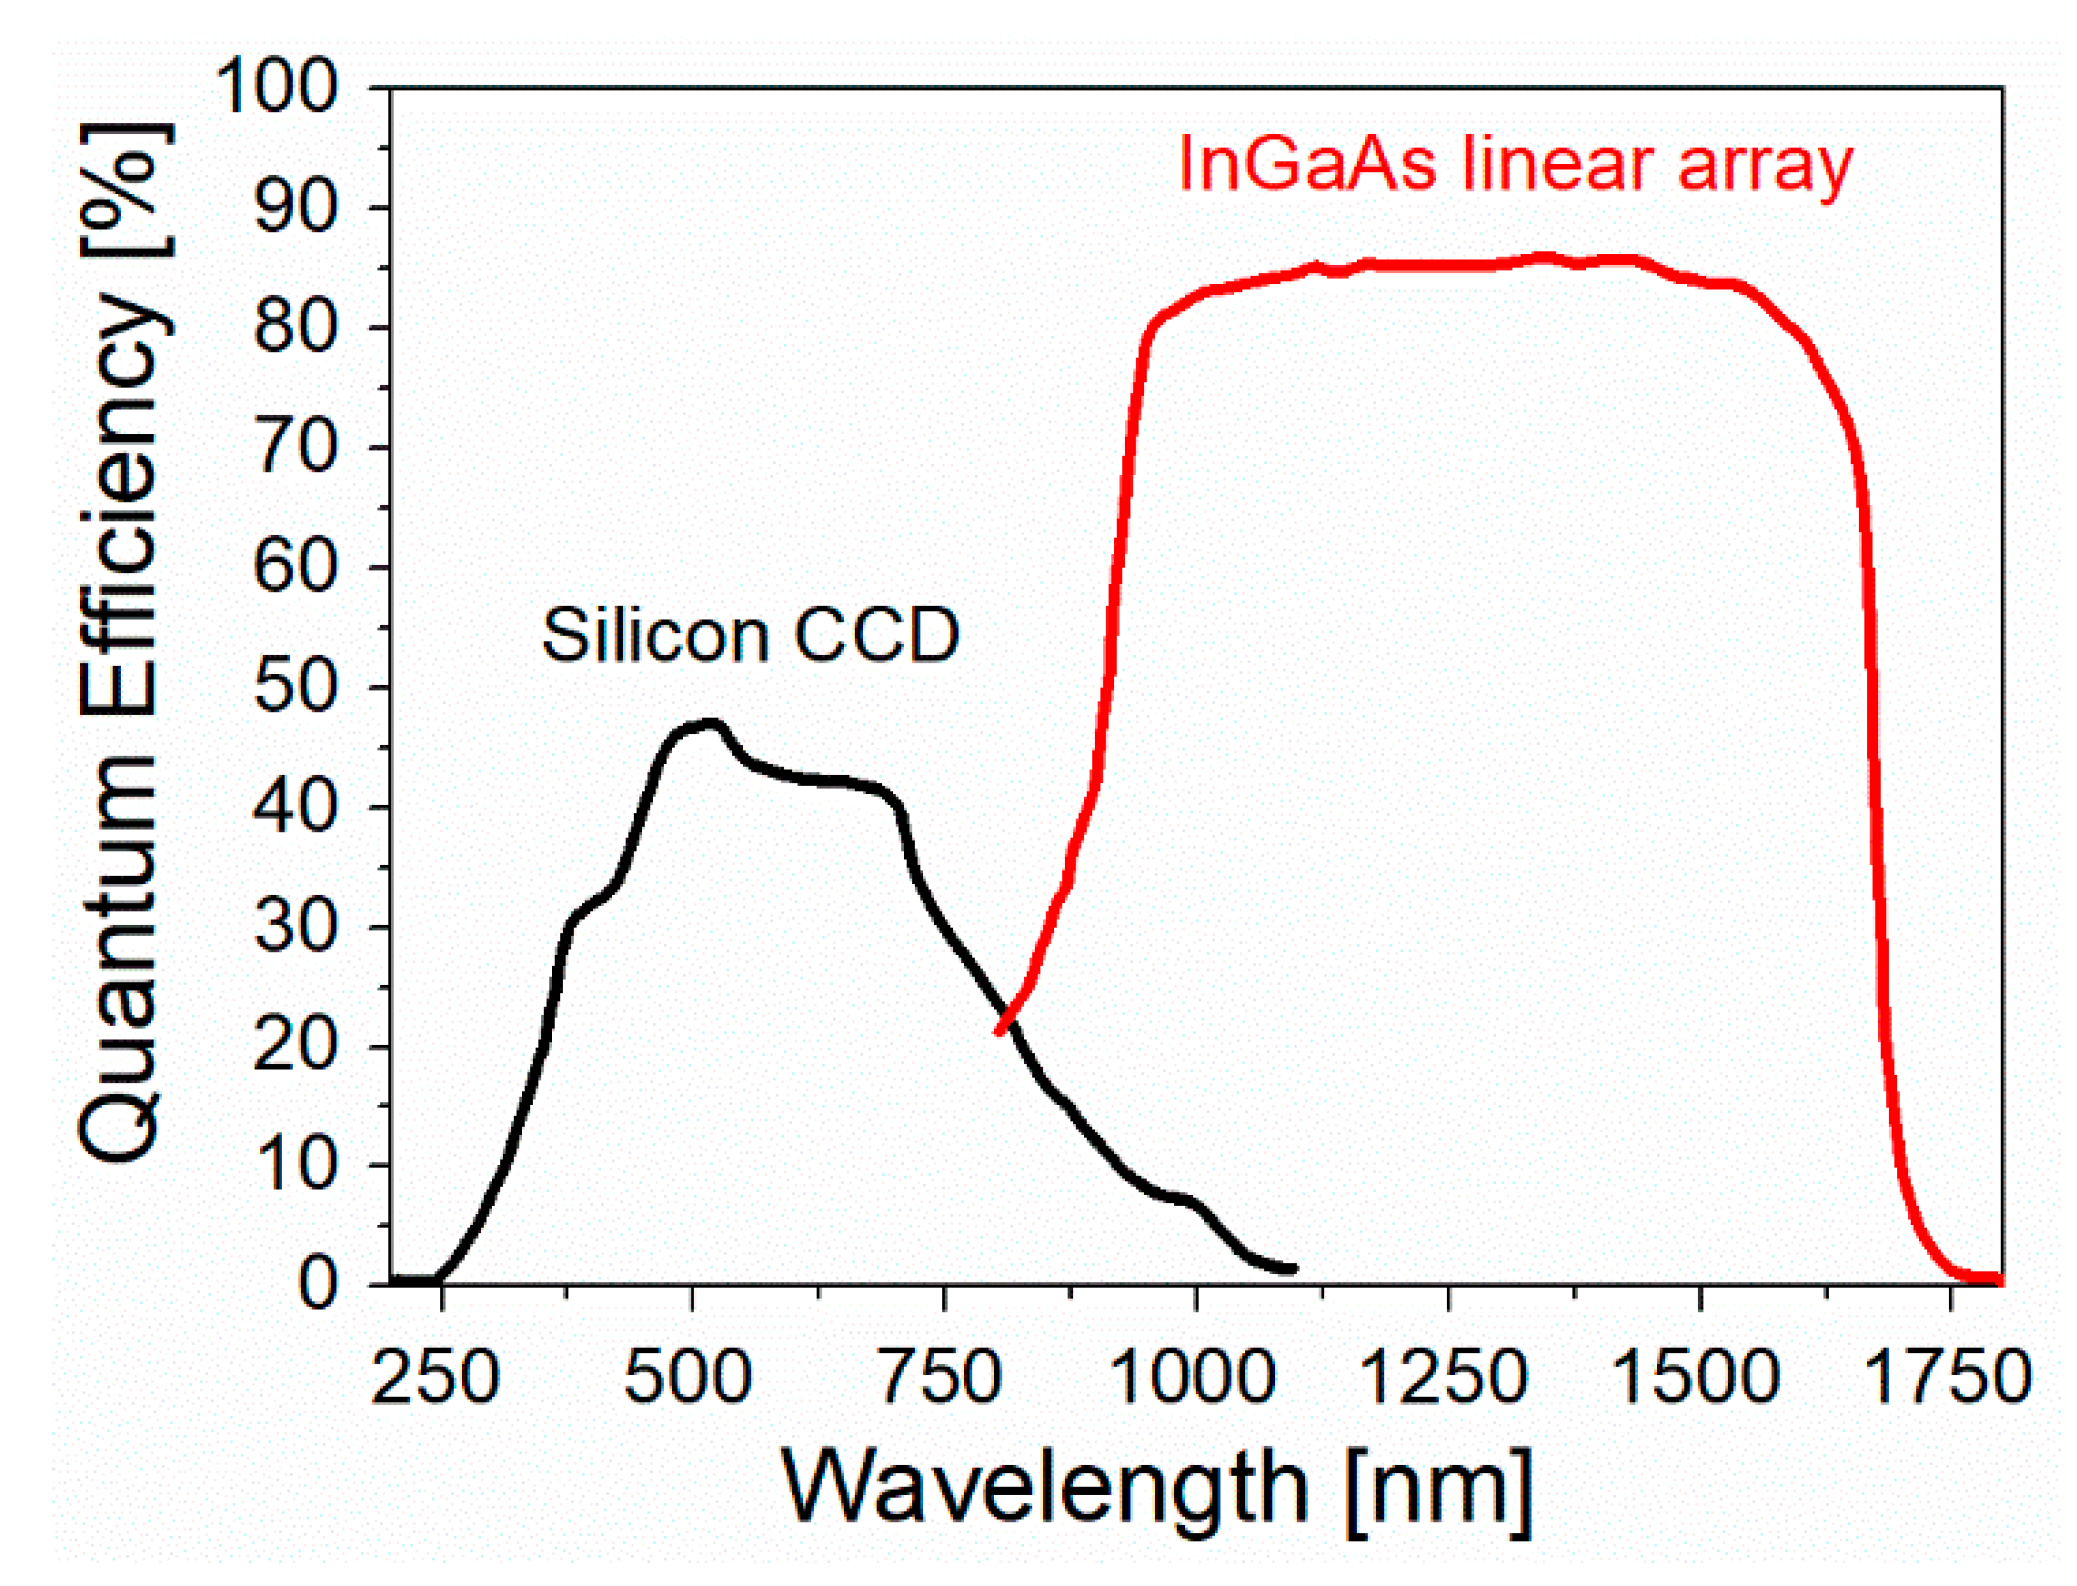
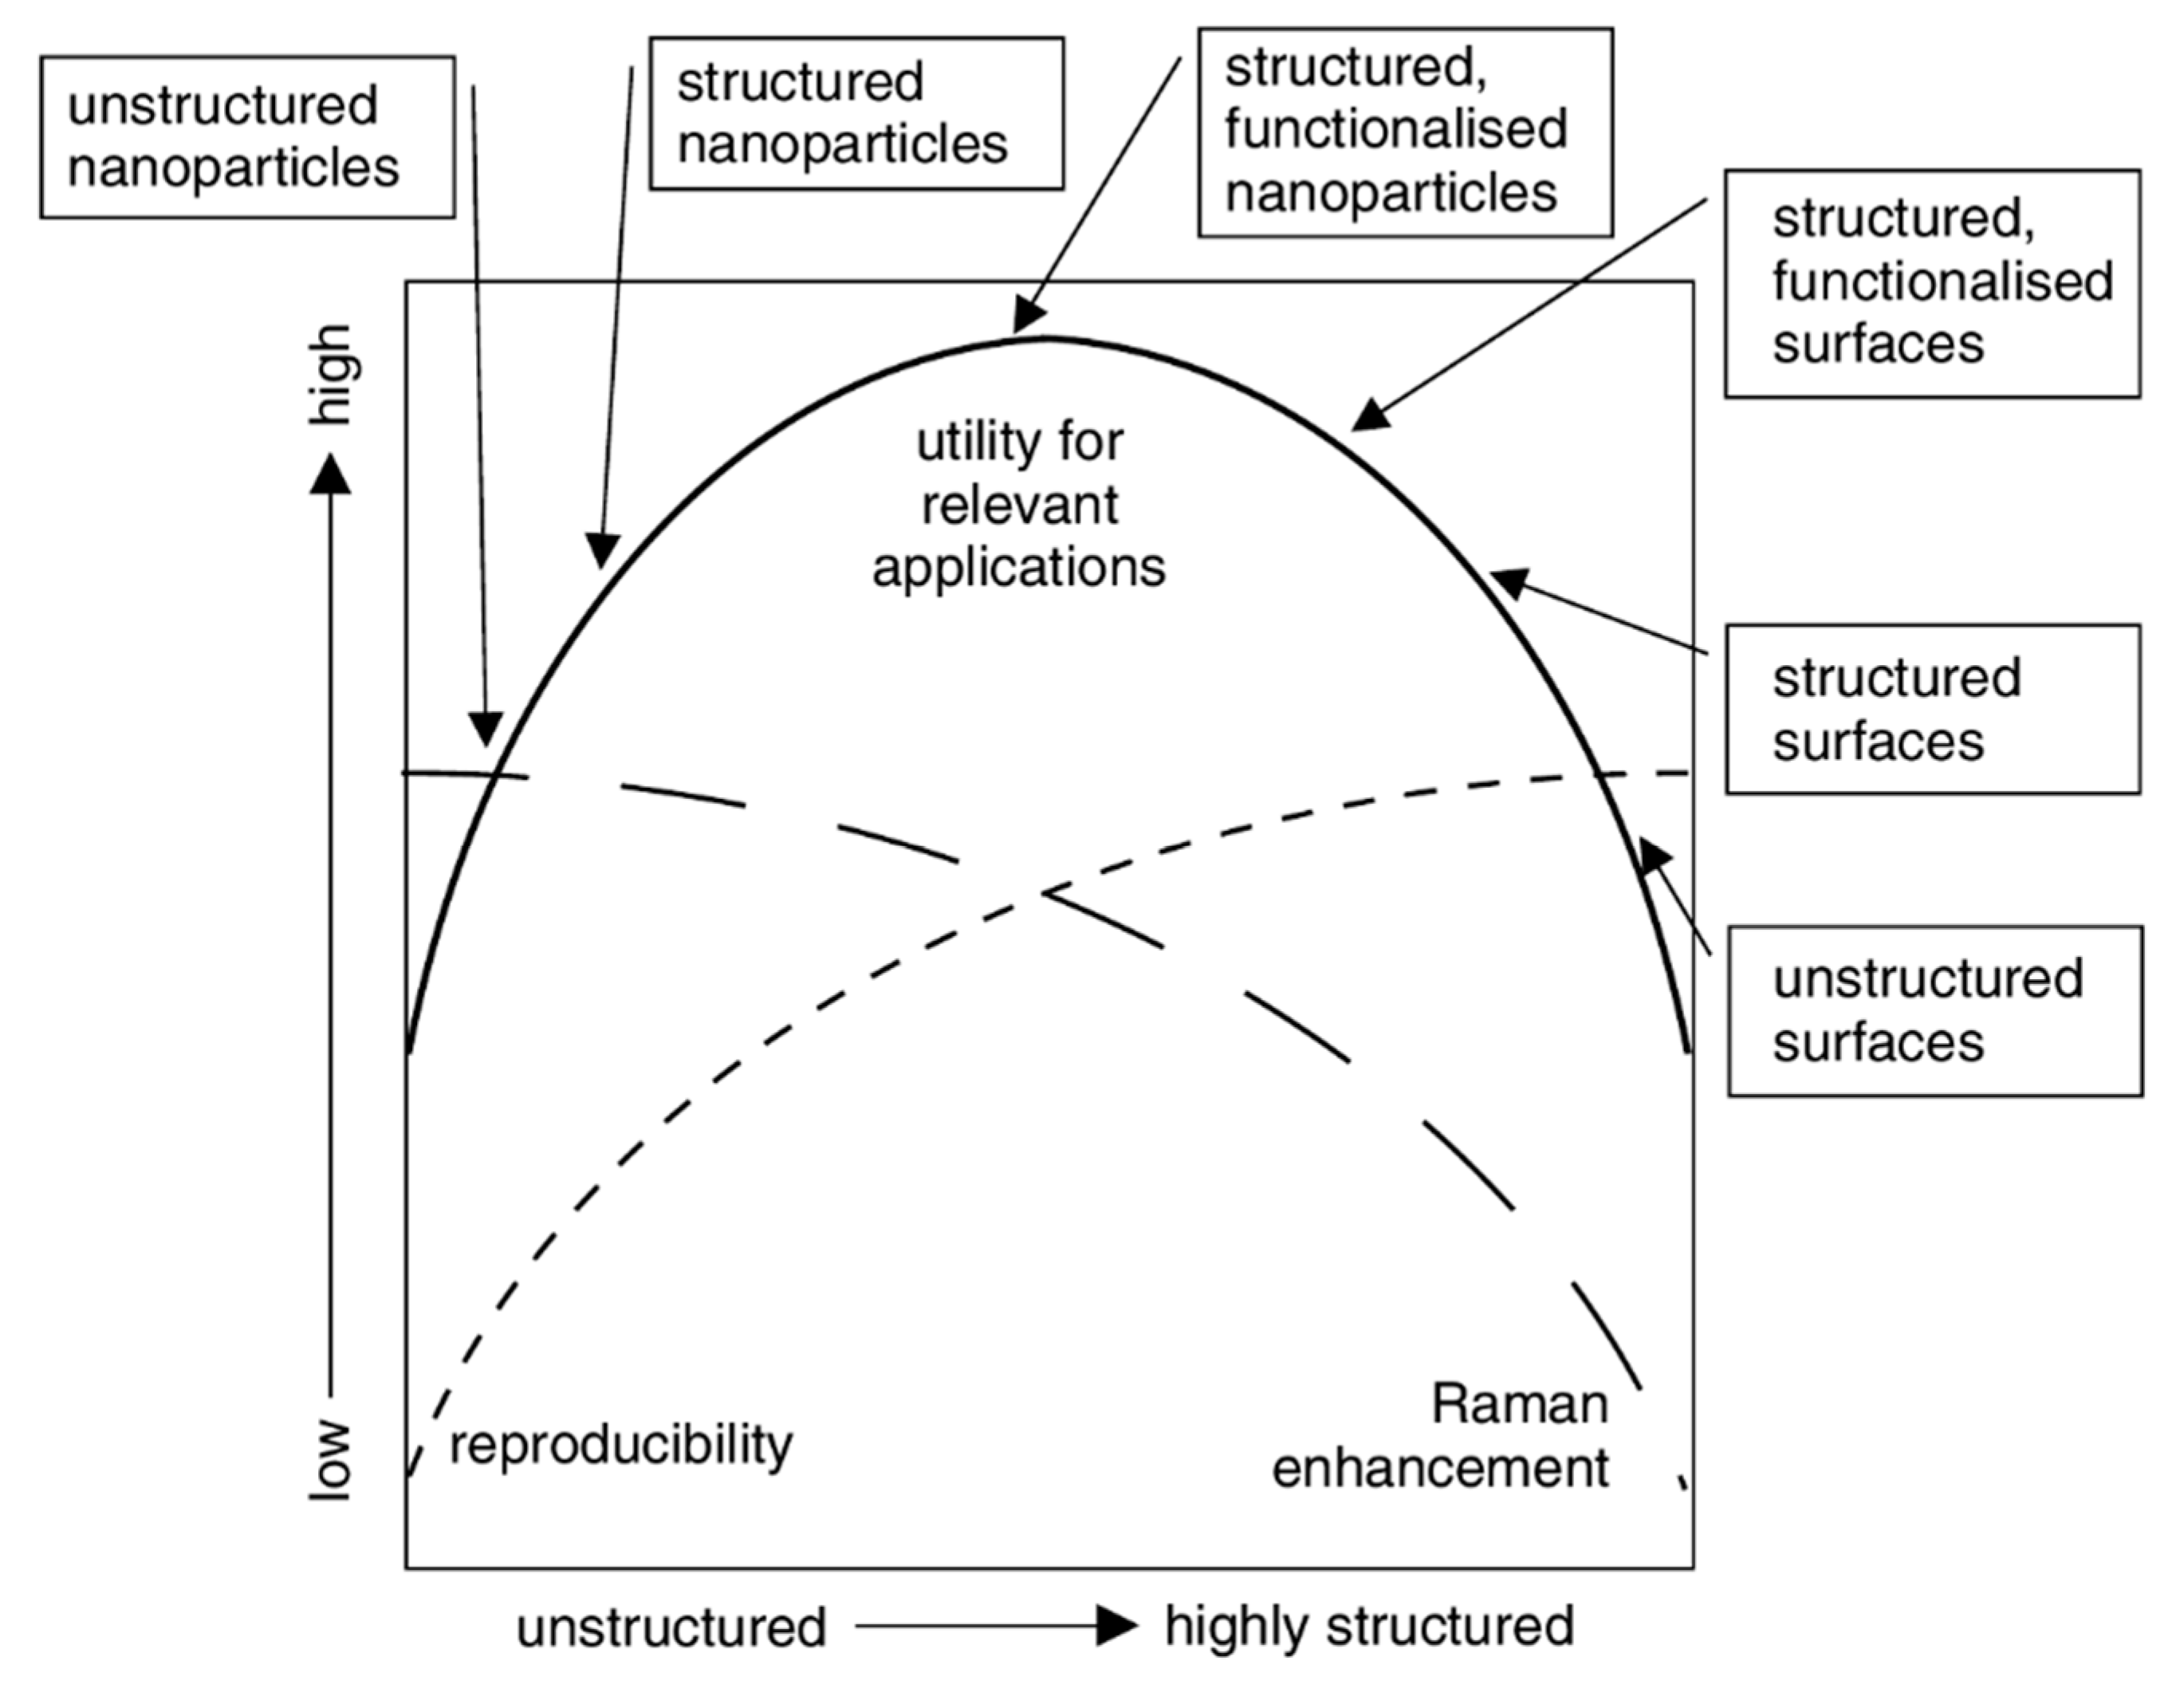
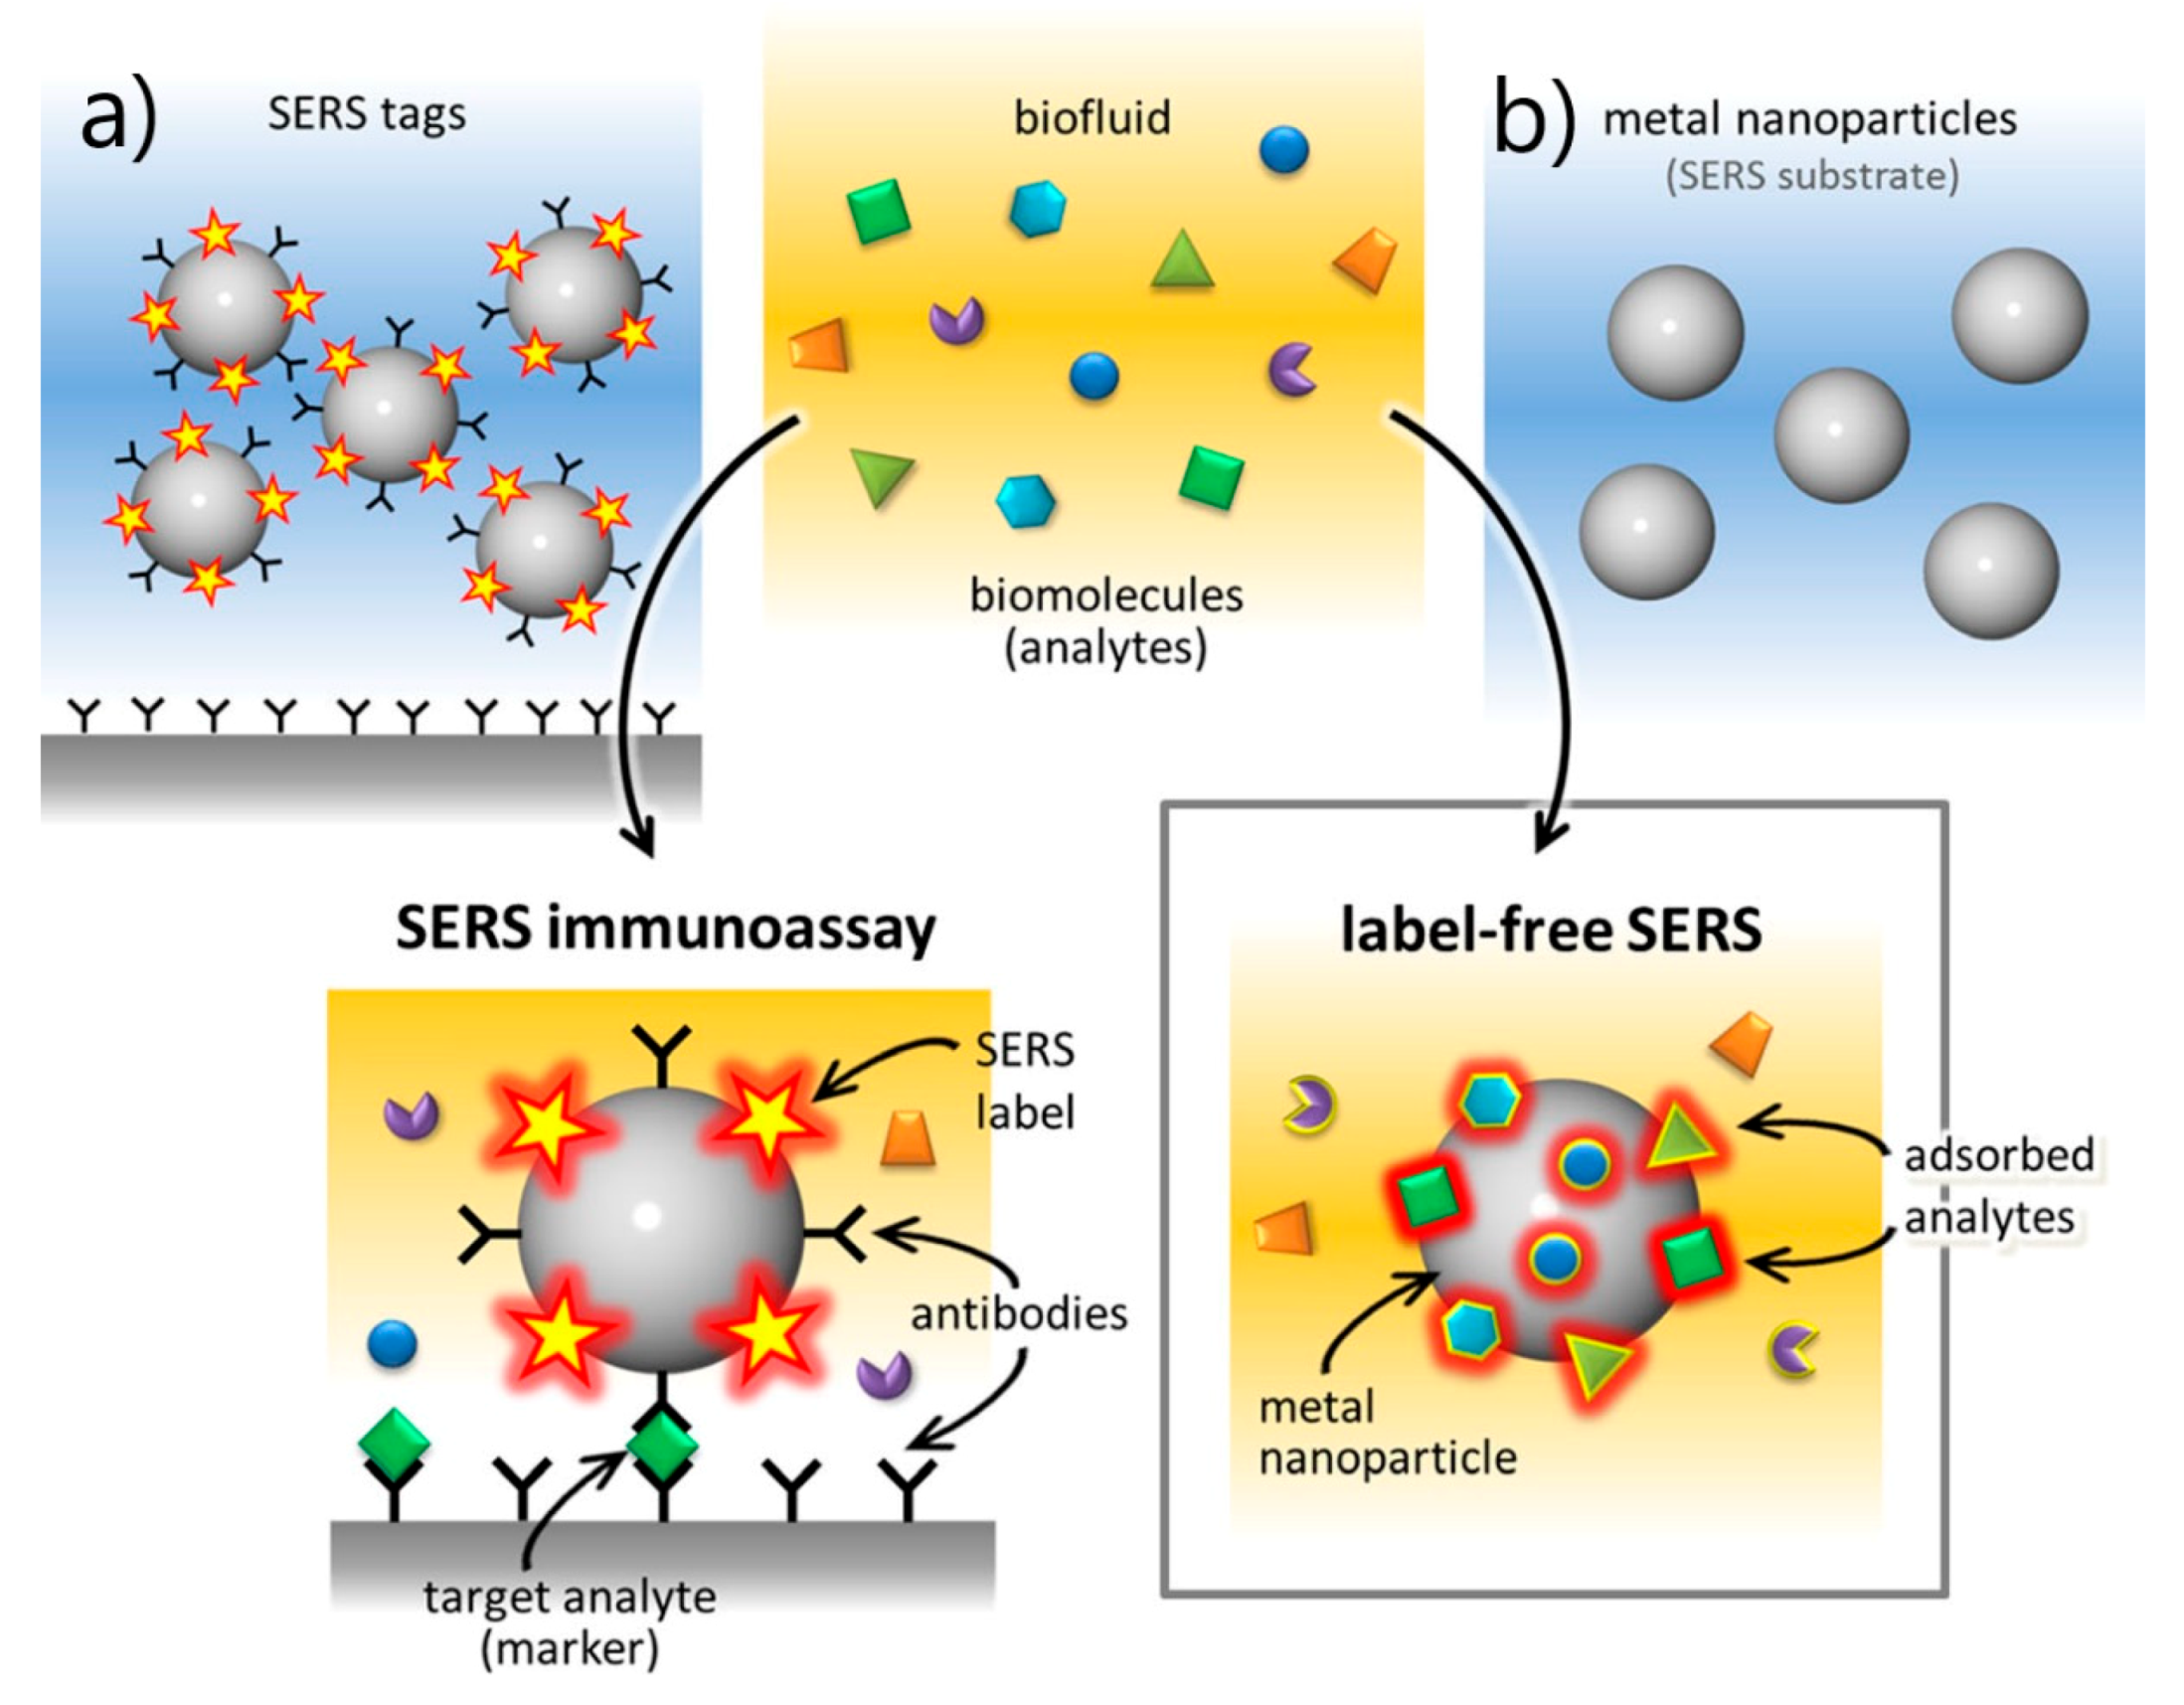
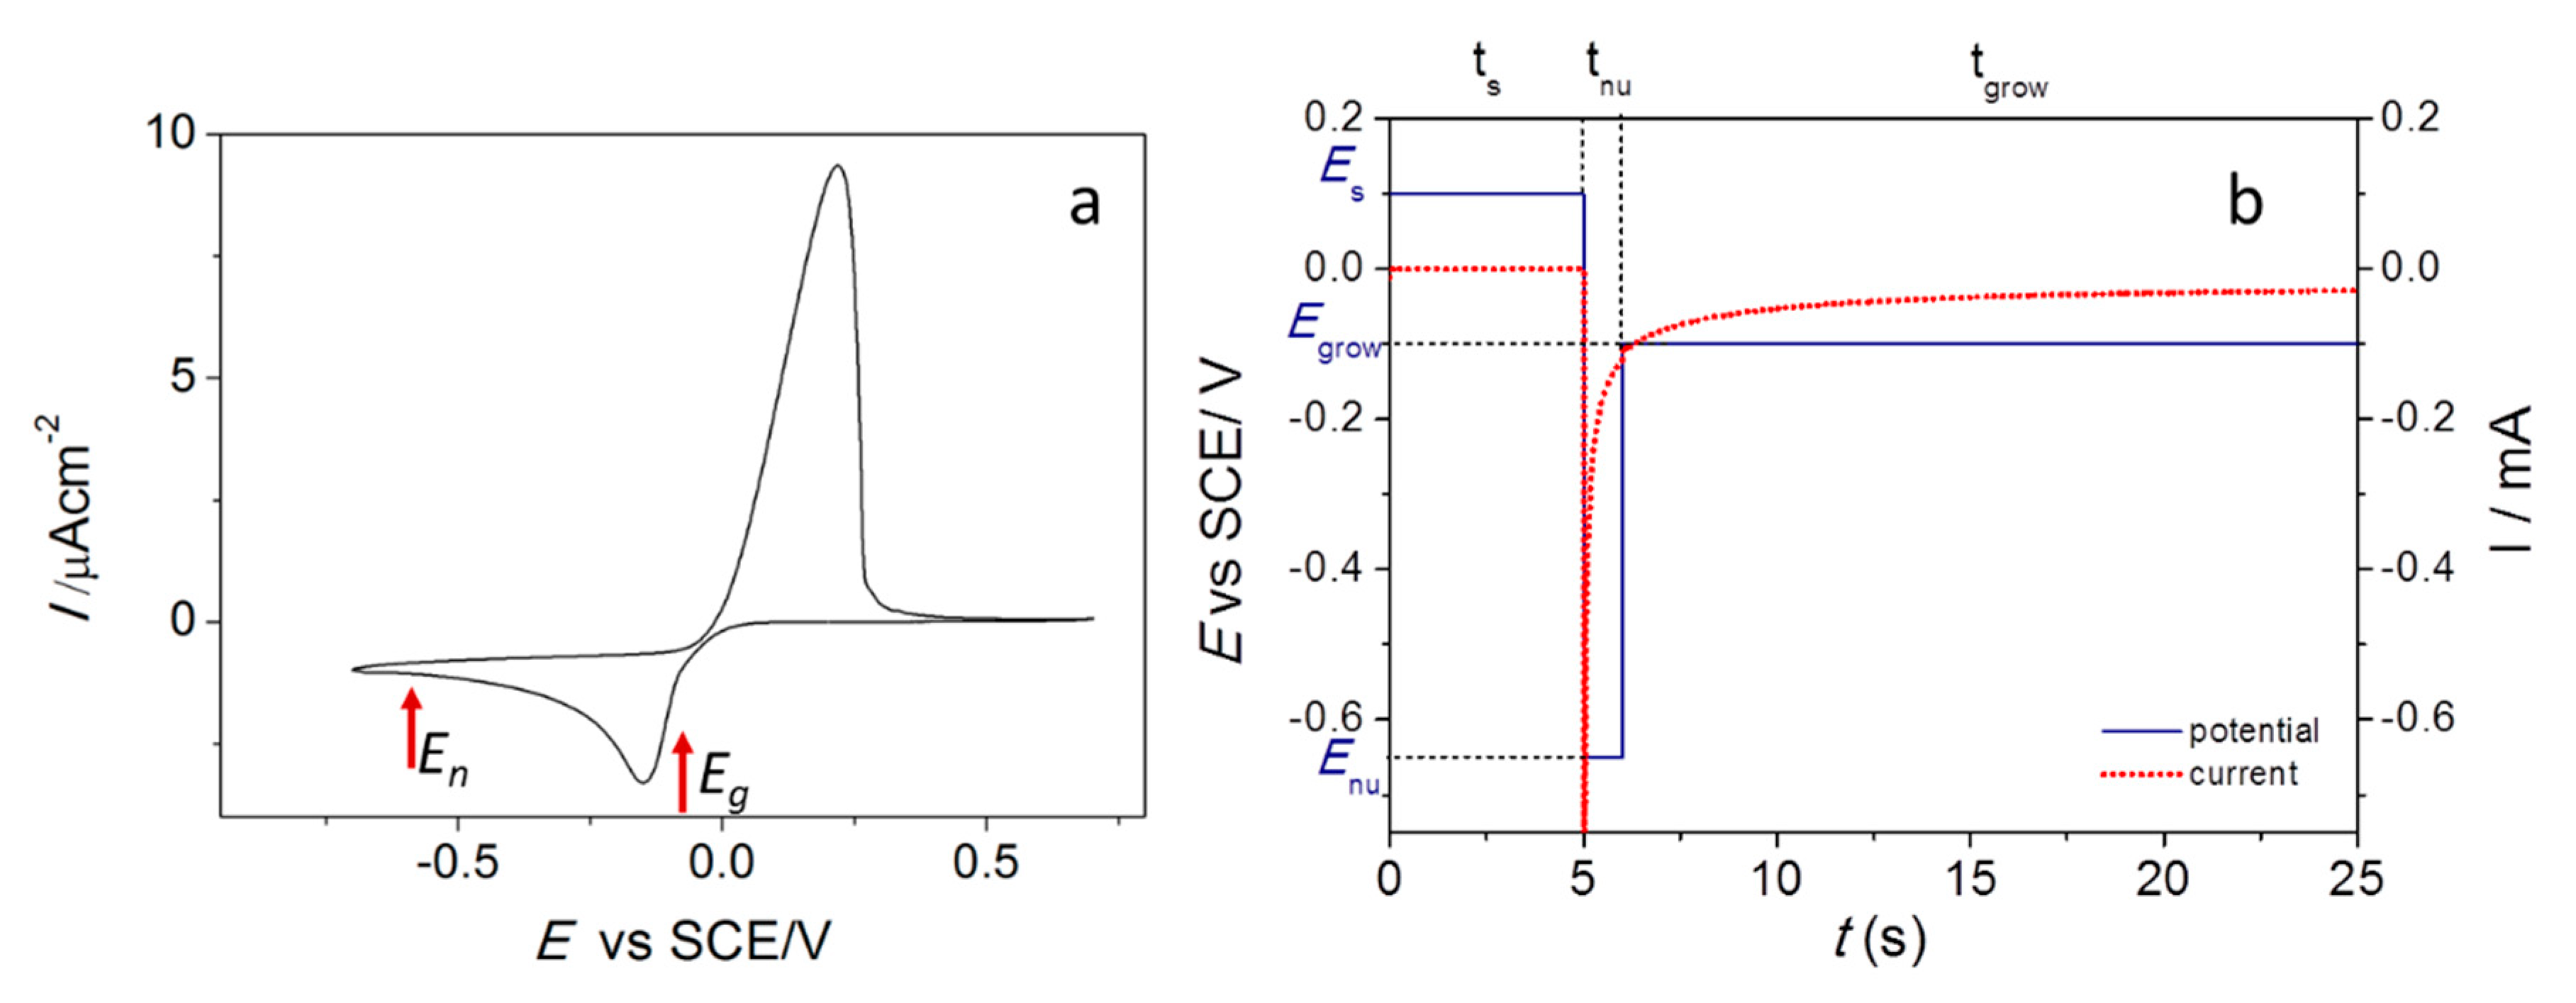
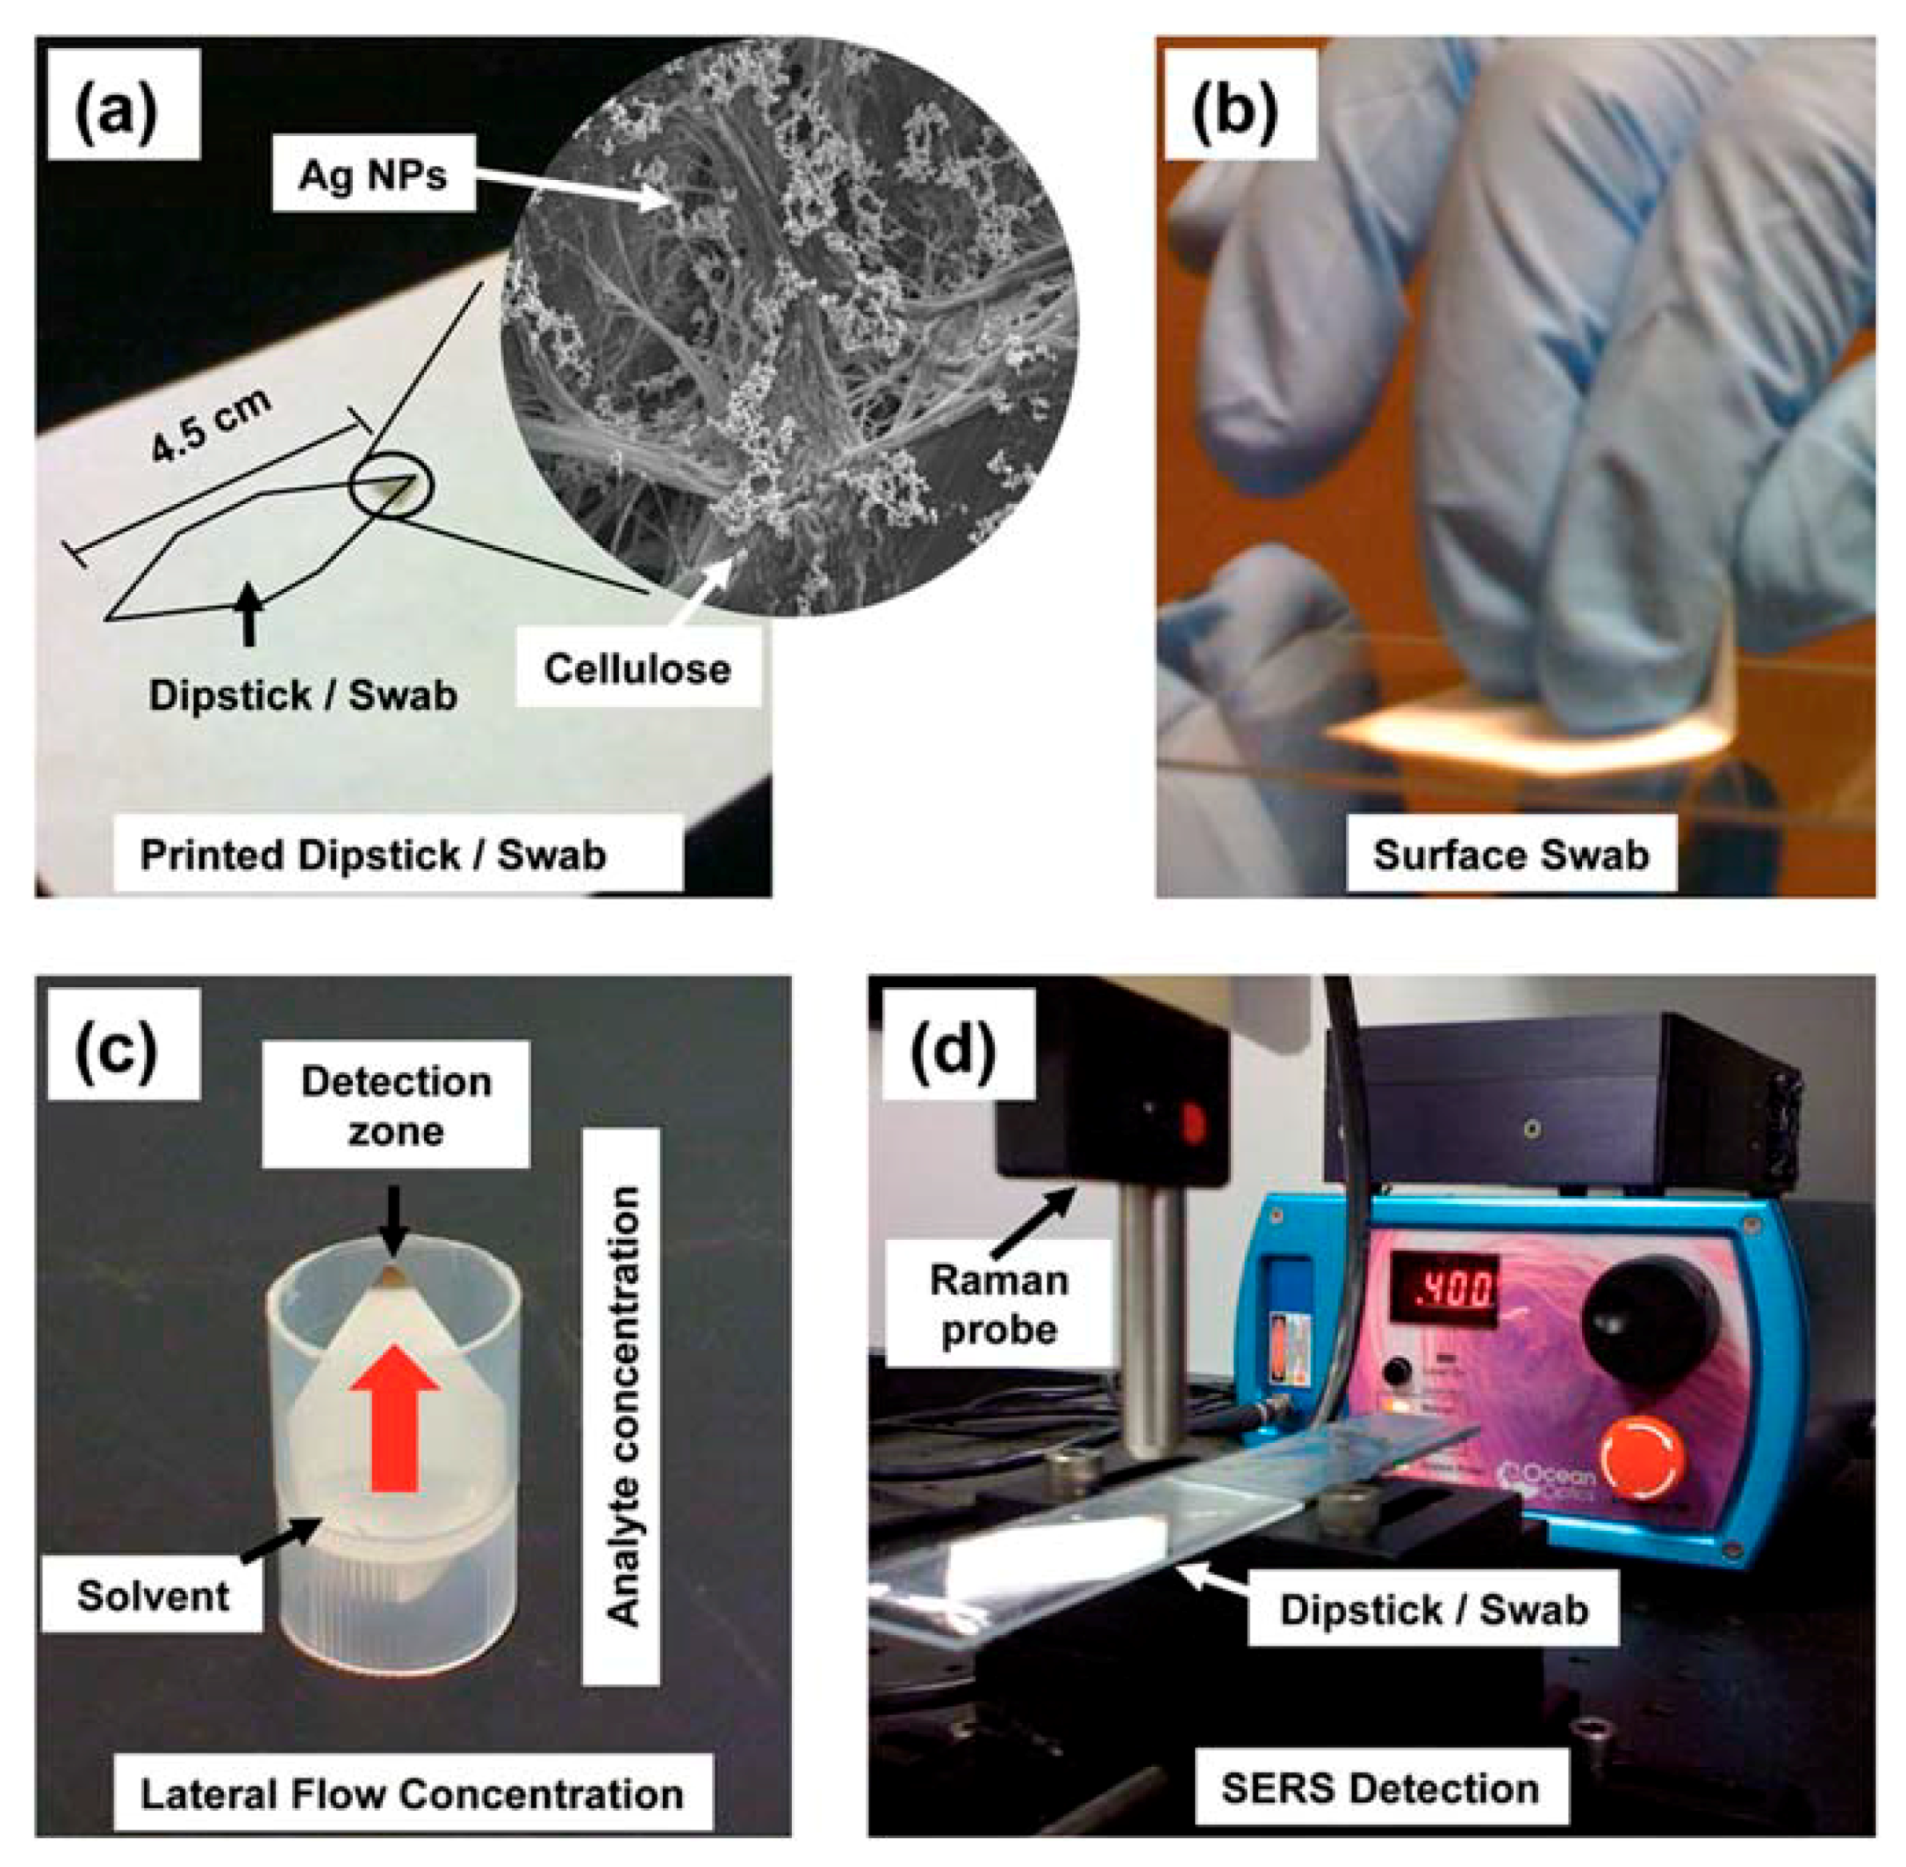
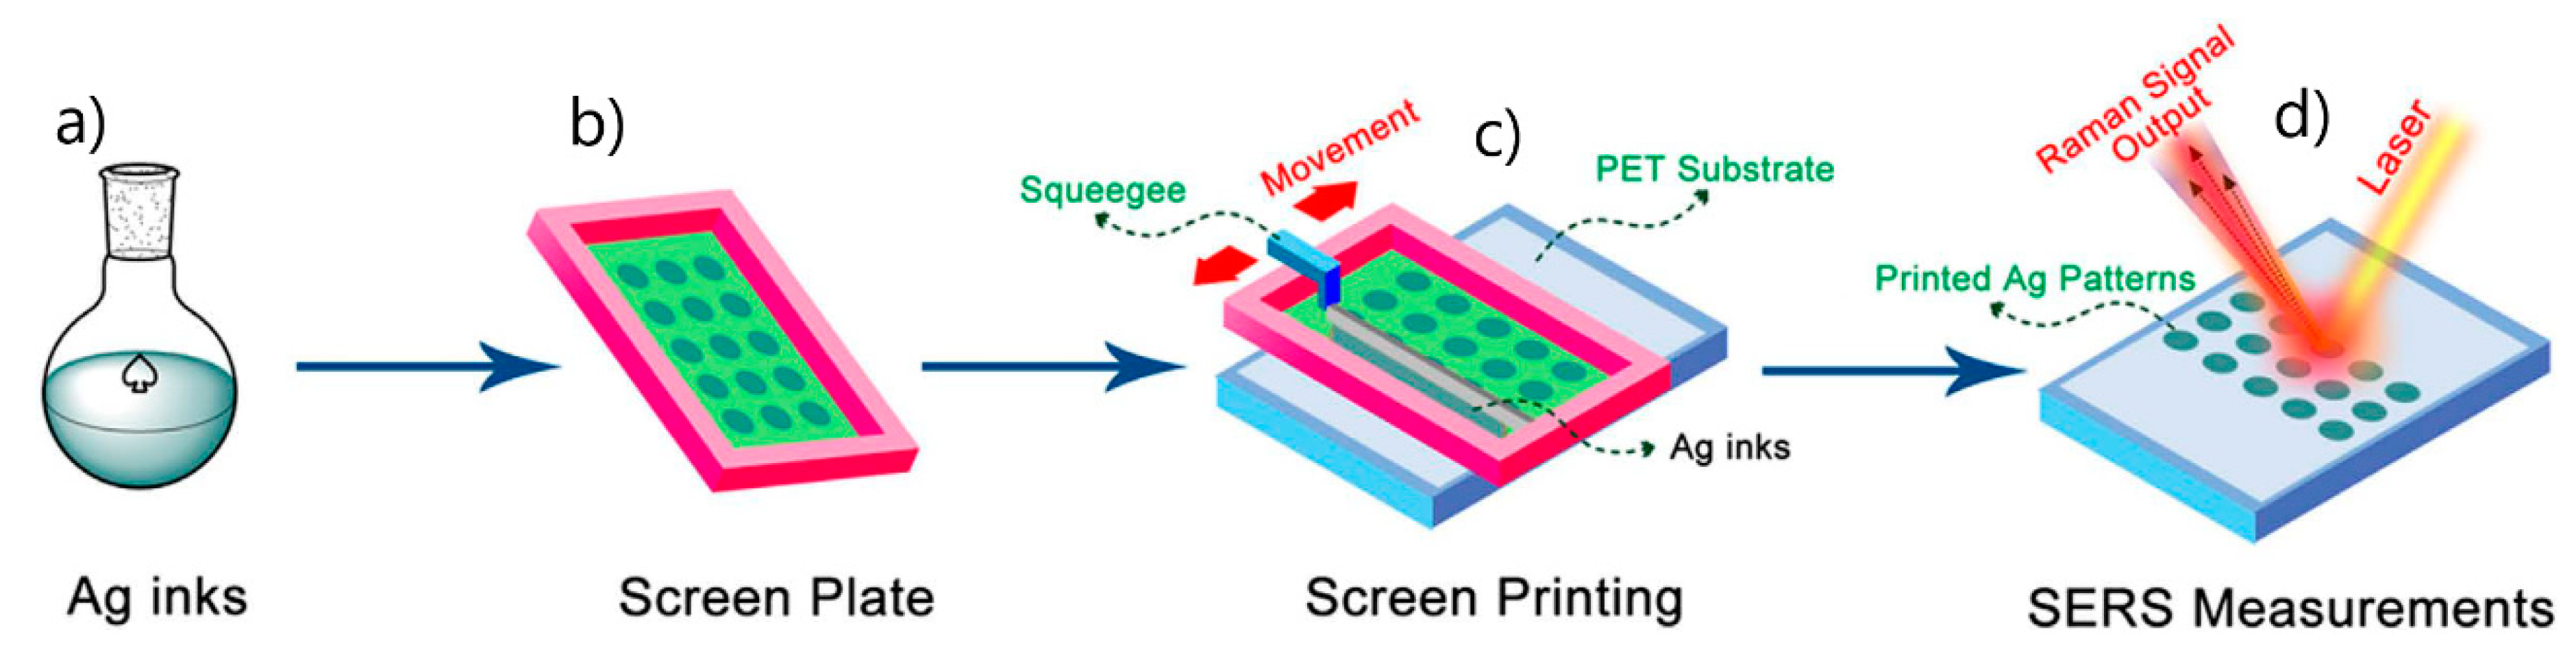
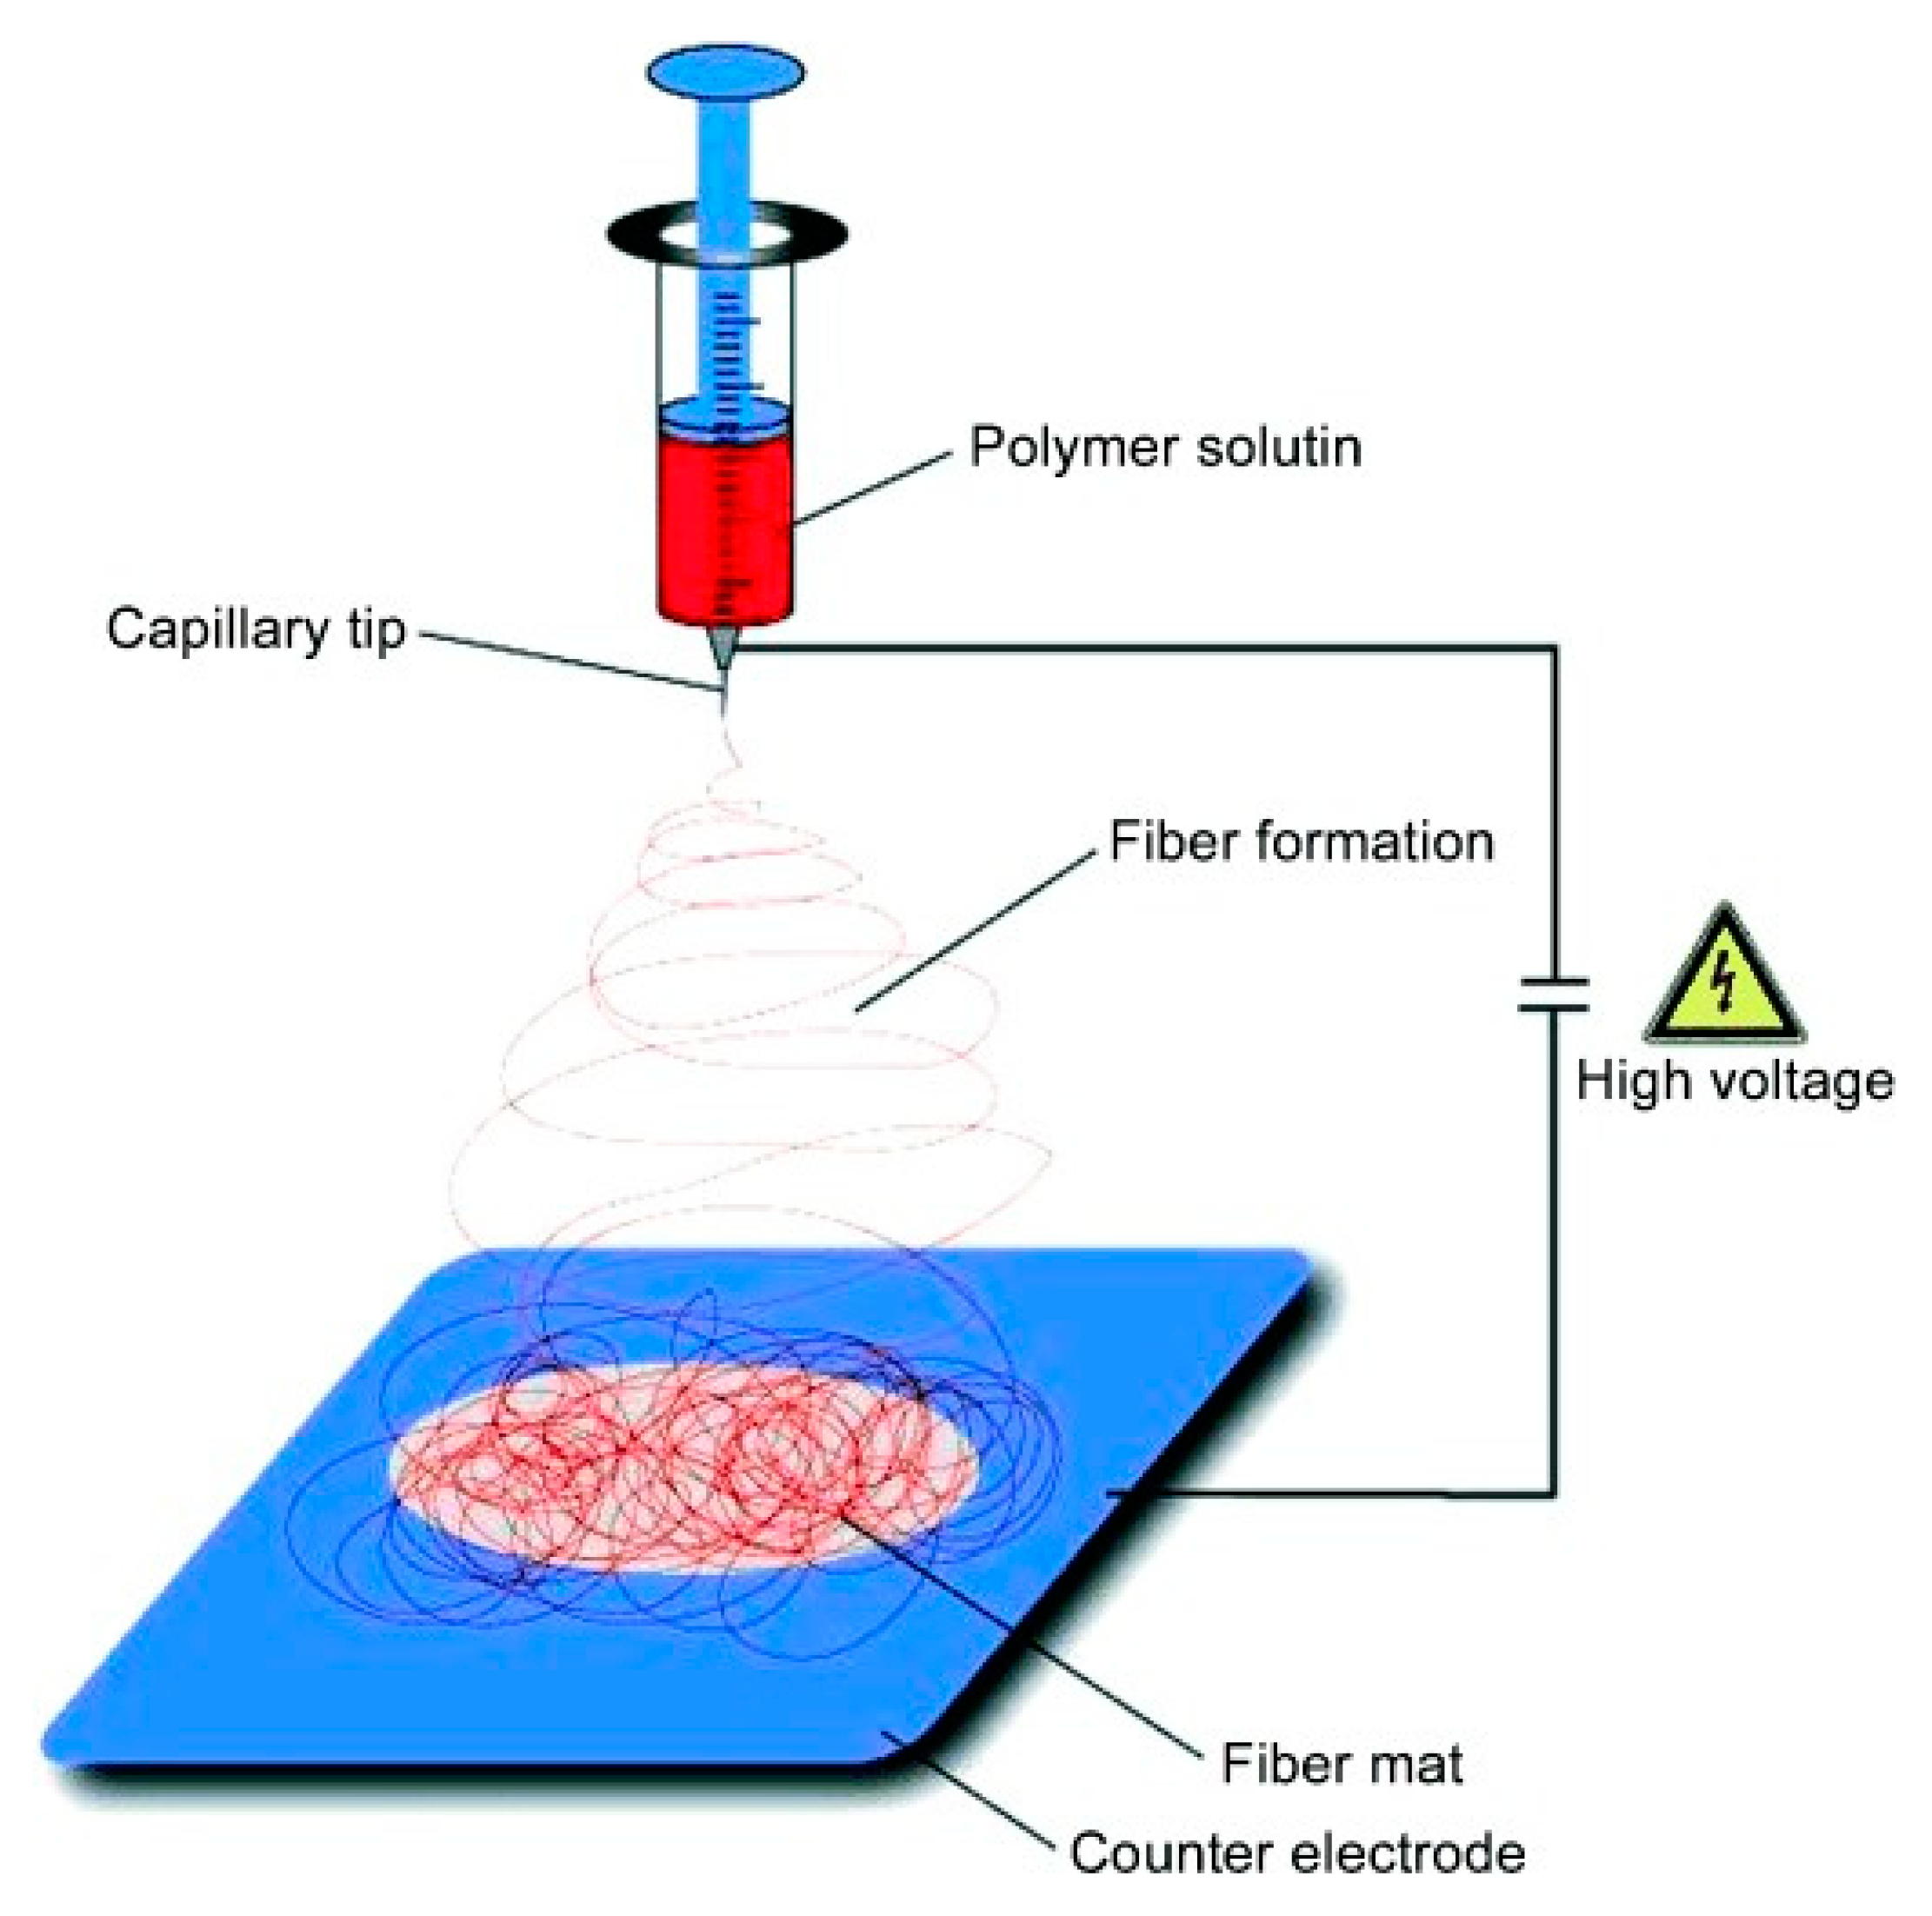
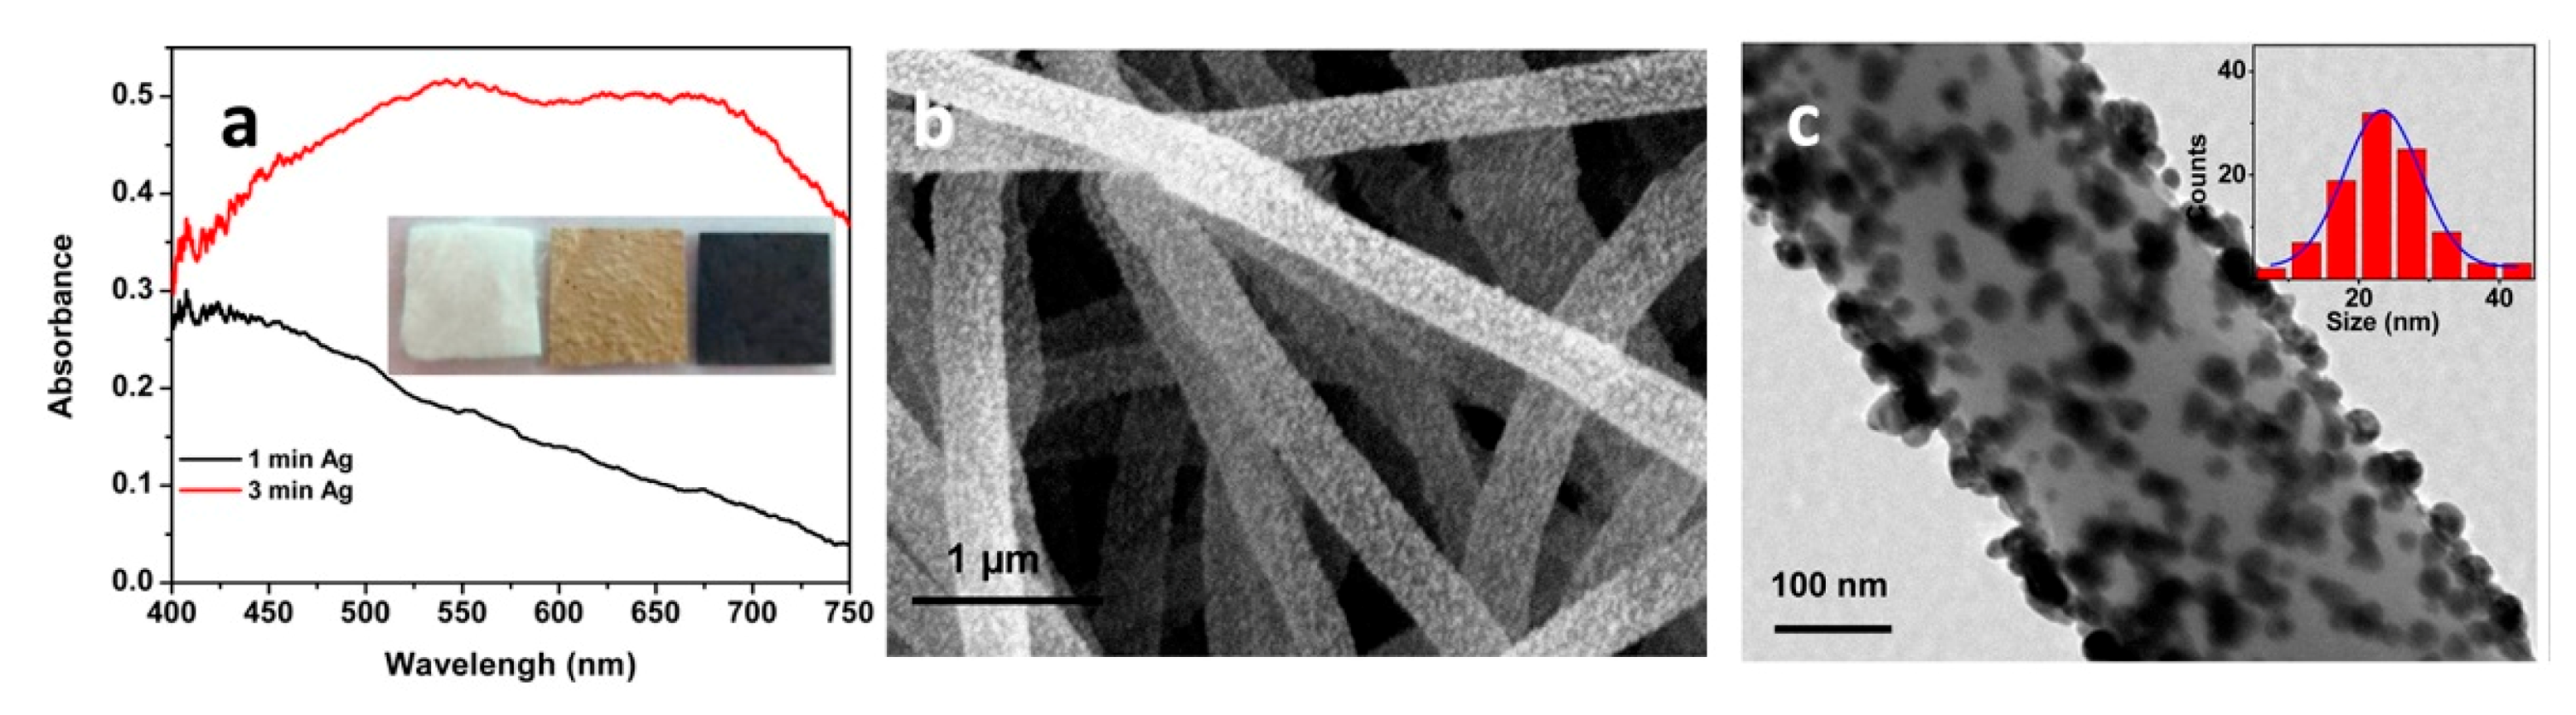
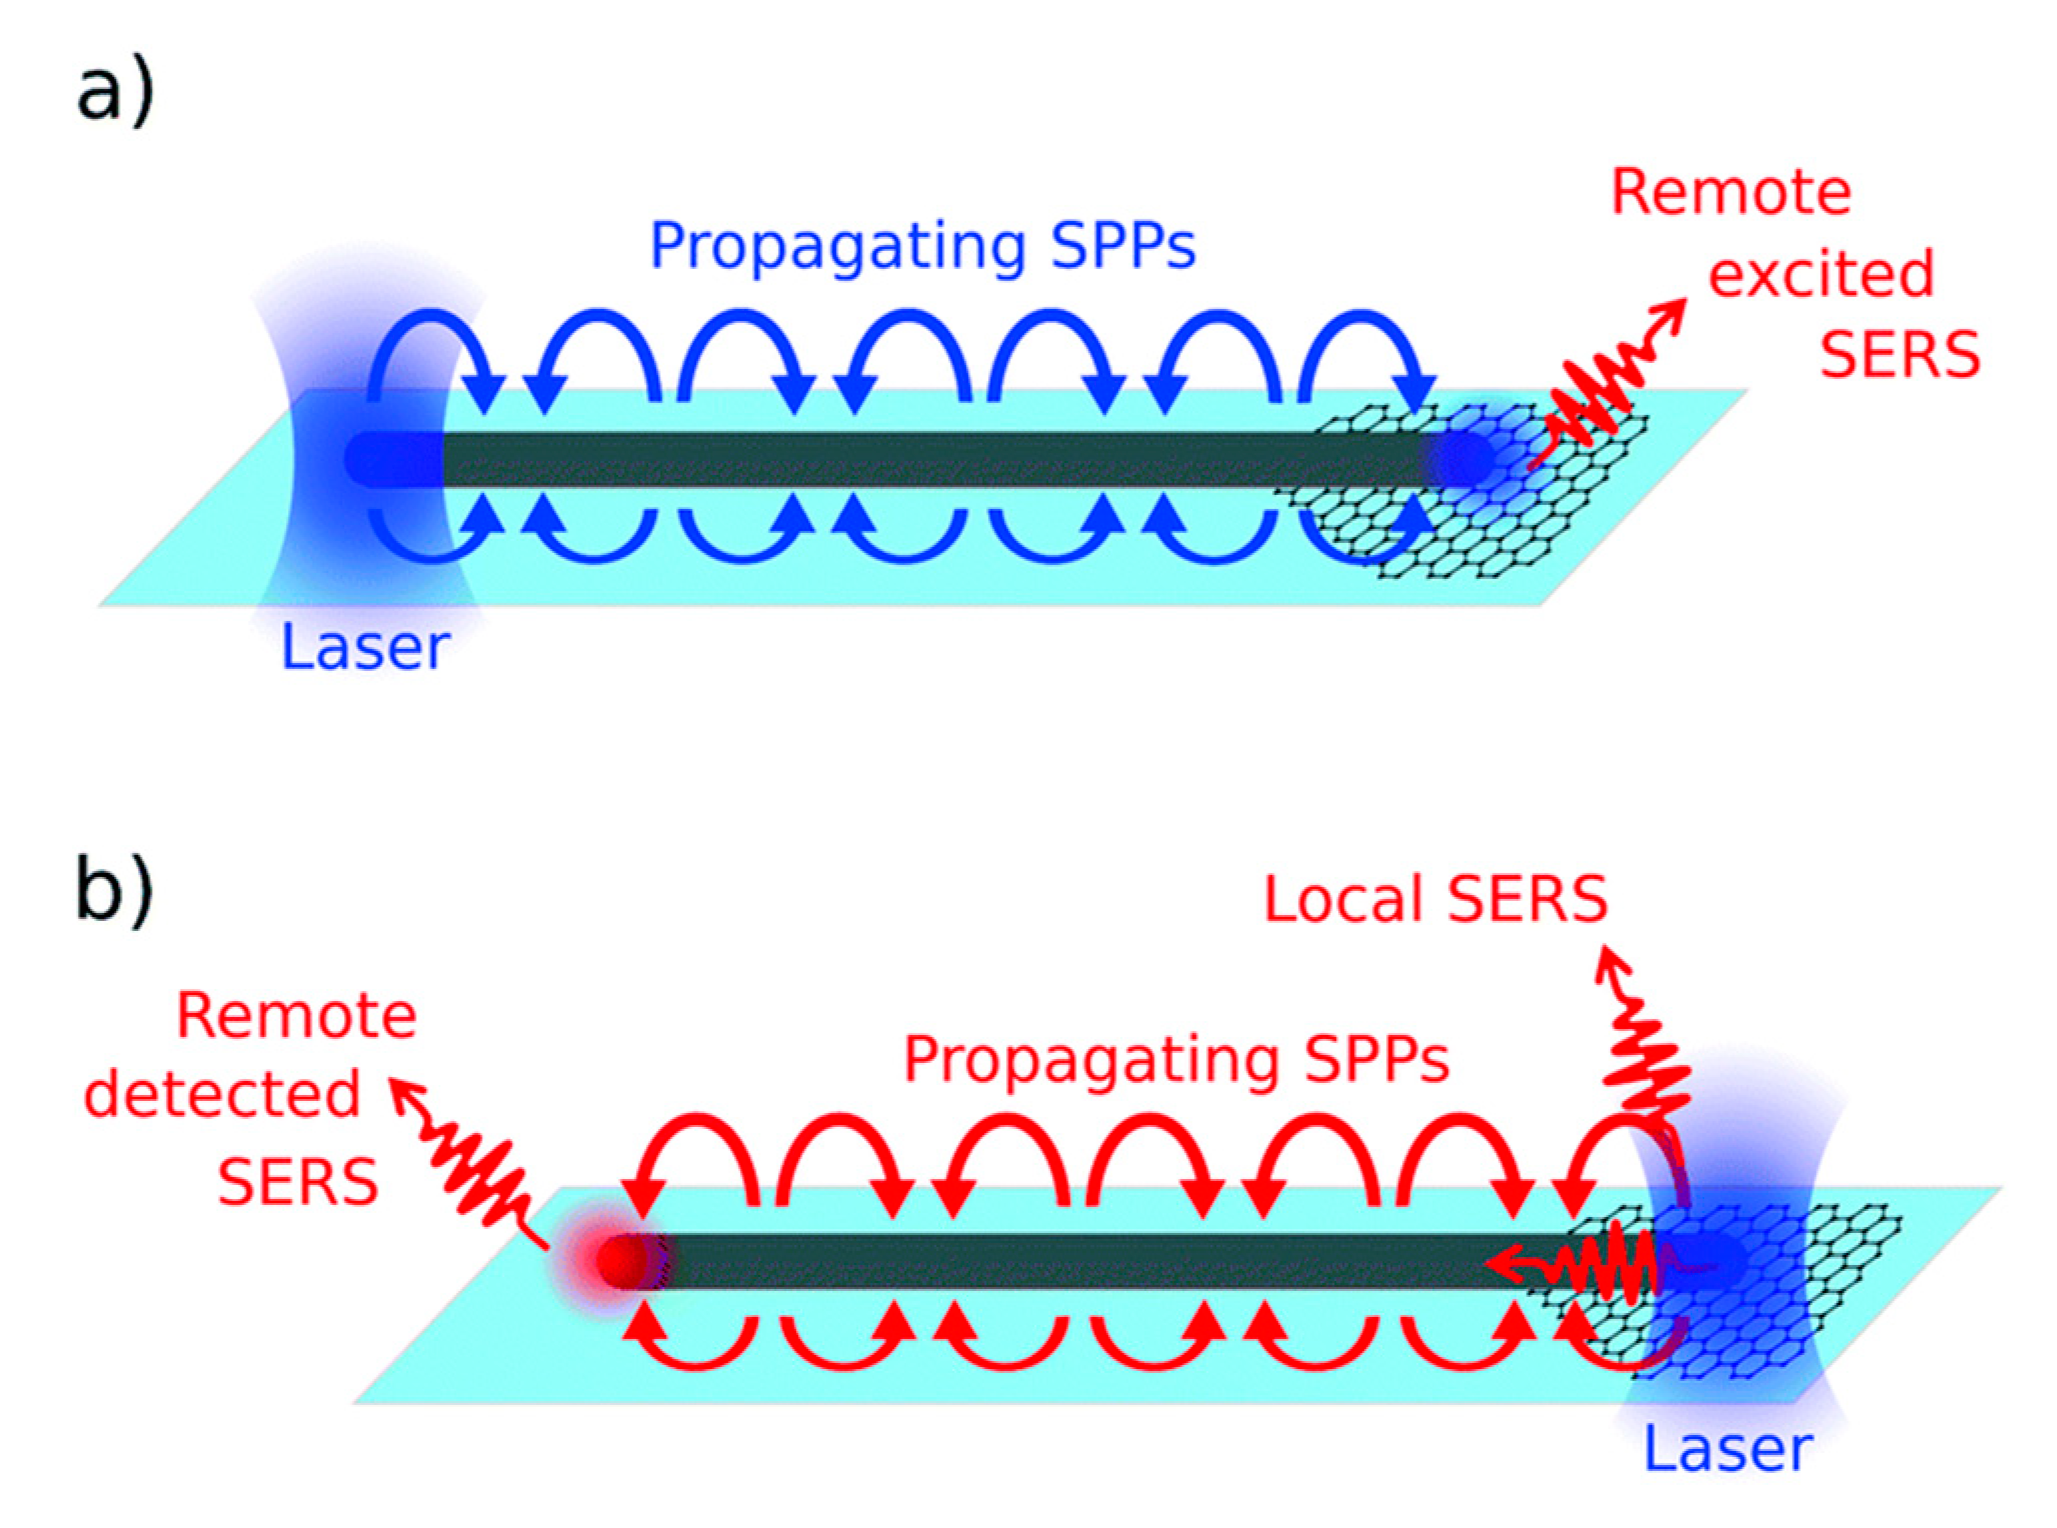
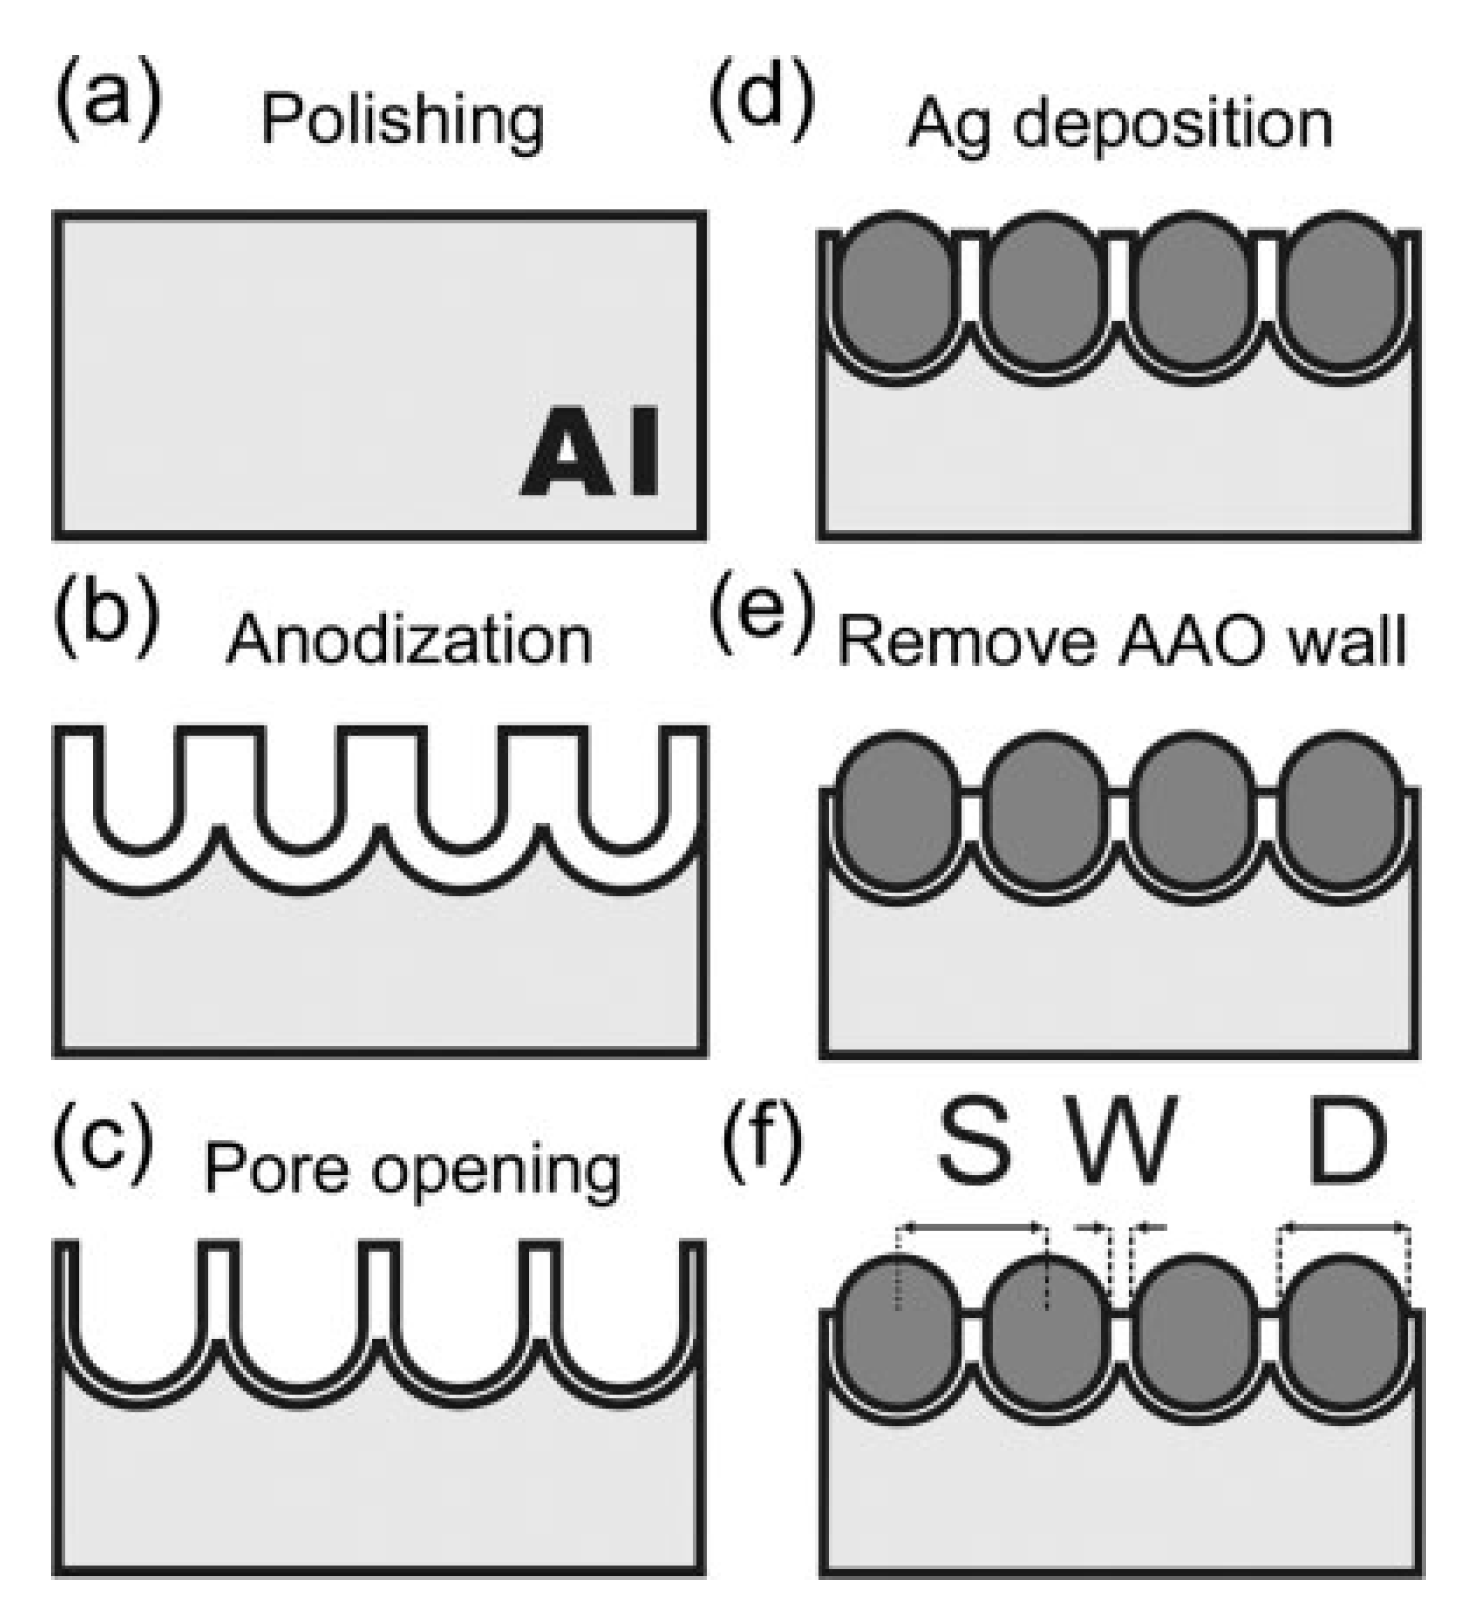
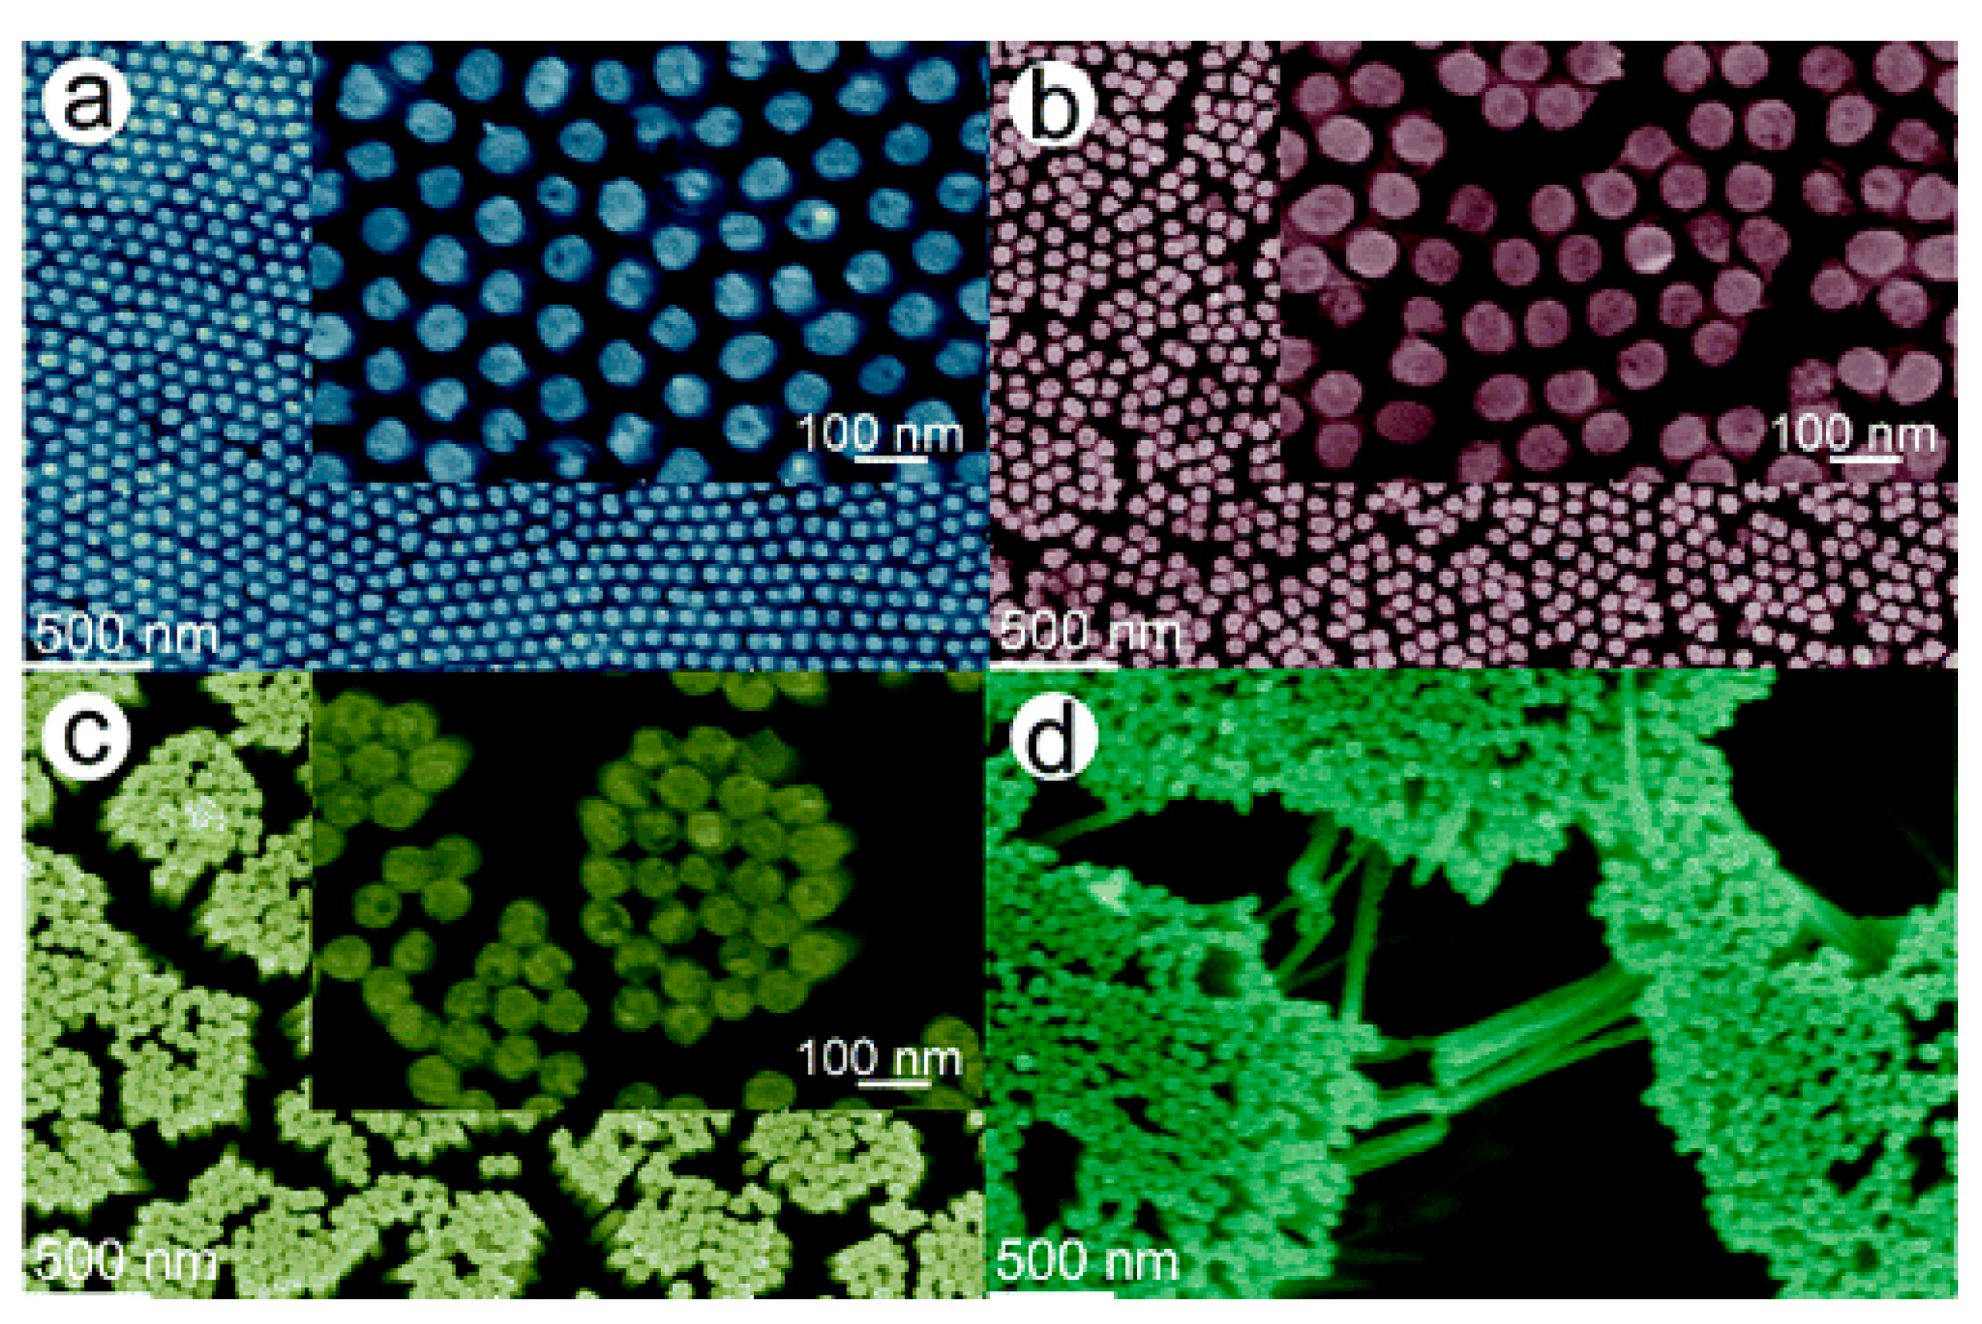
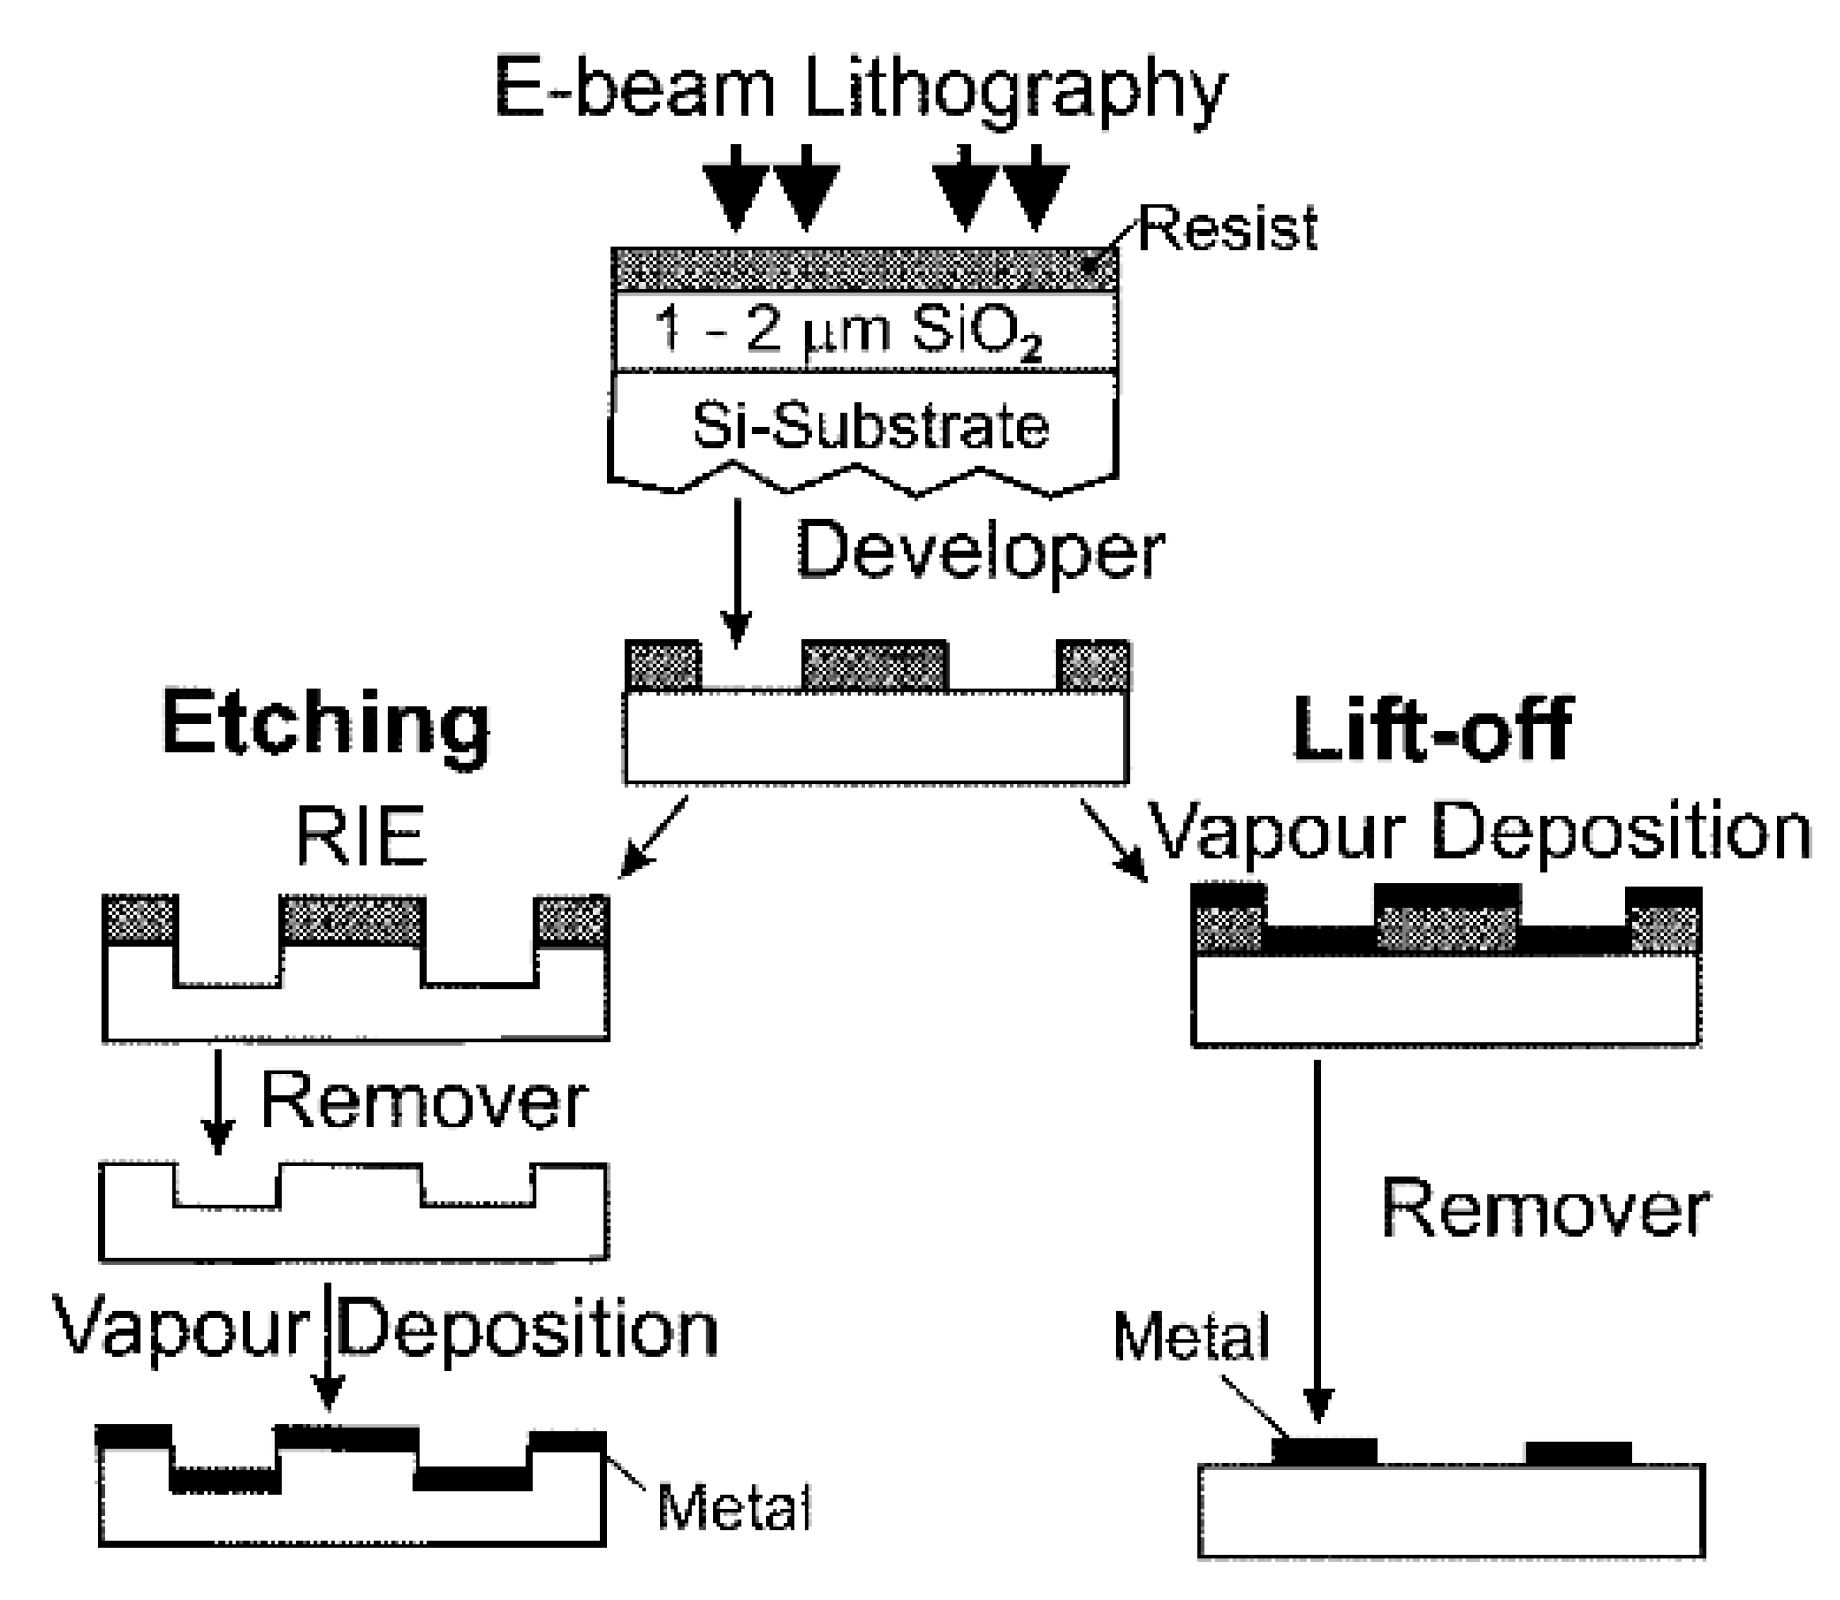
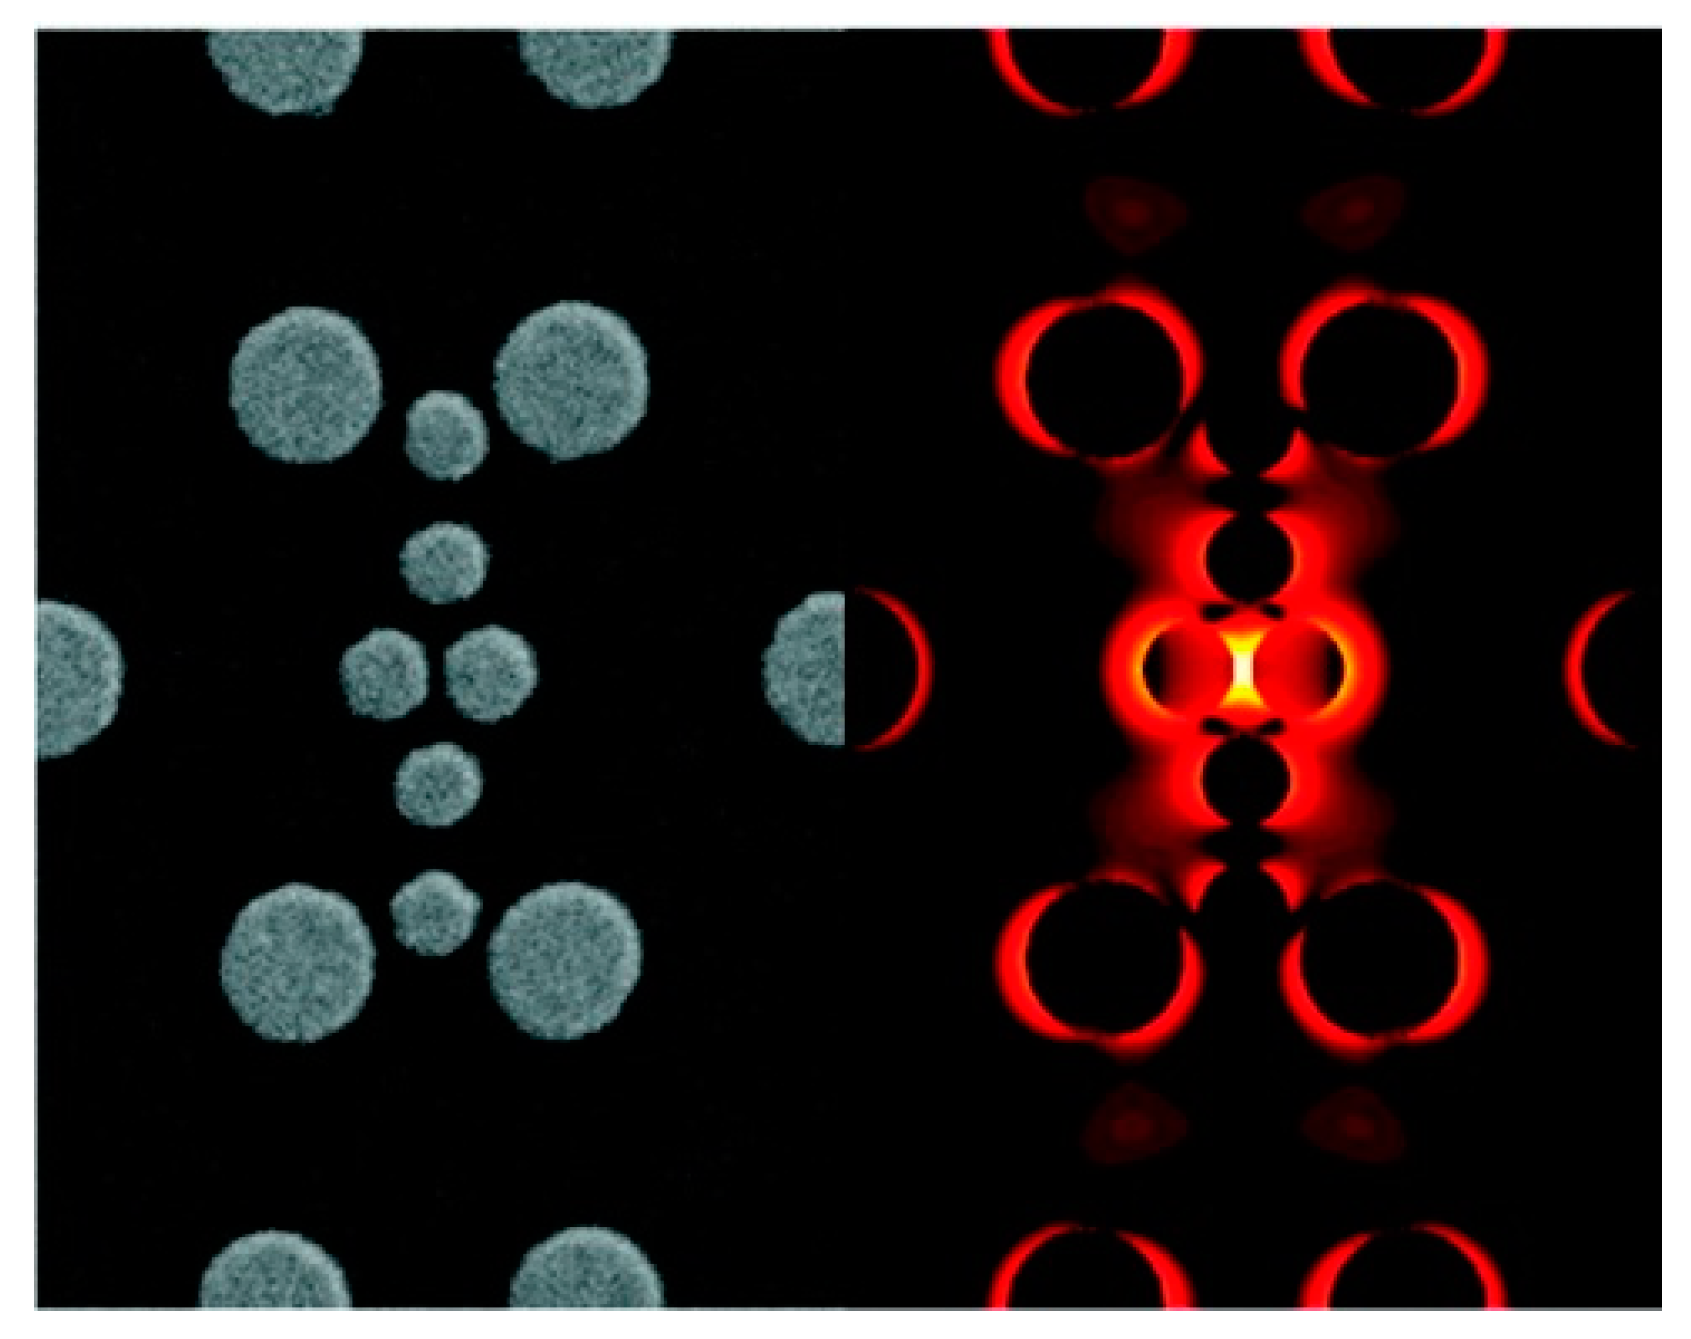
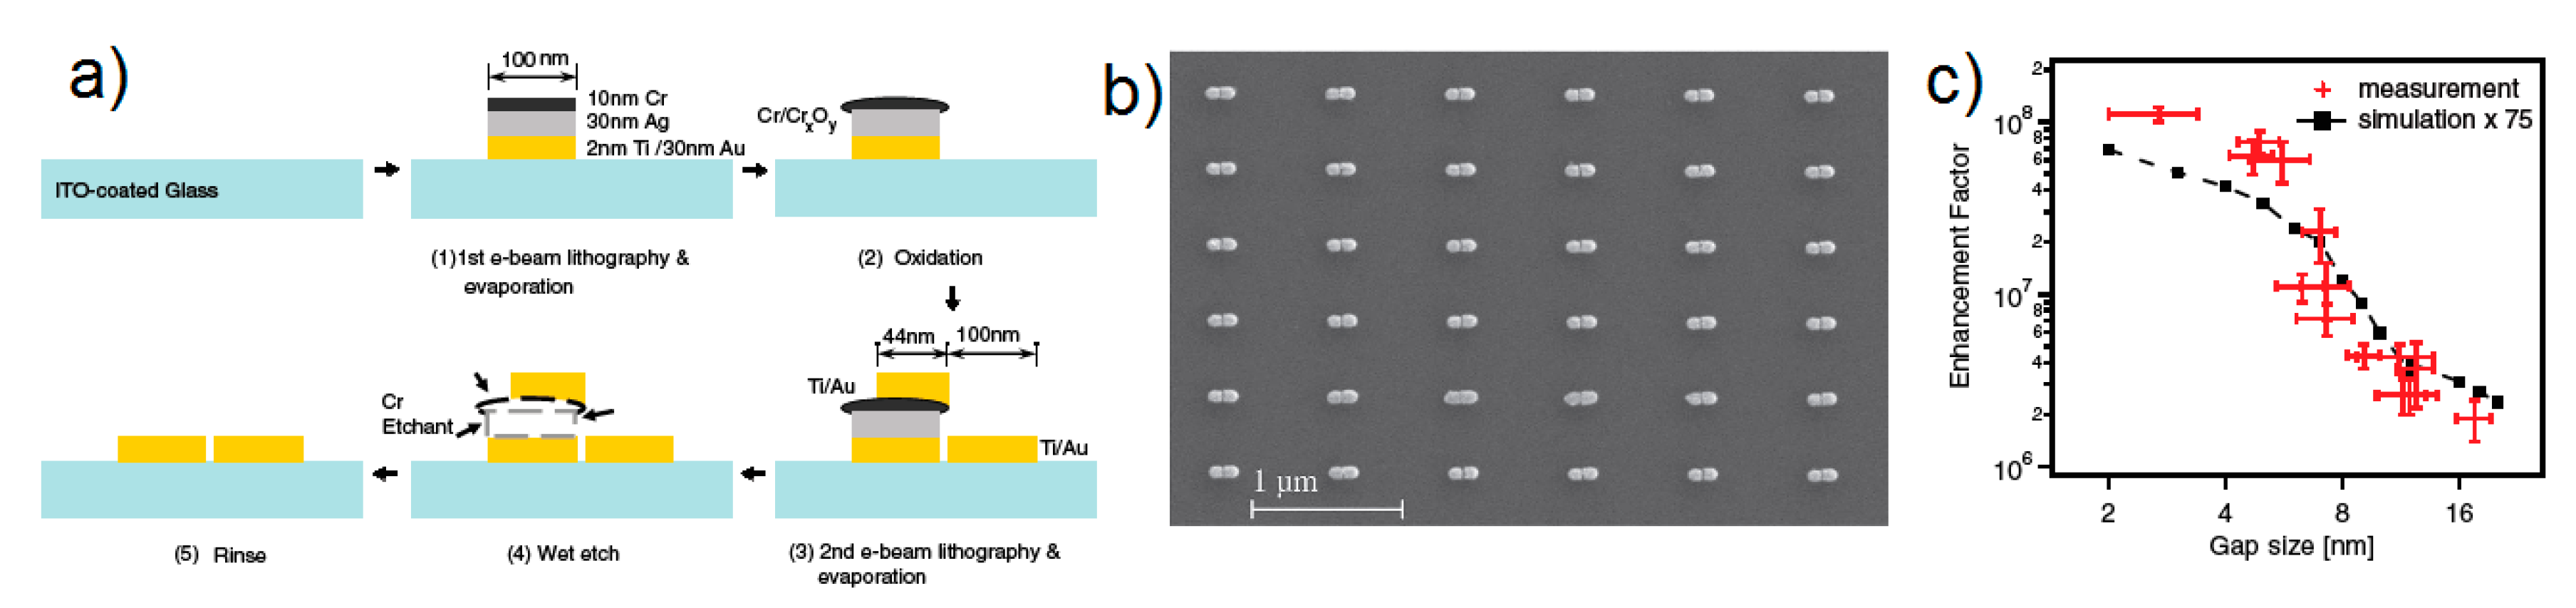
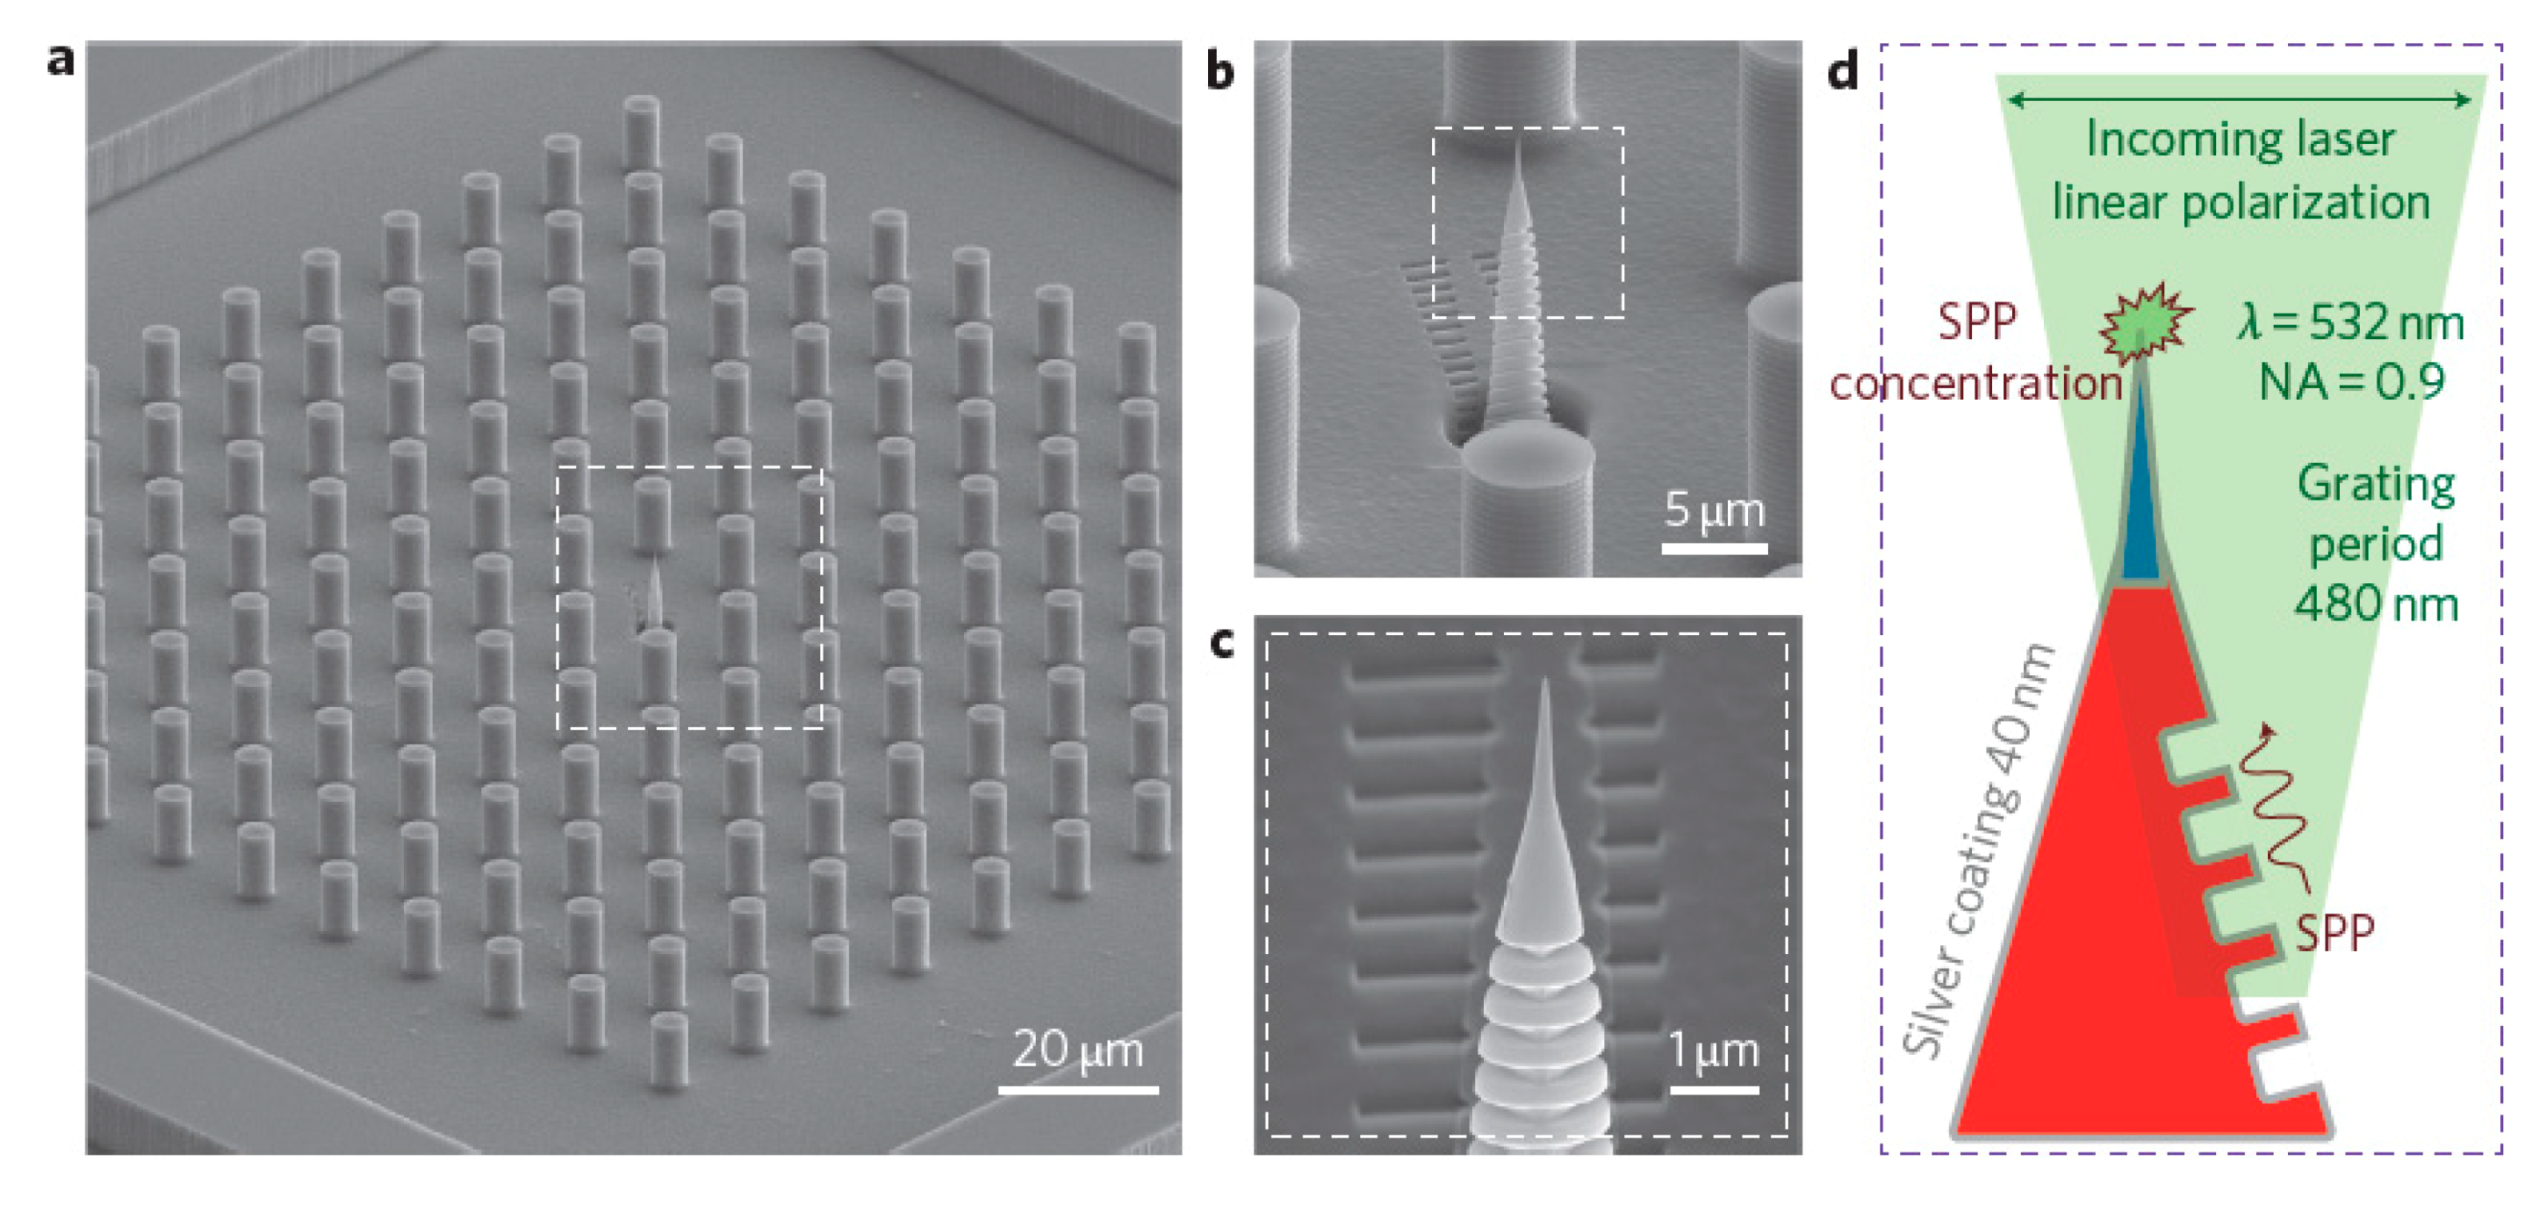
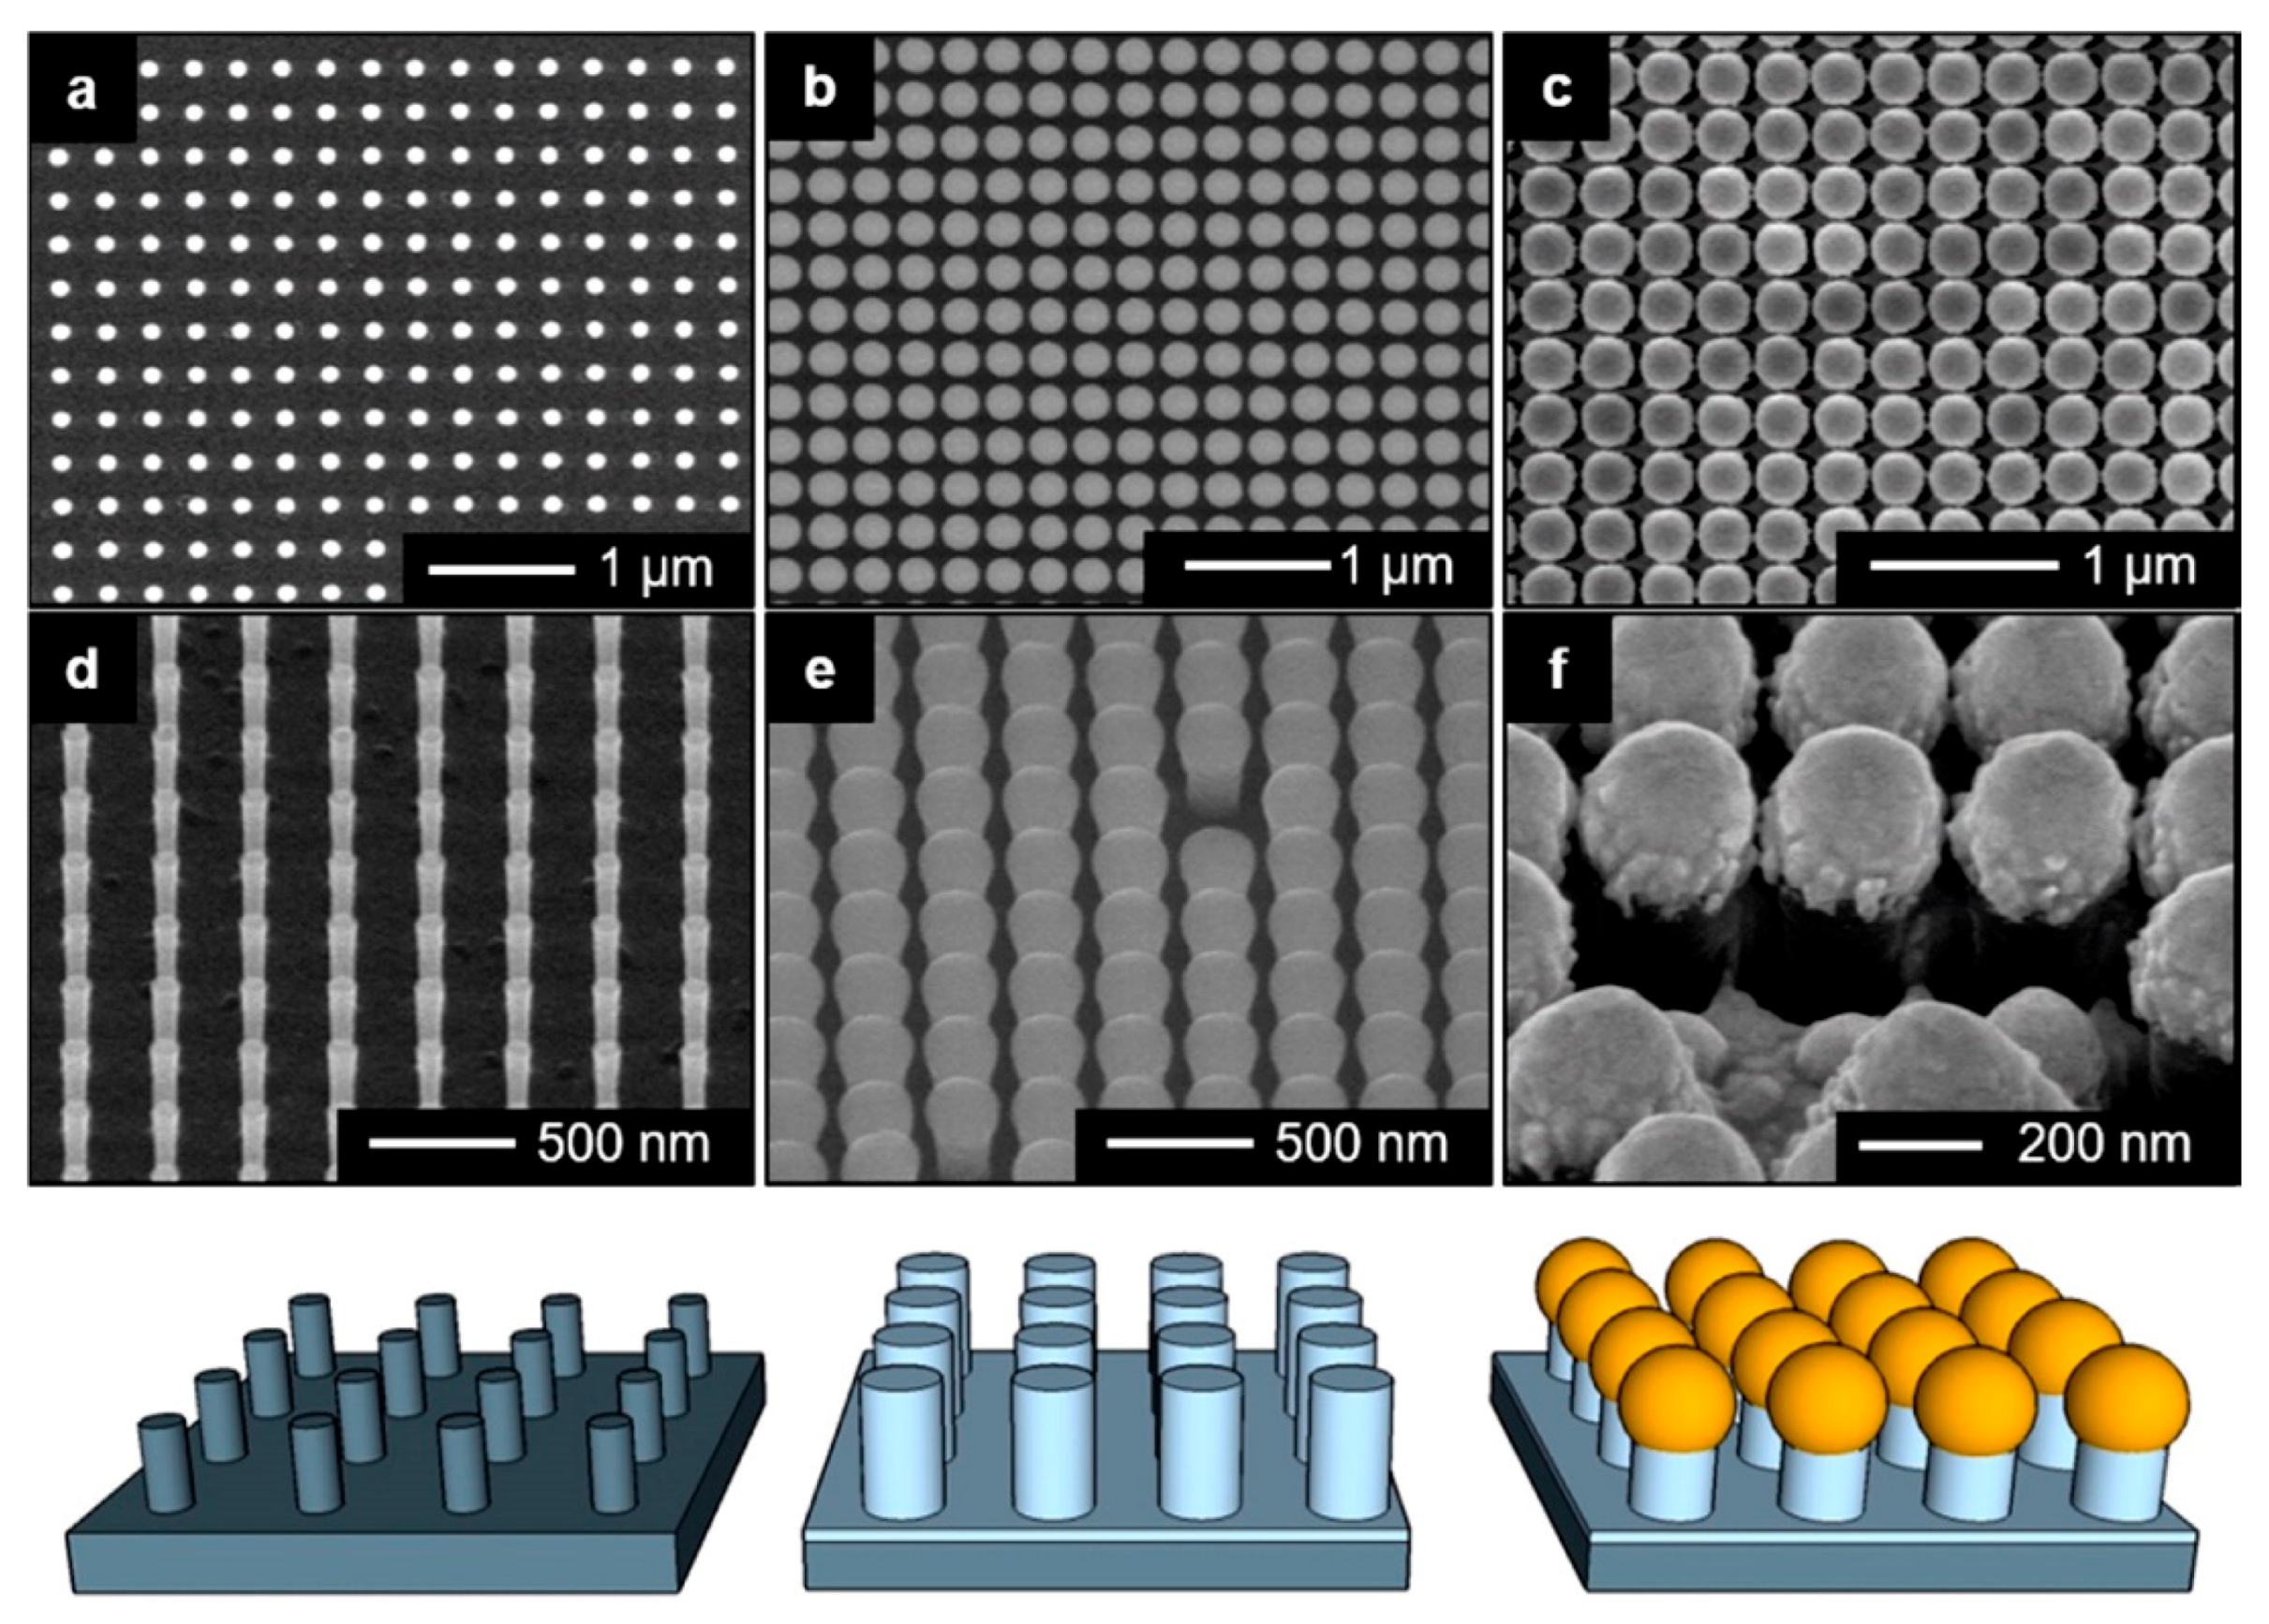
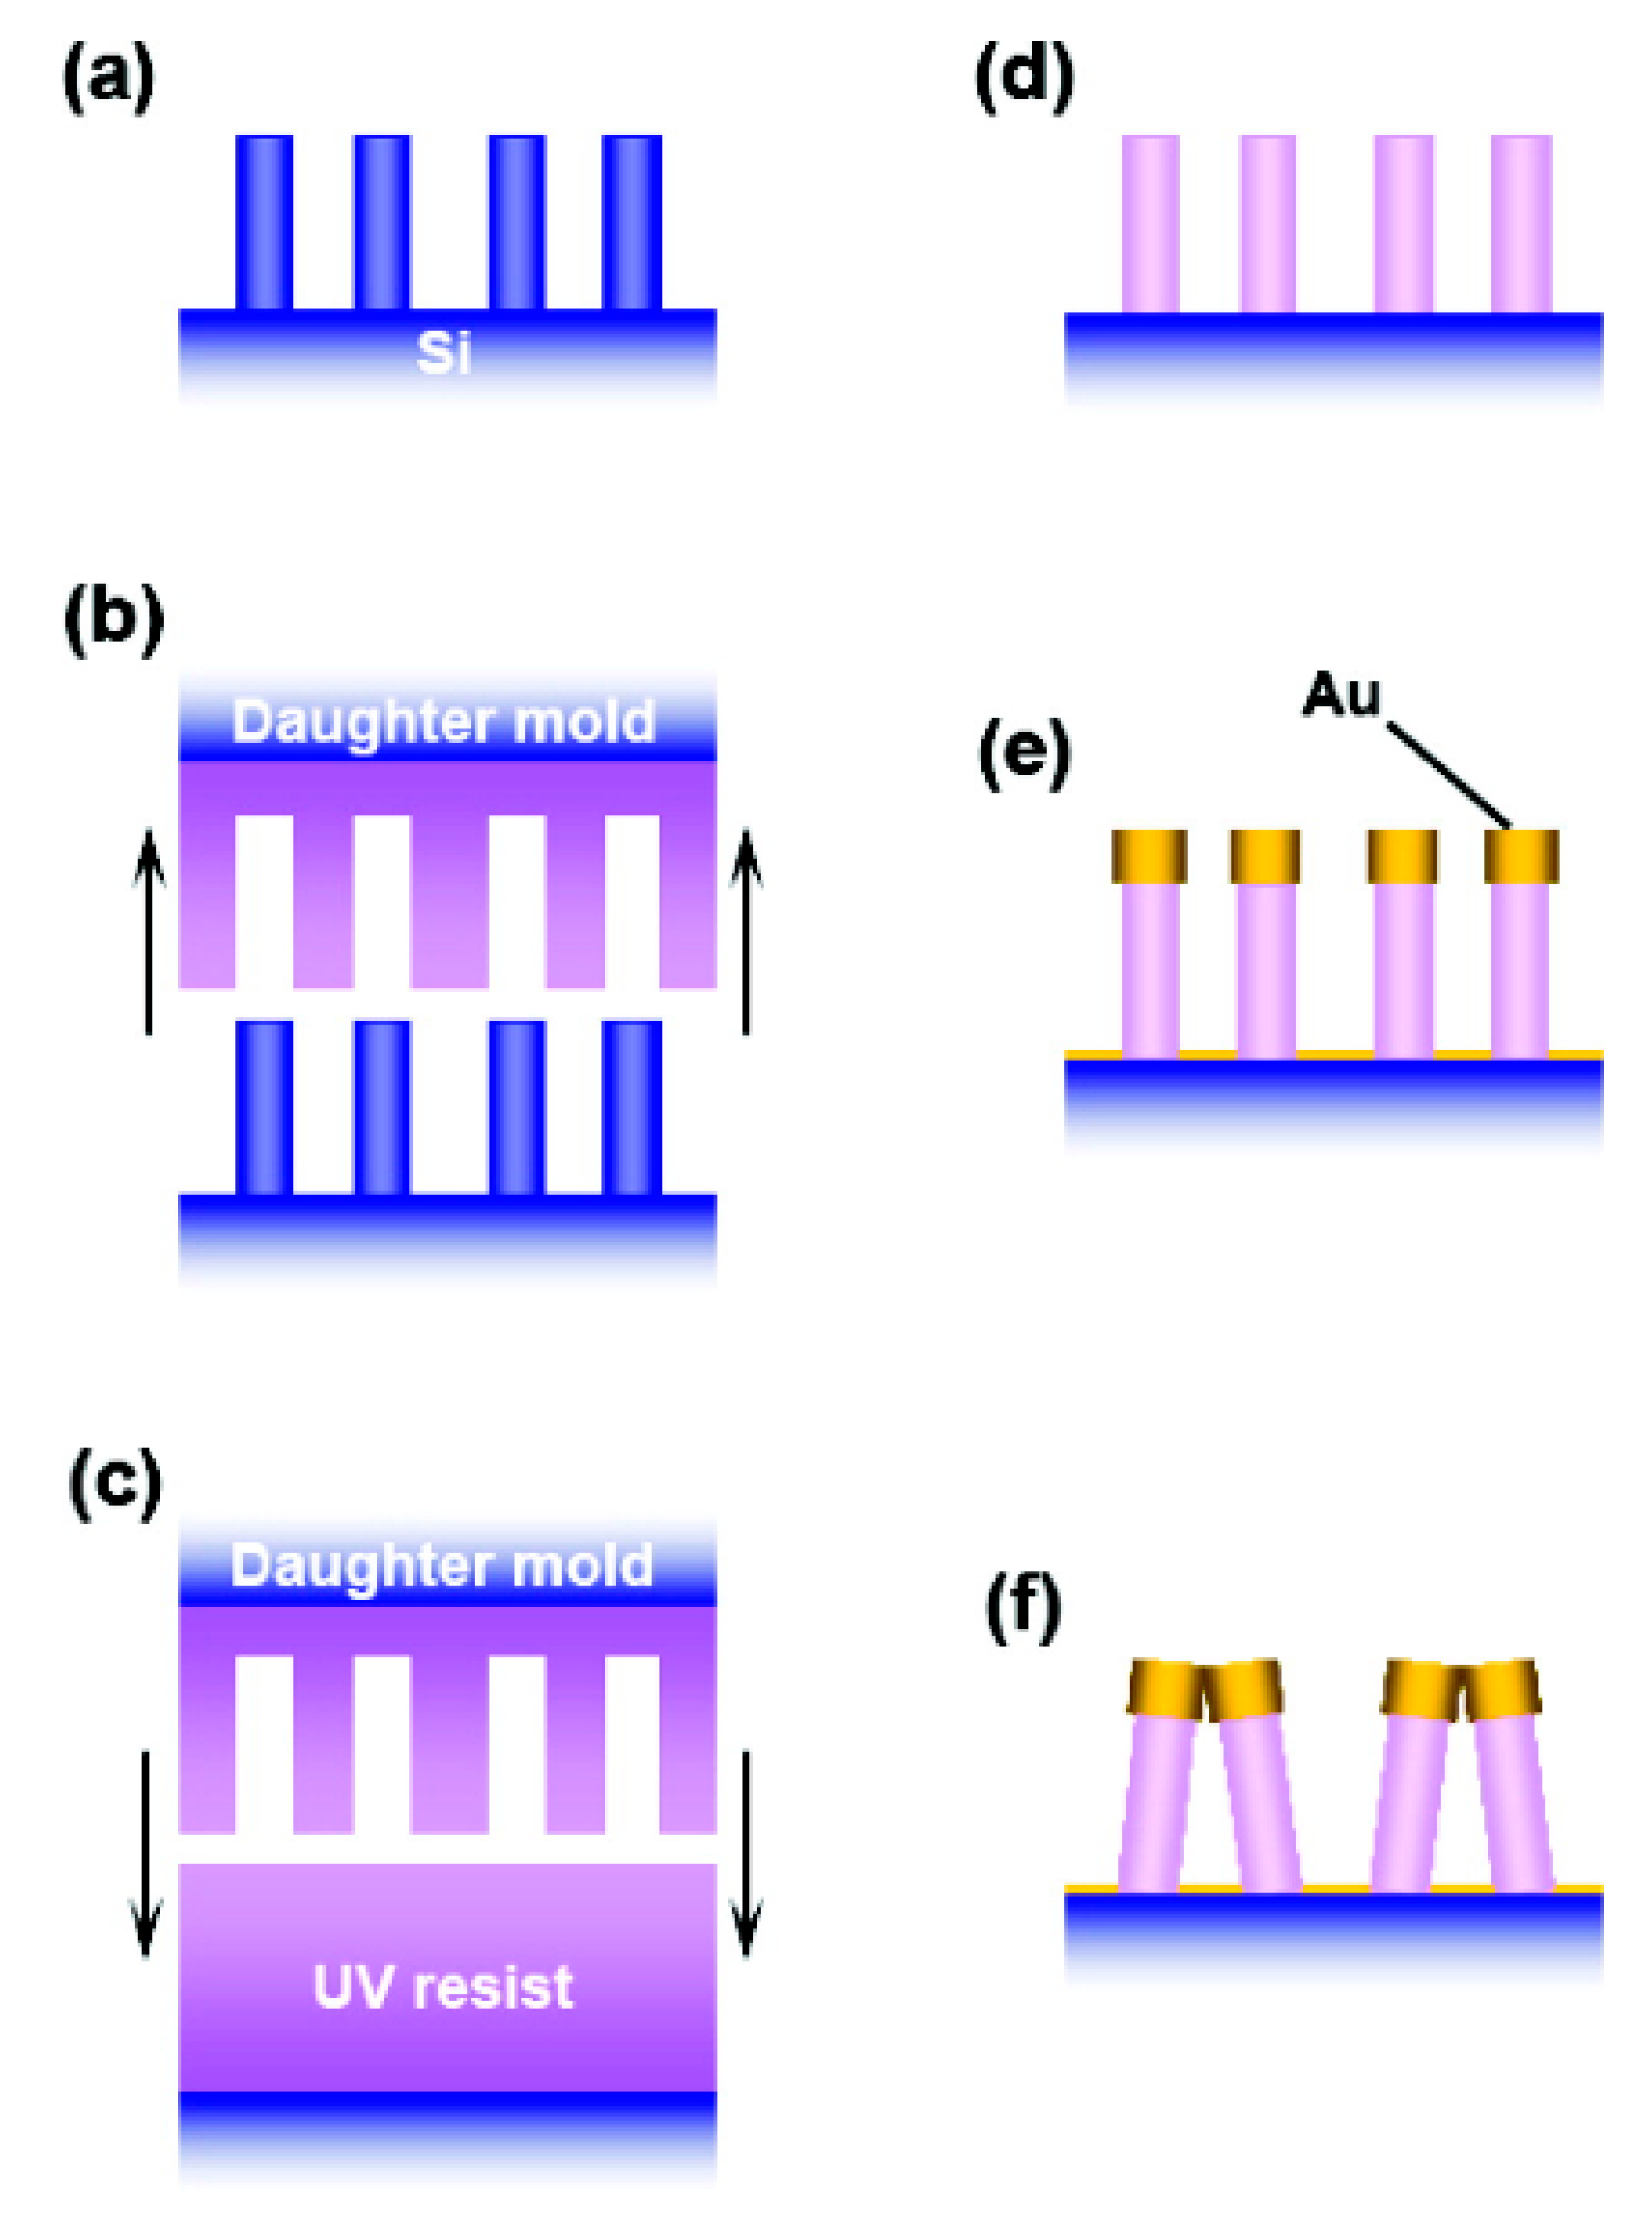
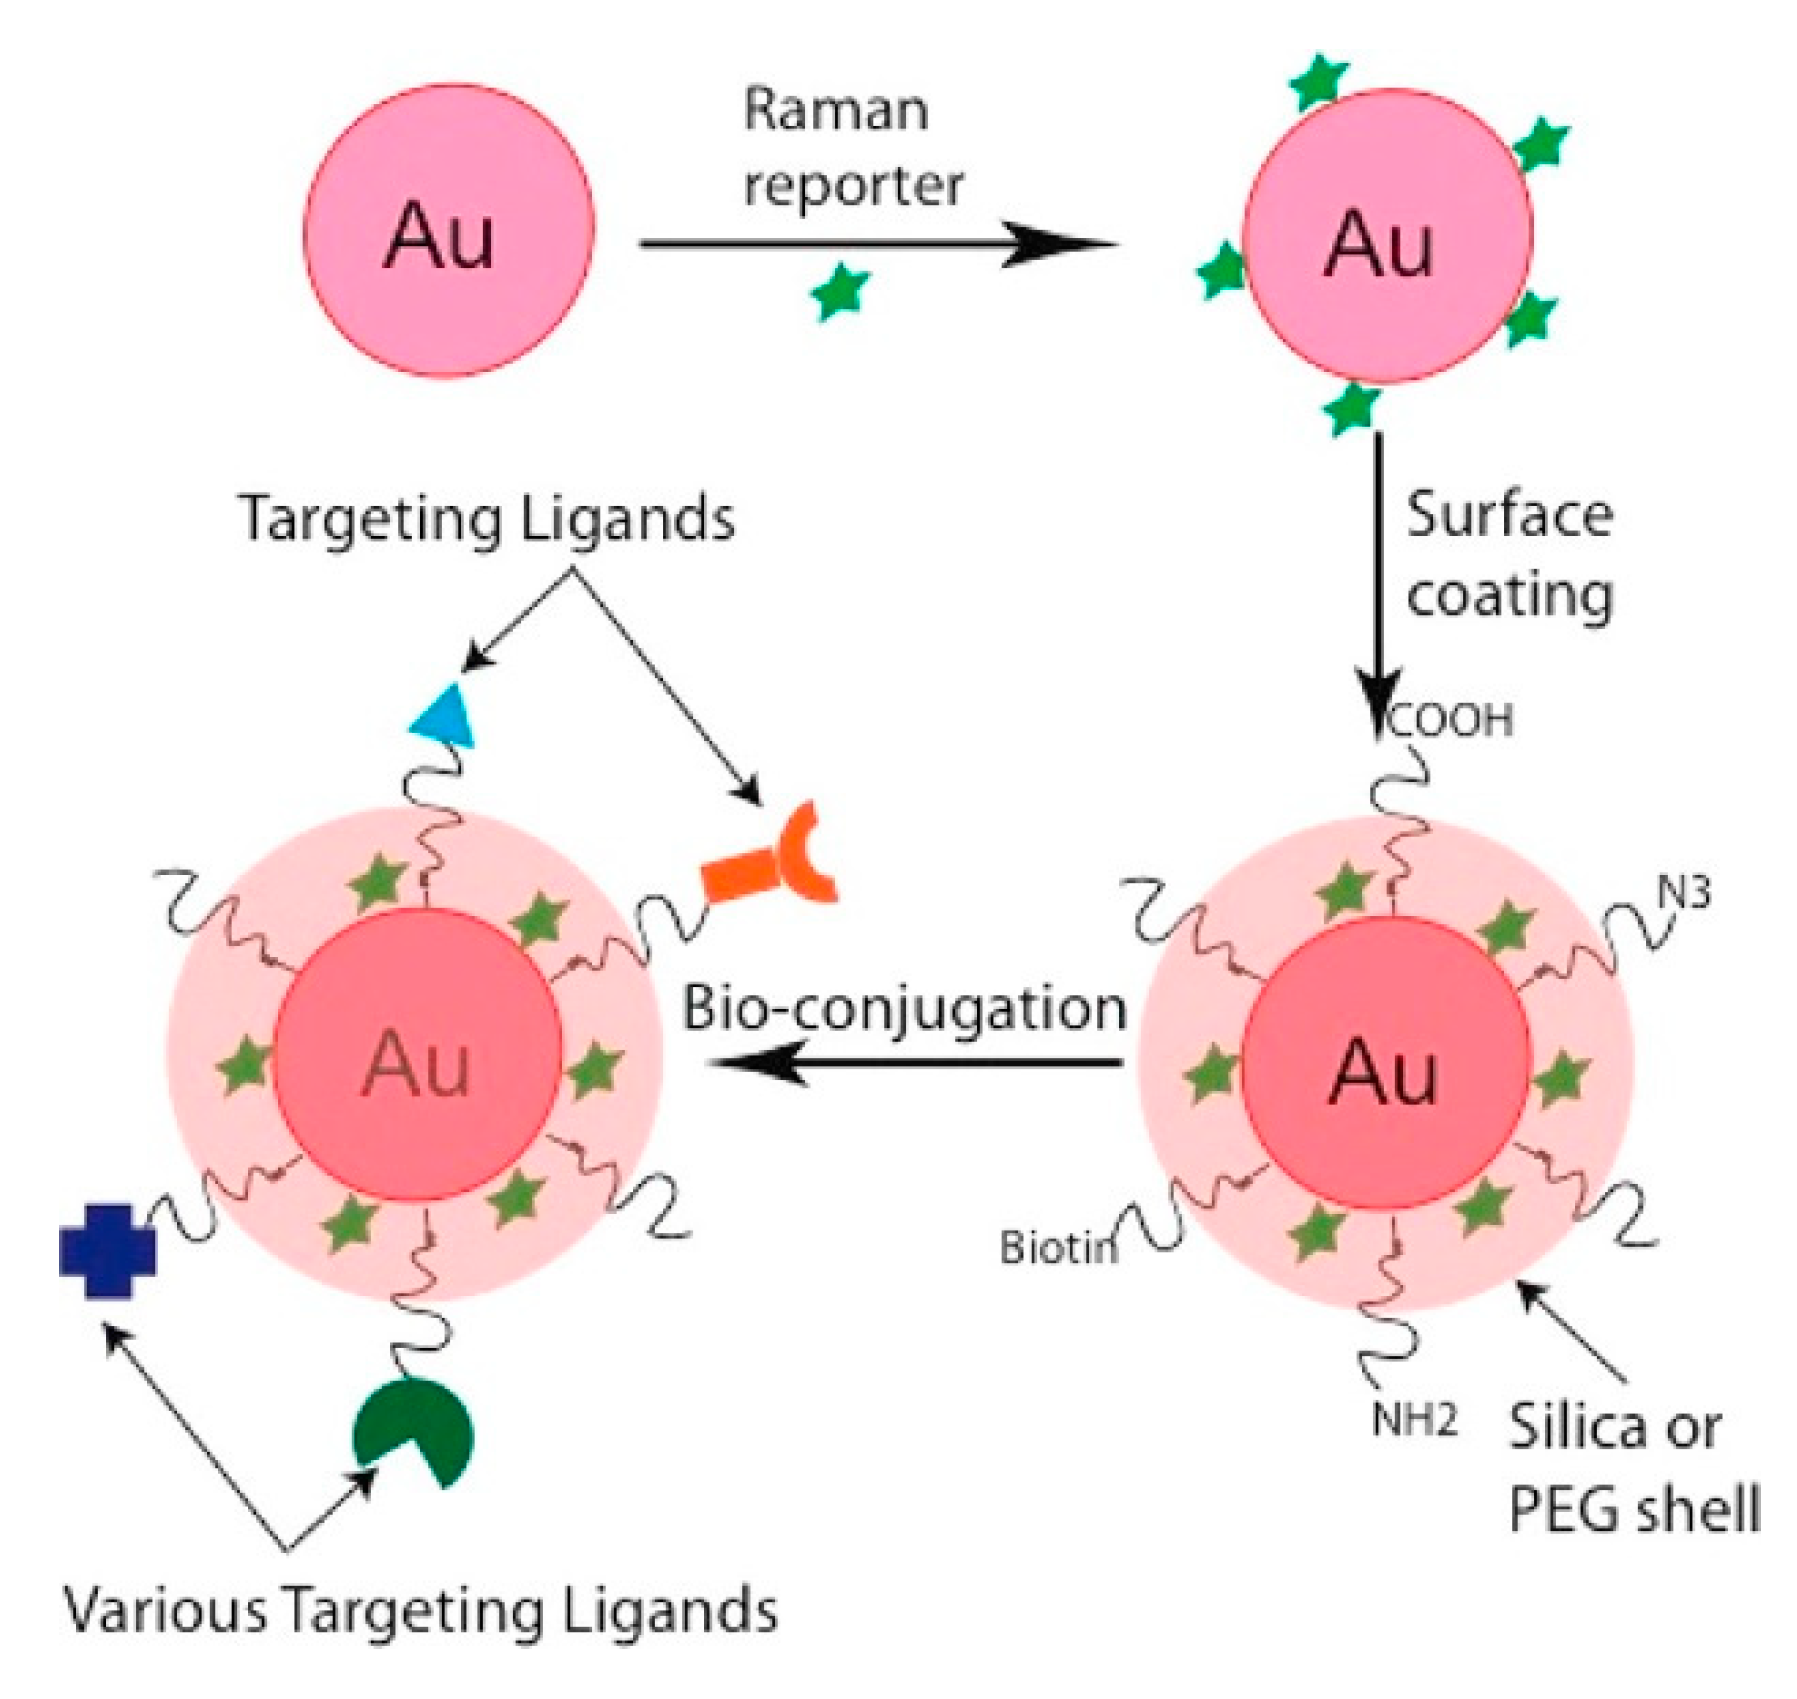
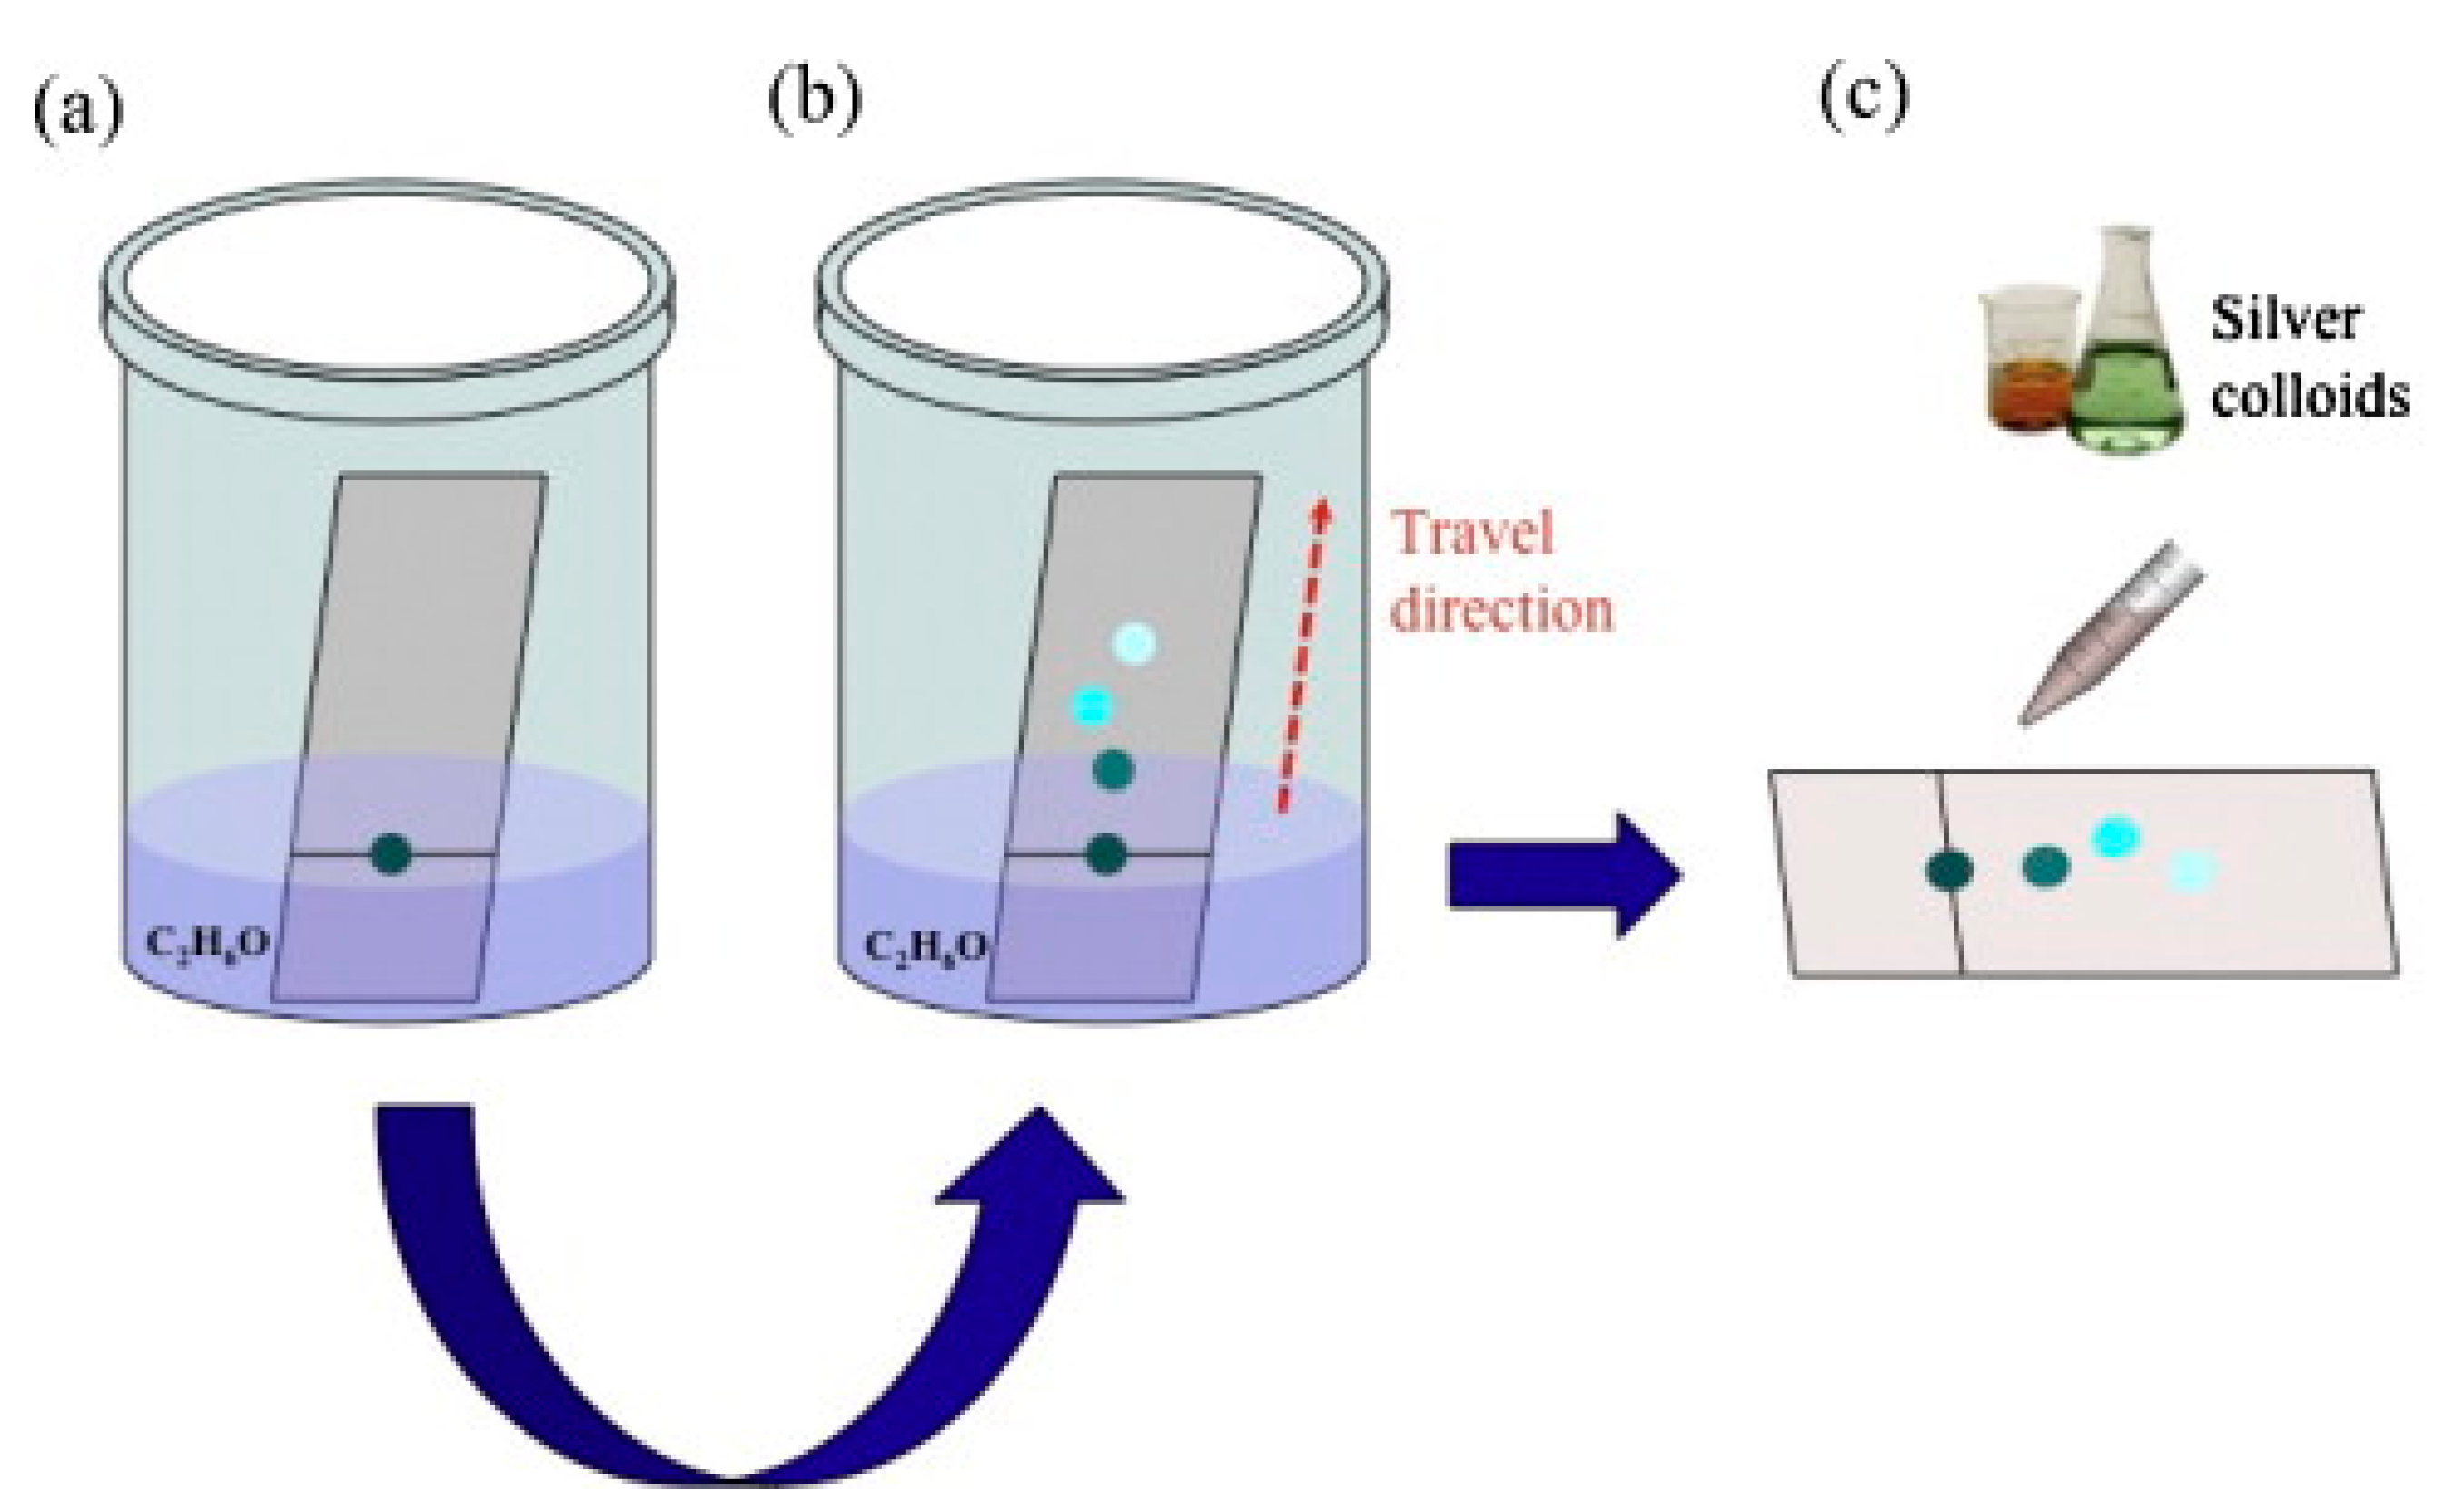
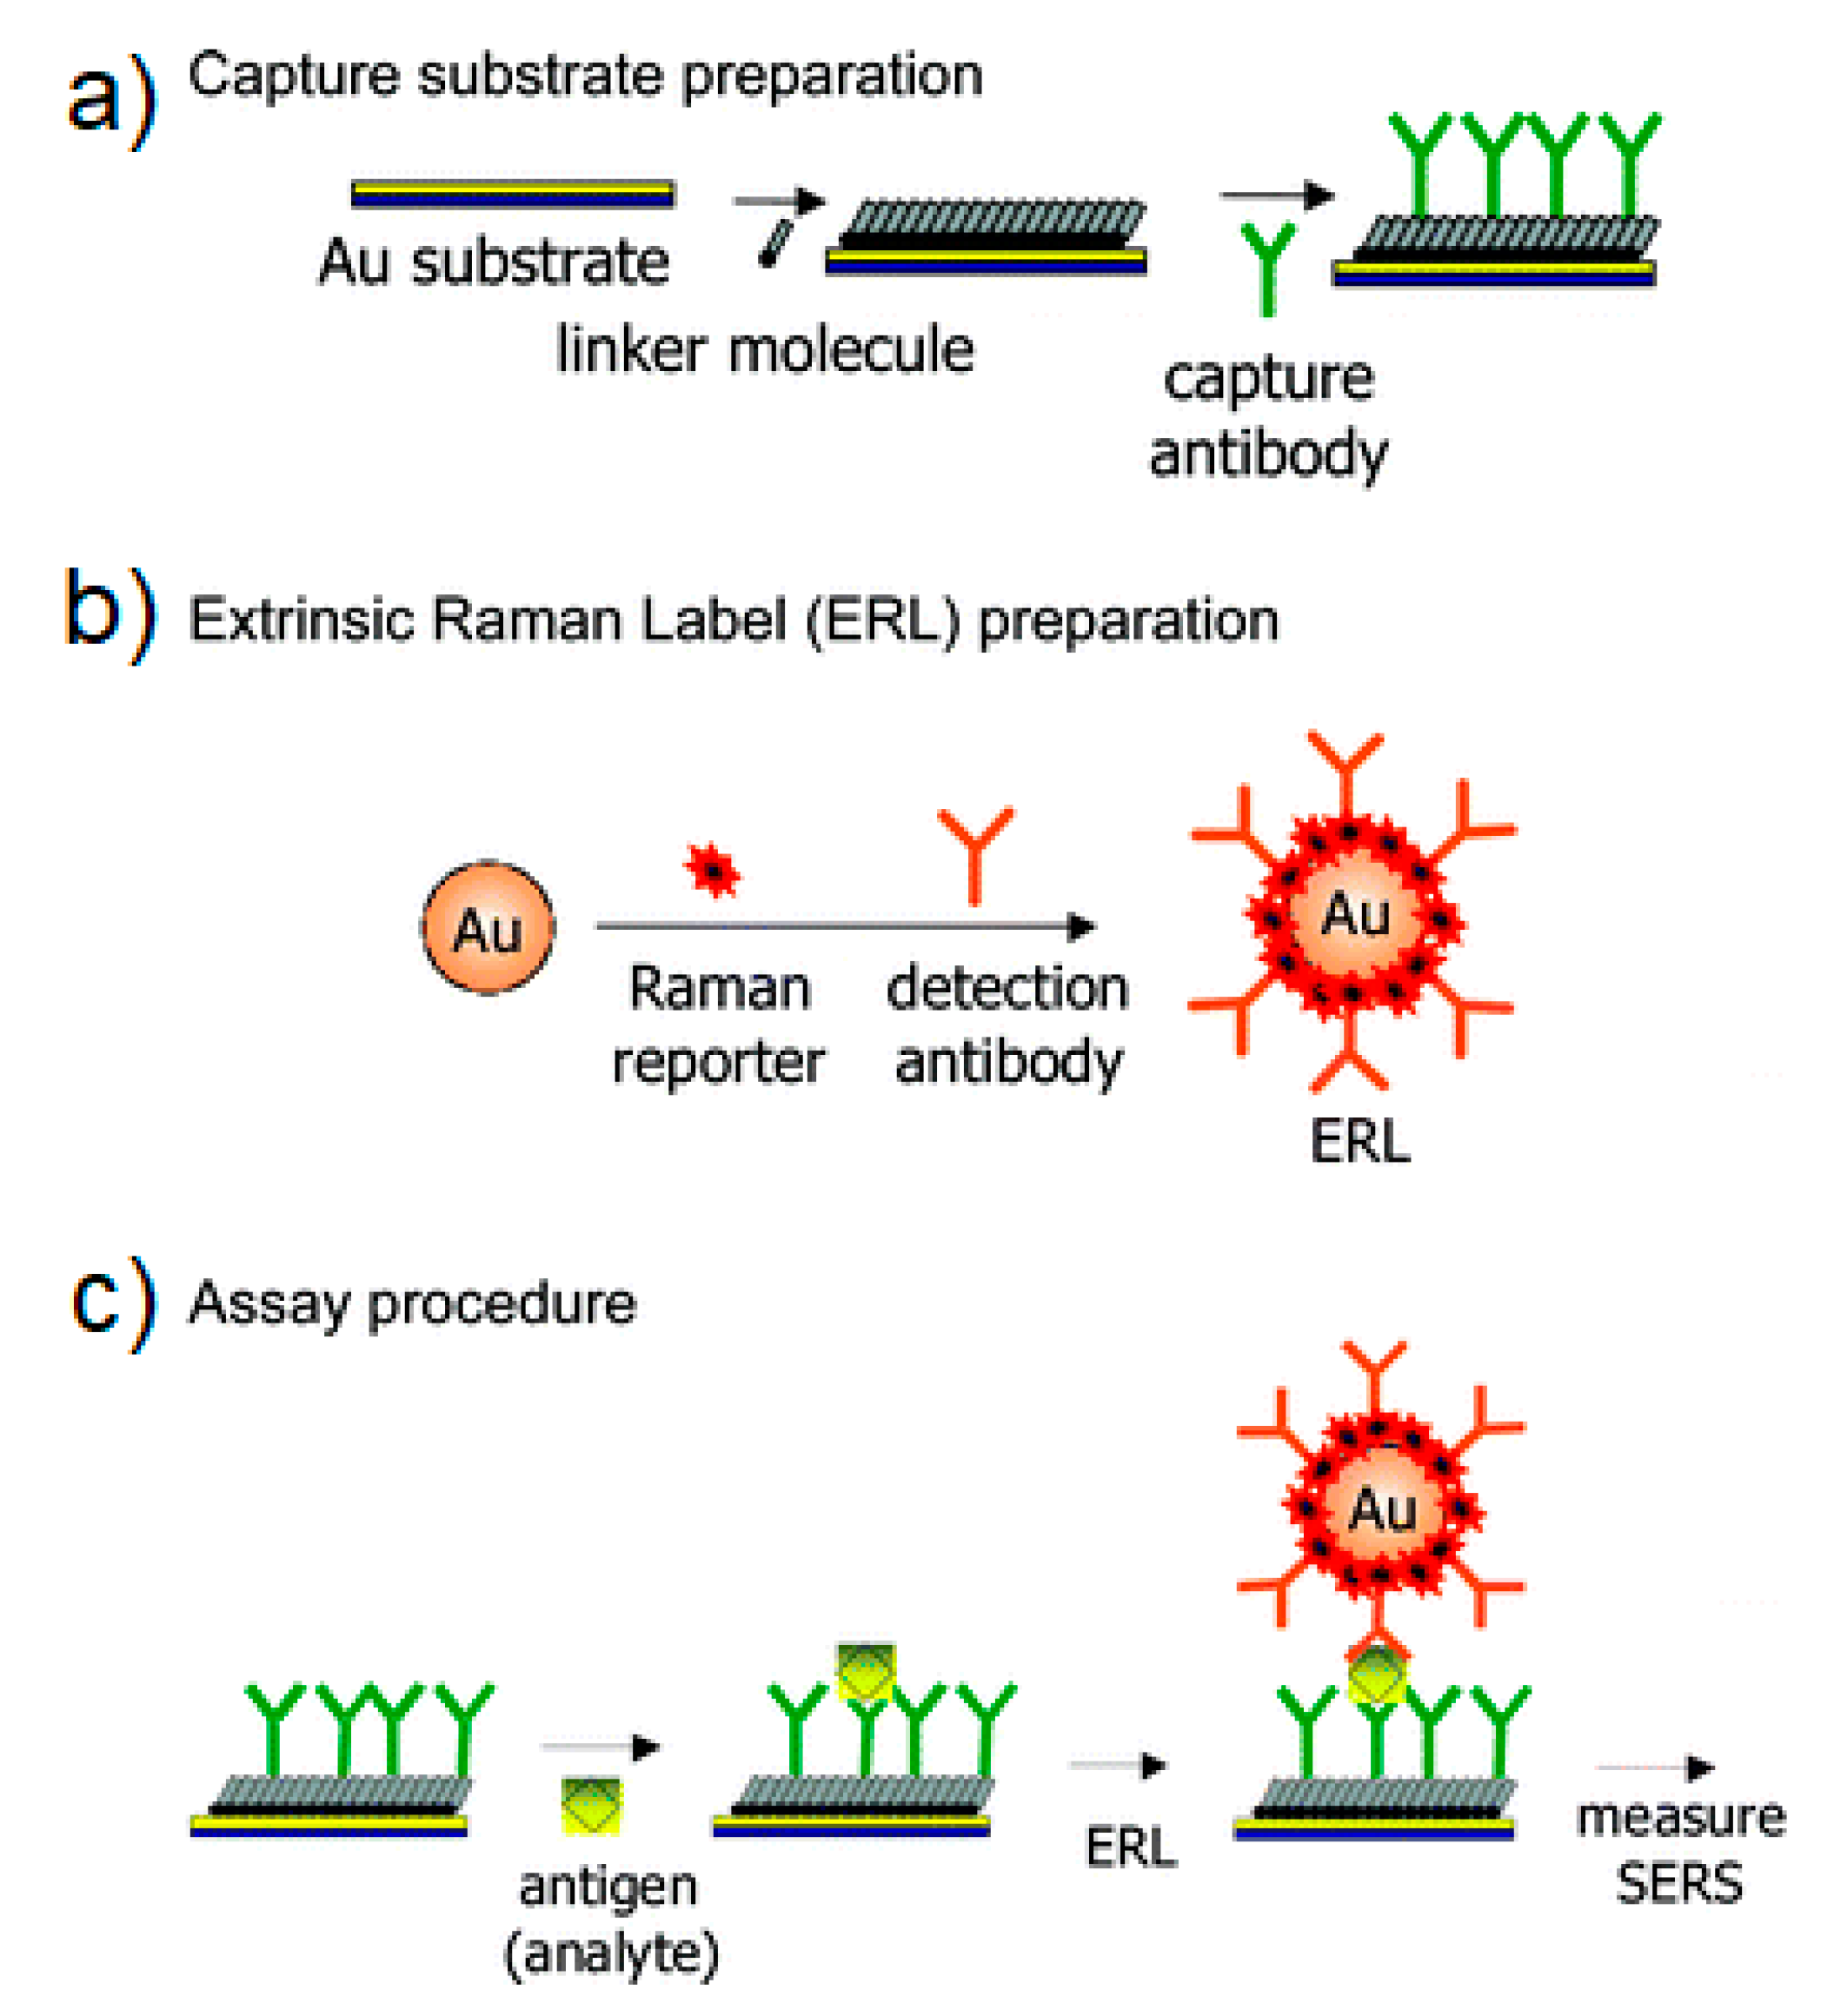
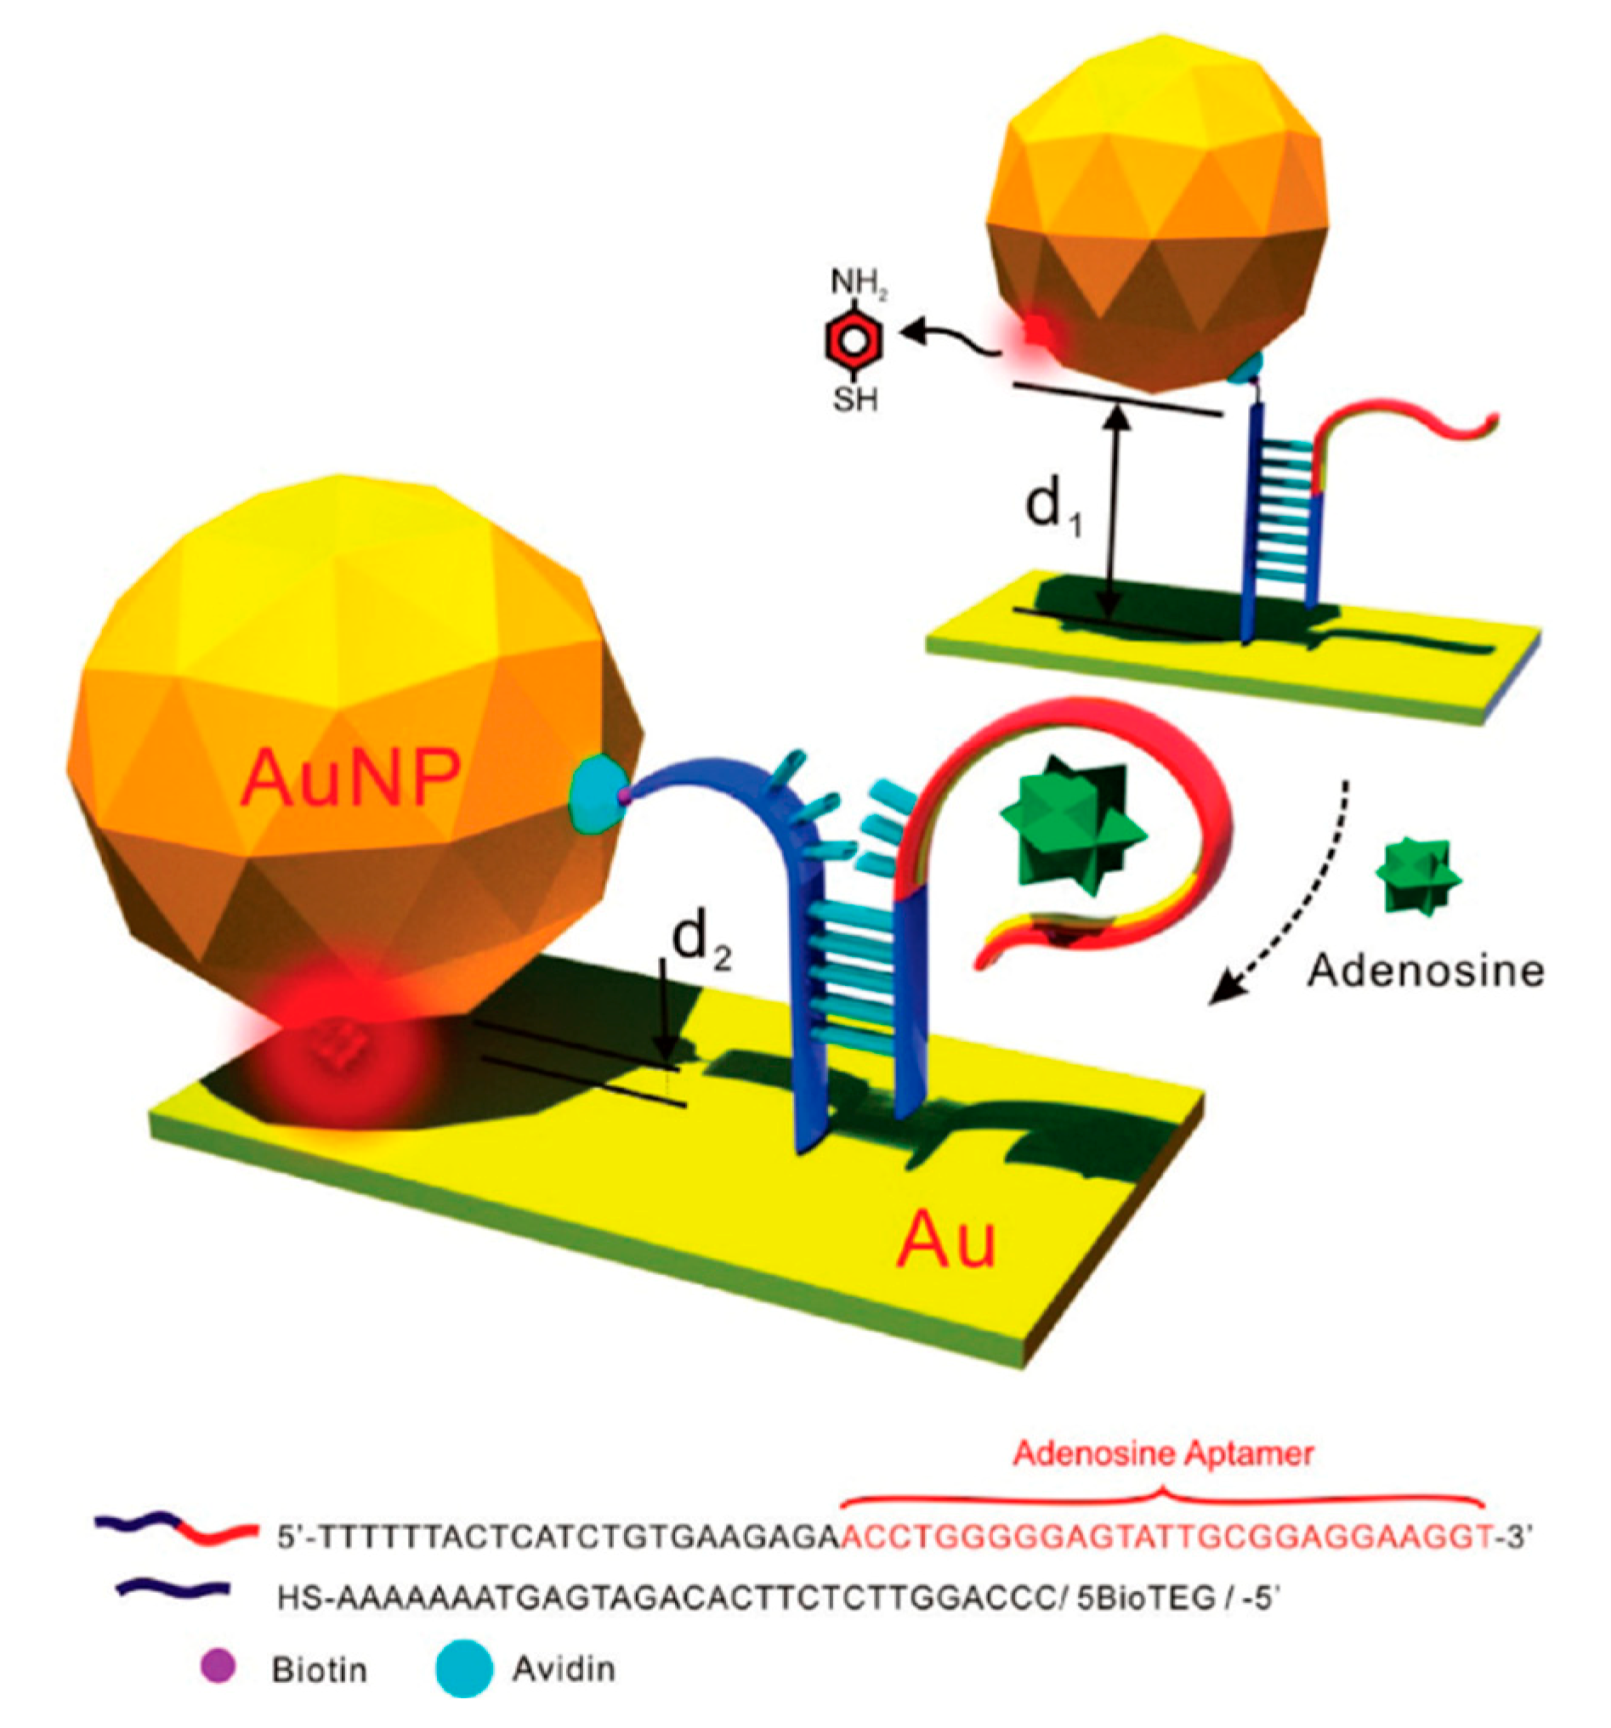
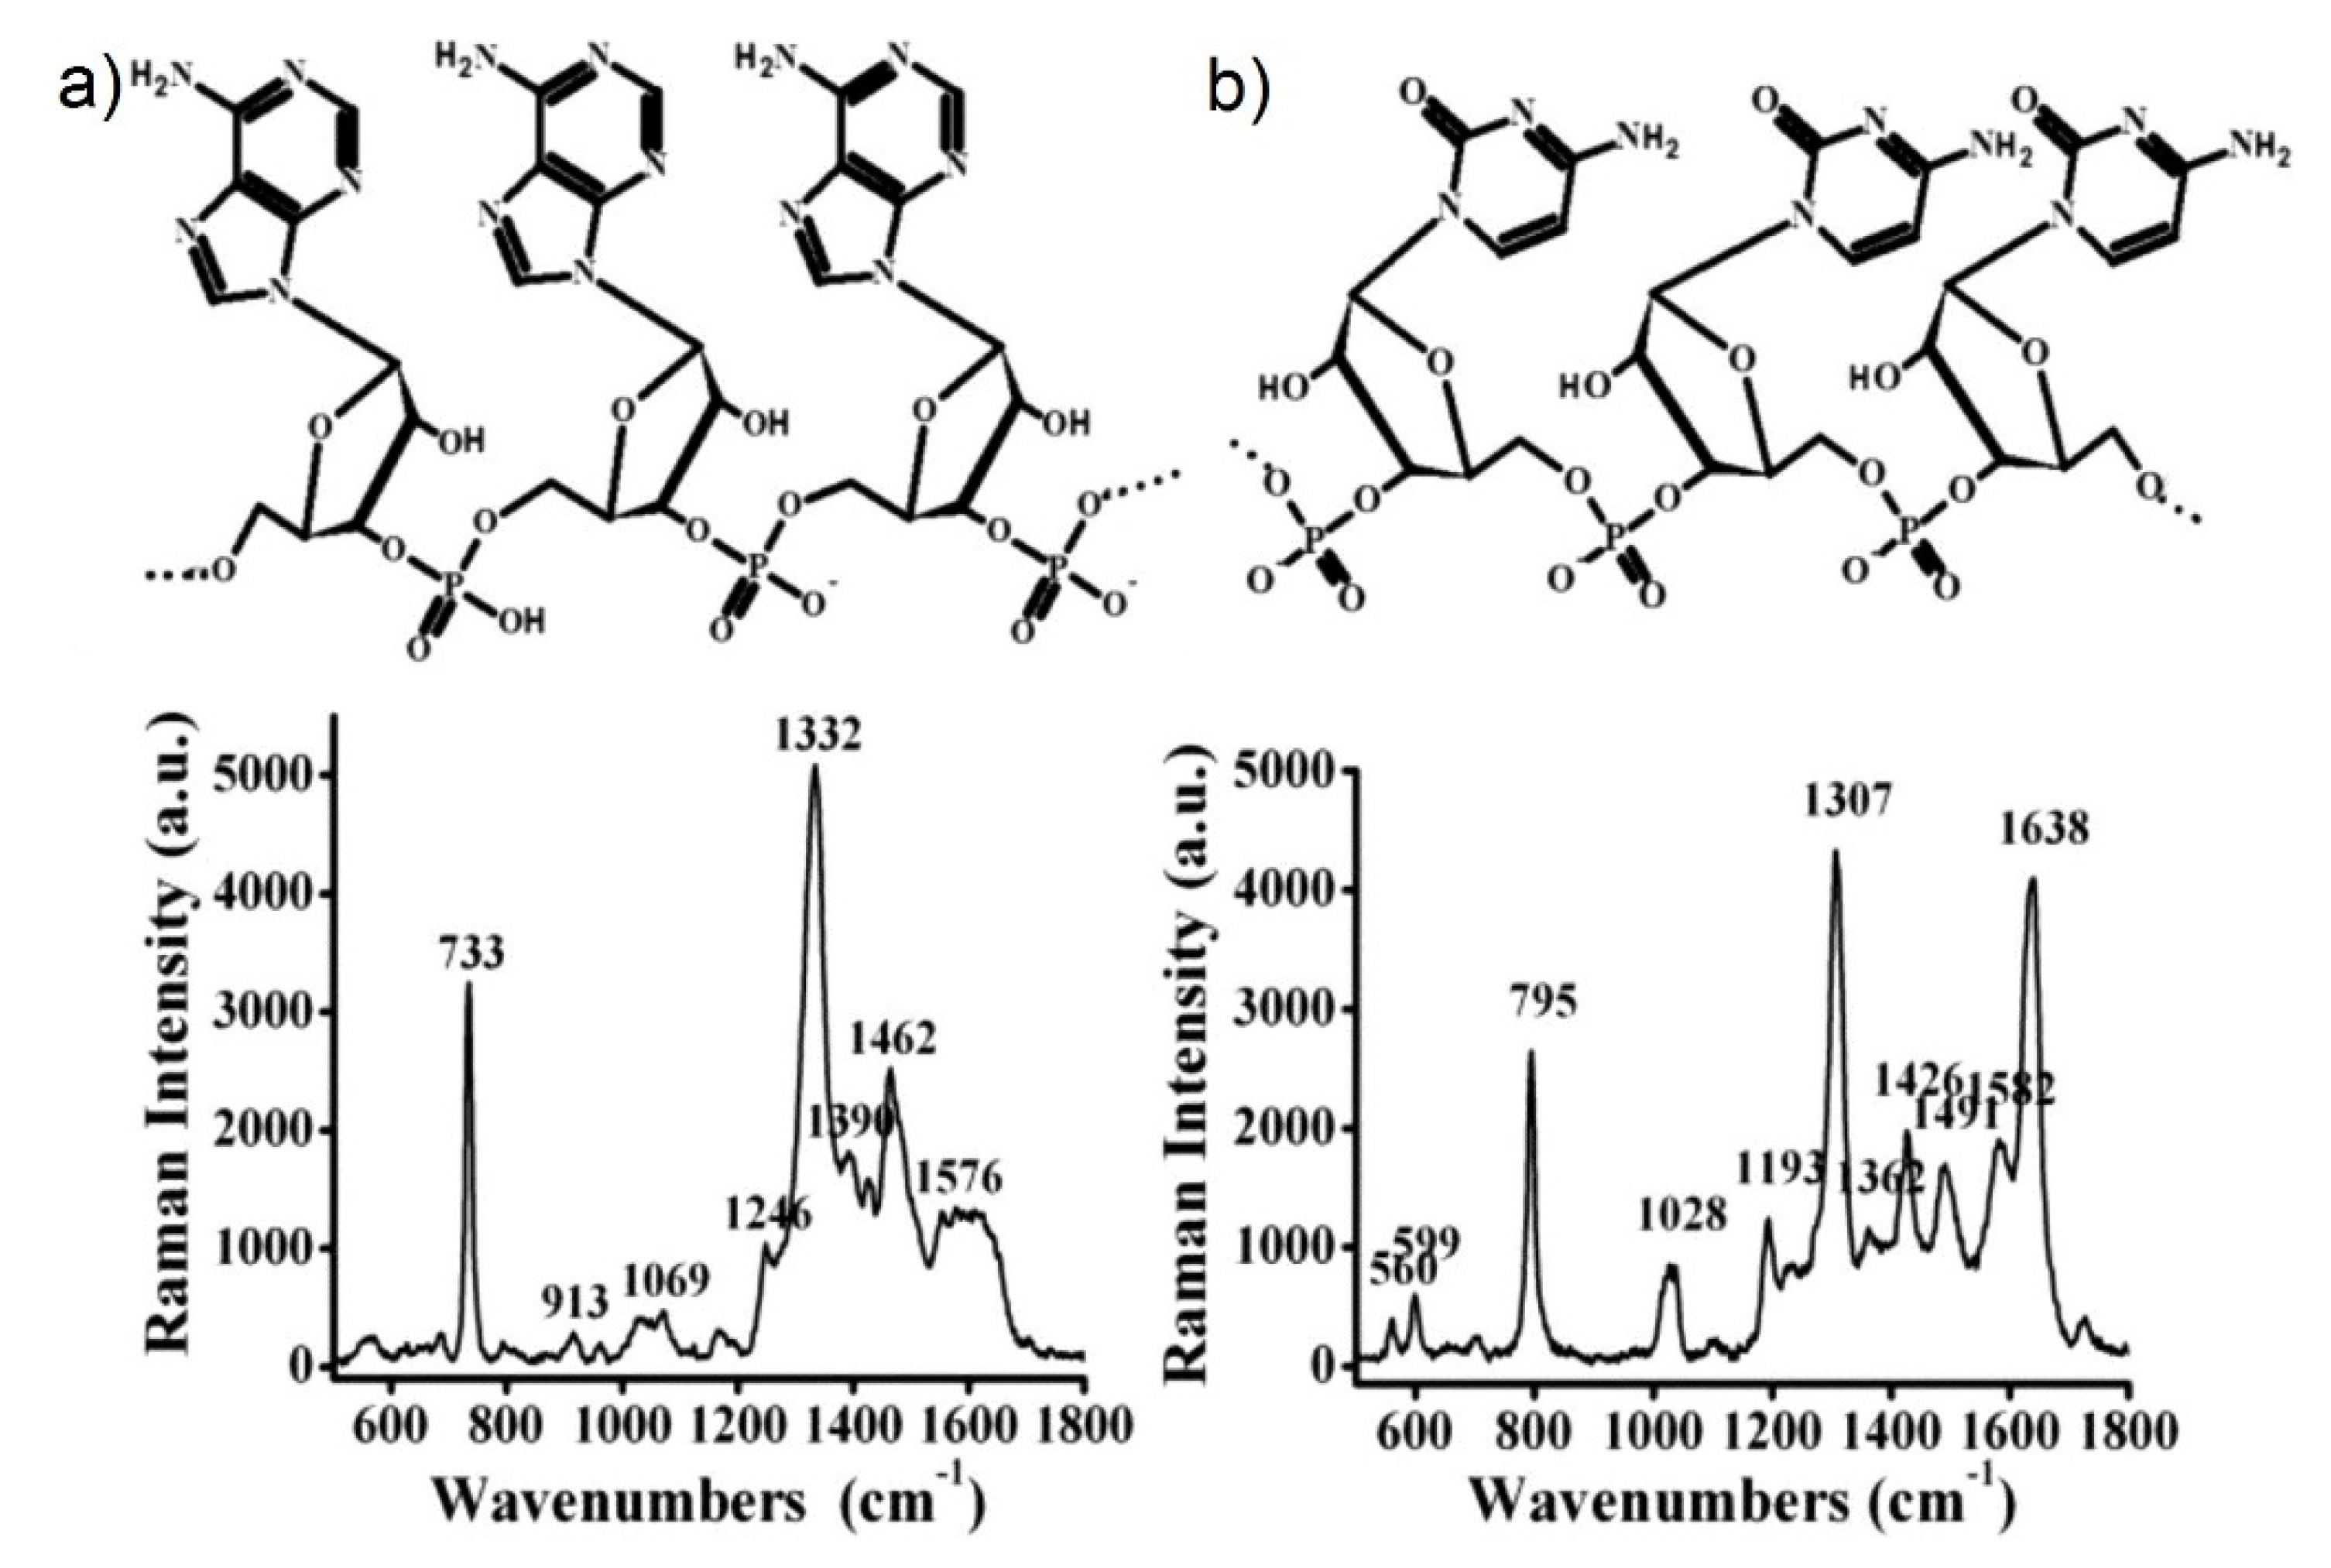
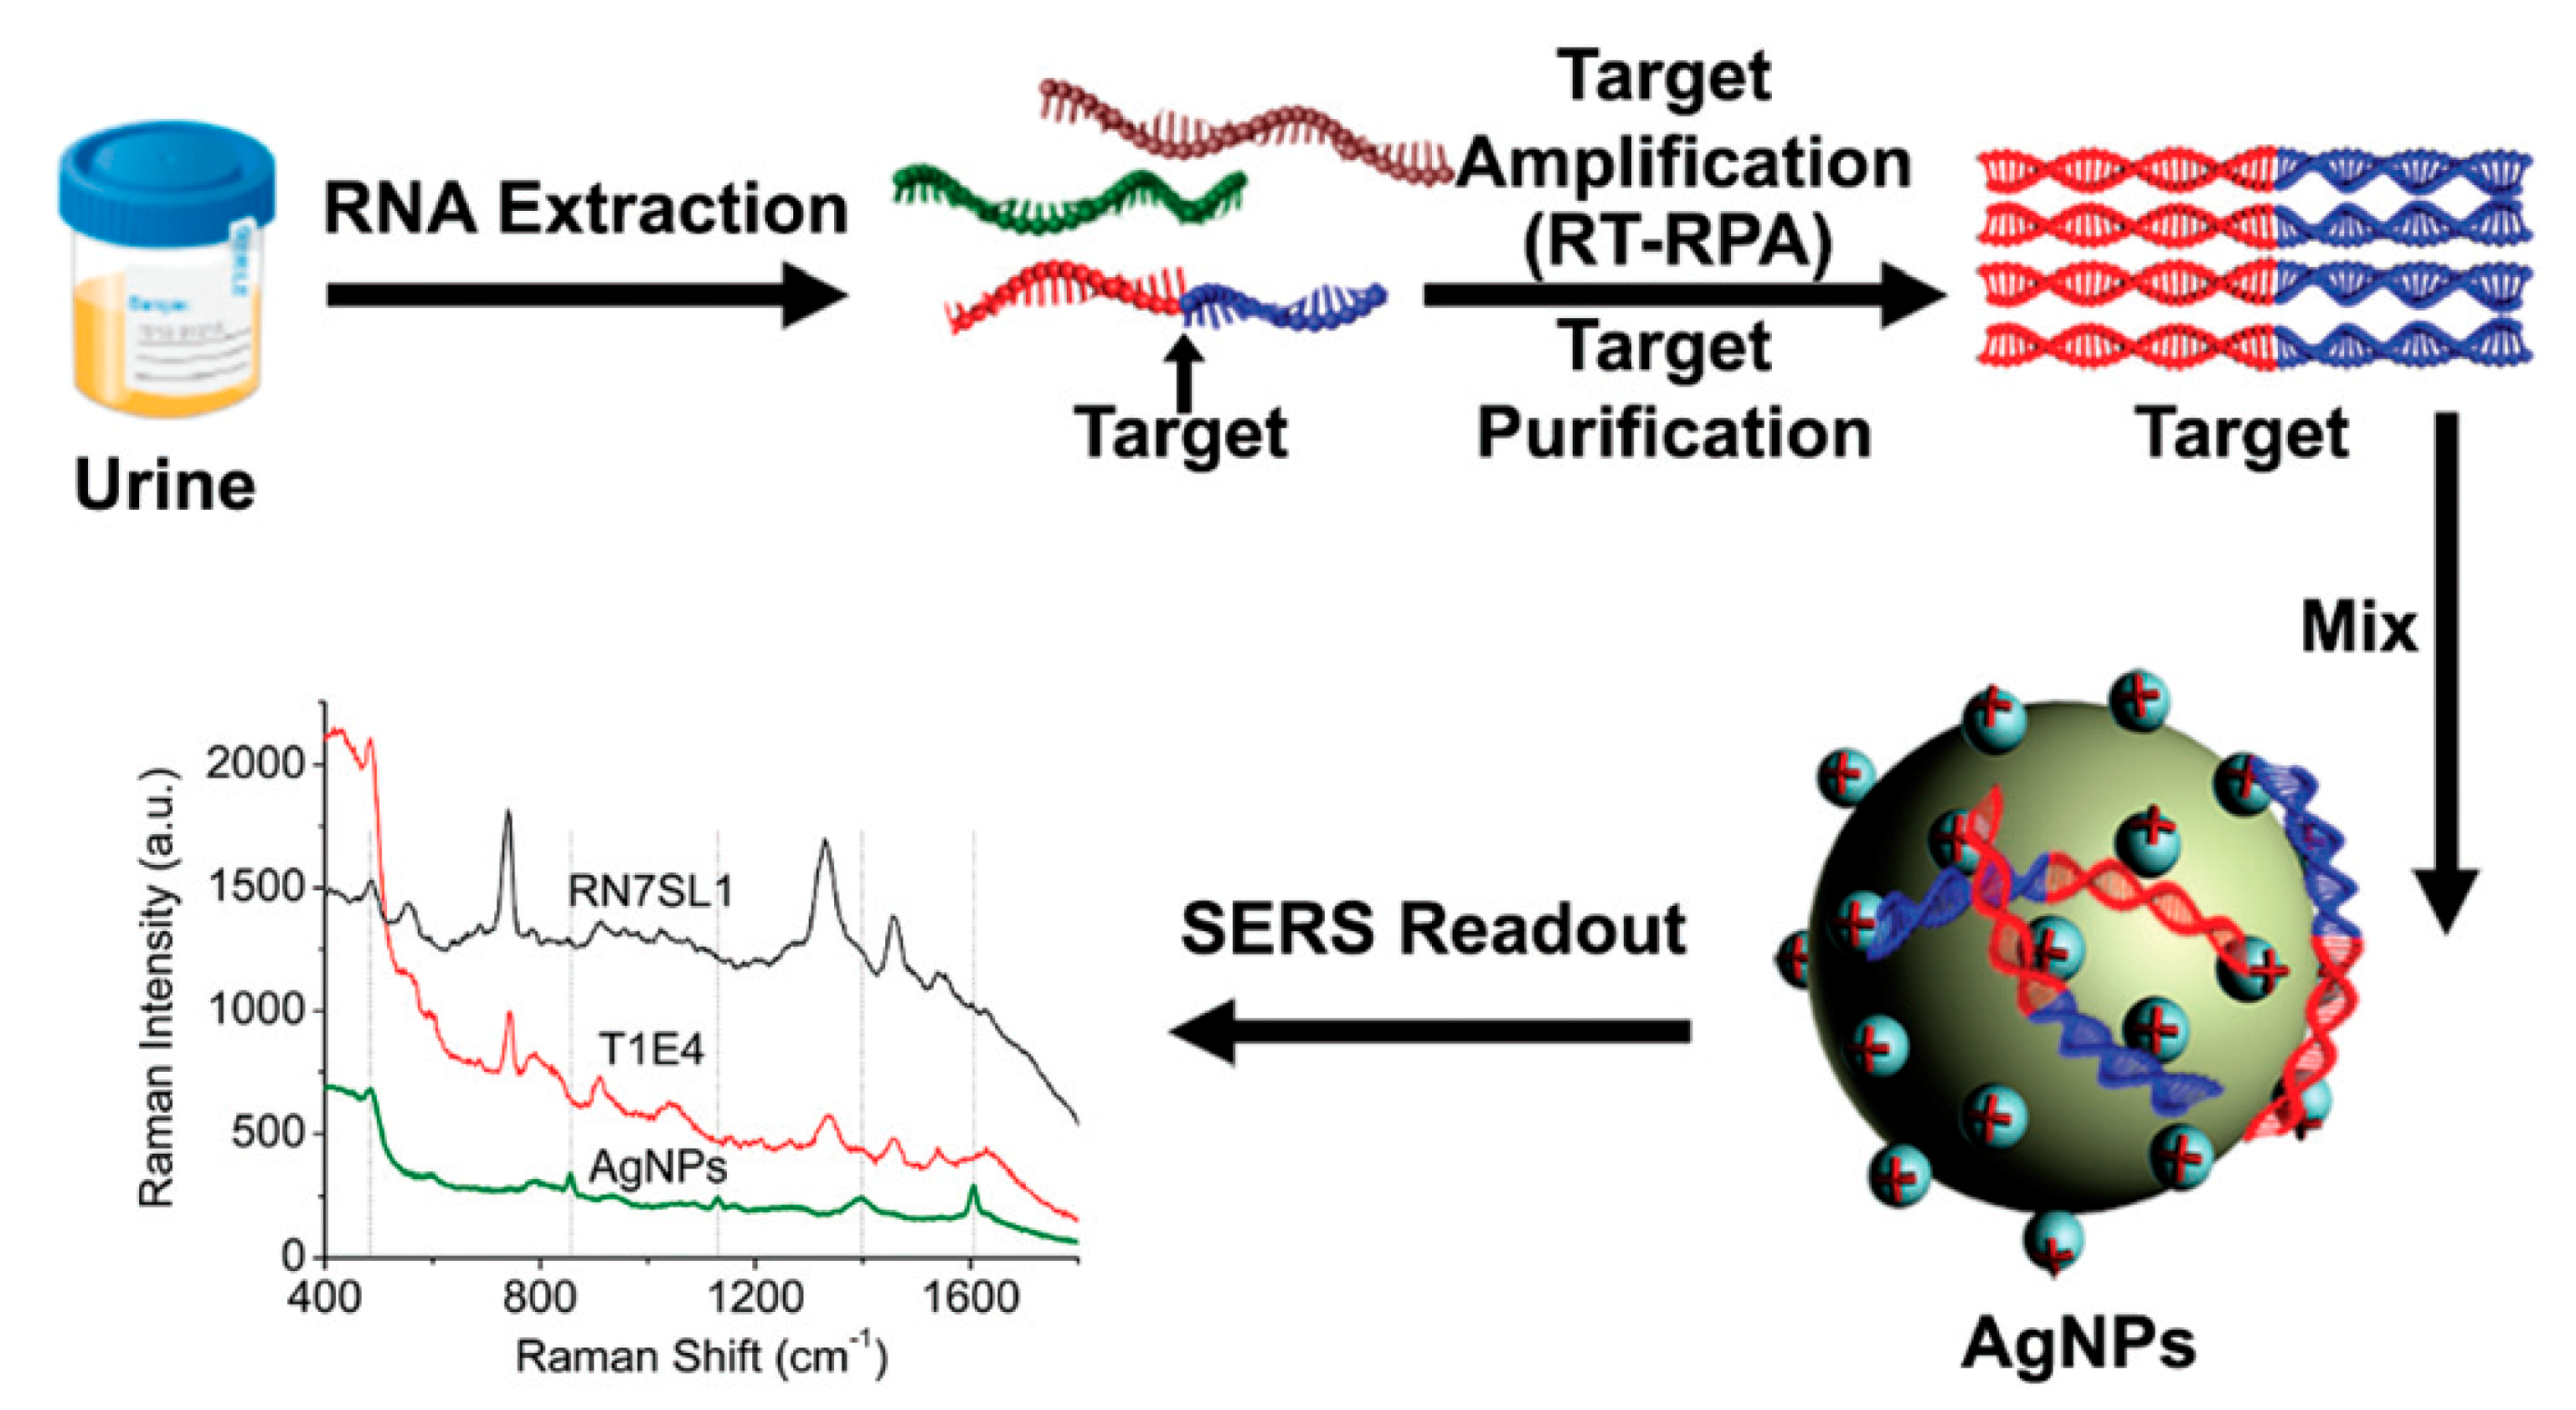
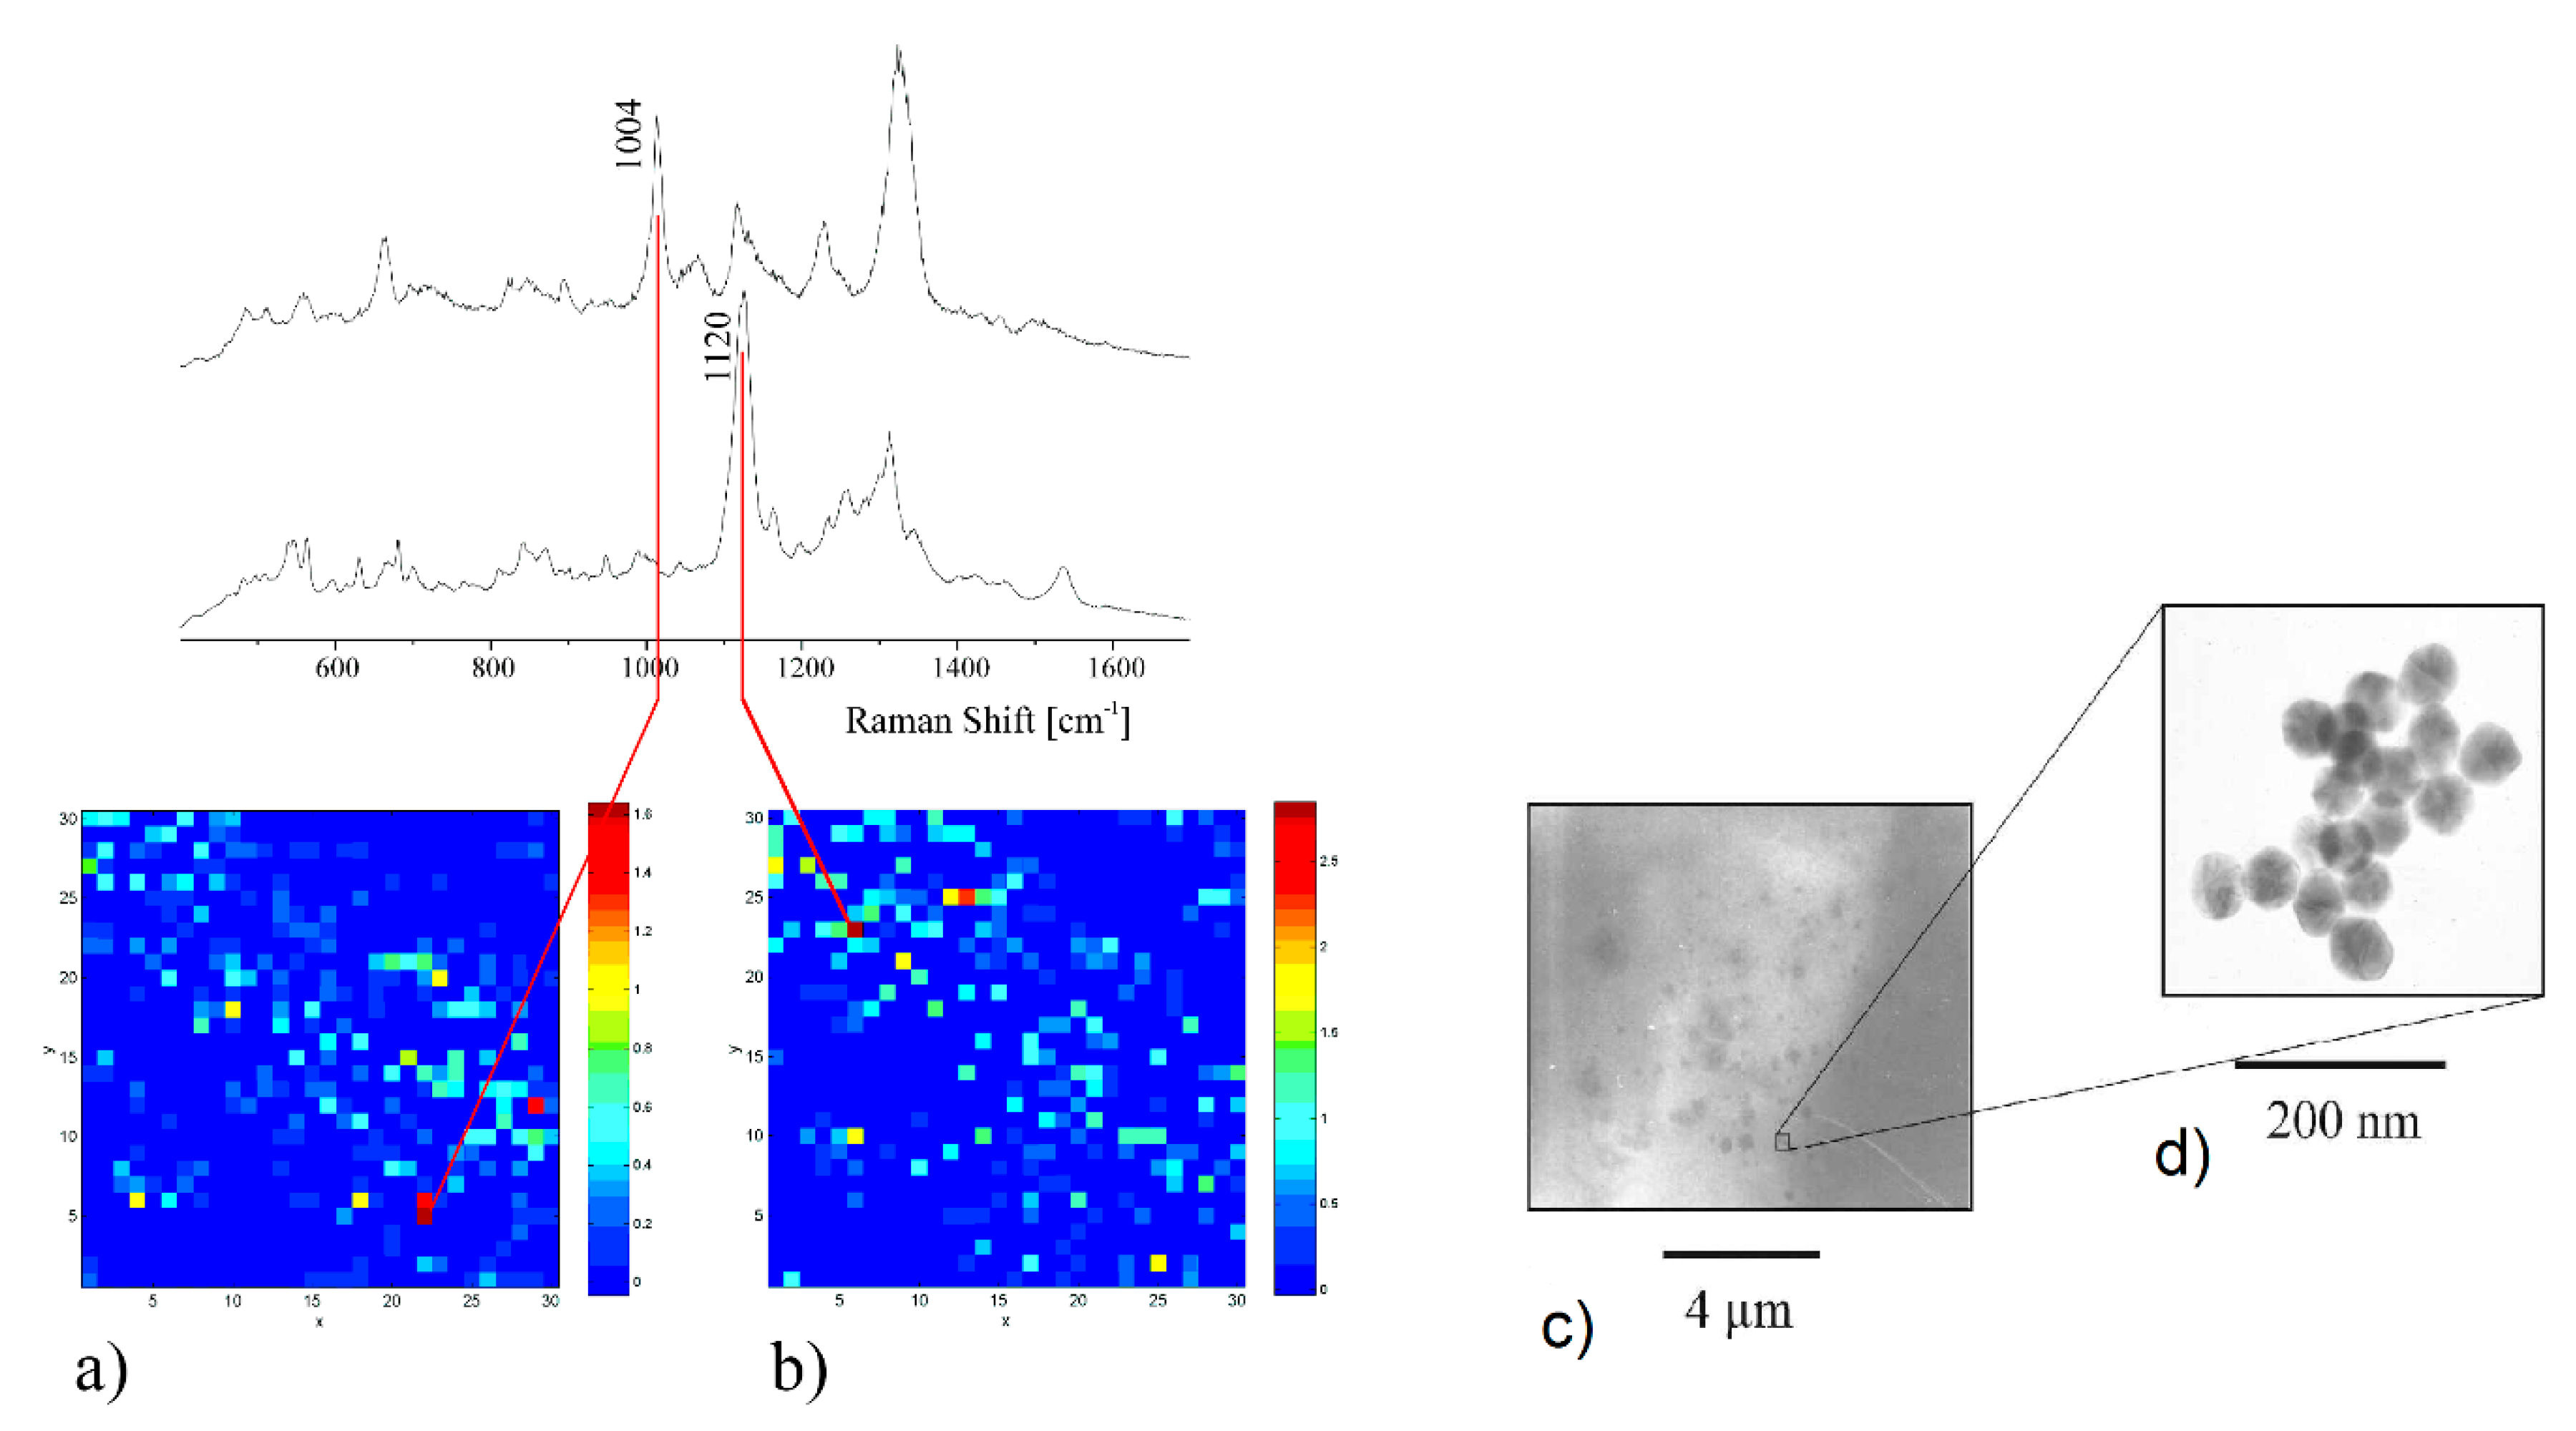
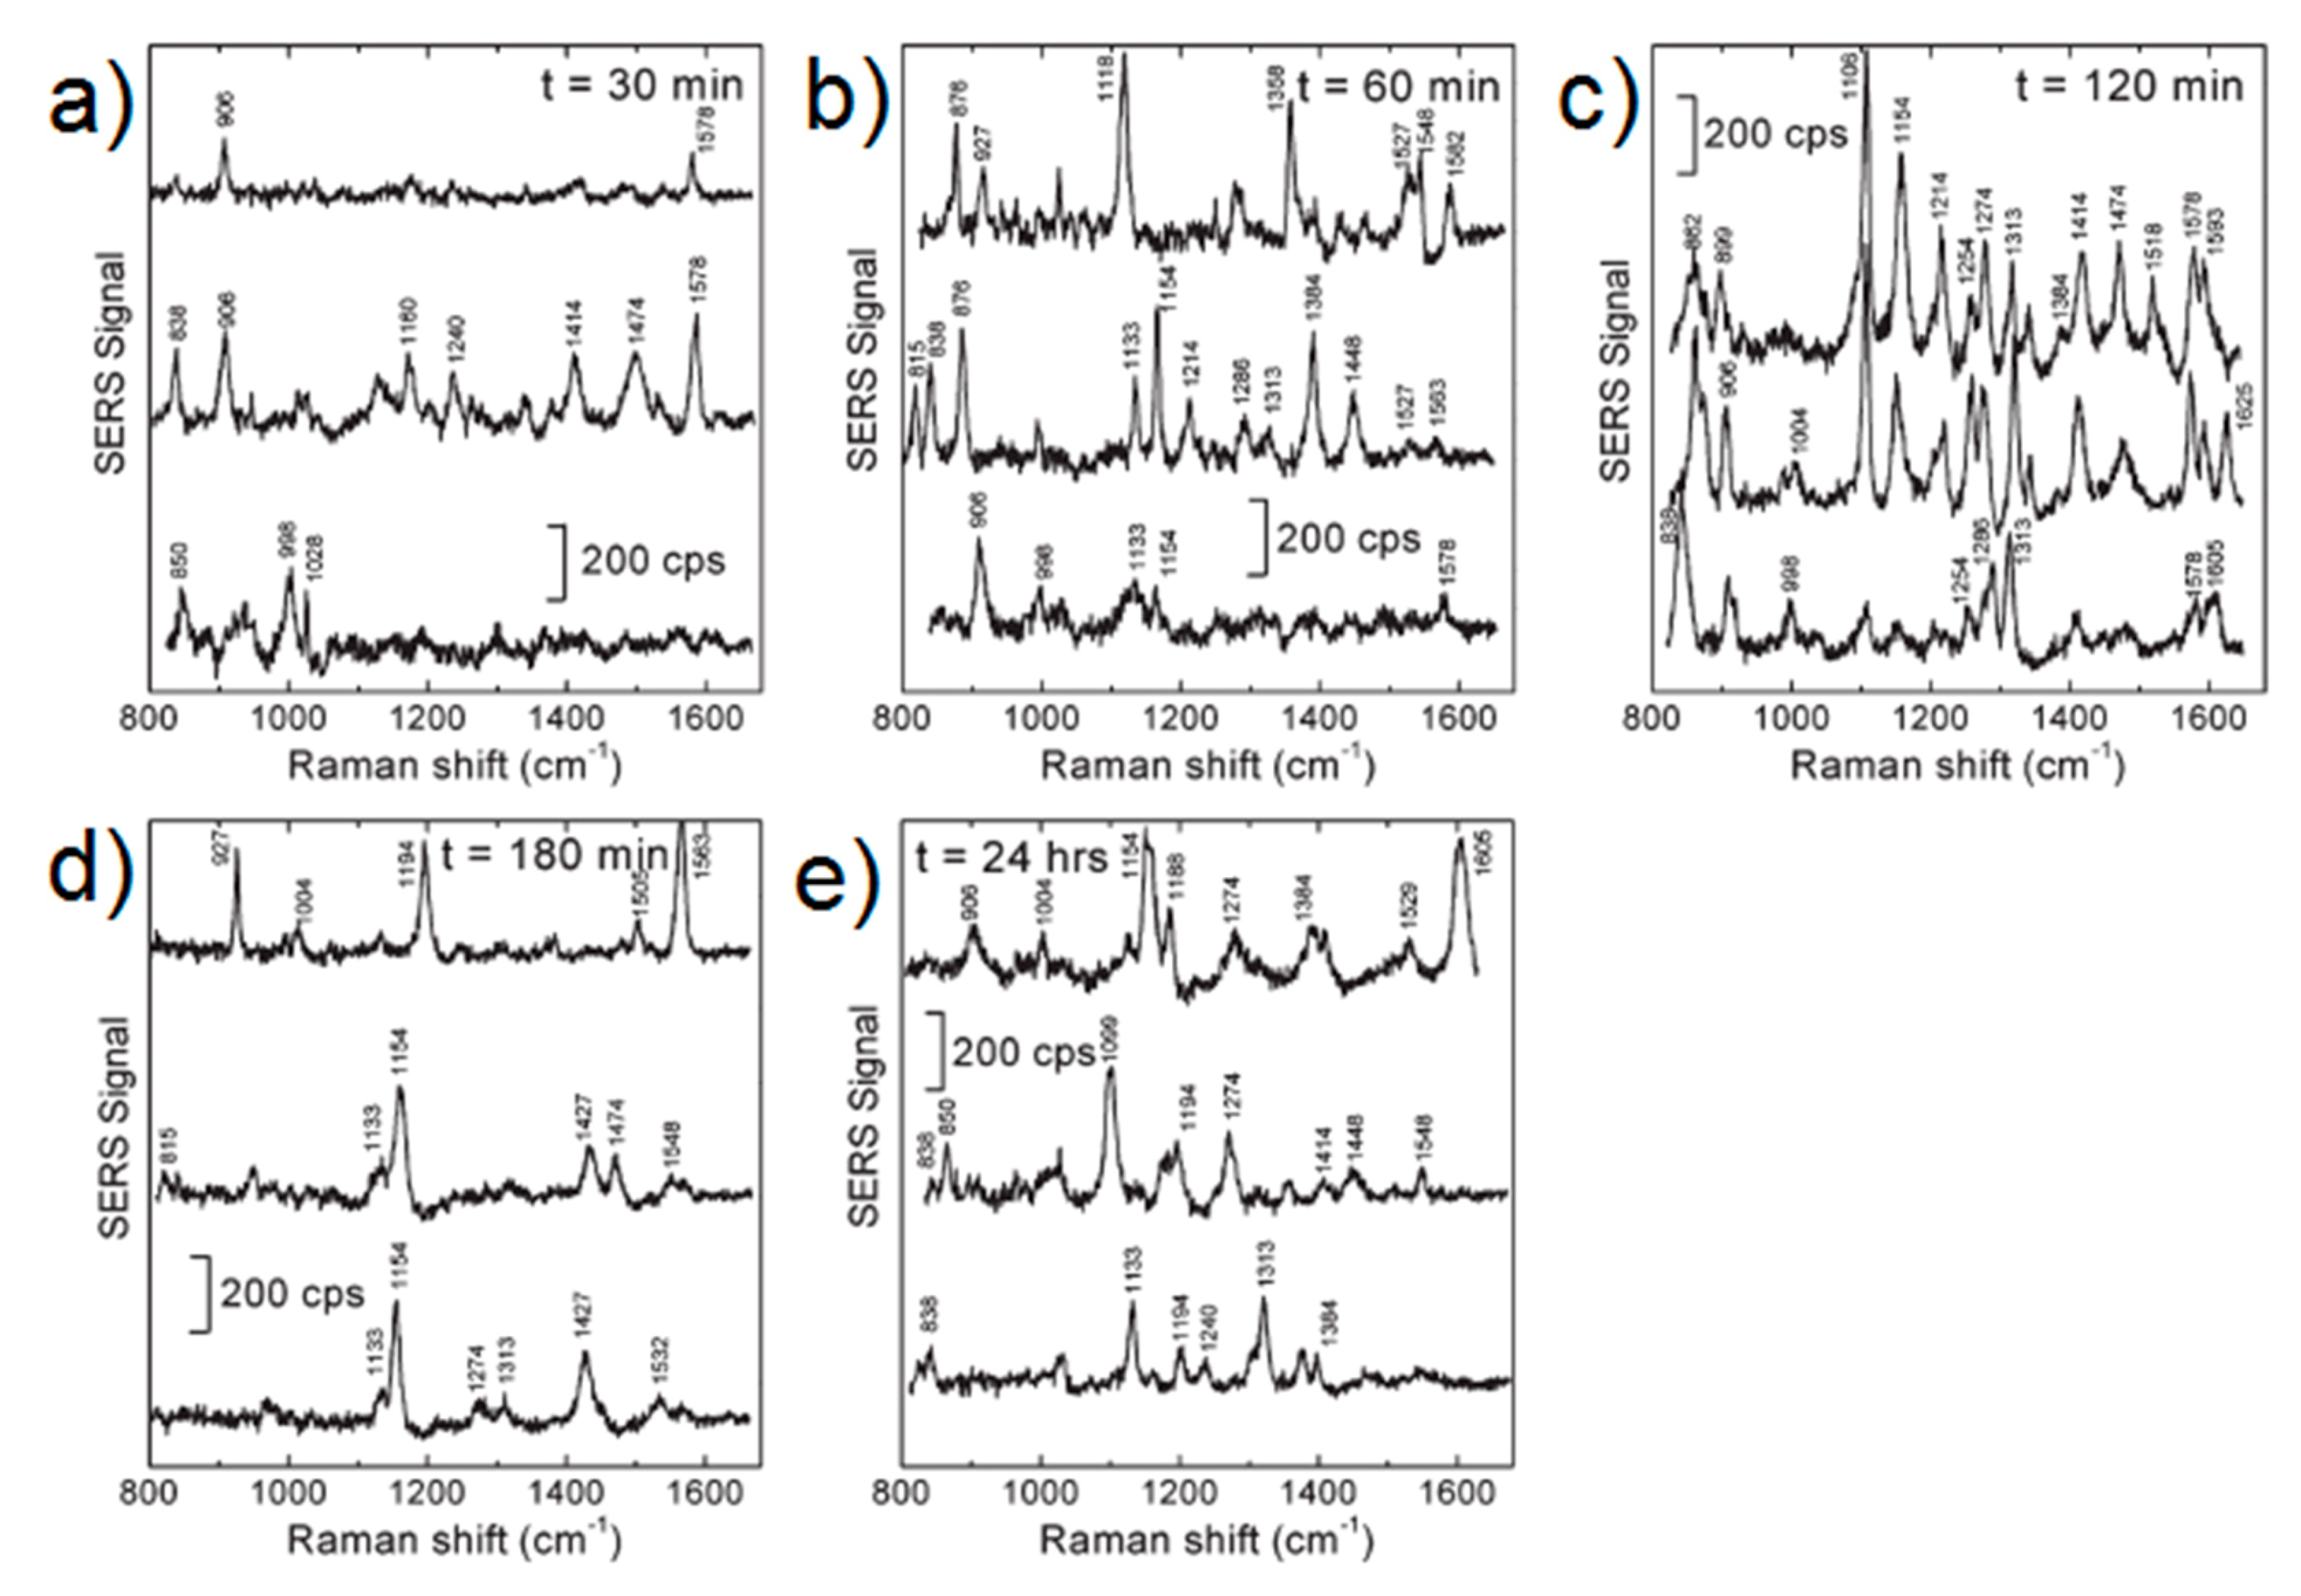
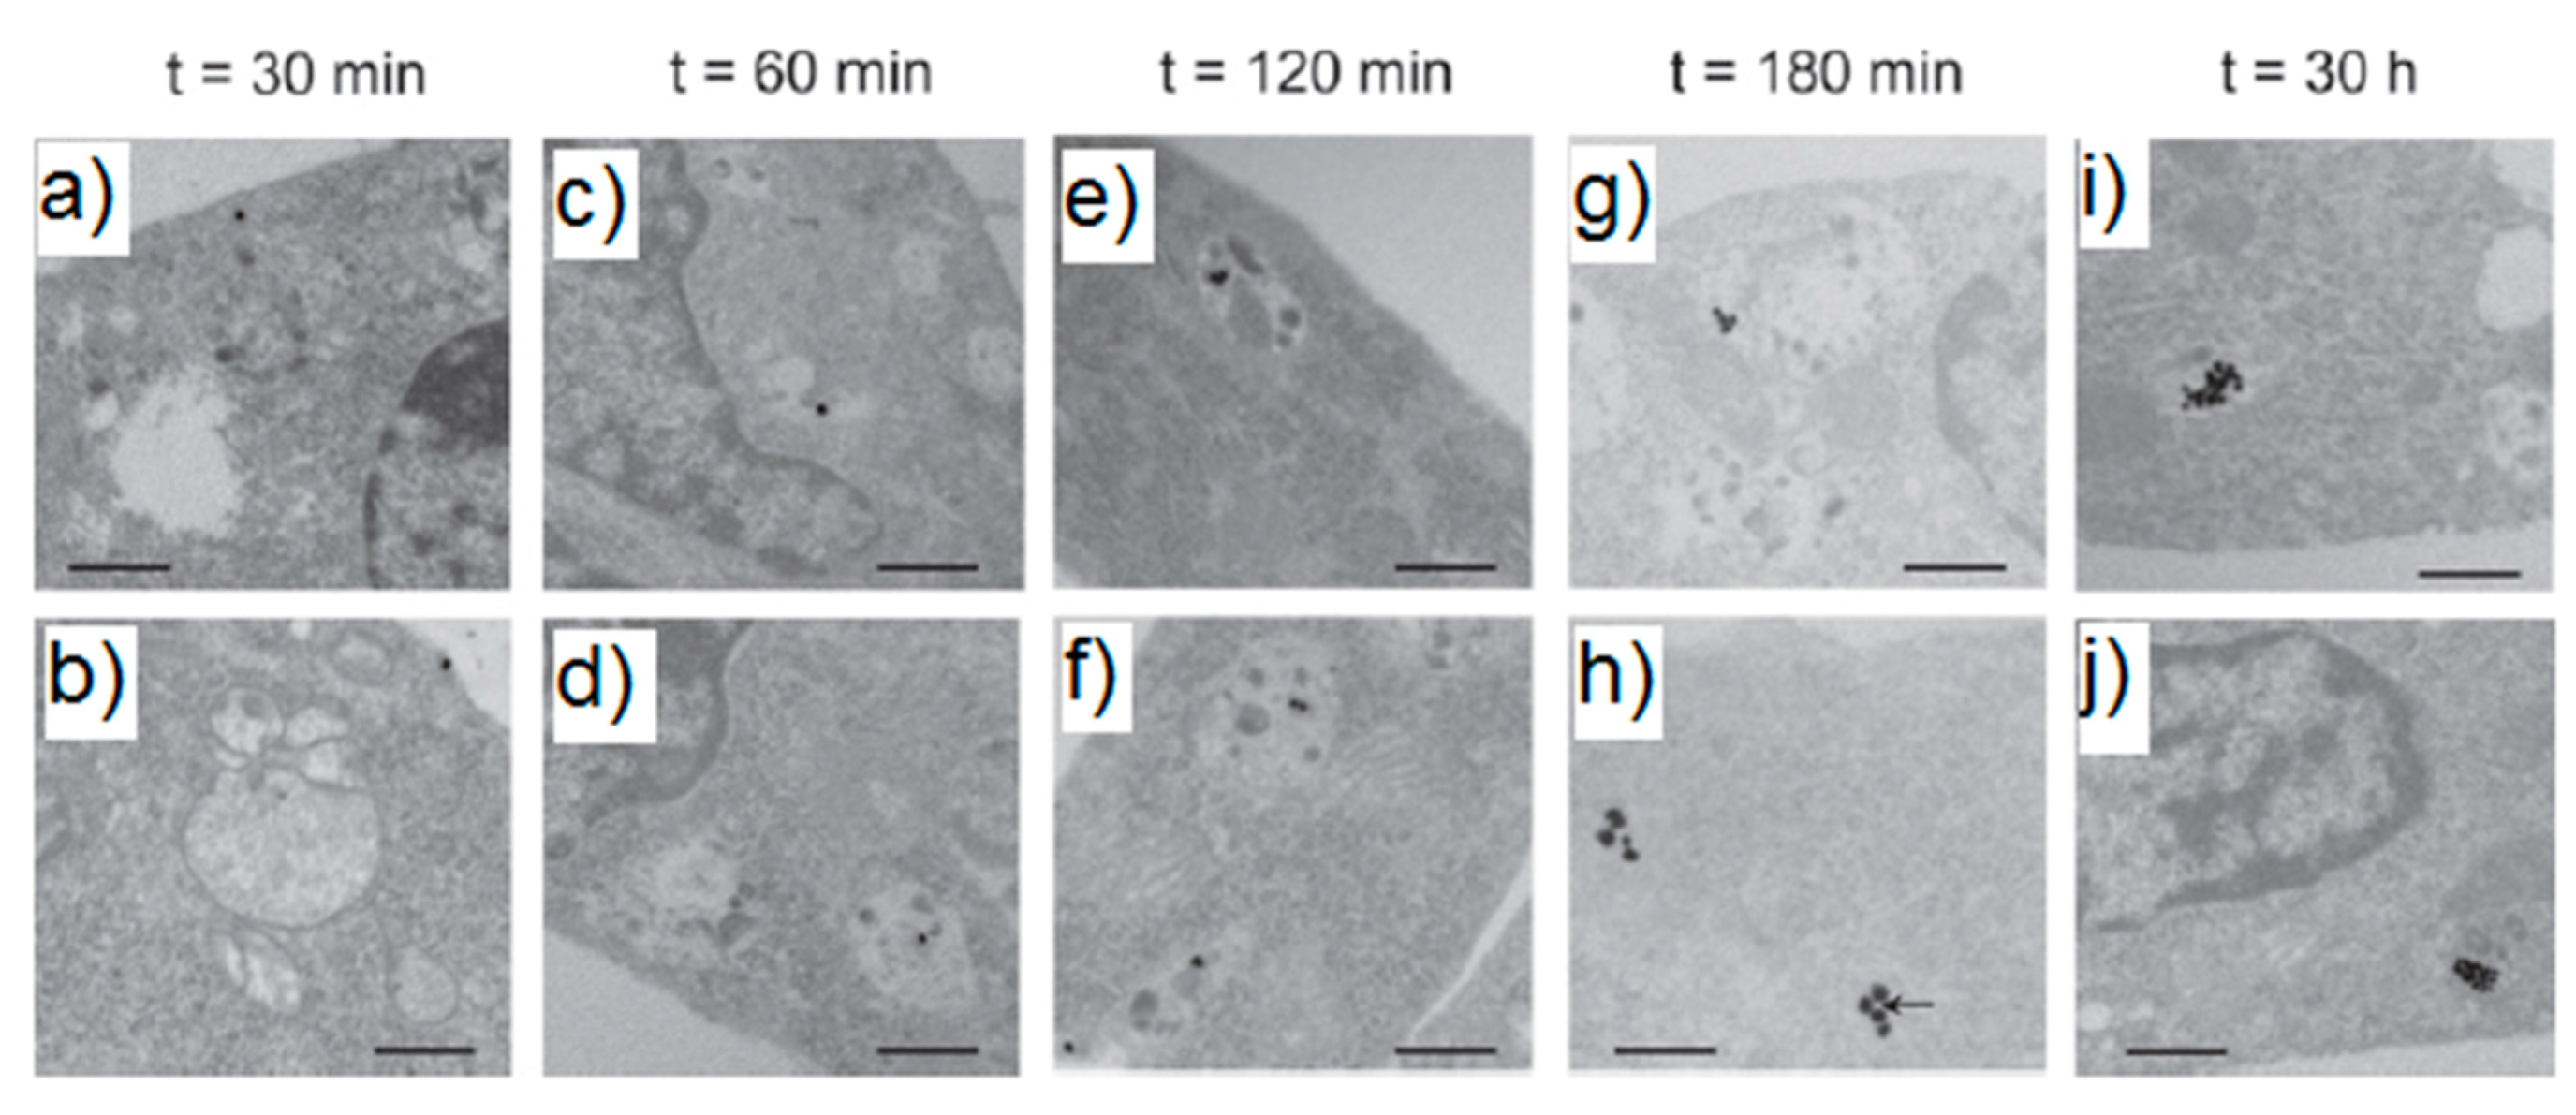
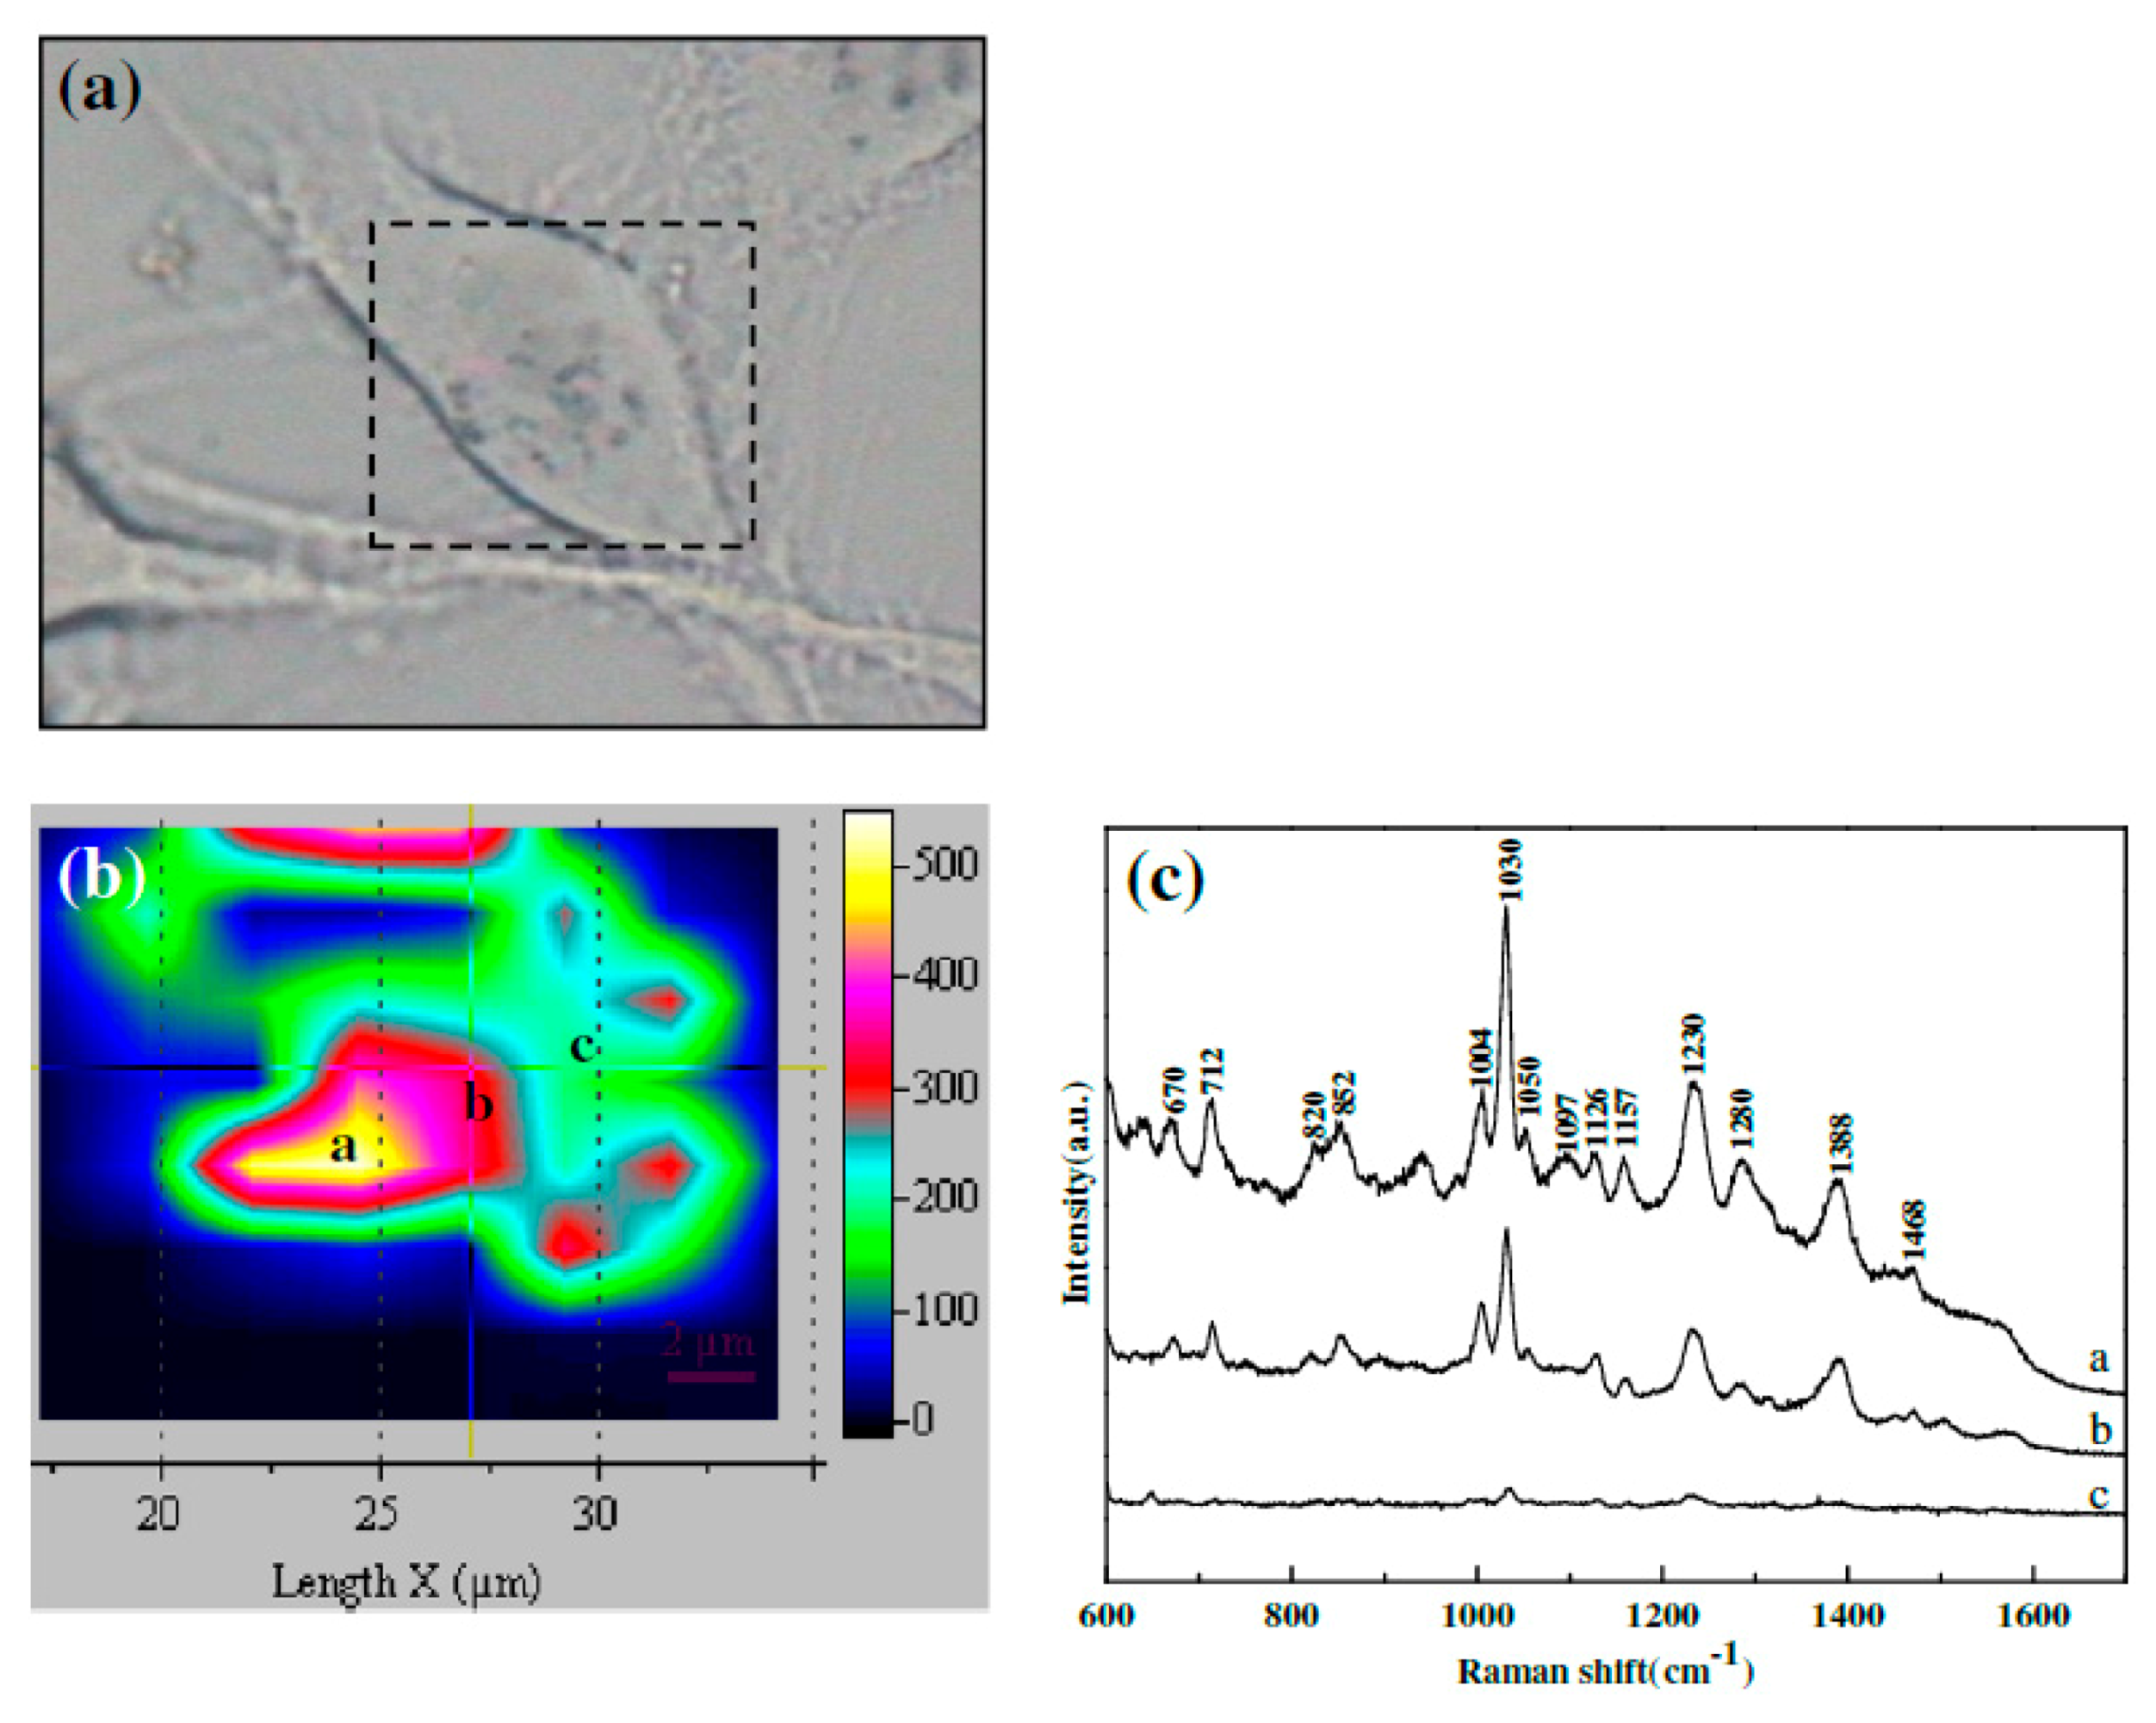
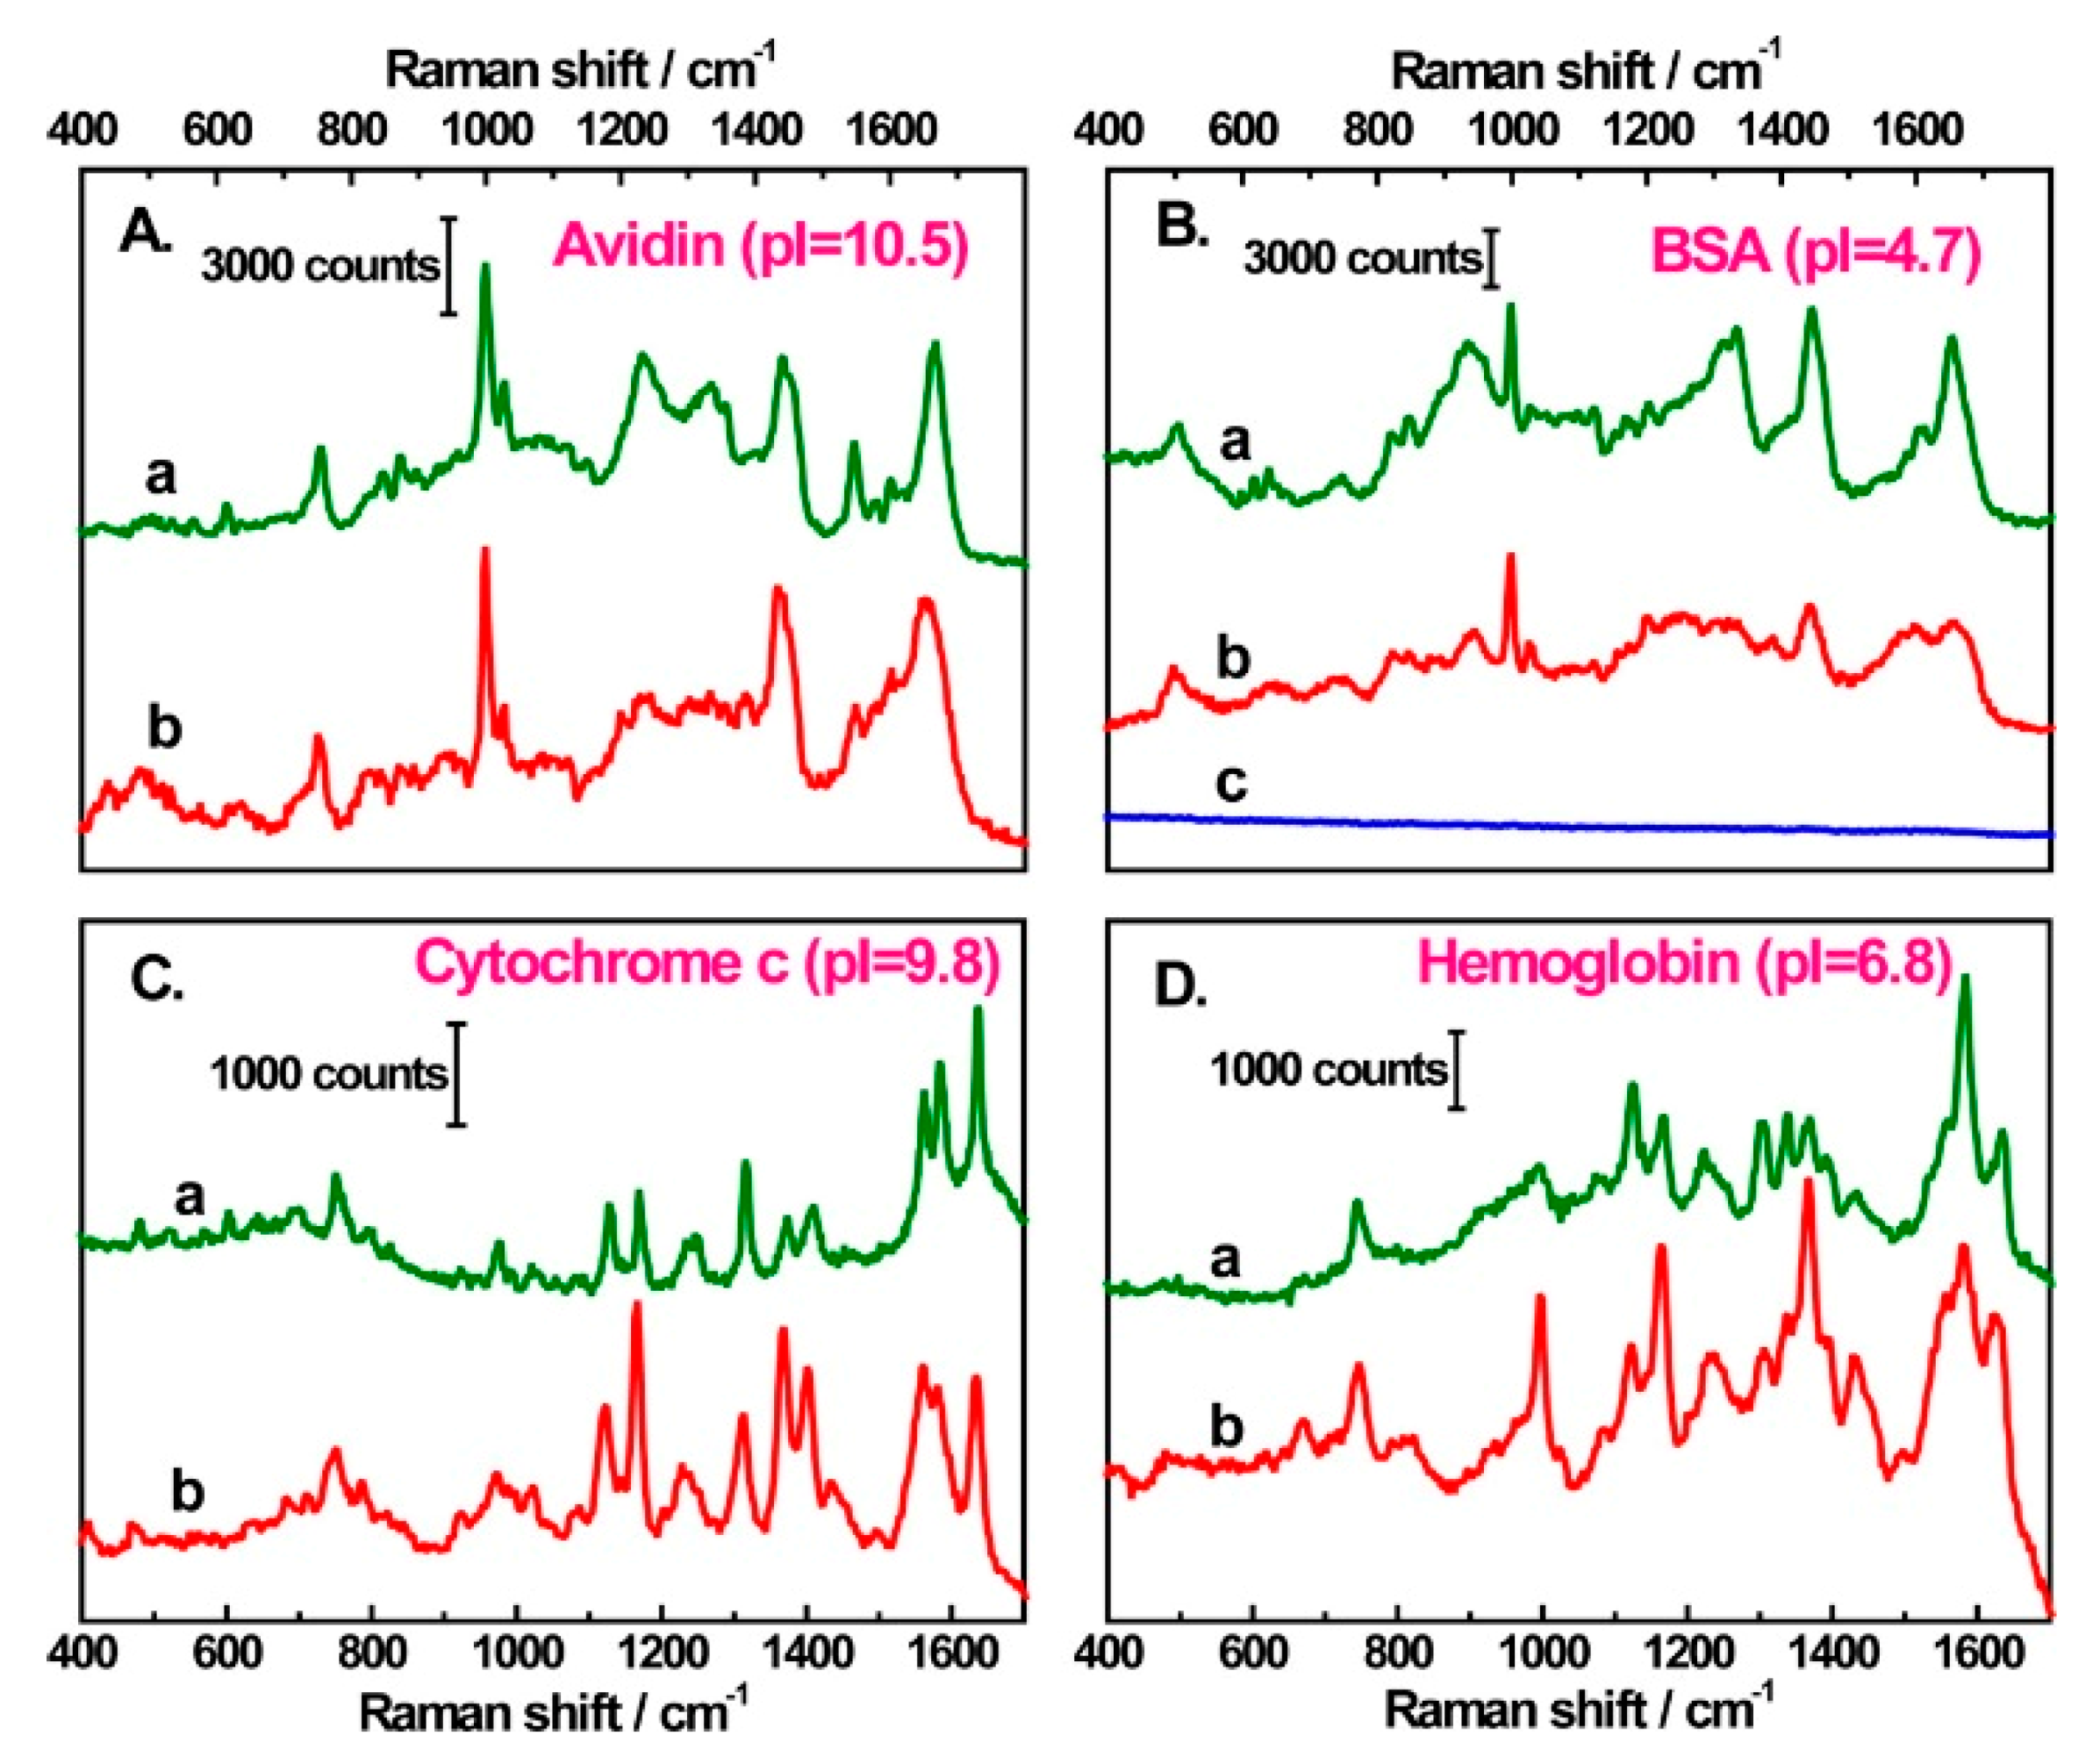
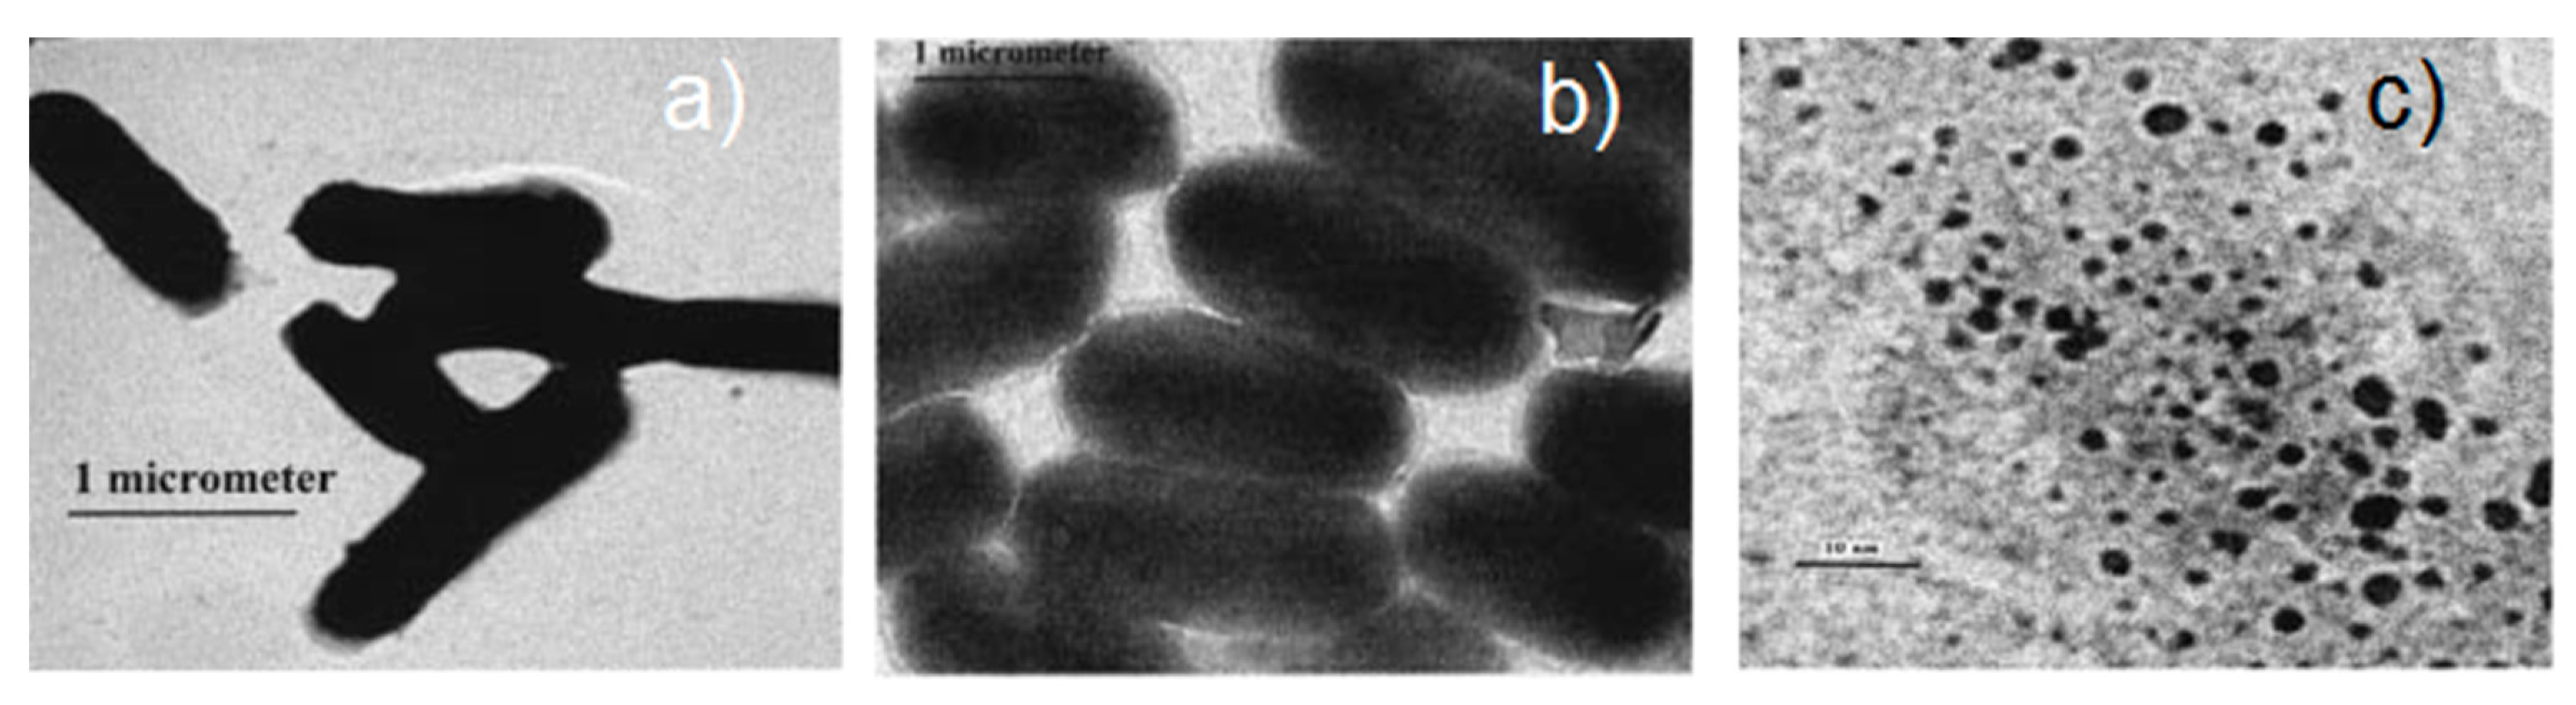
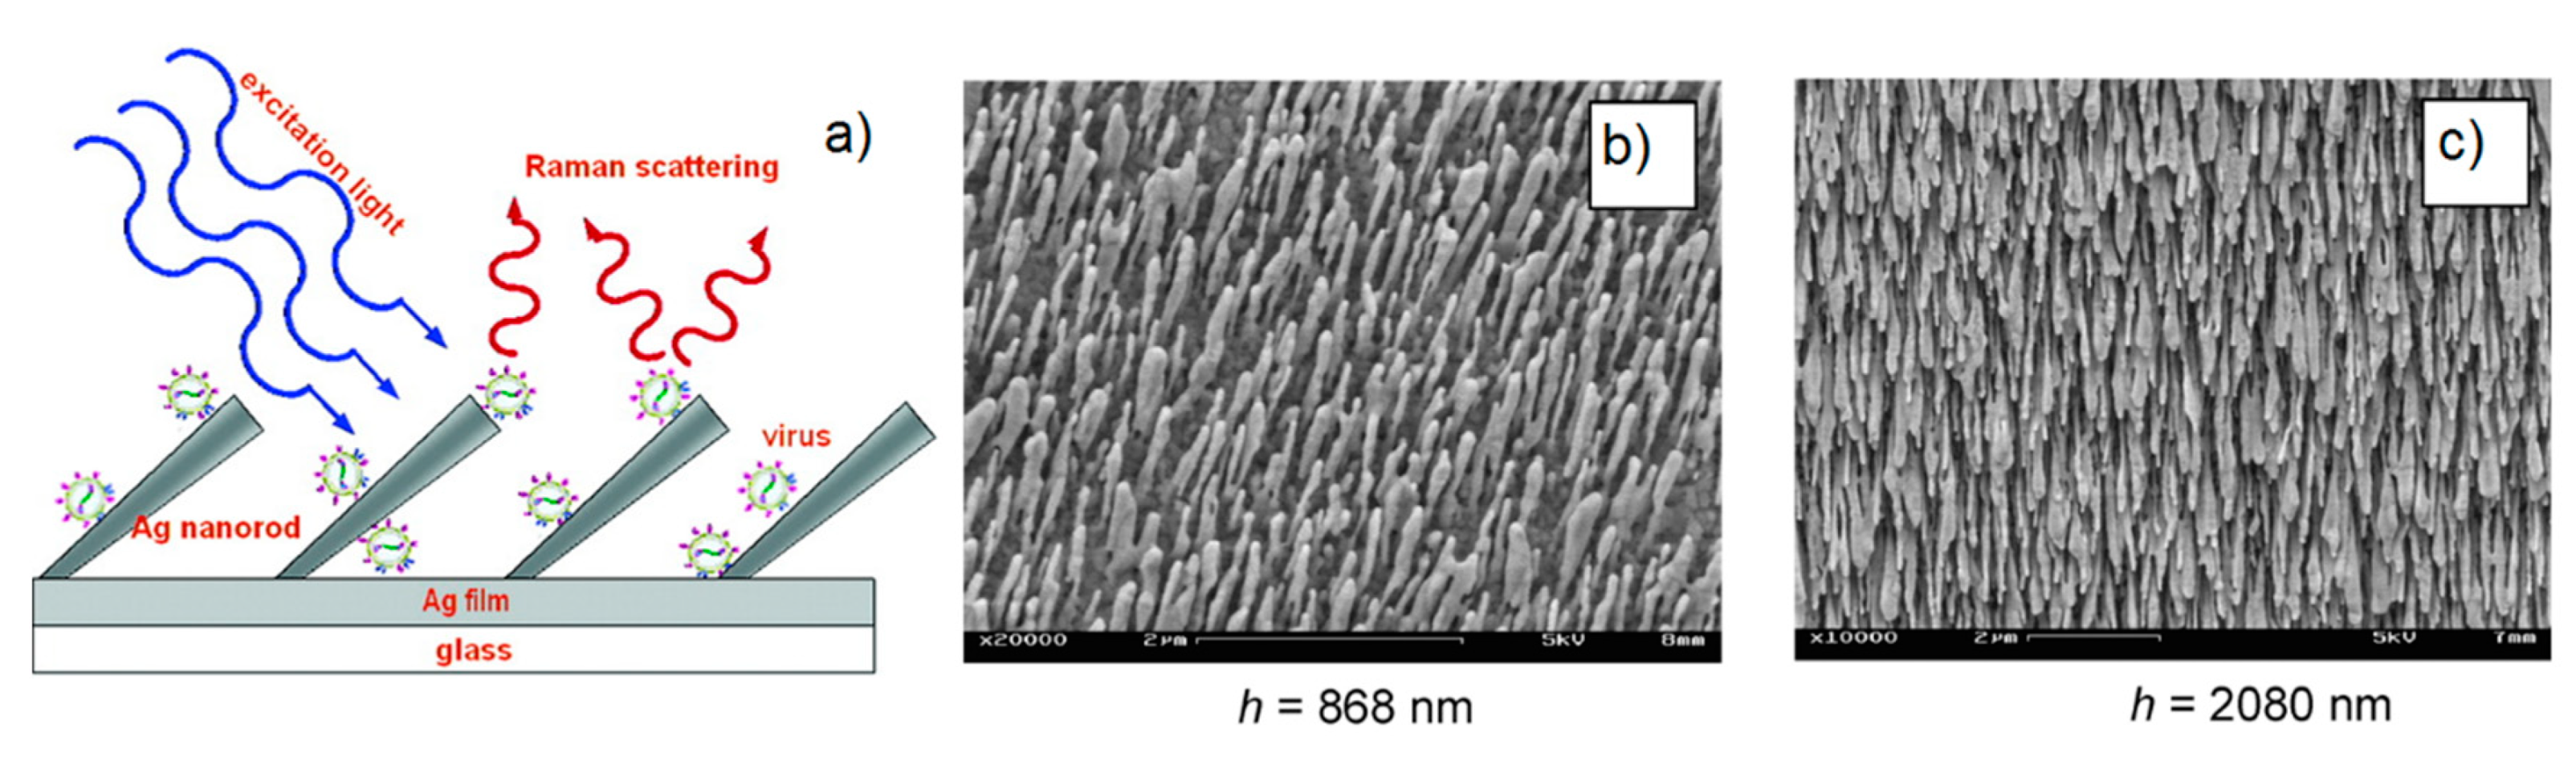
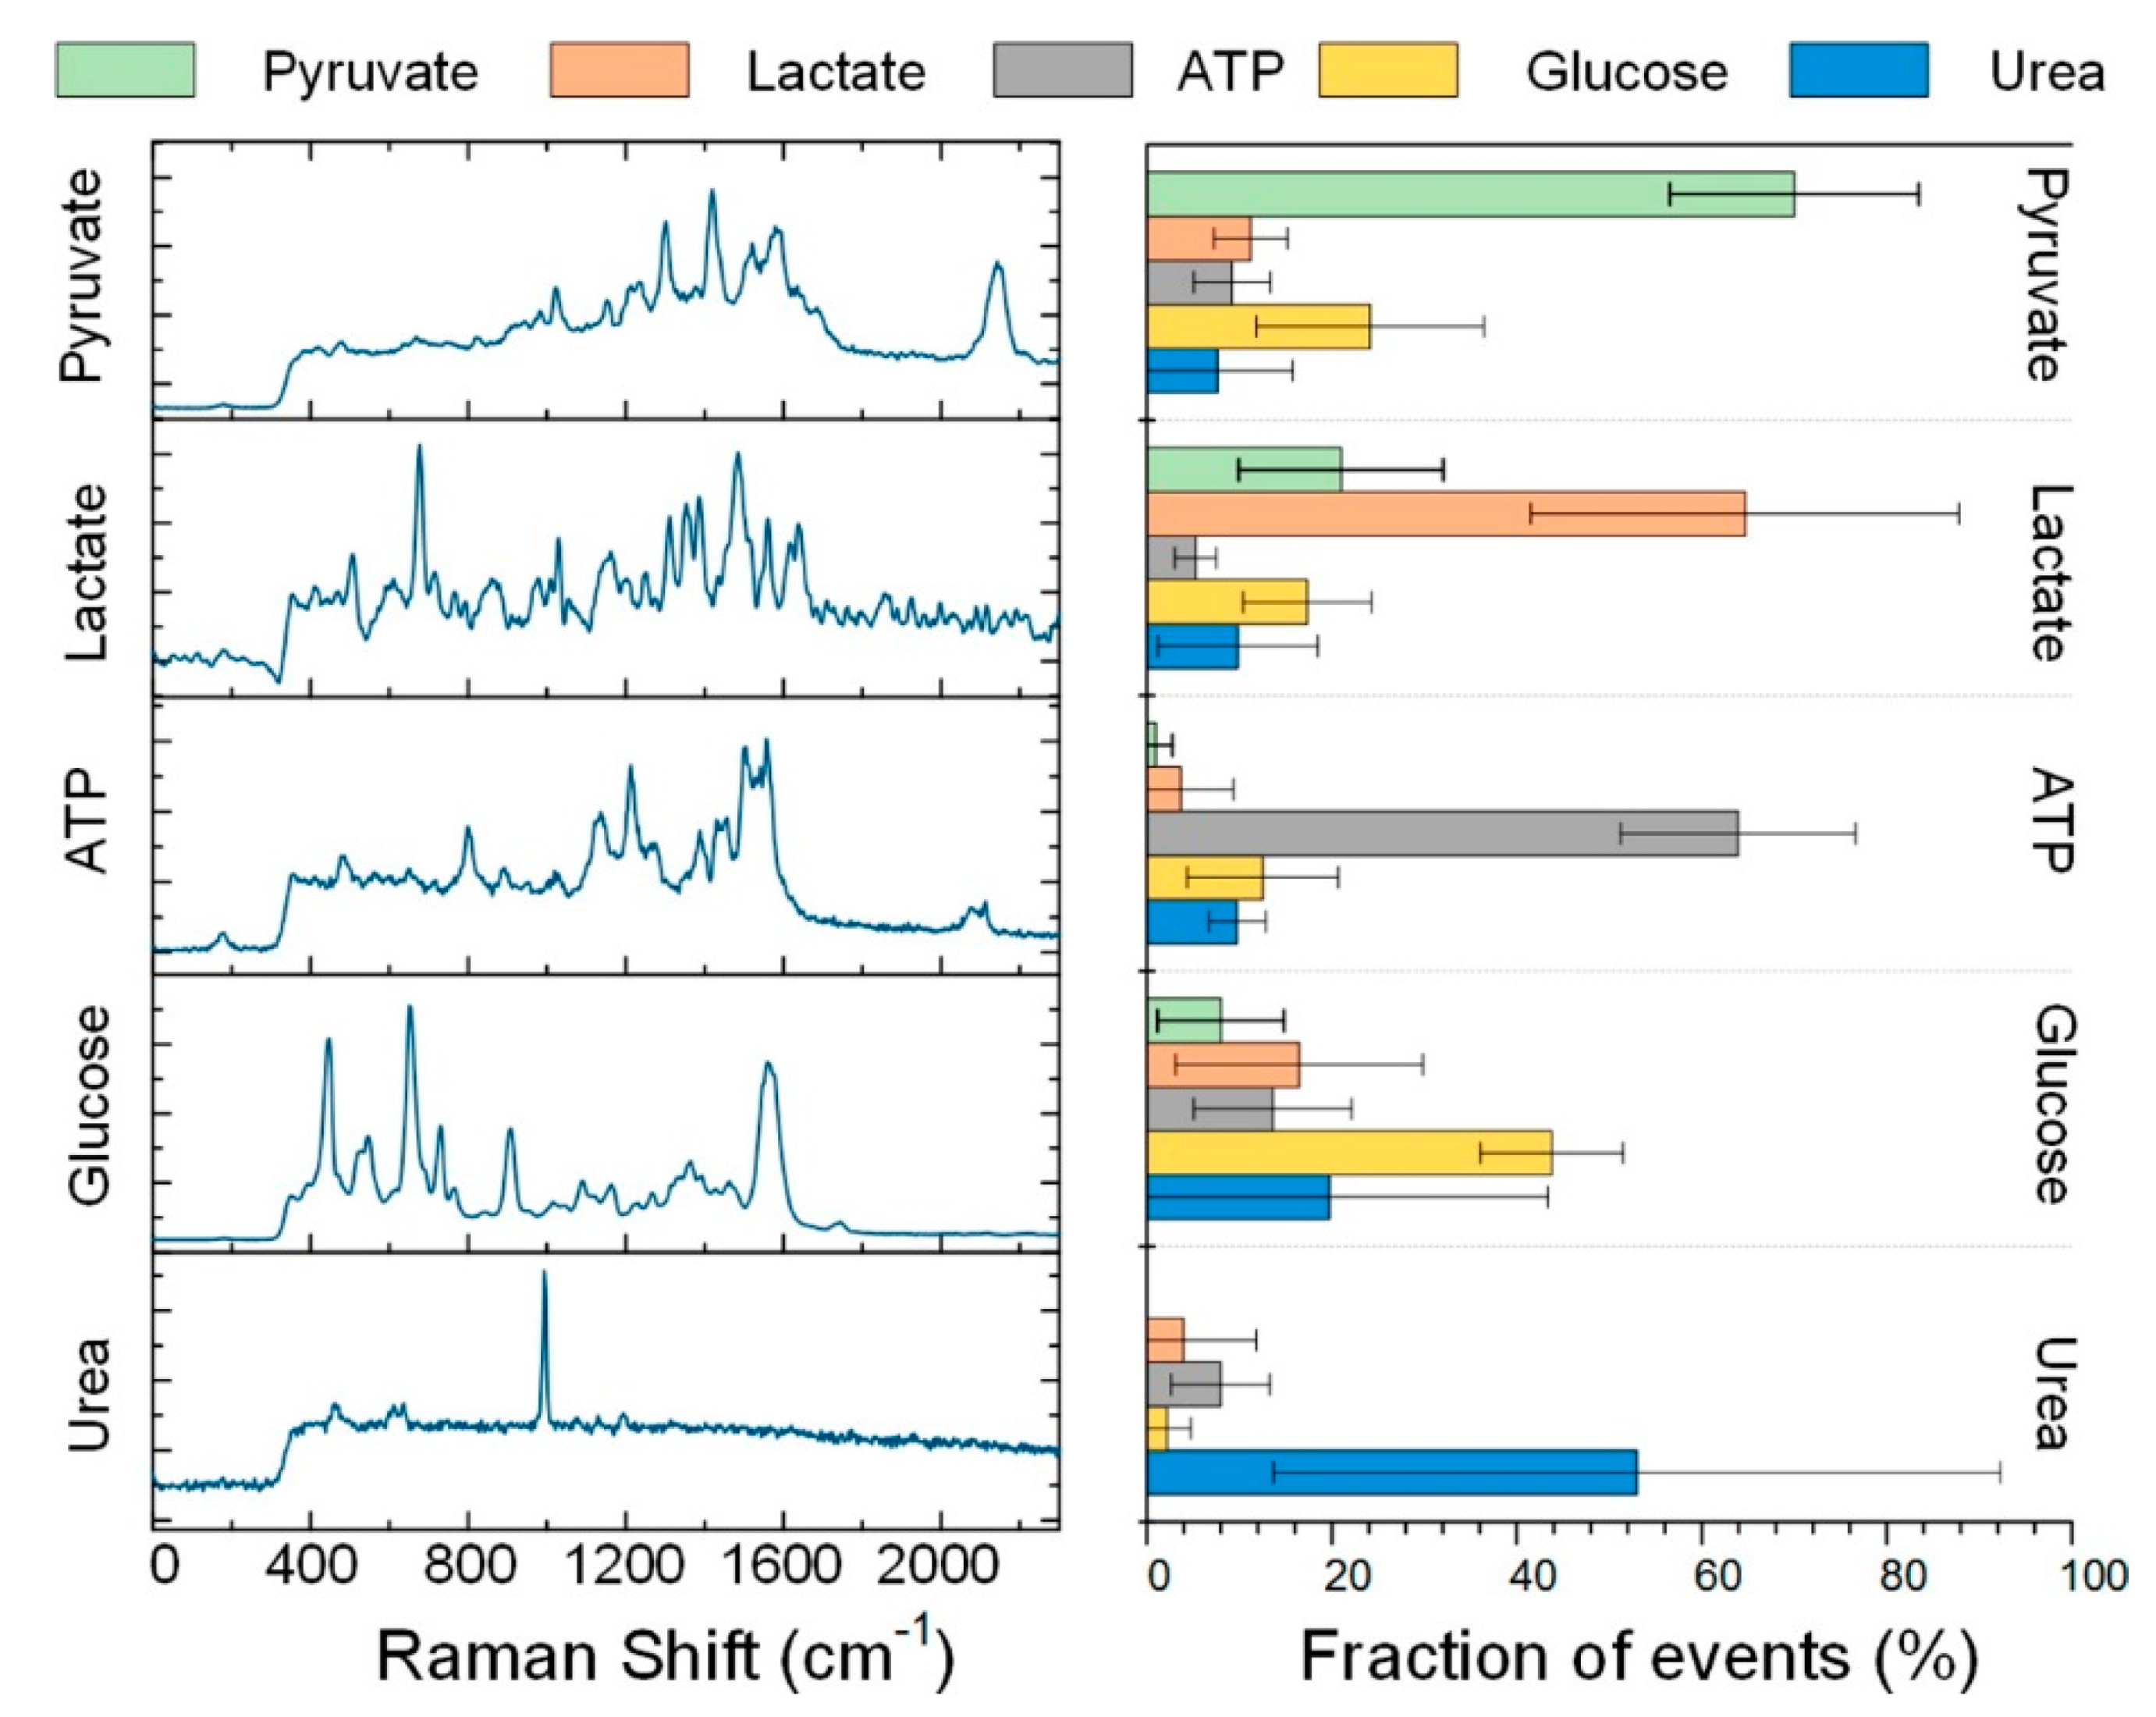
| Approx. Max. Value | Note | Ref. | |
|---|---|---|---|
| Averaged over the substrate | [16,115] | ||
| In a hot spot | [116] | ||
| Atomic scale roughness | [5,10,115,117] | ||
| Charge transfer resonance | [9] |
| Metal | ||
|---|---|---|
| Gold | 8.9 eV (139 nm) | 2 eV (620 nm) |
| Silver | 9.2 eV (135 nm) | 4 eV (310 nm) |
| Aluminum | 12.7 eV (98 nm) | 1.4 eV (886 nm) |
| Copper | 8.7 eV (142 nm) | 2 eV (620 nm) |
| Substrate | Spacer | Range [nm] | Probe | Ref. |
|---|---|---|---|---|
| Rough Ag film | Linear aliphatic thiols | 0.8–2.5 | –CH3 groups of aliphatic thiols | Compagnini et al. [237] |
| Rough Ag foil | Linear aliphatic thiols | 1.6–2.8 | t-butylbenzene | Kennedy et al. [238] |
| Ag islands | Langmuir-Blodgett films of arachidic acid | 0.85–14 | Phtalocyanine | Kovacs et al. [235] |
| Ag-FON | Al2O3 | 0–3 | Trimethyl aluminum | Masango et al. [236] |
| Ag nanorods | DNA oligomers | 1–6 | Adenine | Marotta et al. [239] |
| Rough Ag film | PMMA | 0–12 | p-nitrobenzoic acid | Murray et al. [240] |
| System | Far Field Quantities | Reference |
|---|---|---|
| Solid substrates (Experimental) | ||
| Au nanoparticles (NPs) | Extinction, scattering | D’Andrea et al. [256] |
| Single Au dimers and trimers | Scattering | Kleinman et al. [26] |
| Ag nanopillar array | Extinction | McFarland at al. [126] |
| Ag nanopillar array | Extinction | Michieli et al. [127] |
| Au nanocylinder array | Extinction | Guillot et al. [284] |
| Au elongated NP array | Extinction | Félidj et al. [285] |
| Au nanocylinder array | Extinction | Colas et al. [286] |
| Au nanopillar and nanotube array | Extinction | Doherty et al. [287] |
| Solution (Experimental) | ||
| Ag spherical NPs | Extinction, scattering | Von Raben et al. [279] |
| Extinction | Fornasiero et al. [280] | |
| Extinction | Kerker et al. [281] | |
| Extinction | Feilchenfeld et al. [282] | |
| Extinction | Le Ru et al. [283] | |
| Silica (core)-Au (shell) NPs | Extinction, absorbance | Weber et al. [255] |
| Ag-Au nanocages | Extinction | Pilot et al. [225] |
| Ag nanowires | Extinction, absorbance | Becucci et al. [288] |
| Simulations/Modelling | ||
| Ag, Au, Cu spherical NPs | Extinction, absorption, scattering | Messinger et al. [158] |
| Au nanospheres, Au-silica nanoshells, Au homo and hetero dimers | Extinction, scattering | Cacciola et al. [289] |
| Au spherical NPs | Extinction | Zuloaga et al. [290] |
| Ag spherical NPs and dimer | Extinction | Le Ru et al. [116] |
| Visible | Near-Infrared | |
|---|---|---|
| − | + | |
| Analyte cross-section | + | − |
| Instrument sensitivity | + | − |
| Reduced fluorescence interference | − | + |
| Transparency window | − | + |
| Feature | Suggested Benchmark | Notes |
|---|---|---|
| High average enhancement | Larger enhancements allow more sensitive and/or faster analysis. | |
| Uniformity | Variations < 20% | Uniform and reproducible substrates make the work of the practitioner much easier, since one does not need to try several spots to find the most efficient one, and results are reproducible from substrate to substrate. Both these features are crucial if quantitative measurements are to be performed. Large areas are particularly useful with portable instruments, since they are normally not coupled to a microscope. |
| Reproducibility | Variations < 20% | |
| Large area | Some mm2 | |
| Stability | Substrates should preserve a good performance for a sufficient time (say a month) after fabrication. Moreover, they should not be degraded by the solvents (or other agents) they get in touch with under working conditions. | |
| Ease of fabrication/low cost of production | Low-cost and scalable fabrication methods for substrates are crucial for a widespread diffusion of the SERS technique. | |
| Cleanliness of the surface | The surface of the substrate should not have residual contaminants from the fabrication process. |
| Substrate | Synthesis/Fabrication | References |
|---|---|---|
| Aggregated NPs in solution (unstructured nanoparticles) | Wet chemistry (NP synthesis) | [39,40,308,309,310,311,312,313,314,315,316,317,318,319,320,321,322,323] |
| Laser ablation (NP synthesis) | [324,325] | |
| Molecular linkers (aggregating method) | [326,327,328] | |
| Laser tweezers (aggregating method) | [329] | |
| NPs assembled on a surface (structured nanoparticles) | Electrochemical roughening/deposition | [37,330] |
| Deposition on functionalized surfaces | [42,331,332,333] | |
| Ink-jet printing | [334,335,336,337] | |
| Screen printing | [338,339] | |
| Pen on paper | [340] | |
| Electrospinning | [341,342,343] | |
| Laser direct writing | [344,345] | |
| Ordered array of NPs (structured surfaces) | Anodic alumina template | [346,347,348,349,350,351] |
| Electron beam lithography (EBL) | [43,44,45,352,353,354] | |
| Interference lithography | [355,356] | |
| Soft lithography | [46,357,358,359,360] | |
| Commercial substrates | [361,362,363,364,365,366,367] |
| SERS Substrate | Ref. | |
|---|---|---|
| MicroRNA and family members | Ag NR arrays | [450] |
| ssRNA bases: adenine cytosine | Ag NPs in microfluidic devices | [451] |
| RNAs: complimentary duplexes, short hairpin and small RNAs, and to diversify microRNA sequences | Positively charged spermine coated Ag NPs | [452] |
| ssDNA | Al nanocrystals | [184] |
| Cell structure distribution of phenylalanine and DNA | Au NPs, 60 nm diameter | [453] |
| Endosomal system of cultured eukaryotic cells | Au NPs, 30–50 nm diameter | [454] |
| Gastric cancer detection in blood plasma | Ag NPs, 34 nm diameter | [455] |
| Phenylalanine, tyrosine, tryptophan adenine, guanine (in DNA) | Ag NPs | [456,457] |
| Phenylalanine in human breast cancer cells | Au NPs | [456] |
| RNA biomarkers long amplicons RNA extracted from urine to detect prostate cancer | Ag NPs | [458] |
| Metabolite secretion from MDCKII cells | Borosilicate nanopipettes decorated with Au NPs | [459] |
| Cytochromes | Ag electrodes | [460] |
| Myoglobin | Immobilized Ag NPs, size 100 nm | [461] |
| Myoglobin and BSA | Ag NPs adsorbed on a nitrocellulose membrane | [462] |
| Heme-proteins | Ag NPs | [463] |
| Oligonucleotides | Ag NPs | [464] |
| Hen egg white lysozyme, avidin, cytochrome c, hemoglobin, BSA | Iodine-modified Ag colloids | [465] |
| Escherichia coli | Ag NPs | [466] |
| Respiratory human viruses | Ag NR arrays | [467] |
| Escherichia coli O157, Salmonella typhimurium, and Staphylococcus aureus | Ag nanocrystals (60–80 nm diameter) assembled on Ag NPs | [468] |
| Nine different Escherichia coli strains | Ag NPs in microfluidic devices | [63] |
| Listeria monocytogenes bacteria | Ag-Au bimetallic substrates | [469] |
| Recognition Unit | SERS Substrate | Ref. | |
|---|---|---|---|
| Viral DNA | DNA Hairpin | Au NPs | [470] |
| RSAD2 gene | DNA Hairpin | Nanowave Chip | [471] |
| microRNA | Molecular Beacon | Ag NPs | [472] |
| miR-21 | ssDNA | Au NRs on Au substrate | [473] |
| ssDNA | AuNPs@SiNWAr | [474] | |
| Modifications in ssDNA | DNA targeting BRCA1 | Au-coated magnetic NPs on rGO on Au electrode | [475] |
| Bacterial DNA | Probe, target, and reporter DNA | Au NP-on-wire | [476] |
| CEA, AFP | Antibodies | Sandwich Au honeycomb array + Au nanostars | [477] |
| Pathogenic bacteria | Antibiotics | Nanoscopic Ag substrate + electrodeposited Ag-Au layer | [478] |
| Intracellular pH | Mercaptobenzoic acid (MBA) | Ag-MBA@SiO2 | [479] |
| Intracellular pH | (Cr(CO)3–ATP) | Au-coated planar substrate | [480] |
| Intracellular and extracellular redox potential of neural cells | Dopamine | ITO electrode + hexagonally packed Au nanodots | [481] |
| Pancreatic cancer biomarker (MUC4) | MUC4 Antibody | Au NPs | [482,483] |
| CEA, human IgG | 4-mercaptobenzoic acid (4-MBA) + antibody | Ag NR arrays on glass | [484] |
| VEGF | DNA Aptamer | Si-encapsulated hollow Au nanospheres and an Au-patterned microarray substrate | [485] |
| PSA | Antibody | MWCNTs/IL/chitosan + AuNPs-PAMAM | [486] |
| PSA | PSA Aptamer | Core-satellite magnetic NP (core)/Au NPs satellites | [487] |
| PSA | PSA Antibody | Sandwich Au Nanospheres on Au substrate | [488] |
| p53 and EGFR | P53 + EGFR antibodies | Si substrate + Ag nanopillars | [489] |
| PSA, thrombin, and Mucin-1 | Aptamers | Self-assembled Ag NP pyramids on SERS substrate + SERS tags | [490] |
| Anti-gp41 antibody (HIV biomarker) | gp41 | Microfluidic chip encoded with 2D LSPR structures of Au NPs | [491] |
© 2019 by the authors. Licensee MDPI, Basel, Switzerland. This article is an open access article distributed under the terms and conditions of the Creative Commons Attribution (CC BY) license (http://creativecommons.org/licenses/by/4.0/).
Share and Cite
Pilot, R.; Signorini, R.; Durante, C.; Orian, L.; Bhamidipati, M.; Fabris, L. A Review on Surface-Enhanced Raman Scattering. Biosensors 2019, 9, 57. https://doi.org/10.3390/bios9020057
Pilot R, Signorini R, Durante C, Orian L, Bhamidipati M, Fabris L. A Review on Surface-Enhanced Raman Scattering. Biosensors. 2019; 9(2):57. https://doi.org/10.3390/bios9020057
Chicago/Turabian StylePilot, Roberto, Raffaella Signorini, Christian Durante, Laura Orian, Manjari Bhamidipati, and Laura Fabris. 2019. "A Review on Surface-Enhanced Raman Scattering" Biosensors 9, no. 2: 57. https://doi.org/10.3390/bios9020057
APA StylePilot, R., Signorini, R., Durante, C., Orian, L., Bhamidipati, M., & Fabris, L. (2019). A Review on Surface-Enhanced Raman Scattering. Biosensors, 9(2), 57. https://doi.org/10.3390/bios9020057