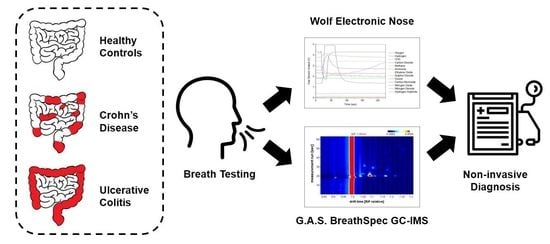
1. Introduction
Inflammatory bowel disease (IBD) is a chronic condition of unknown aetiology, which includes Crohn’s disease (CD) and ulcerative colitis (UC) [
1]. Both conditions involve inflammation of the gut and are particularly unpleasant. While UC only affects the colon (large intestine), CD can affect any part of the digestive system from the mouth to the anus [
2]. IBD is a common condition in the Western world, affecting over 250,000 people in the UK and 28 million worldwide [
3]. The estimated annual cost of treatment, per patient, is approx. €30,000 with an average of 20% loss of working productivity [
1,
4]. This is due to the relapsing nature of the disease—there may be times when the symptoms are severe (flare-ups), followed by long periods when there are few or no symptoms at all (remission). Common symptoms include diarrhoea, cramping pains in the abdomen, vomiting, weight-loss and fatigue [
5]. In addition to this, IBD has a damaging impact on psychosocial functioning, quality of life, and significant personal cost of delayed treatment [
6]. A study from 2014, conducted in the UK, revealed that 10% of IBD patients are initially misdiagnosed with other gastrointestinal conditions, such as irritable bowel syndrome (IBS), and that 3% of misdiagnosed cases persisted for five or more years [
7]. Misdiagnosis can have serious consequences for the patient; especially for those with CD, since delays are correlated with an increased risk of later bowel stenosis and CD-related intestinal surgery [
7]. Early diagnosis of IBD remains a clinical challenge, with current tests being invasive and costly. Diagnostic tools for CD and UC include a thorough history, endoscopic investigations with histological examination, faecal inflammatory markers, capsule endoscopy and imaging [
8]. Colonoscopy with histology is considered the “gold standard” to diagnose IBD [
9]. This procedure is uncomfortable for the patient, often involves multiple biopsies, is expensive for the health service provider (such as the NHS) and has an associated morbidity.
In recent years, breath and stool analysis have shown increasing potential as non-invasive diagnostic tools. This includes the analysis of exhaled volatile organic compounds (VOCs) and biomarkers of inflammation. There are an estimate of over 3000 VOCs in human breath [
10], which are a combination of bi-products of normal metabolic activity and, in some cases, specific biomarkers associated with a disease [
11,
12,
13,
14]. In a review paper from 2018, A. Wilson [
15] investigated the increasing application of electronic nose (eNose) technology for the clinical diagnosis of gastrointestinal diseases, including IBD, bile acid diarrhoea, colorectal cancer (CRC), IBS, and others. A number of these studies explored IBD utilising breath-based methods, employing analytical technologies such as selected ion flow tube mass spectrometry (SIFT-MS) [
16], gas chromatography time-of-flight mass spectrometry (GC-TOF-MS) [
17] and ion molecule reaction mass spectrometry (IMR-MS) [
18]. These studies demonstrated impressive efficacy and performance results, suggesting a strong link between exhaled VOCs and IBD. It has been proposed that these VOCs are generated from microbe-associated gases, which originate in the gut and diffuse into the bloodstream and enter the lung’s alveoli, where they are eventually expelled [
19]. Moreover, CD and UC have both shown distinct patterns of VOCs, reflecting gut fermentome metabolites [
8,
20].
In the domain of measurable objective biomarkers, C-reactive protein (CRP) and faecal calprotectin (FCP) have been gaining clinical research interest. CRP correlates reasonably well with CD activity, but has poor sensitivity [
21]. Moreover, it is found in blood plasma and cannot be monitored non-invasively. In contrast, FPC correlates well with both CD and UC and can be monitored in stool. Stool samples are routinely collected to inform the management of many gastrointestinal diseases and infections [
22]; however, patient compliance is rarely >60%, due to embarrassment or concerns about results [
23]. Nonetheless, FCP presents an additional non-invasive parameter, which may compliment results from breath testing.
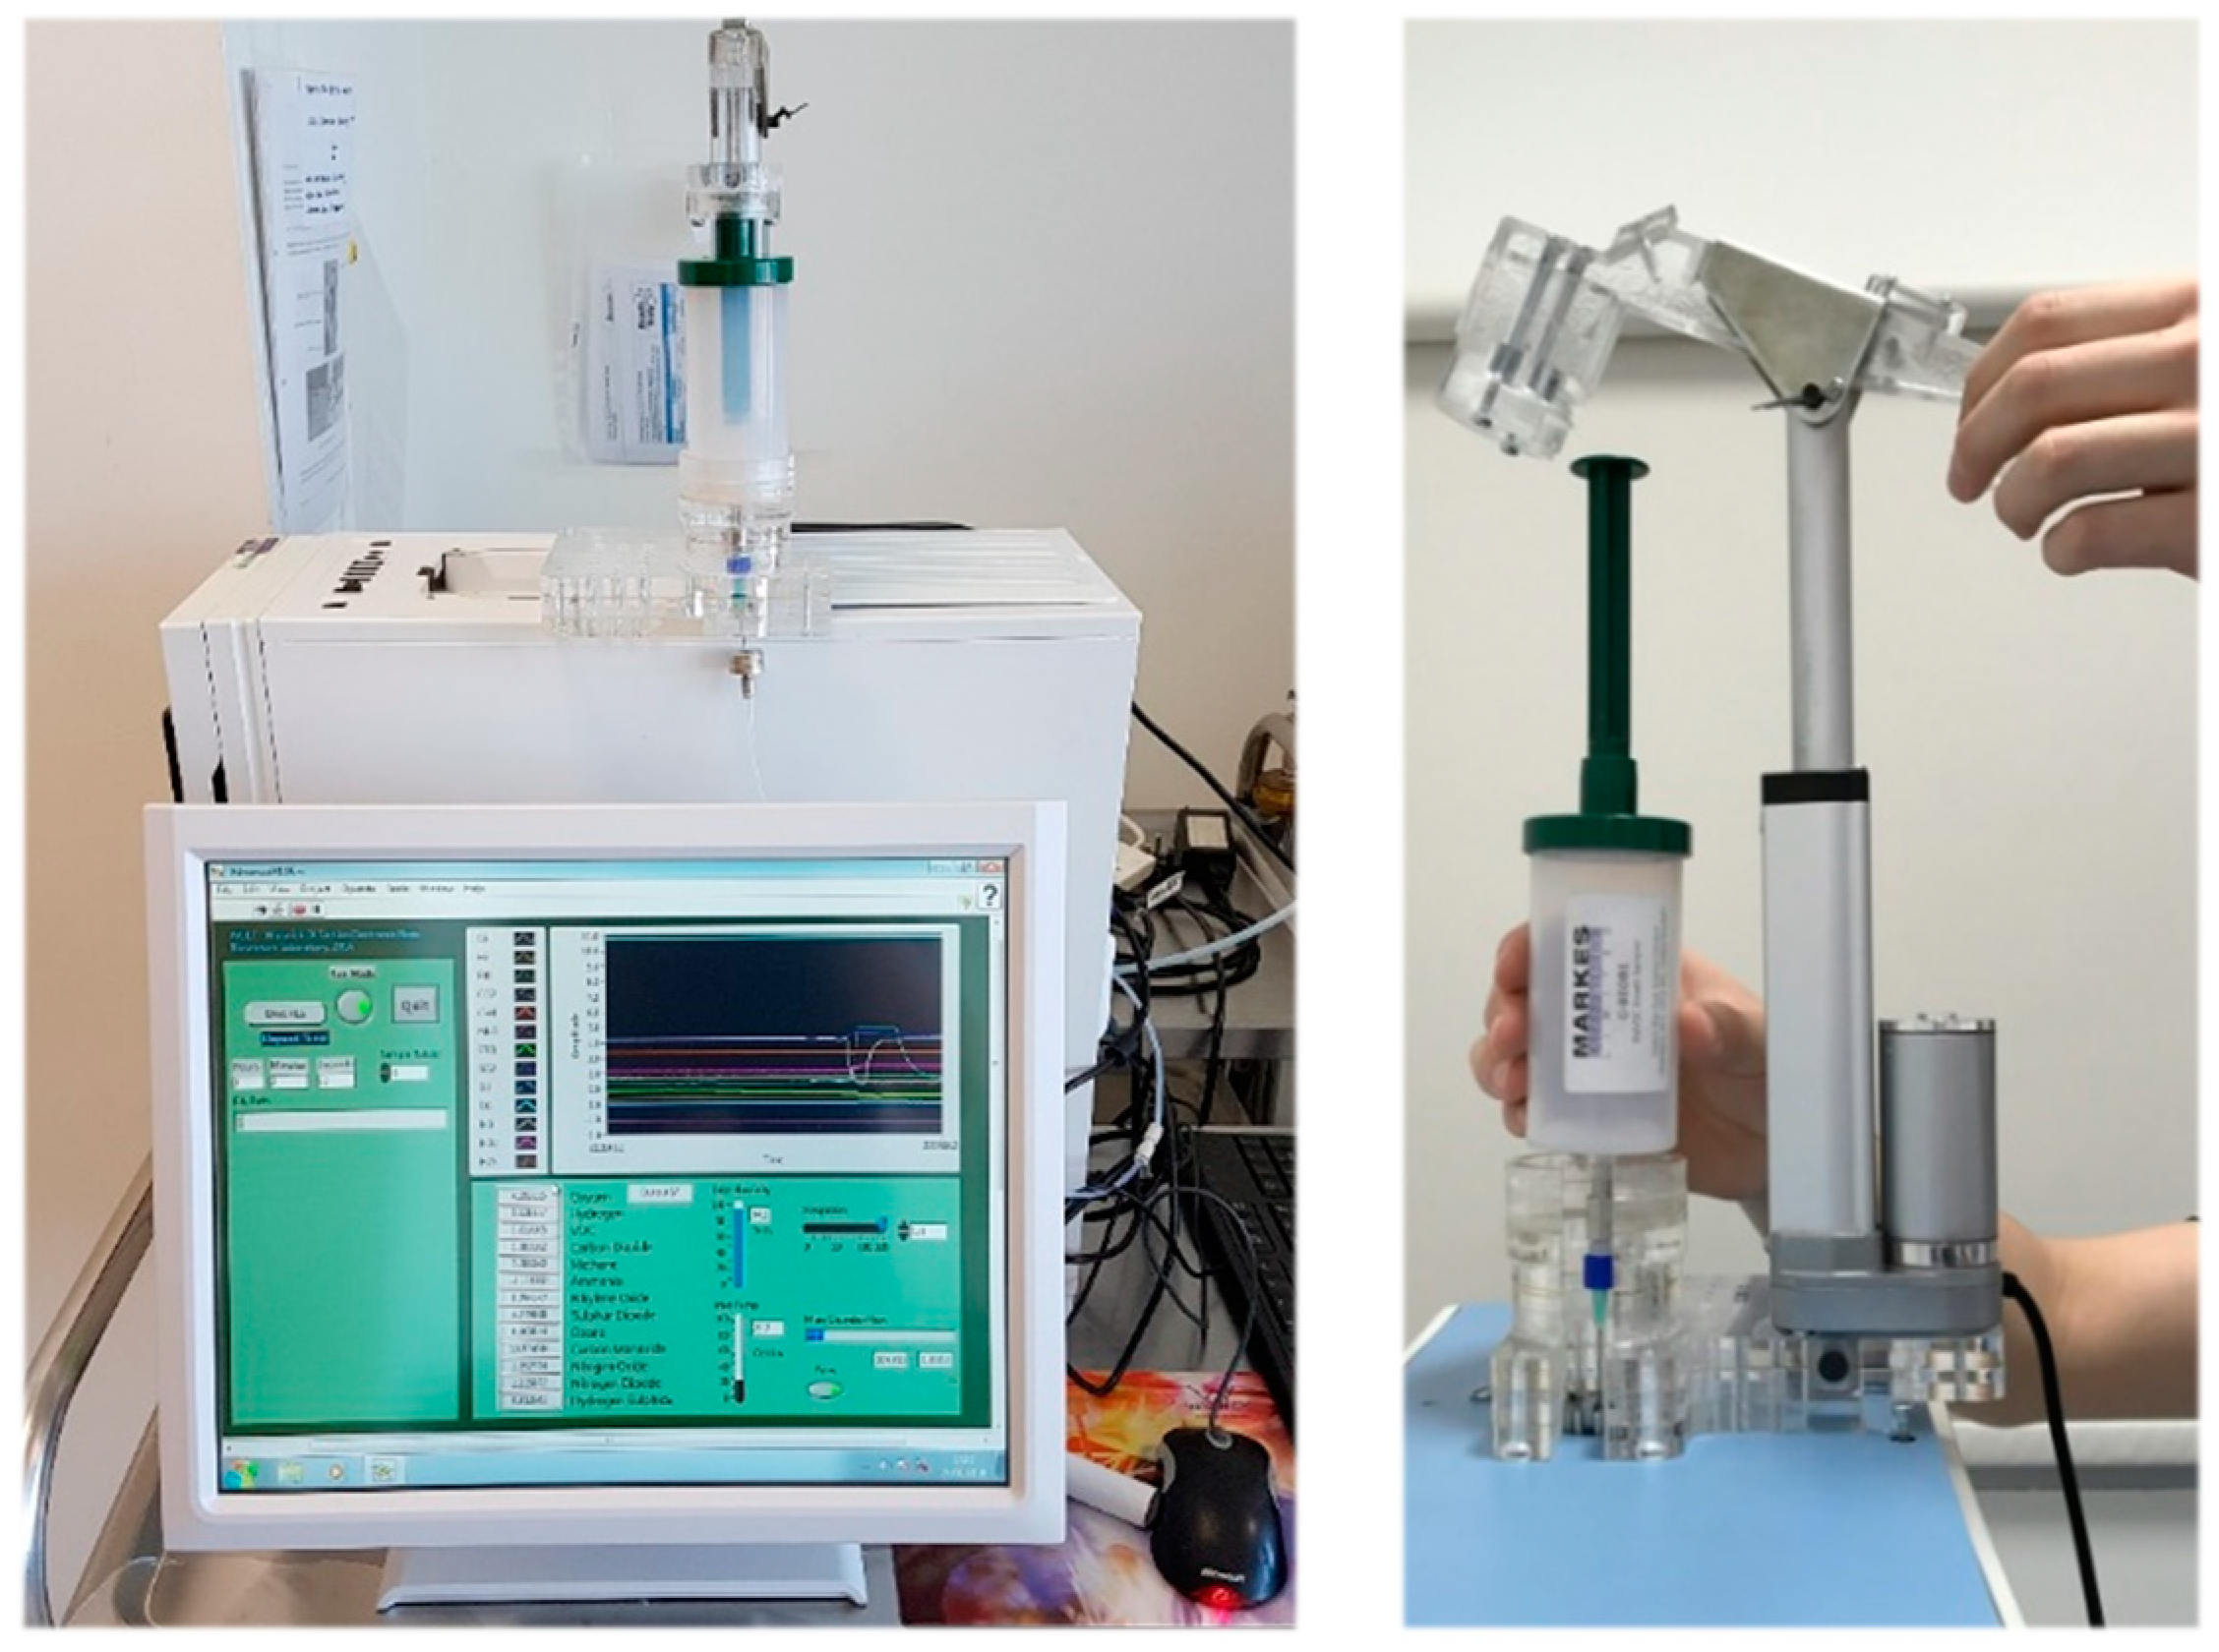
The aim of this pilot study is to evaluate the efficacy of breath analysis and determine if FCP can be used to supplement breath results for the diagnosis of IBD. The first objective of this study is to determine whether exhaled VOCs can be used to distinguish IBD from healthy controls and CD from UC, using a commercial gas chromatograph—ion mobility spectrometer (GC-IMS) and an in-house built electronic nose (eNose). To the best of our knowledge, this breath study is the first to investigate CD, UC and healthy controls using GC-IMS and eNose technology. The key advantages of these technologies are that they are non-invasive, portable, relatively inexpensive, applicable for high-throughputs and have sampling procedures suitable for nearly all patient demographics, including vulnerable subjects such as children and the elderly. Confounding factors, such as BMI, smoking habits and gender will be used to verify analysis efficacy. The second objective of this study is to determine whether FCP, used as an additional non-invasive parameter, adds diagnostic value to breath analysis in IBD.
3. Results
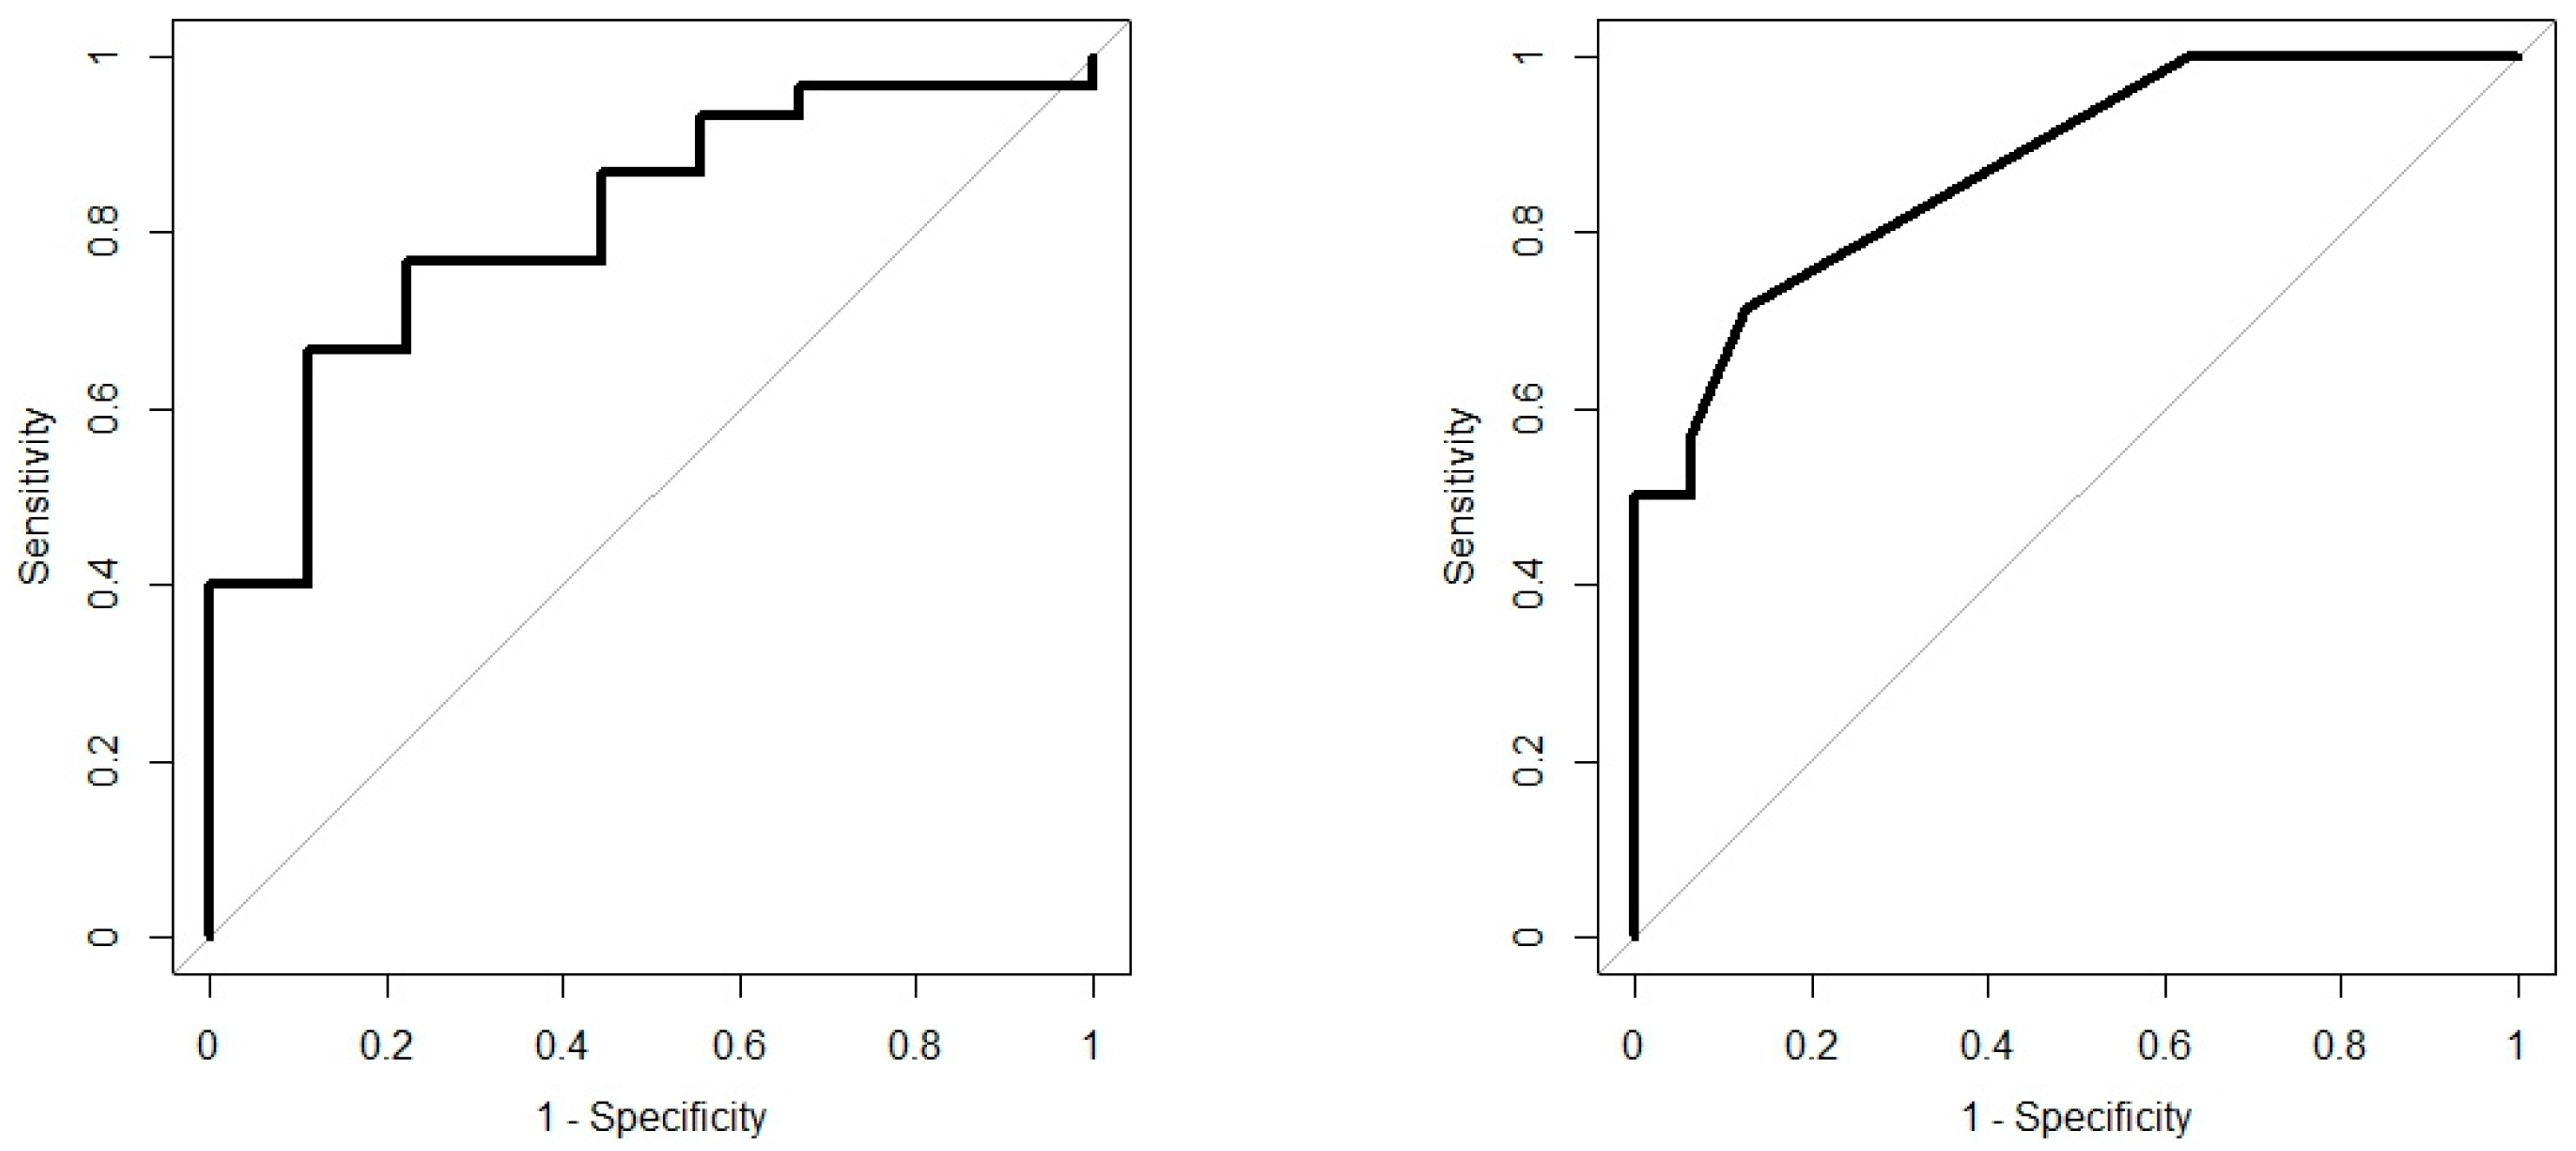
Analysis results are presented as operating characteristic (ROC) curves. The associated area under curve (AUC) is a measure of how well parameters can distinguish between diagnostic groups. In our case, the groups were IBD vs. controls, and CD vs. UC. Generated ROC curves for G.A.S. BreathSpec GC-IMS and Wolf eNose, IBD vs. controls and CD vs. UC, are shown in
Figure 6 and
Figure 7, respectively. The RF algorithm consistently performed best. The analysis results are summarised in
Table 4 and
Table 5.
3.1. Chemical Identification
VOC analysis indicates that two compounds play a crucial role in distinguishing between IBD and controls. Chemical identification for the BreathSpec instrument, using the GC-IMS Library Search software, suggests that the best matches for the identified compounds include: butanoic acid (2-methyl-, propyl ester) and ethanoic acid (3-methyl-1-butyl ester).
Specific VOCs cannot be identified using the Wolf eNose. However, in an attempt to identify the chemical groups, which contribute most to the seperation between diagnostic groups, we have analysed the normalised average change in Wolf eNose outputs, per group. A radar plot of the responses is shown in
Figure 8.
Ammonia, sulphur dioxide (SO2) and nitrogen dioxide (NO2) sensors showed the greatest changes in sensor outputs and thereby contributed most to the separation between diagnostic groups. Significant changes were observed in ammonia by both UC and CD patients. Changes in NO2 were marginally greater in CD over UC and controls, while UC is associated with increased sulphur dioxide. The other sensor outputs show small variations between groups, such as increased ethylene oxide in UC over controls.
3.2. Confounding Factors
The analysis previously conducted on IBD and control groups was repeated, using the same analytical techniques and algorithms, on the confounding factor groups, i.e., BMI: under- & normal weight vs. overweight & obese; smoking: smokers vs. never smokers; gender: male vs. female. The analysis results are summarised in
Table 6 and
Table 7.
Table 6 and
Table 7 demonstrate that the possible confounding factors of BMI, smoking and gender have insignificant influence on breath content. This is particularly true for BMI and smoking, as they achieve an AUC of around 50 for both technologies. Gender seems to have the most influence on breath content, with an AUC of around 60.
3.3. Faecal Calprotectin (FCP)
The demonstrated Wolf eNose analysis for CD vs. UC was repeated using FCP as an additional feature, on a reduced dataset of 20 samples (11 CD, 9 UC) to match the availability of FCP scores. This analysis could not be repeated on the G.A.S. BreathSpec GC-IMS, because the features from this device are made up of clusters with numerous data points and are thus not directly compatible with single feature values, such as FCP.
The combined breath with FCP analysis was compared to breath without FCP, for the same dataset. The analysis results are summarised in
Table 8. In addition to this, we investigated whether the combined analysis of breath with FCP could better distinguish between CD vs. controls and UC vs. controls, as shown in
Table 9.
4. Discussion
In recent years, numerous studies have investigating the efficacy of breath VOCs to diagnose IBD [
16,
44,
45]. At least three studies utilised selected ion flow tube mass spectrometry (SIFT-MS) to distinguish IBD from healthy controls, as well as separating UC from CD. Hicks et al. [
44] identified 6 VOCs (hydrogen cyanide, ammonia, dimethyl sulphide, hydrogen sulphide, butanal, and nonanal) which significantly differed in concentrations, between diagnostic groups. Another study identified 3 specific VOCs (1-octene, 1-decene, (E)-2-nonene) as relevant for predicting the presence of IBD (AUC 0.96), but did not identify any significant difference in VOCs between CD and UC [
16].
Mass spectrometry-based technologies, such as gas chromatography time-of-flight mass spectrometry (GC-TOF-MS) and ion molecule reaction mass spectrometry (IMR-MS) have also been employed to investigate breath analysis for IBD [
17,
18,
46]. Smolinska et al. [
46] utilised GC-TOF-MS to achieve very promising results for the non-invasive diagnosis of UC [AUC: 0.94, sensitivity: 0.92, specificity: 0.77]. In our previous work, we used field asymmetric ion mobility spectrometry (FAIMS) to separate IBD from controls [AUC: 0.82, sensitivity: 0.74, specificity: 0.75] [
8].
While the GC-TOF-MS study by Smolinska et al. was able to exceed the diagnostic performance achieved in this pilot study, the Wolf eNose and G.A.S. BreathSpec GC-IMS are a fraction of the price of GC-TOF-MS and SIFT-MS technologies (10–20% of the cost). Furthermore, the G.A.S. BreathSpec instrument is user-friendly, since it does not require trained operators, and is easy to move when mounted on a trolley. These practical advantages, in combination with chemical identification abilities, provide key advantages for GC-IMS technology in a clinical setting.
In this study, we demonstrated that both eNose and GC-IMS were consistently able to separate those with IBD from healthy control volunteers, regardless of disease activity as reflected by the FCP scores. Additionally, both technologies were able to provide some separation; GC-IMS
p = 0.026 and eNose
p = 0.0001, between CD and UC. The results indicate that the G.A.S. BreathSpec GC-IMS is better suited towards distinguishing between IBD and controls, while the Wolf eNose can better separate between CD and UC. These results are expected to be further improved by increasing the number of recruited subjects. The sensor array deployed in the Wolf eNose is focused towards inorganic gases, which most likely accounts for the differences in diagnostic accuracy achieved by the employed technologies. Ammonia, SO
2 and NO
2 sensors contributed significantly to the analysis of the Wolf eNose. Ammonia has an established link to IBD breath [
16,
44,
47], since it is one of the intermediaries generated from bacterial fermentation of proteins [
48]. UC was associated with higher SO
2 levels in our study, which has been observed previously [
49]. It has been suggested that residential exposures to SO
2 and NO
2 may increase the risk of early-onset of CD and UC [
50].
Increases in the aforementioned VOCs, butanoic acid and ethanoic acid, contributed significantly to the efficacy of our analysis for G.A.S. BreathSpec GC-IMS. These VOCs have been recently identified as important discriminatory volatile organic metabolites for IBD [
51]. Short-chain fatty acids, such as butyric-, propionic- and acetic acids, are produced in the colon by fermentation of fibre. In particular, butanoic acid (also known as butyric acid) is a key component for health in the colon [
52] and is the main energy substrate for colonocytes [
53]. Butanoic acid has therefore been suggested to play an important role in the prevention and treatment of distal UC [
54] and CD [
55]. The variations in the identified compounds between IBD subjects and controls may be crucial for diagnostic purposes and need to be further investigated.
Analysis results of possible confounding factors show that BMI and smoking habits have insignificant influence on breath content. In general, the effect of smoking is an obvious factor to influence breath. However, it is worth noting that 19 of the 21 ‘smoker’ subjects consider themselves to be ex-smokers. It is therefore unsurprising that greater differentiation was not possible in this case. Gender showed a more significant influence on breath content than the other two factors [AUC: 0.66, sensitivity: 0.68, specificity: 0.65]. While IBD generally affects men and women equally, some studies from North America show that UC is more common in men than women [
56]. The unbalanced gender counts in the UC group (11M: 4F) could therefore be responsible for strengthening the separation between males and females for the confounding factor analysis. In addition to this, gender affects metabolism which can lead to differences in breath content [
41]. However, this factor was not significant enough to create two distinct groups or undermine the IBD-related analysis. Age was not considered in the confounder analysis; however, this factor is known to have limited effect on breath content, with some studies showing no statistically significant associations between age and common breath gas metabolites [
57]. Moreover, unlike many other diseases, IBD can occur at any age (most likely between 15–35). Age is therefore unlikely to have had a significant effect on the conducted analysis. Lastly, the effect of medication could not be considered in the confounding factor analysis, due to the number and variety of medications and treatments ascribed to each IBD subject. It is possible that the strong results distinguishing between IBD and controls, as well as CD and UC, could be related to the effect of medication; however, the same class of drugs was proportionally present in both IBD groups, so this factor is less likely to be a confounder.
Results from the analysis combining breath analysis with FCP caused specificity, PPV and AUC to reduce, compared to those without FCP. While the differences in mean FCP scores between CD and UC is almost 300 ug/g (414.1–116.9 ug/g), this feature is prone to misclassification because all CD scores fall within the lower range of UC scores. Thus, including FCP with breath analysis does not improve distinction between CD vs. UC within this study. However, as shown in
Table 9, FCP did improve separation of CD vs. controls and UC vs. controls. This is likely due to the significantly higher FCP scores in both CD and UC, when compared with the normal reference range of a healthy individual (<50 ug/g) [
58]. Nonetheless, this specific application of FCP has little practical or clinical value, since the same conclusions can be derived using FCP scores alone. Moreover, there would be added costs (£18 per test) to conduct FCP tests, alongside breath analysis. These additional costs cannot be justified without a significant improvement in diagnostic performance in distinguishing between CD and UC. GC-IMS and eNose technologies therefore show the greatest potential as non-invasive diagnostic tools for IBD.
5. Conclusions
The results from this pilot study confirm the utility of breath VOC analysis to distinguish between IBD and healthy control volunteers, and CD from UC. To the best of our knowledge, this study was the first breath-based investigation of IBD utilising GC-IMS and eNose technology. Both technologies consistently showed the ability to separate those with IBD and controls [AUC ± 95%, sensitivity, specificity], eNose: [0.81 (0.66–0.96), 0.67, 0.89] and GC-IMS: [0.93 (0.85–1.00), 0.87, 0.89]. Furthermore, we were able to separate CD from UC, eNose: [0.88 (0.77–0.98), 0.71, 0.88] and GC-IMS: [0.71 (0.51–0.91), 0.86, 0.62]. The G.A.S. BreathSpec GC-IMS is better suited towards distinguishing between IBD and controls, while the Wolf eNose can better separate between CD and UC. Compound analysis has identified two breath VOCs, which are likely to have a direct link to IBD: butanoic acid and ethanoic acid. These compounds played a crucial role in separating those with IBD from controls. Analysis of possible confounding factors indicate that BMI, smoking habits and gender have insignificant influence on breath content. Wolf eNose analysis was repeated on a reduced dataset, with FCP scores serving as an additional feature. This resulted in a poorer separation of CD and UC, which indicates that the efficacy of breath analysis is reduced, when supplemented with FCP; [0.85 (0.63–1.00), 1.00, 0.67] without FCP, and [0.74 (0.50–0.98), 1.00, 0.56] with FCP. The inclusion of FCP was able to improve diagnostic performance for CD vs. controls and UC vs. controls; however, this application has limited clinical value. Thus, the G.A.S. BreathSpec GC-IMS and Wolf eNose instruments offer the greatest potential as non-invasive, high-throughput, real-time diagnostic and screening tools for IBD, in point-of-care use. Moreover, since breath testing using these technologies could be undertaken during routine consultancy appointments, it has the potential to fundamentally change the current clinical diagnostic and assessment pathways for IBD.

 ,
, 


