1. Introduction
Application of photosynthetic reaction centers (RCs) in bioelectronic devices has attracted growing interest due to the unique properties of RCs. RCs are natural protein complexes with high quantum efficiency (~100%) in generating electric charges from photons [
1], which are potentially useful for making bio-photoelectrochemical devices to harvest solar energy. The conventional method of fabricating a device is to immobilize RCs on the surface of an electrode via a linker molecule and utilize the electrode in an electrochemical cell [
2,
3]. Recently, a new method was devised for immobilizing RCs via natural interprotein interaction between cyt
c and RC [
4,
5]. Using this approach, the RC orientation is well controlled when attached to the electrode through the immobilized cyt
c protein [
4]. Additionally, using cyt
c as a part of the linking structure can facilitate the charge transfer between the RC and the electrode [
6].
The new immobilization method was previously tested on the
Rhodobacter sphaeroides RC [
4,
5]. This RC is an integral membrane protein complex consisting of three subunits and cofactors. The photoreaction starts with the absorption of photons at the primary electron donor (P) which is one of the cofactors. Due to the energy profile of the cofactors, the photoexcited electron at P moves first to bacteriopheophytin (
HA) and then to a quinone molecule (
QB) [
1]. In a photosynthetic organism, after receiving two electrons and two protons (H
+),
QB becomes a hydroquinone (
QH2) and leaves the RC. The charge transfer from P
+ involves cyt
c which acts as a charge mediator [
1]. Cyt
c approaches the RC at the P-side and donates one electron to the RC. Due to the presence of Fe
2+ ion in the cyt
c heme, the protein has two positive charges in its reduced form. After donating an electron, cyt
c is oxidized and carries three positive charges (Fe
3+). One approach to remove the negative charge from the RC in an electrochemical cell is to employ a redox mediator such as methyl viologen (MV) [
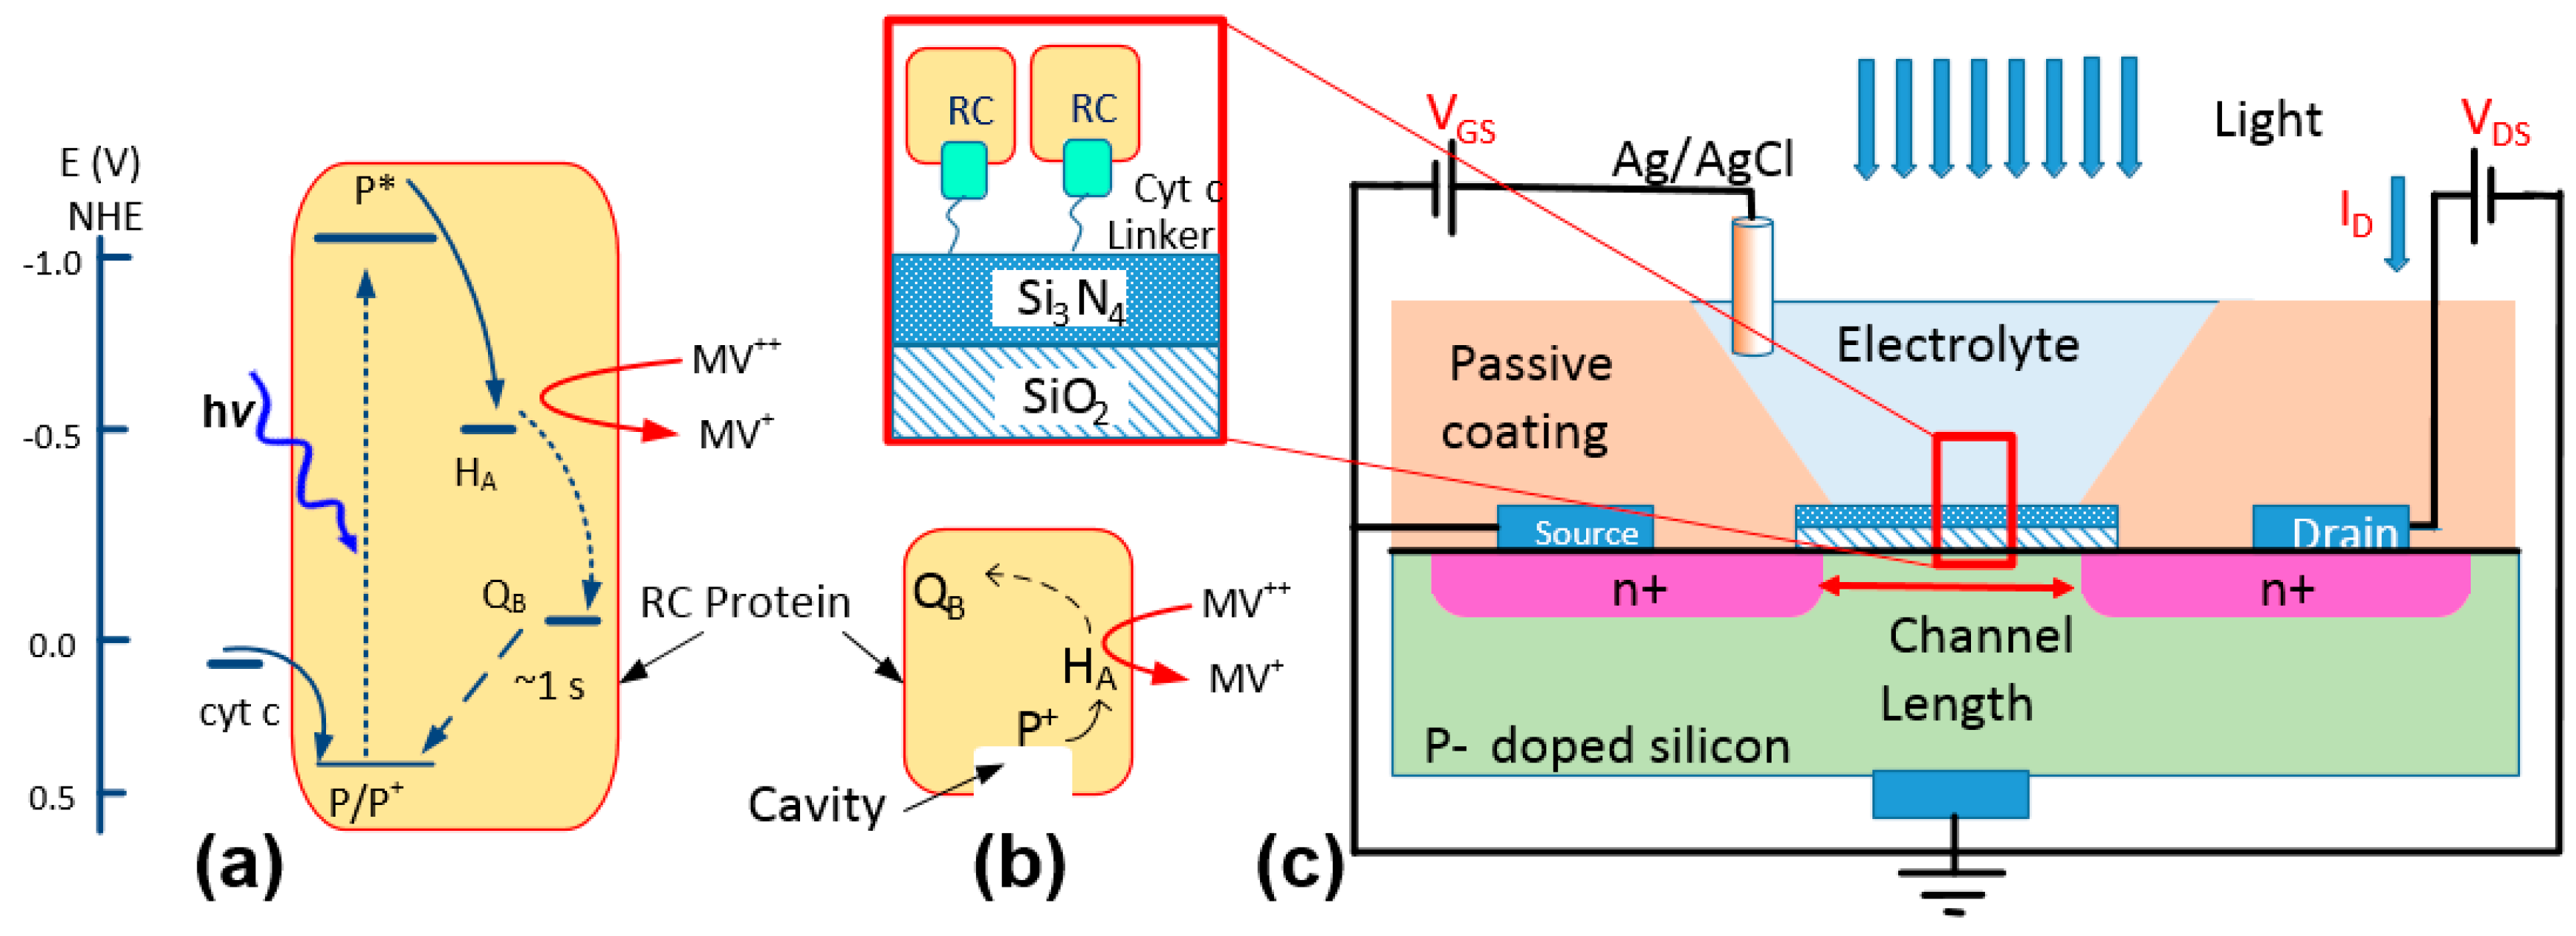
7]. The energy diagram in
Figure 1a shows the charge balance in an electrochemical cell when an RC interacts with cyt c and MV. In this process, after absorbing a photon, the electron at P promotes from the ground state (P/P
+) to the excited state (P*). In presence of methyl viologen the excited electron can be transferred to MV
2+ before reaching
QB. The reduced mediator (MV
+) can diffuse out from the protein. Meanwhile the positive charge at P
+ will be filled with the electrons received from cyt
c2+ which oxidizes the protein to cyt
c3+.
The natural protein-protein interaction between the RC and cyt
c can be used in a bio-photoelectrochemical device not only for charge transfer but also for immobilizing RCs from the P-side where the protein features a cavity (
Figure 1b) [
4]. Despite the advantages in this approach, one concern is the success rate in immobilizing RCs to an electrode by relying on this natural protein-protein interaction. In our previous work [
4], we estimated the density of RCs on a layer of immobilized cyt
c using a cyclic voltammetry (CV) method. However, the CV method does not reveal effective coupling between the two proteins. In this work, we have used an electrochemical field-effect transistor (FET) as a substrate to study the immobilization of RCs through cytochromes. Electrochemical FETs have been used widely as sensors for detecting various chemicals and biological materials, including proteins, DNAs, and cells [
8,
9,
10,
11,
12,
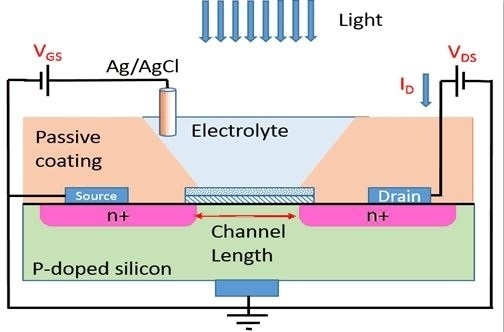
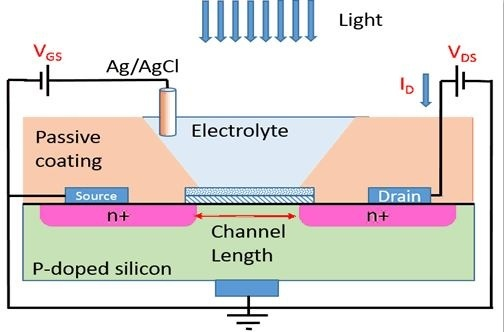
13]. As shown in
Figure 1c, an electrochemical transistor has a structure very similar to a metal-oxide-semiconductor FET (MOSFET) but the gate metal being replaced with an electrolyte. Due to high sensitivity of the drain current,
ID, to the static charge on the gate insulator, a common method is to use a linker molecule for immobilizing proteins and DNAs [
10,
12,
13]. The immobilized materials can mimic a surface charge which can be measured accurately by monitoring the voltage shift in the device.
2. Materials and Methods
Electrochemical transistors with two layers of gate insulator (98 nm thick SiO
2 and 100 nm thick Si
3N
4) were purchased from Microsense. The electrochemical cells were set in disposable cuvettes with 0.1 M Tris-HCl buffer (pH 8.0) as the electrolyte and an Ag/AgCl reference electrode as the gate contact (
Figure 1c).
The RC from
Rhodobacter sphaeroides was prepared as described elsewhere [
14]. The RC concentration after purification was measured to be 15 µM based on the absorption peak at 804 nm [
15]. This RC has a 6-His tag on the C-terminus of the H-subunit which is on the opposite side of the RC from where cyt c binds [
15]. The concentration of the RC solution was diluted to 5 µM by adding Tris-HCl buffer (pH 8.0) into the solution. A self-assembled monolayer (SAM) of the linker molecule was deposited on the Si
3N
4 layer of the transistor by inserting the device into an ethanolic solution of 10 mM 10-carboxydecylphosphonic acid (Dojindo, Rockville, MD, USA) for 4 h at room temperature. Cyt
c was deposited on the SAM by inserting the device in a 0.8 mM solution of cyt
c (Sigma, St. Louis, MO, USA) in Tris buffer (pH 8.0) for 24 h at room temperature. RC incubation was carried out by drop casting 20 μL of the diluted RC solution on top of the active area of the transistor and keeping it at 4 °C for 24 h.
The electrochemical cells were tested using a custom-made setup including a dark box with a white light emitting diode (LED) and a multi wavelength LED (MTMD6788594SMT6 from Marktech Optoelectronics, Latham, NY, USA) as the light sources inside the box. Various pins of the LEDs were biased with 20 mA current pulse to get emission for white light and single wavelength emissions at 670, 770, 810, 850, and 950 nm. From the datasheet of the LED, the intensity of the monochromatic light was estimated to be ~3 μW/cm2 at the transistor surface. The transistor was characterized using a 2602A Keithley instrument (Tektronix, Beaverton, OR, USA). The Keithley instrument and the pulse current source for the LEDs were controlled through LabTracer 2.0 software (Tektronix, Beaverton, OR, USA).
3. Results and Discussion
First, a bare transistor was tested in the dark box. The output characteristic of the device was obtained by measuring the drain current when the gate voltage (i.e., reference electrode) was kept constant and the drain voltage was scanned from 0.0 V to 1.2 V. The experiment was repeated for different gate voltages from 2.0 V to 3.0 V. The
ID −
VDS of the transistor when the gate voltage was at 3.0 V is shown in
Figure 2a. The output characteristic shows that the device was operating in the saturation mode when
VDS was 1.0 V. Therefore, the transconductance characteristic of the device was measured by recording the drain current when
VDS = 1.0 V, and the gate voltage was scanned from 0.0 V to 3.0 V (
Figure 2b). The output and transconductance characteristics of the device were measured at different wavelengths when the transistor was exposed to monochromatic and white light from the LEDs.
To study the success rate in immobilizing RCs via the new linker structure, first a SAM layer was deposited on the transistor. After the deposition, the sample was characterized in the absence and presence of illumination. The dark output and transconductance responses of the device with the linker coating are shown in
Figure 2a,b, respectively. The slight change in the dark response of the transistor indicates formation of the SAM on the Si
3N
4 layer.
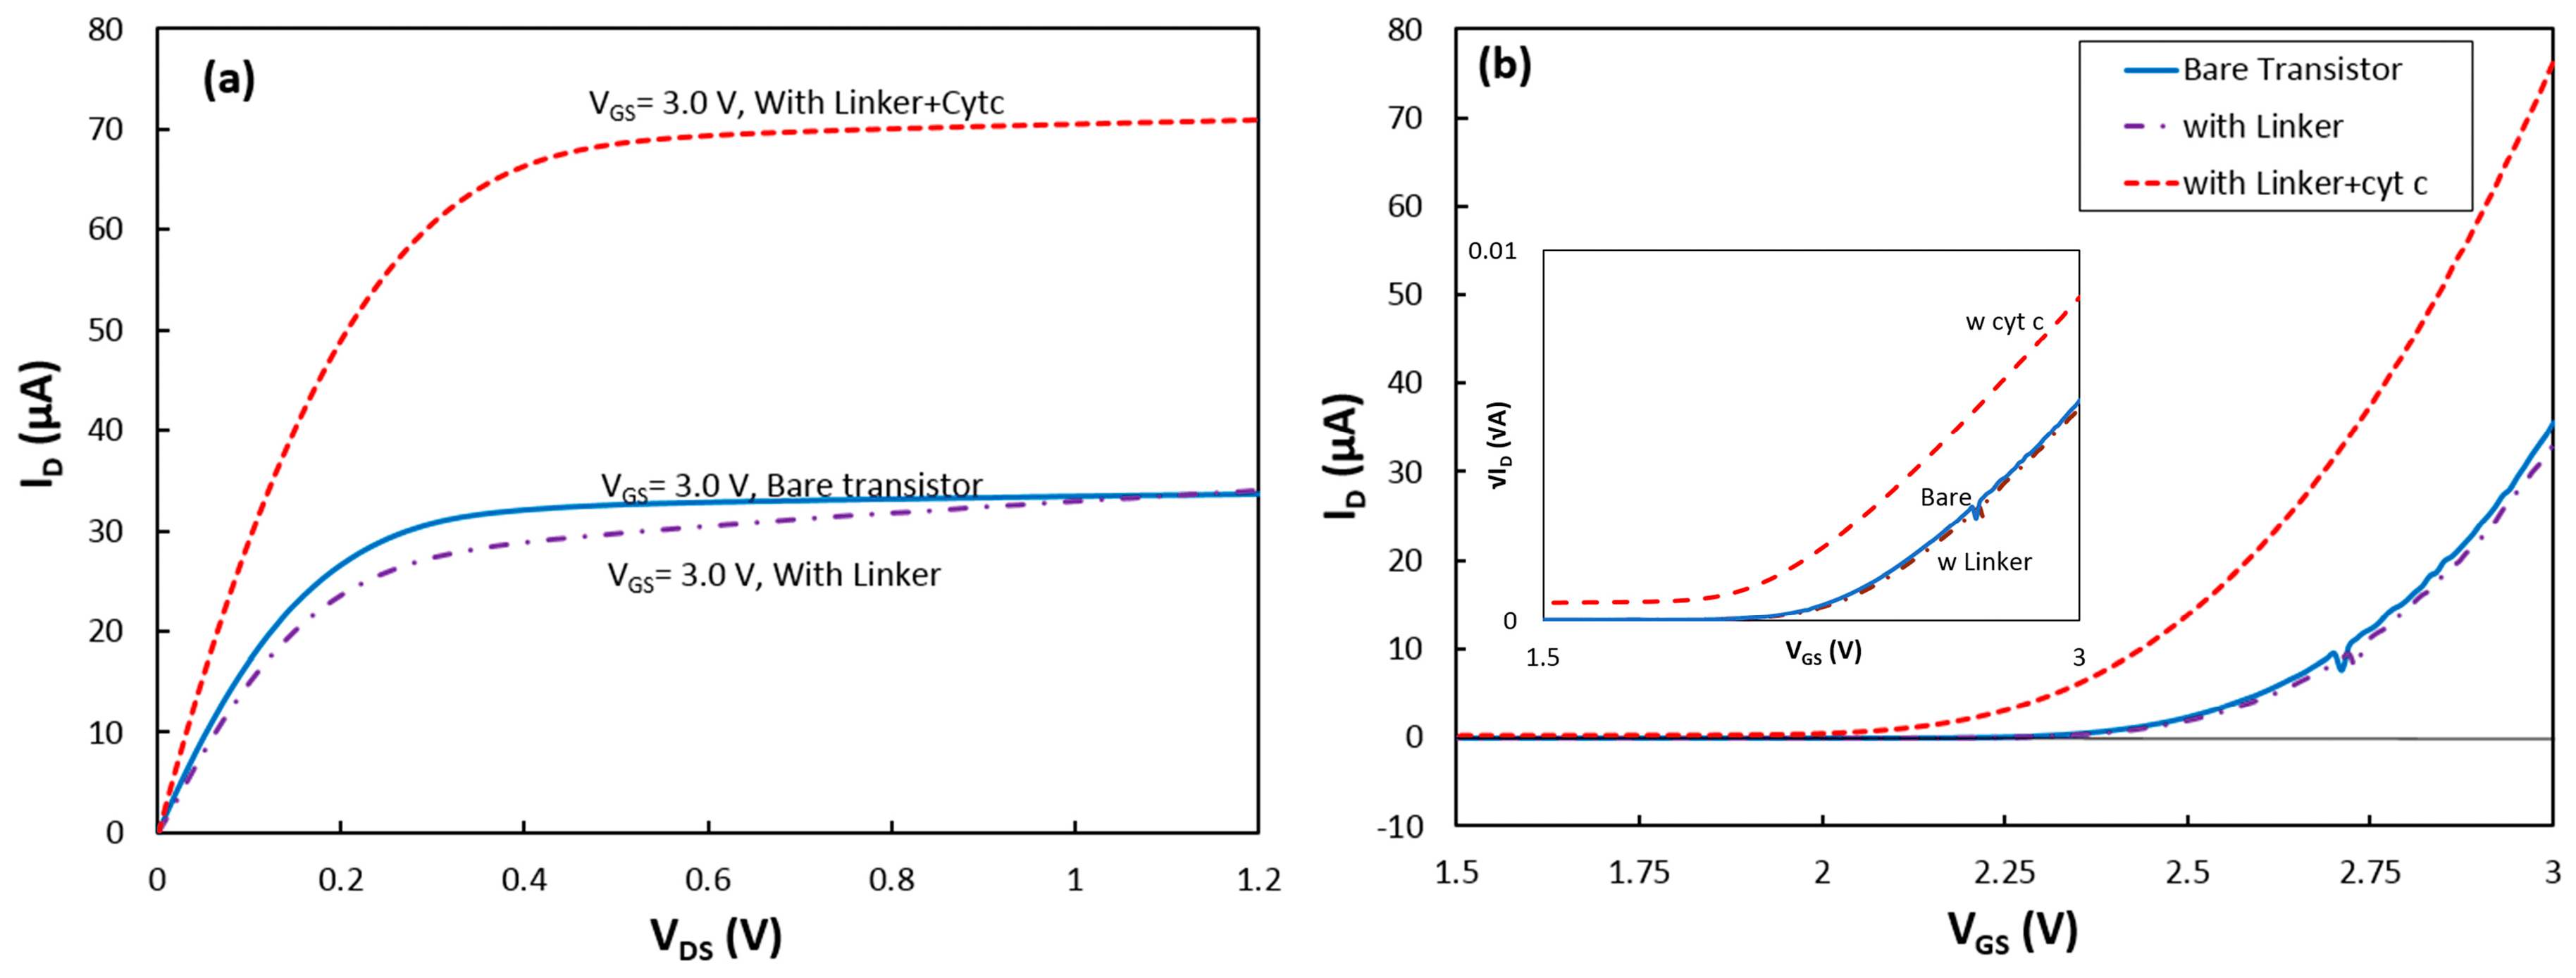
The device was removed from the cell for deposition of cytochrome on the SAM. After the deposition, the transistor was returned to the test cell inside the dark box, and it was found that the transistor drain current was greatly enhanced. Under a gate-source voltage (
VGS) of 3 V, the saturation current at
VDS = 1.2 V increased from 34 μA for the transistor without cyt
c to 71 μA after adsorption of the protein (
Figure 2a).
The drain current,
ID, in a FET device in the saturation mode when
VGS is greater than the threshold voltage,
Vth, is expressed by [
16]:
where
μSi is the mobility of the carrier in the channel of the transistor,
W/
L is the channel width to length ratio, and
CG is the gate capacitance which is independent from
W and
L. For the bare transistor:
where
tSiO2,
tSi3N4,
εSiO2 and
εSi3N4 are the thickness and permittivity of the SiO
2 and Si
3N
4 layers, respectively. Considering that the carrier’s mobility in the silicon (buried under the dielectric layers) and
W/
L have not been changed after coating the device with the protein, the change in the drain current should be due to a change in
CG and/or
Vth. To study the effect of linker and cyt
c on the device parameters, the transconductance responses were converted to √
ID vs
VGS (inset of
Figure 2b). As shown in Equation (3), the √
ID −
VGS curves were approximated with linear functions for
VGS > 2.75 V.
Considering that the carrier’s mobility in the silicon (buried under the dielectric layers) and W/L have not been changed after coating the device with the linker and protein, changes in the slope of the linear functions were interpreted as changes in the CG value, and the threshold voltage was found from the VGS-intercept of the linear functions.
The data show that
CG dropped by 4% after the SAM coating, but the slope did not change after the cytochrome deposition. Due to the thick layers of SiO
2 and Si
3N
4 and thin insulating SAM, this change in
CG is reasonable. However, a relatively large reduction of the threshold voltage from 2.39 V for the bare transistor to 2.17 V after the cytochrome coating on the top of the SAM was observed. The threshold voltage in a fabricated transistor can be changed if charged molecules attach to the dielectric layer [
9]. The density of charges,
Qs, from the attached molecules can be estimated from the change in the threshold voltage, Δ
Vth, using the simple equation of
Qs = Δ
Vth ×
CG [
16]. Knowing the thickness and the permittivity of the SiO
2 and Si
3N
4 layers, the
CG value was estimated for the bare transistor to be 2.30 × 10
−8 F/cm
2. Therefore,
Qs was found to be 5.12 × 10
−9 C/cm
2. Assuming that the charge on the surface of the protein is passivated by the counter ions in the electrolyte, the effective charge of the reduced cyt
c would be only two unit charges (unit charge = 1.6 × 10
−19 C) from the unshielded charge at the heme (Fe
2+) core of the protein. This corresponds to the surface density of attached cyt
cs to be 1.6 × 10
10 proteins per cm
2. Considering the protein dimensions, this implies only ~15% of the surface coverage. Although surface coverage near 100% is achievable on a gold electrode (with a different linker molecule) [
17], immobilizing cyt
c to Si
3N
4 has not been reported before. In this work, carboxydecylphosphonic acid which is recommended as a linker for various insulating materials was chosen. However, a separate study would be required to find the optimum deposition conditions to achieve a compact linker layer on Si
3N
4. Therefore, it is likely that the linker coverage was limited which resulted in the poor surface coverage by the proteins. The transconductance characteristic of the device was also measured under other illumination conditions, and the results were consistent with the above interpretations.
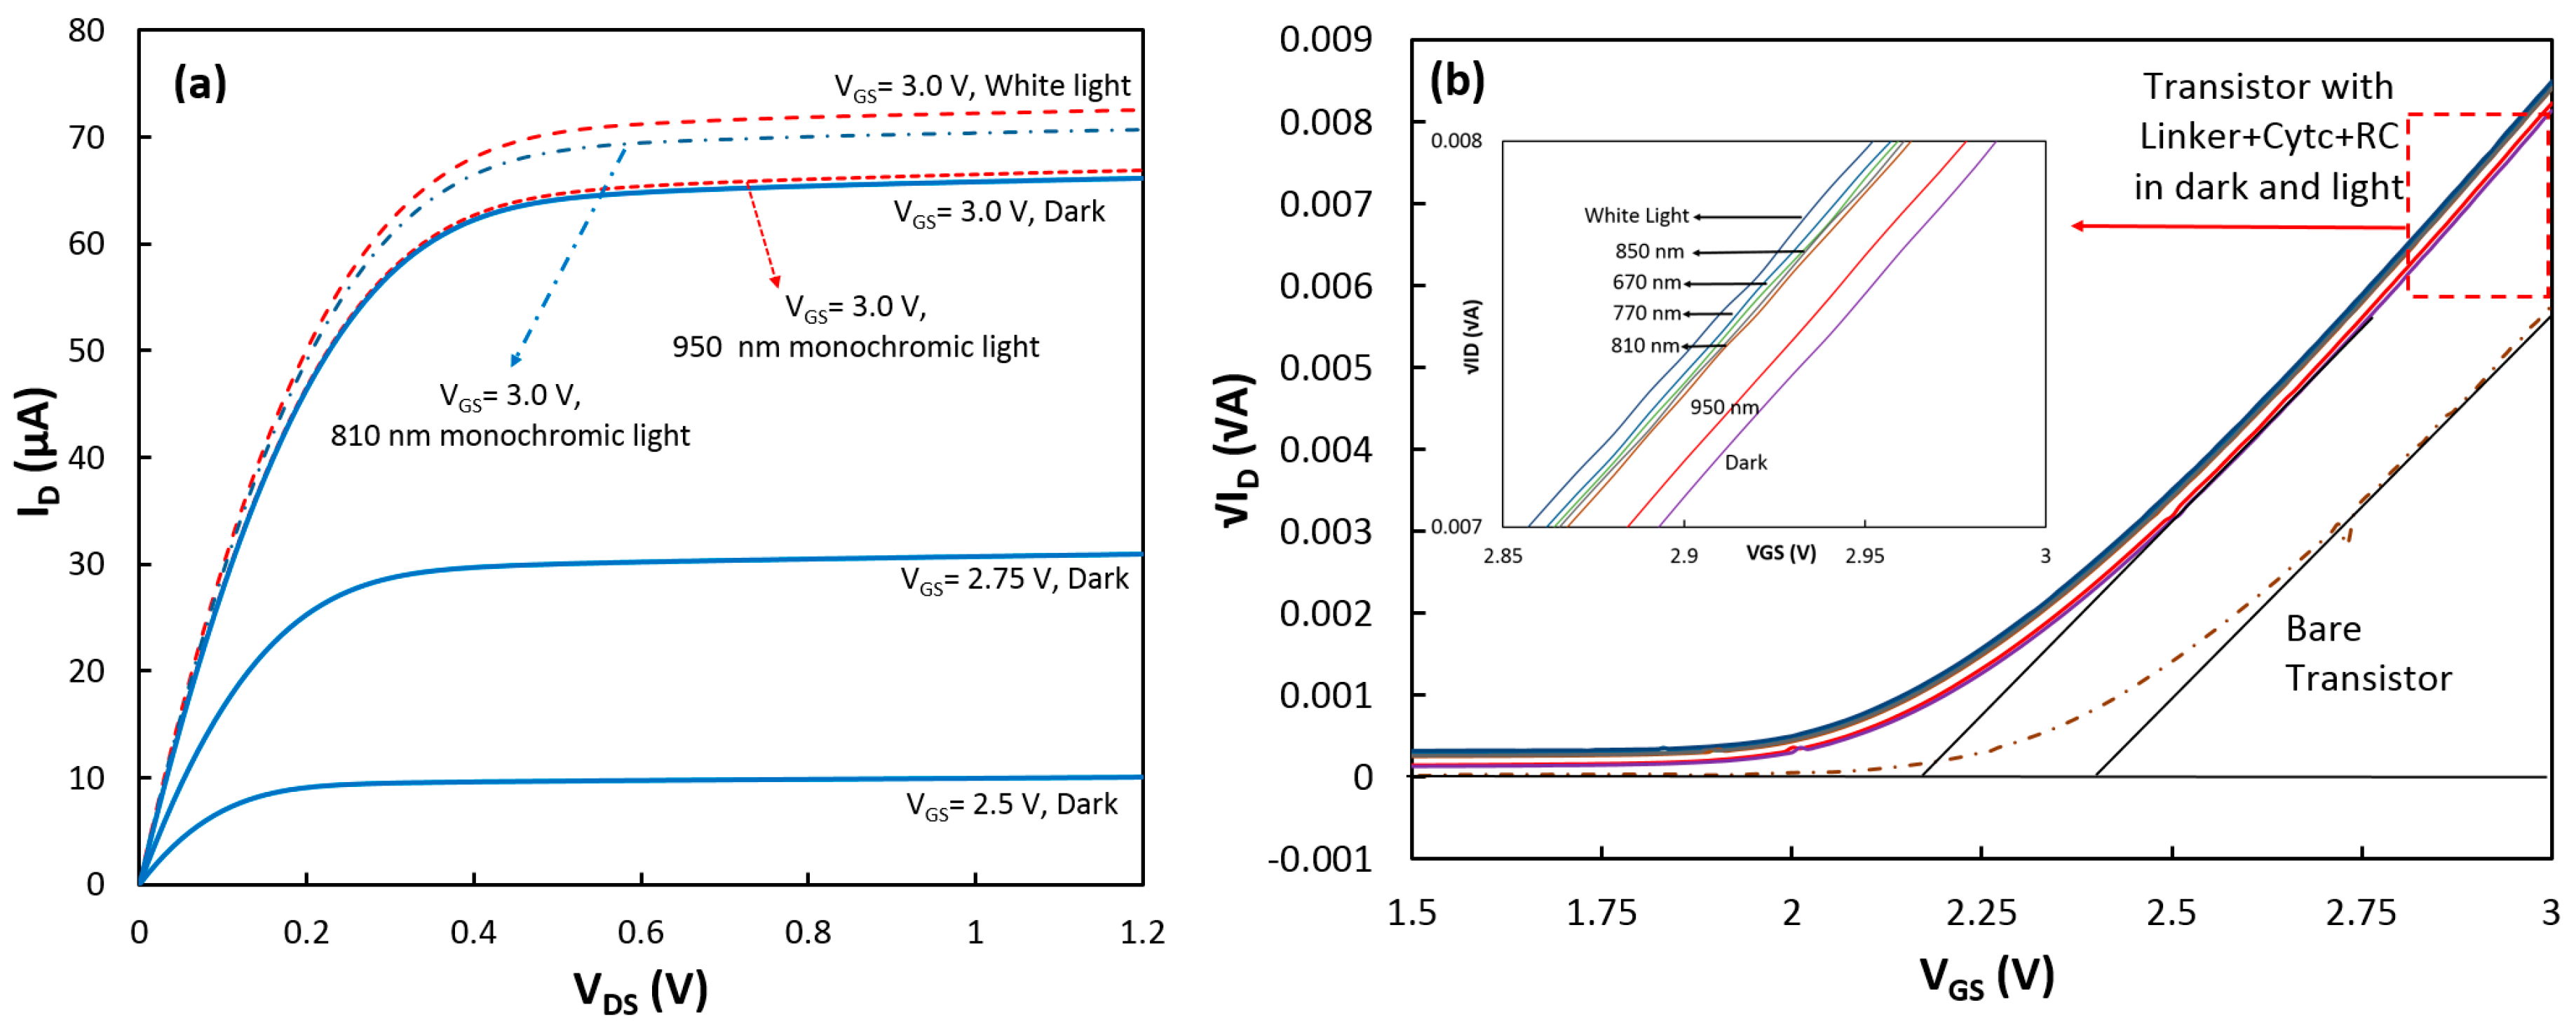
After the measurements, the device was removed from the test cell for the RC incubation. The transistor with the linker, cytochrome c, and RC (linker+cyt
c+RC) was tested again in the dark and illuminated conditions in 0.1 M Tris-HCl buffer (pH 8.0) electrolyte containing 0.05 M methyl viologen.
Figure 3a shows the output characteristic of the device for three different gate voltages when it was in the dark, and the
ID −
VDS curves for
VGS = 3.0 V under white and two monochromatic lights. The largest change in
ID was measured when white light was applied to the device. The change in the transistor drain current under illumination suggests that the charge density at the gate of the transistor was increased (reduction of threshold voltage). Since it is expected that RCs would be attached from the P-side to cyt
c, one explanation is that P
+ in the illuminated RCs would receive an electron from cyt
c (oxidizing cyt
c, Fe
3+) while the negative charge would be transferred to MV and diffused to the bulk electrolyte. Therefore, only RCs that were coupled to cyt
cs would enhance
Qs. It should be mentioned that due to the insulating properties of the gate insulator, there is no charge transfer between cytochrome and the transistor channel. In fact, the advantage of this method is that the threshold voltage changes only with the charge density, not the charge transfer rate (photocurrent). The charge density is directly proportional to the number of the attached proteins.
Similar to the approach with cytochrome, the additional charge density generated by the coupled RCs under illumination was estimated to be 8.34 × 10
−10 C/cm
2 from the threshold voltage shift in the transistor (
Figure 3b). Considering that each RC can add one positive charge, the density of the properly attached RCs to cyt
cs was estimated to be 5.21 × 10
9 (= 8.34 × 10
−10/1.6 × 10
−19) proteins/cm
2. This implies coupling success rate of 33% (5.21 × 10
9/1.6 × 10
10) for RCs to cyt
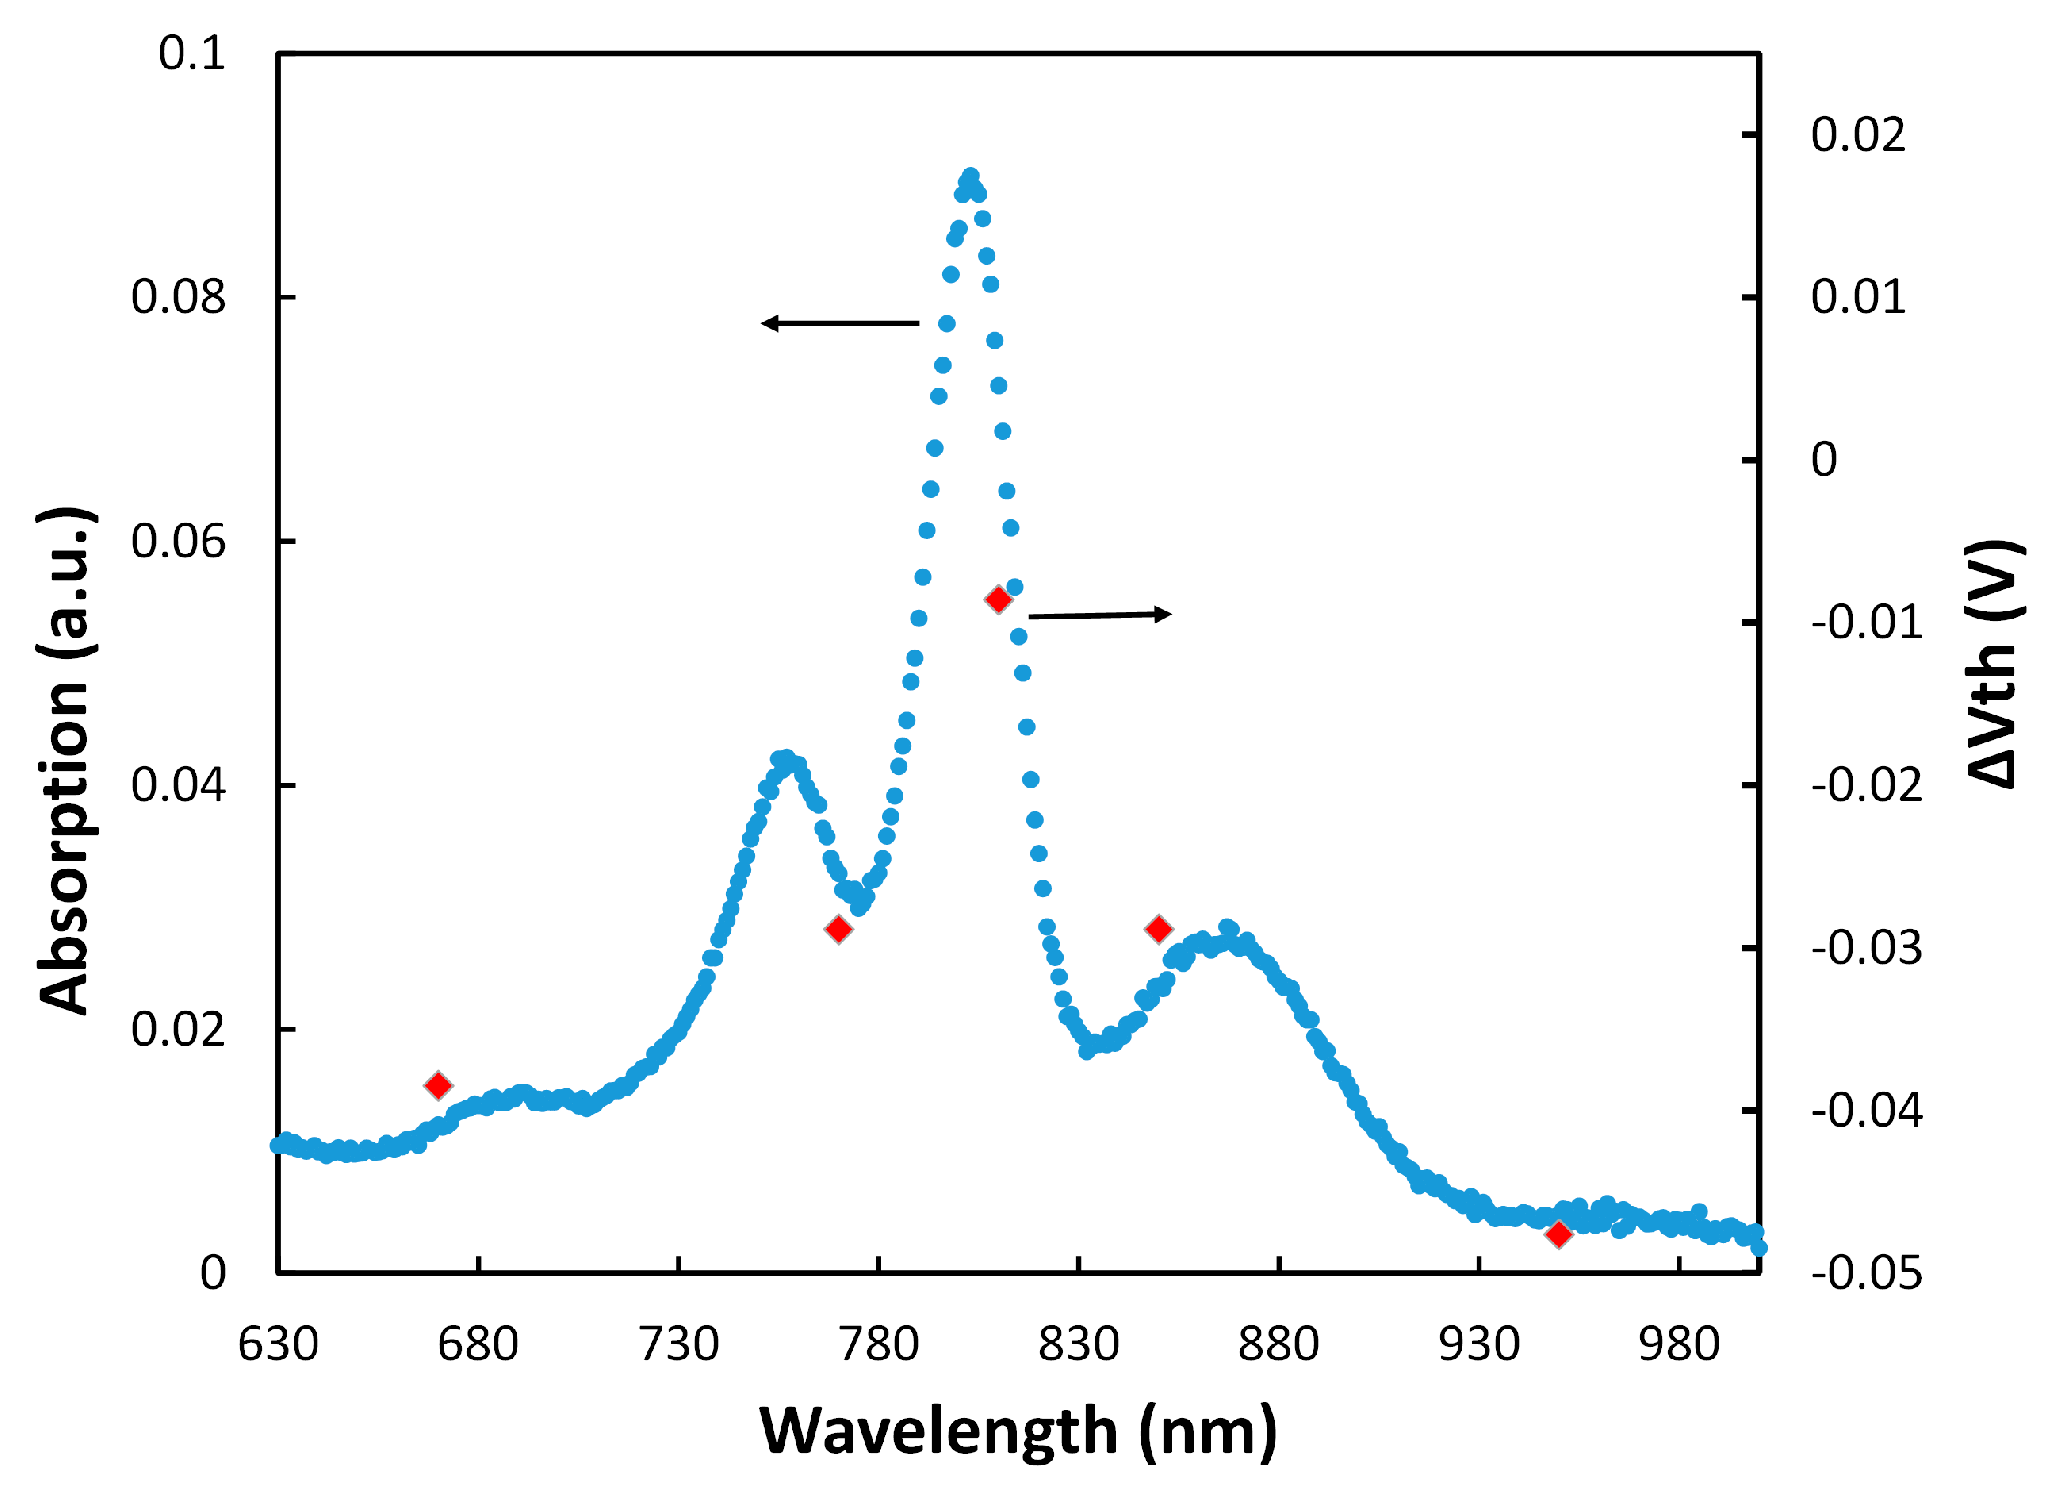
cs which means that for every three cytochrome proteins on the SAM layer, one can successfully couple to RCs. To confirm that the generated charges were actually from RCs, Δ
Vth (
Vth w RC −
Vth wo RC) was calculated at various wavelengths when the transistor was illuminated with monochromatic LEDs with low intensity.
Figure 4 shows that Δ
Vth follows the absorption spectrum of RCs.
The results in
Figure 4 also show that the electrochemical transistor with immobilized RCs could be used as a photosensor for detecting low light intensities. It should be mentioned that we have tested different RC immobilization configurations for making a photosensor, including only the RC, linker+RC, and cyt
c+RC on the Si
3N
4 gate insulator. Although some shift in the threshold voltage was observed in those configurations, the monochromatic illumination tests did not show any pattern (like the one in
Figure 4) to verify generation of the gate charges by the RC. This confirmed that the linker+cyt
c+RC structure generates an RC orientation for effective coupling to the cyt
c protein.


