1. Introduction
Microneedles are defined as micron-sized needles, with their height ranging from 25 to 2000 μm. They are made of various materials, such as metals, ceramics, and polymers, and have different shapes for specific applications, such as solid, hollow, coated, or dissolvable [
1,
2]. Usually, the microneedles are used in an arrayed format, called microneedle arrays (MNA), which can be fabricated by using various processing methods such as lithography or micro-molding. They have a variety of applications, ranging from drug/vaccine delivery, patient monitoring, and disease diagnosis to cosmetic applications. One of the unique advantages of the MNA is its painless or minimally invasive nature [
3,
4].
On the other hand, microneedle electrode arrays (MEAs) are an extension of MNAs that are coated with conductive materials by various deposition techniques [
5]. The addition of electrical conduction, i.e., the formation of microneedle electrodes, enables various applications using electrical signals. Therefore, the applications of MEAs include the monitoring of bio-signals, such as electrocardiography (ECG), electromyography (EMG), and electroencephalography (EEG) [
6]. The MEAs can also be used for neural interfaces with the capability of neural recording and neural stimulation [
7]. These bio-signals are vital for understanding the pathological and physiological conditions of patients.
In the meanwhile, diabetes, a chronic metabolic disorder due to impaired insulin secretion or action, is one of the significant public health concerns worldwide [
8]. In general, the diabetic patients experience an abnormal fluctuation of glucose levels in the body. The glucose level in the body should be maintained in a specific range; otherwise, diabetes may lead to severe complications such as high blood pressure, strokes, retinal damage, neuropathies, kidney failure, skin ulcers, and cardiovascular diseases. Thus, continuous monitoring of the glucose level, with concomitant insulin medication, is the only solution for diabetes. The glucose level has been measured by an invasive finger-prick method, puncturing the finger with a lancet followed by analyzing the blood glucose level with a glucose meter, which is inconvenient and painful to patients. Moreover, it does not provide complete glucose level dynamics even with such frequent finger pricking [
9]. Therefore, it is essential to develop a method to monitor the glucose level continuously by attaching a device to the human body in a wearable form and providing glucose readings every 1~5 min along with glucose trends and alarms for hypo and hyperglycemic conditions [
10]. Further, the continuous glucose monitor (CGM) can be connected to an insulin injection pump to adjust delivery in response to the monitor readings.
There have been numerous sensing methods for CGM [
11,
12,
13,
14,
15,
16,
17,
18], which can be roughly classified into non-invasive, minimally invasive, and invasive ones. Non-invasive CGMs are mostly related to the use of optical or spectroscopic approaches and some transdermal methods such as impedance spectroscopy and reverse iontophoresis; invasive CGMs include subcutaneous enzymatic sensors and are now available in the market. Minimally invasive CGMs are based on the use of microneedles, where the needles in hollow or microporous form extract interstitial fluid for further in vitro glucose level determination.
In this work, we have demonstrated the facile fabrication of MEAs with no need for expensive lithography processes. The method developed here exploits proper control of interfacial adhesion between materials involved, in addition to transparent and conformable polymeric shadow masks that are made by a modified molding technique [
19,
20]. Specifically, electrode materials (Au/Ti) were sequentially deposited, through the transparent shadow mask, onto a hole-patterned elastomeric polydimethylsiloxane (PDMS) stamp, which completes the formation of patterned MEAs. Upon peeling off the poured/cured polymeric material directly yields MEAs having conductive materials on the whole 3-dimensional parts of the sample, together with 2-dimensional patterned interconnections and contact pads at the same time. The optical transparency of the polymeric shadow mask enables easy and accurate alignment onto the patterned elastomeric substrate manually. Also, the shape of microneedles can be easily manipulated, from simple cylinders to cone-like shapes, by exploiting the non-conformal coating of viscous liquid (polyimide varnish in this work) into the holes on elastomeric PDMS.
Depending on the needle shape, the skin penetration mechanism differs: mode I crack opening for cone-like microneedles and mode II shearing with simple cylinder-shaped needles [
21,
22]. The prepared MEAs have been applied for CGM using impedance spectroscopy. CGMs based on impedance spectroscopy do not involve any specific chemistry [
23], thus are vulnerable to many parameters that are not easy to control, such as sweat, temperature, and intimate contact between sensor and skin, to name a few. On the contrary, we have immobilized glucose oxidase (GOx) on MEAs, where the chemical reaction between GOx and glucose, including consecutive reactions, leads to the change in impedance that can be measured by MEAs. In general, enzyme-functionalized MEAs have been applied for CGM using electrochemical measurements [
24]. The impedance spectroscopy with enzyme-immobilized MEAs demonstrated in this work, however, has shown very promising results, in that the method is very sensitive and accurate to glucose level thanks to the redox chemistry involved. Further, the impedance-based CGM with enzyme-functionalized MEAs was found to be reliable and robust for long-term CGM, up to ~10 days with skin simulant. Overall, the simple and easy fabrication of MEAs based on the molding technique has successfully been demonstrated, and their application to CGM with GOx immobilization has shown promising results for minimally invasive CGM.
3. Results
There have been a variety of different fabrication techniques for microneedle arrays (MNAs) [
1,
2,
3,
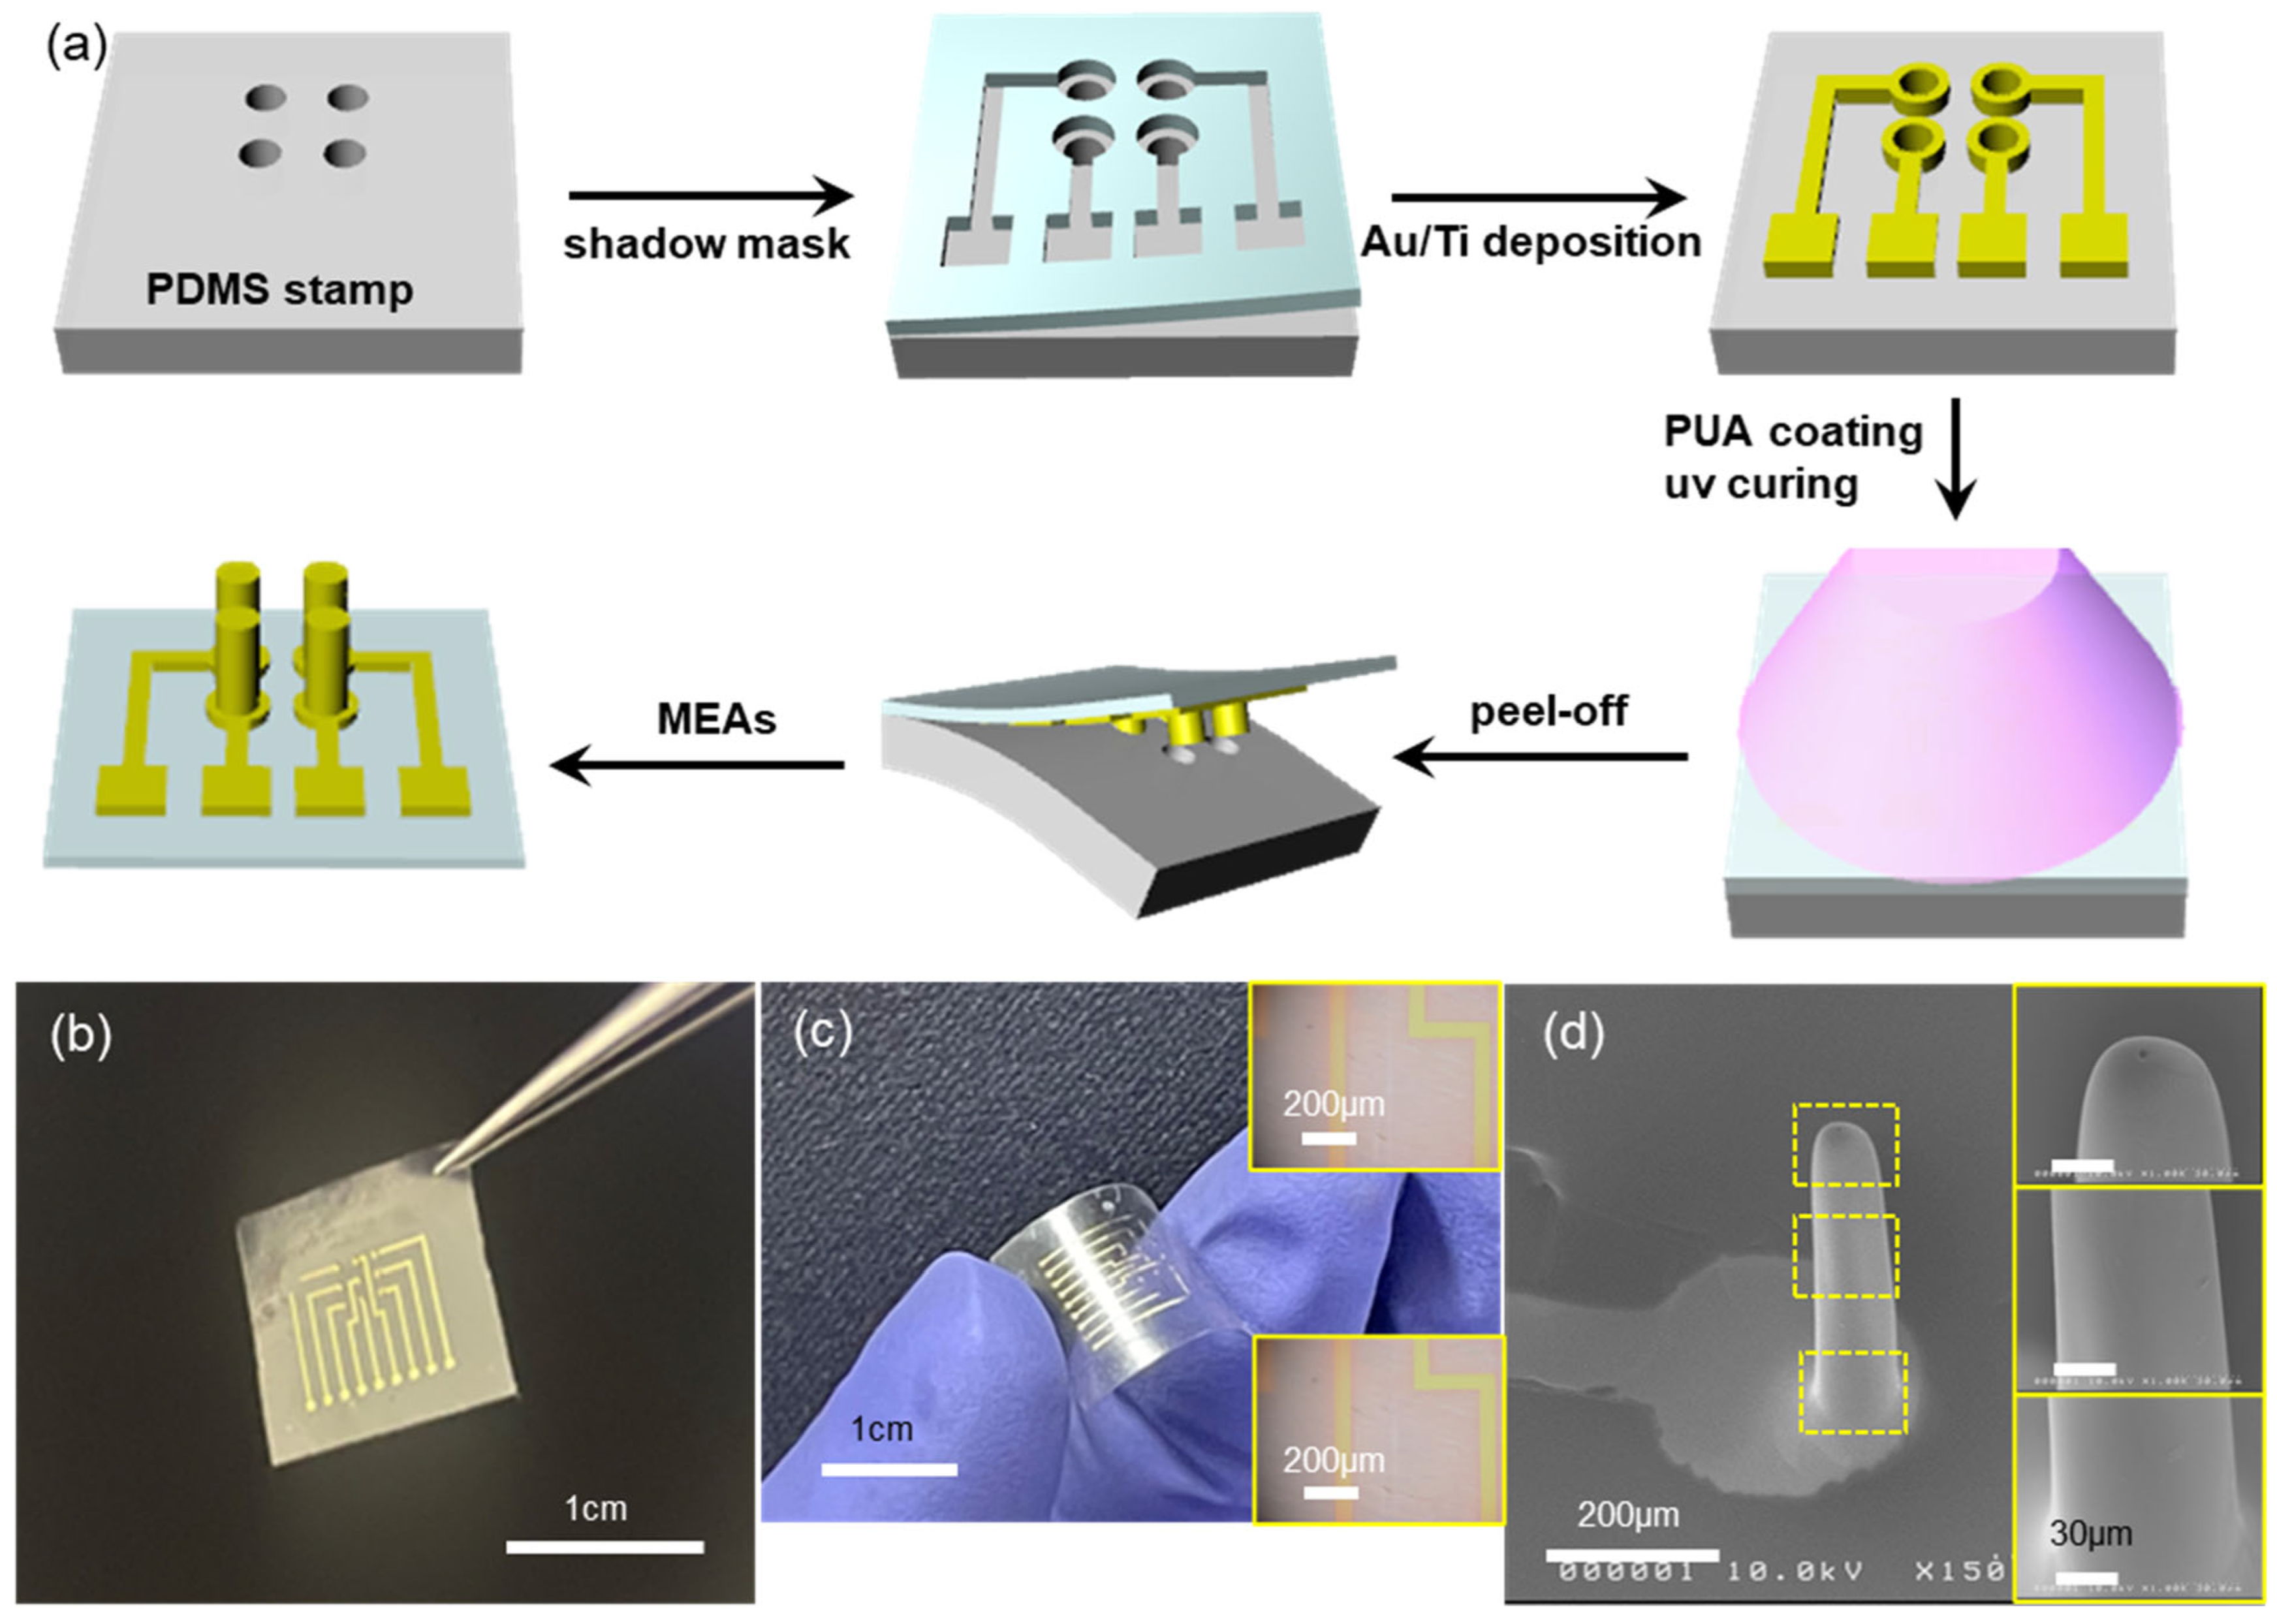
4], which can be easily extended to the fabrication of microneedle electrode arrays (MEAs). This is mainly due to the fact that MEAs can be simply prepared from MNAs by depositing electrode materials (metal thin films, in general) onto the MNAs using various deposition techniques such as sputtering, evaporation, and so on. In this work, we combined the two processes, MNA fabrication and patterned electrode deposition, into a single step, without using any costly processes such as lithography. The fabrication process starts with the hole-patterned elastomeric PDMS stamp, as shown in the first step of
Figure 1a, where the patterned PDMS stamp was replica-molded from a laser-drilled stainless steel plate (
Supporting Information, Figure S1), which is quick and cost-effective, too. The diameter and depth of holes on the PDMS stamp were 200 μm and 800 μm, respectively, with mutual spacing of 1 mm. Then, a proper shadow mask made of flexible polymer (will be discussed later) was manually aligned onto the patterned PDMS stamp (2nd step in
Figure 1a). The manual alignment was enabled by the transparent nature of the shadow mask and by the rather large (hundreds of μm or larger) feature size involved. The sample was then evaporated with thin metal films, Au(80 nm)/Ti(10 nm) in the present work, using a home-built electron-beam evaporator. Upon peeling off the shadow mask, the PDMS stamp now has patterned electrodes on it (3rd step in
Figure 1a). Drop-casting and UV-curing of curable polymer precursor (PUM-W6070, McNET) forms the MEAs with a thin (~80 μm) overcoat layer as shown in the 5th step of
Figure 1a. It should be noted here that the depth of holes on the PDMS stamp is ~800 μm deep, which means that simple casting of a viscous precursor solution would not guarantee the complete filling of such deep holes. Thus, a vacuum was applied to remove trapped air in the holes and facilitate the filling of viscous polymer precursor. Upon peeling off the cured polymer, it has three-dimensional microneedle arrays that are fully covered with metal thin film (i.e., MEAs), in addition to proper two-dimensional interconnection lines and contact pads at one end of the sample, as shown in the last step in
Figure 1a. The fabrication of MEAs shown in
Figure 1a does not need any costly lithographic processes such as photoresist coating, exposure with photomask, and wet chemical development; instead, the formation of microneedle arrays and the 3D/2D patterned electrodes was carried out in sequential steps of patterned evaporation through a shadow mask, prepolymer casting and curing, and peel-off.
Figure 1b shows a photo image of the fabricated MEAs. There are nine needle electrodes arrayed in a 3 × 3 pattern. Depending on the amount of prepolymer dispensed onto the electrode-patterned PDMS stamp, the MEAs can be very flexible, as shown in
Figure 1c. The inset OM images of
Figure 1c show the metal interconnection lines before (top) and after (bottom) the bending deformation. There are no noticeable cracks in the metal electrodes upon bending deformation. The flexible nature of our MEAs may be beneficial in applications where the MEAs should be conformed onto non-flat curved surfaces [
25,
26].
Figure 1d shows the SEM image of a microneedle electrode: the microneedle (200 μm in diameter and 800 μm in height, same as the hole dimension on the PDMS stamp) is conformally coated with metal (Ti/Au) electrode and the electrode is patterned very well. The inset SEM images show the magnified view of the needle surface, where the metal film shows no noticeable cracks or any defects.
The success of our process, the patterned electrode deposition with shadow mask and peel-off of molded MEAs with metal film intact, lies in the delicate control of adhesion between materials. For the metal film deposited on the PDMS stamp, the interfacial adhesion should be weak for the following peel-off. At the same time, the interfacial adhesion between the metal film and the cured polymer should be strong enough for the successful peel-off. For this, we have deposited Au onto the patterned PDMS stamp, followed by Ti deposition. In general, Au is inert and has weak adhesion with most materials such as semiconductors, insulators, or polymers. On the contrary, the Ti layer is often used as an adhesion layer due to its better adhesion to those materials. Therefore, the deposited Au/Ti metal films have relatively weak adhesion with the underlying PDMS stamp (note that PDMS also has very weak adhesion with other materials in its pristine form) because the Au is in direct contact with PDMS. On the other hand, the Ti makes direct contact with the cured polymer (PUA), leading to quite strong adhesion. In all, the delicate control of interfacial adhesion between materials (PDMS-Au-Ti-PUA) has enabled simple and facile fabrication of MEAs, as shown in
Figure 1. Otherwise, Ti/Au, instead of Au/Ti, has led to the failure of the MEA fabrications (
Figure S2). The process can be applied to MEAs having other dimensions, but it cannot be used for MEAs having re-entrant shape (i.e., a wider top with a narrower bottom) (
Figure S3).
Another enabling element in our approach is the polymeric shadow mask. Shown in
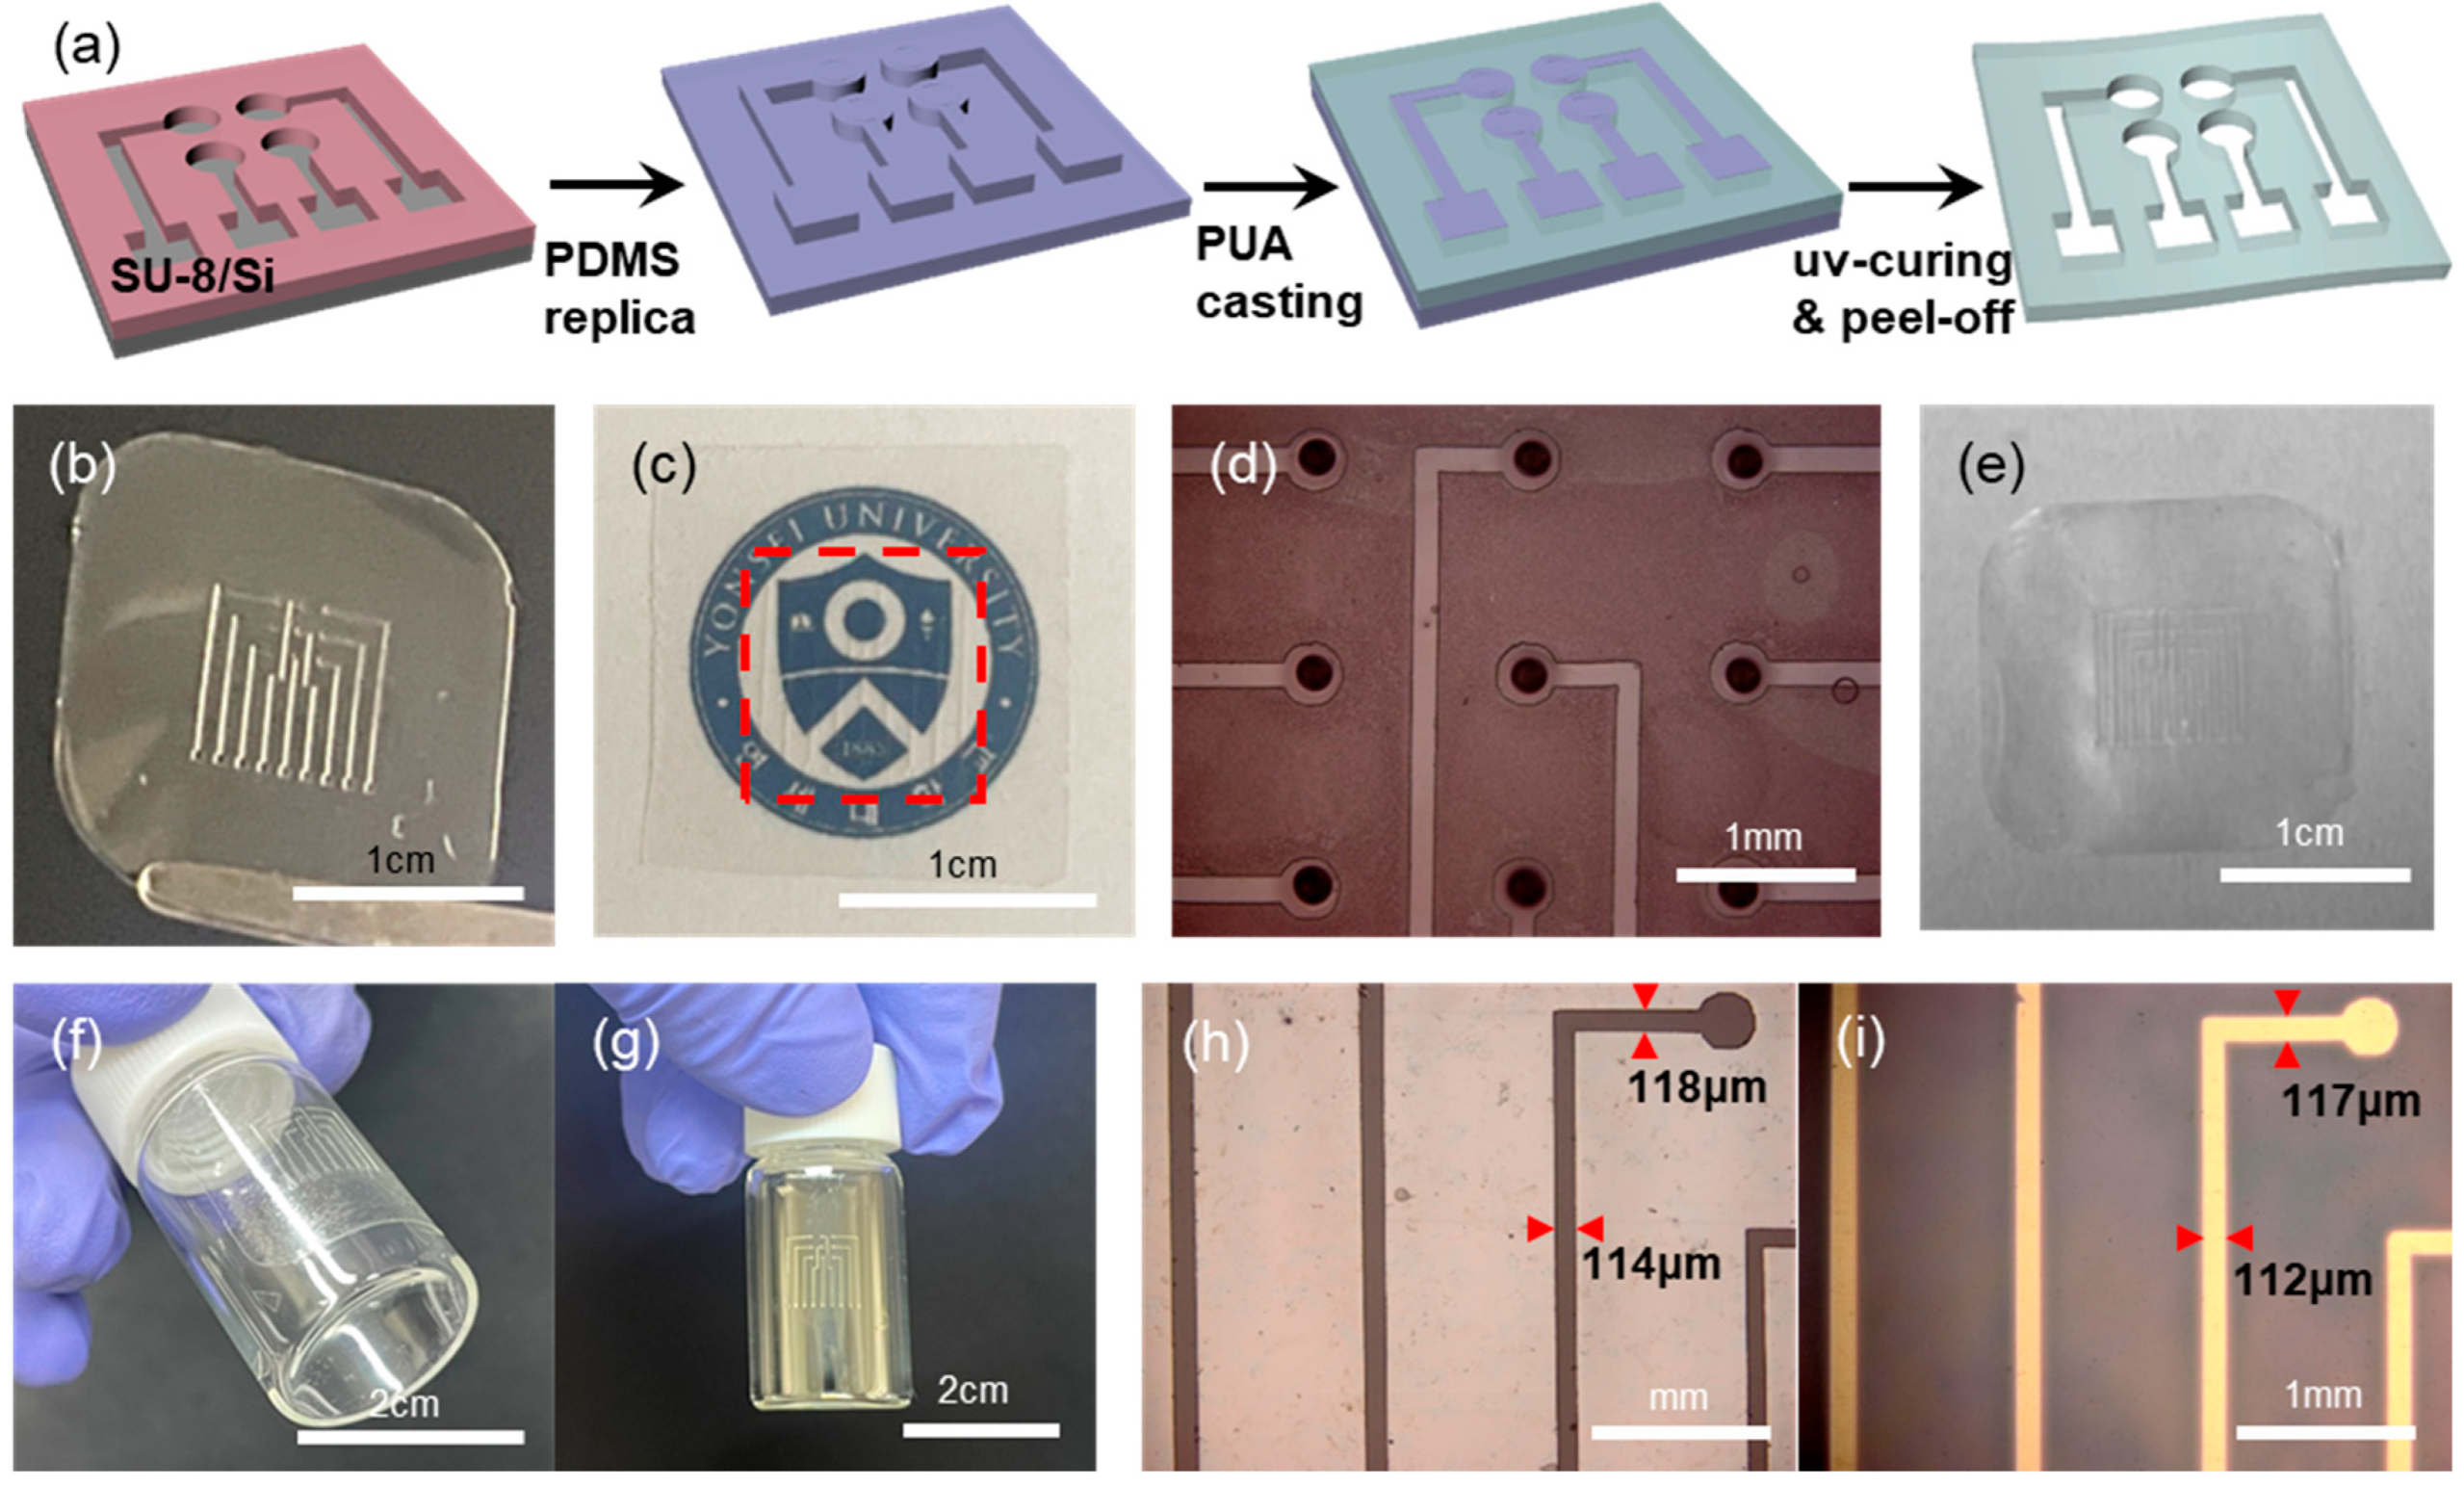
Figure 2a is the schematic illustration of the shadow mask fabrication. A PDMS stamp having protruding features is replicated from a master having patterned negative photoresist (SU-8) on a cleaned Si substrate. The thickness of the SU-8 photoresist is in the range of ~50 μm, which determines the thickness of the final shadow mask. Upon the PDMS stamp, an UV-curable prepolymer (PUM-3117) is dropped and spread with a glass pipette manually. Before the UV-curing of the prepolymer, the excess prepolymer on top of the pattern features of the PDMS is removed by mechanical scraping to expose the top surface of the patterns on the PDMS stamp. Following UV-curing and peel-off leads to the freestanding shadow mask film [
19,
20].
Figure 2b presents a photo image of such a polymeric shadow mask. It can be noted that the shadow mask is optically transparent, as shown in
Figure 2c. The existence of a shadow mask on top of our university logo (red dotted rectangle in
Figure 2c) is nearly indiscernible. This optical transparency of the shadow mask has facilitated the manual alignment onto the hole-patterned PDMS stamp, as shown in
Figure 2d. Even with manual handling, the alignment is quite good, due largely to the fact that the feature size involved is in the hundreds of microns range. Another advantage of our shadow mask is its recyclability. After the metal deposition with such a transparent shadow mask, the mask becomes opaque due to the deposited metal films. Then the mask with the deposited metal films can easily be cleaned again by etch-removal of the metals, leading to the transparent shadow mask again: shown in
Figure 2e is the photo image of a shadow mask after 3 cycles of deposition/cleaning. In principle, the mask can be recycled indefinitely.
Furthermore, the shadow mask is thin and flexible, which enables conformal contact with curved surfaces. The transparent and flexible shadow mask was conformally attached onto a glass vial in
Figure 2f. After the deposition of metal, the glass vial surface has a patterned electrode,
Figure 2g, upon the removal of the shadow mask. Also, the flexible and conformable nature of our shadow mask has led to the pattern transfer with high fidelity. Shown in
Figure 2h,i are the OM images of line-shaped openings on a shadow mask (
Figure 2h) and the deposited metal lines on a substrate surface (
Figure 2i), respectively. There is negligible variation in the linewidths between features on the mask and those on the deposition surface. This is largely due to the conformal contact of the shadow mask on the deposition surface, together with the near-vertical sidewall of the pattern features on the shadow mask (
Figure S4).
In general, the shape of the microneedle in MNAs or MEAs is known to be a very important parameter in terms of penetration mechanics into skin [
17,
22,
27,
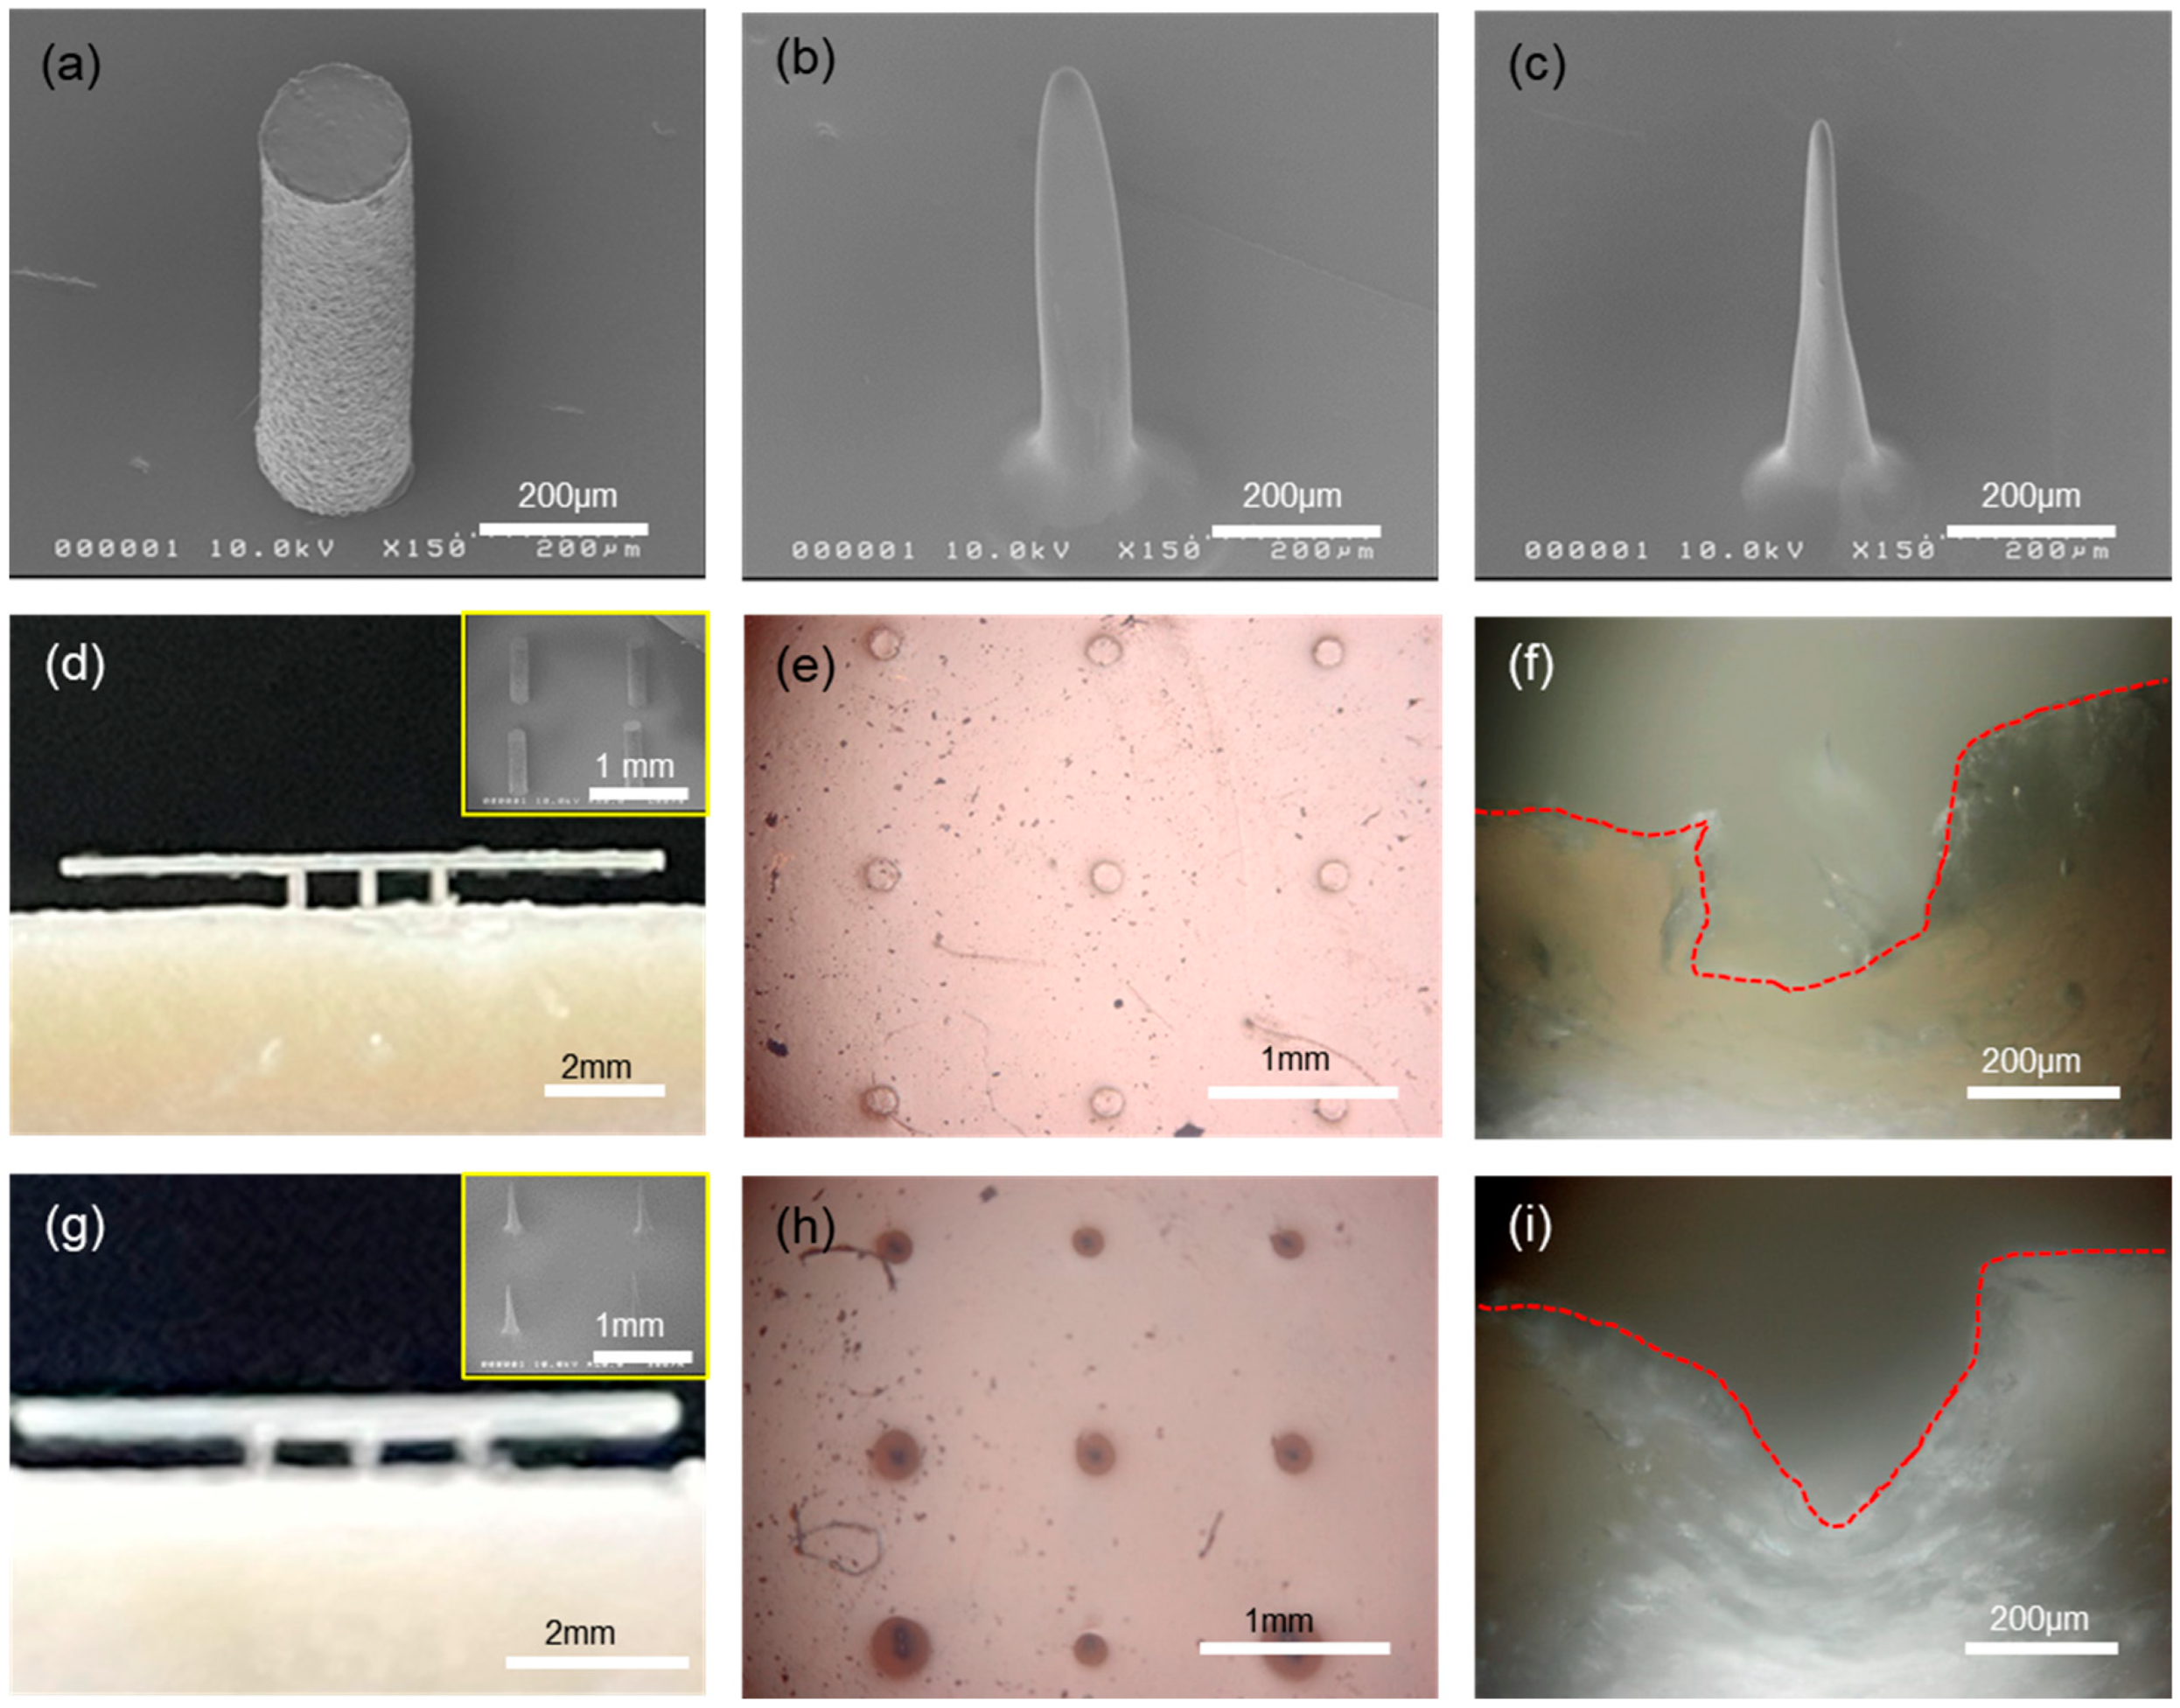
28]. In our process, the shape of the microneedle can be modified from a simple cylinder to a cone-like shape, as shown in
Figure 3a,c. Starting with a simple cylinder-shaped microneedle, the tip of the needle can be reduced in radius of curvature. This was made possible by spin-coating the PDMS stamp having hole patterns with a polymer solution (
Figure S5). When the cylindrical hole is spun with polyimide (PI) varnish solution, the coating is not uniform everywhere; instead, the bottom region of the hole gets thicker compared to the thickness around the sidewall. That is, there is a thickness gradient from a thicker bottom to a thinner top along the sidewall, due primarily to the confined geometry. Thus, the initial cylindrical hole changes into a wider top with a narrower bottom in shape, which leads to the needle shape with a sharp tip and wide bottom upon replication with PUA, as shown in
Figure 3b. Using this microneedle as a master mold, another PDMS stamp can be replicated, and now the holes in the PDMS stamp take the microneedle shape of
Figure 3b with an upside-down configuration. The same process, spinning of PI solution into this modified PDMS stamp and replication of microneedles, can be repeated, which leads to much narrower tips with wider bottoms, i.e., cone-like shaped microneedles as shown in
Figure 3c. In all, the control of the microneedle shape can easily be achieved by repeating the above procedures, i.e., polymer coating and replication. In
Figure S6, the change in the radius of the needle tip is plotted as a function of the number of such cycles.
The penetration test of our microneedles was carried out with porcine skin and eco-flex elastomer using differently shaped microneedles.
Figure 3d,g shows photo images of the microneedle arrays that were halfway inserted into the porcine skin (intentional partial indentation), and the inset SEM images in both show the microneedle arrays that were used for the penetration test. The penetration was done by gently pressing the arrays into skin manually. Note here that the microneedle arrays in
Figure 3d are in a simple cylindrical shape, while those in
Figure 3g are cone like in shape, respectively. Under the application of external force to insert microneedle arrays into the skin, the shape of microneedles has a profound effect on the penetration mechanics and pain experienced by patients. First, the smaller the tip radius, the lower the penetration force that is needed for the insertion. More importantly, the fracture of skin induced by the penetrating microneedles can have quite different fracture modes depending on the tip shape of the microneedles [
21,
22]. Shown in
Figure 3f,i are the cross-sectional OM images of the needle-penetrated porcine skins, which clearly show the different modes of skin fracture. For cylindrical microneedles, as shown in
Figure 3f, the penetrated cross-section looks like a rectangular depression (refer to the delineated red-dotted line). In this case, the fracture in the porcine skin is a mode II crack, or sliding mode, where the shear stress acts parallel to the plane of the crack. The fractured skin fragments are largely remaining on the recessed region, leading to increased penetration force.
On the contrary, the penetrated cross-section shows a V-groove shape, as shown in
Figure 3i, for cone-like microneedles. The fracture of the porcine skin is a mode I crack, or opening mode, where the tensile stress acts perpendicular to the plane of the crack. In this case, the fractured skin fragments are displaced sideway, leading to smaller penetration force compared to the mode II crack. Therefore, mode I crack is favorable for skin penetration due to its low penetration pressure, compared to mode II crack. It should be noted that the microneedle arrays could be fully inserted into the porcine skin to the penetration depth of ~800 μm. The difference in skin fracture modes induced by microneedles having different shapes can be easily identified from the top-view OM images of
Figure 3e,h. Note here that an elastomeric eco-flex film as a skin simulant was used for the test shown in
Figure 3e,h. With cylindrical microneedles, the radii of the penetration marks are almost the same as those of the microneedles, as shown in
Figure 3e. However, the radii of the penetration marks are much larger than those of the microneedles for cone-shaped microneedles, as shown in
Figure 3h. This is due to the laterally displaced skin fragments during penetration in mode I crack opening.
The fabricated MEAs can be used for the continuous monitoring of glucose level in diabetic patients in wearable form with minimally invasive characteristics. In this preliminary work, we have used impedance spectroscopy to measure the change in glucose concentration in a continuous fashion. It should be noted that there is no need for any sensing chemistry in typical impedance spectroscopy for glucose monitoring in literature. However, this makes the method vulnerable to other variables such as temperature, moisture, or change in electrolyte balance, resulting in poor accuracy for practical application. However, here we have combined impedance spectroscopy with specific sensing chemistry for highly accurate, sensitive, and reliable glucose detection. The sensing chemistry is based on the glucose oxidase, GOx. The impedance between electrodes in MEAs, immobilized with GOx, changes according to the reaction between glucose and the GOx enzyme. The glucose-GOx reaction induces a change in impedance mainly by a change in capacitance and Warburg impedance, which makes the method reliable, quick, and sensitive under complex measurement conditions [
29,
30]. Shown in
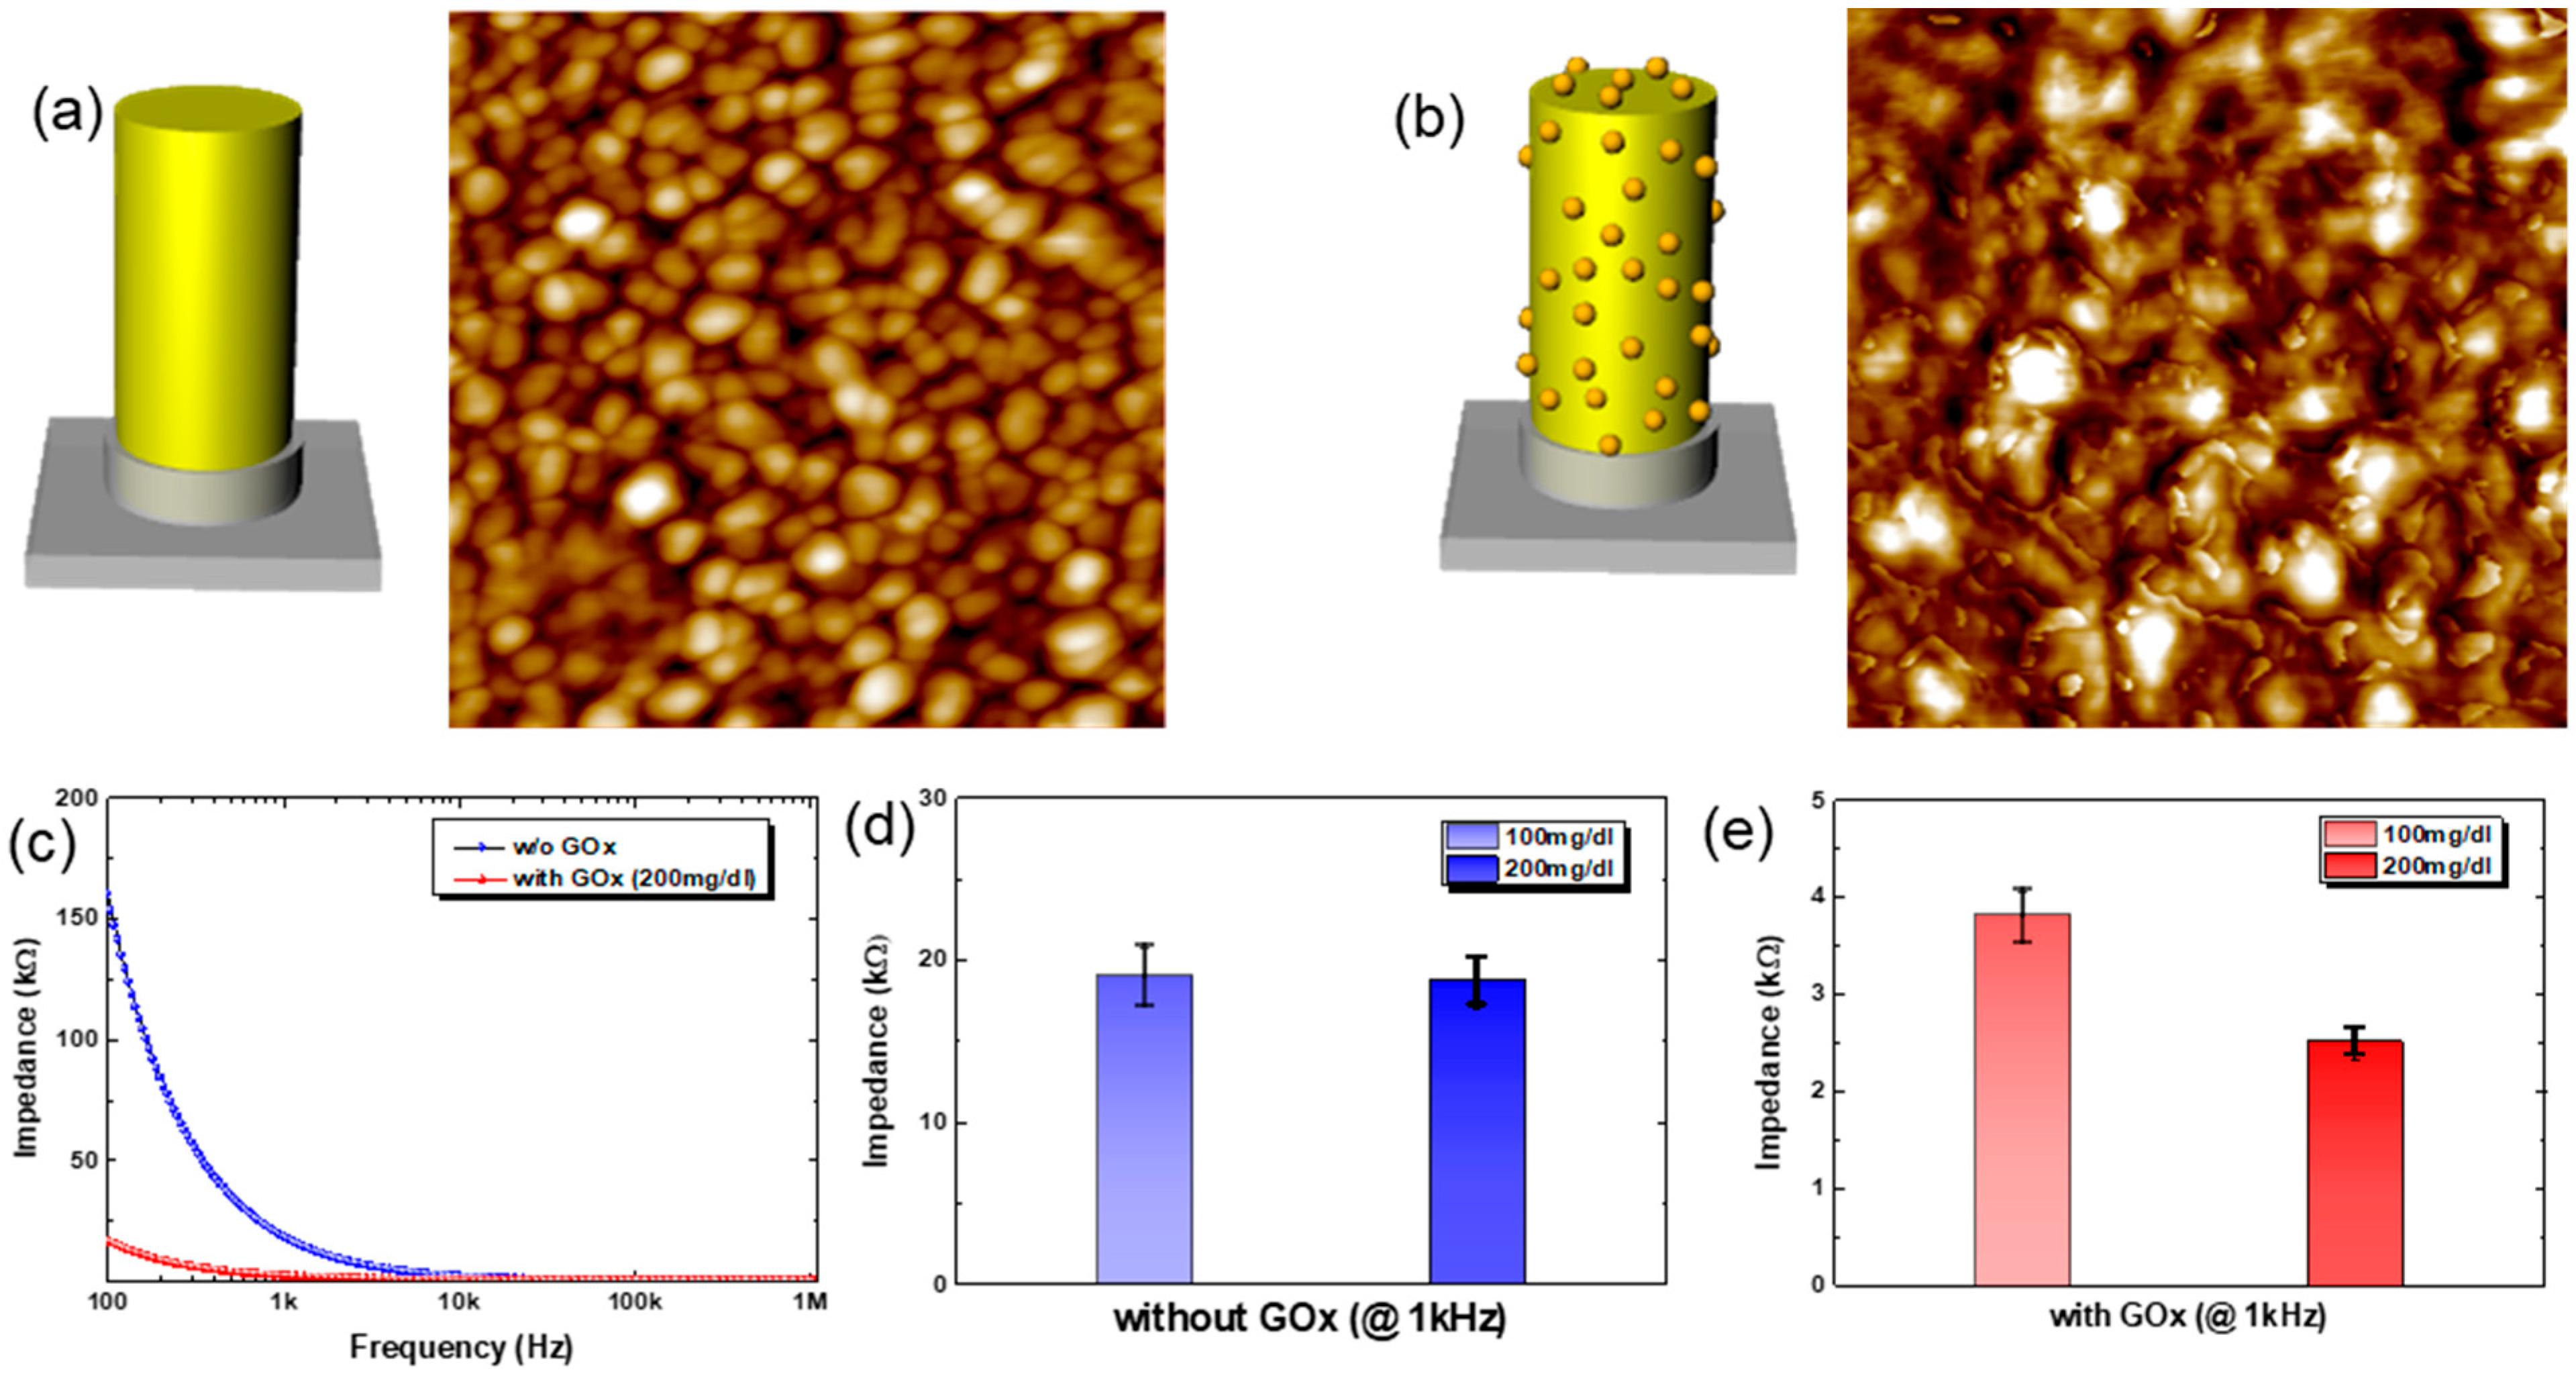
Figure 4a,b are the schematic drawings for electrodes and the corresponding AFM images before/after the GOx immobilization. For the AFM measurements, Au (80 nm) was deposited onto a planar Si substrate as an electrode. Before the immobilization of the GOx enzyme, as shown in
Figure 4a, the electrode surface reveals the grains of Au. After the immobilization of GOx onto Au electrode, however, distinct small nanoscale features are observed on the Au electrode surface, as shown in
Figure 4b. The nanoscale features are due to the immobilized GOx on the Au electrode. Note here that the MEA substrate was covered with spun-cast PDMS, except for the microneedle (3D) electrodes and contact pads, before the GOx immobilization onto MEAs for glucose sensing, to minimize the unwanted cross-talk among electrodes when in contact with liquid electrolytes (
Figure S7). The gray-colored region in the schematic drawings in
Figure 4a,b, therefore, denotes the coated PDMS layer to minimize cross-talk.
Figure 4c shows the plot for the change in the real part of impedance between a reference electrode (center electrode in the 3 × 3 arrays) and another electrode in the array under a fixed concentration of glucose solution (200 mg/dL). First of all, the GOx-immobilized MEAs show much lower impedance compared to that of MEAs having no GOx. This is due to the enzymatic reaction between GOx and glucose, which generates electroactive species such as hydrogen peroxide and gluconic acid [
30]. These electroactive species ionize in the solution (here PBS buffer at a pH of ~7). Note here that the reactions occur near the electrodes that have immobilized GOx. This enhances ion diffusion to the electrode, reducing Warburg impedance and thus the measured impedance, too. In addition, the aggregation of the charged ionic species near the electrode decreases the capacitance by the electrical double layer, C
EDL, which again contributes to the reduction in impedance. Also, the measured impedance decreases with the frequency in the frequency range from 100 Hz to 1 MHz, suggesting that the movement of ionic species is largely responsible for the change in impedance, such as C
EDL and Warburg impedance. This can be used to enhance the accuracy and reliability of the sensor by measuring at multiple frequencies. Moreover, it might be used to detect different analytes, due to the fact that different analytes show their unique frequency responses.
As for the choice of frequency, we measured the impedance at 1 kHz, and the results with or without GOx are shown in
Figure 4d and
Figure 4e, respectively. Without GOx immobilization, the Au-coated MEAs show no noticeable difference in impedance values with varying concentrations of glucose solution at 1 kHz, as shown in
Figure 4d. With the immobilization of GOx on Au-coated MEAs, however, there is a distinct difference in the impedance values depending on the concentration of glucose solution at 1 kHz, as shown in
Figure 4e. It should be noted here that the absolute values of impedance from MEAs with/without GOx immobilization are quite different: ~20 kΩ for MEAs without GOx vs. 2~4 kΩ for MEAs with GOx, i.e., an order of magnitude difference. This is due to the specific chemistry between GOx and glucose. Similar approaches show quite good detection of analytes using other receptors [
31,
32]. In all, we verify that our approach, impedance spectroscopy with specific sensing chemistry, works well for glucose detection.
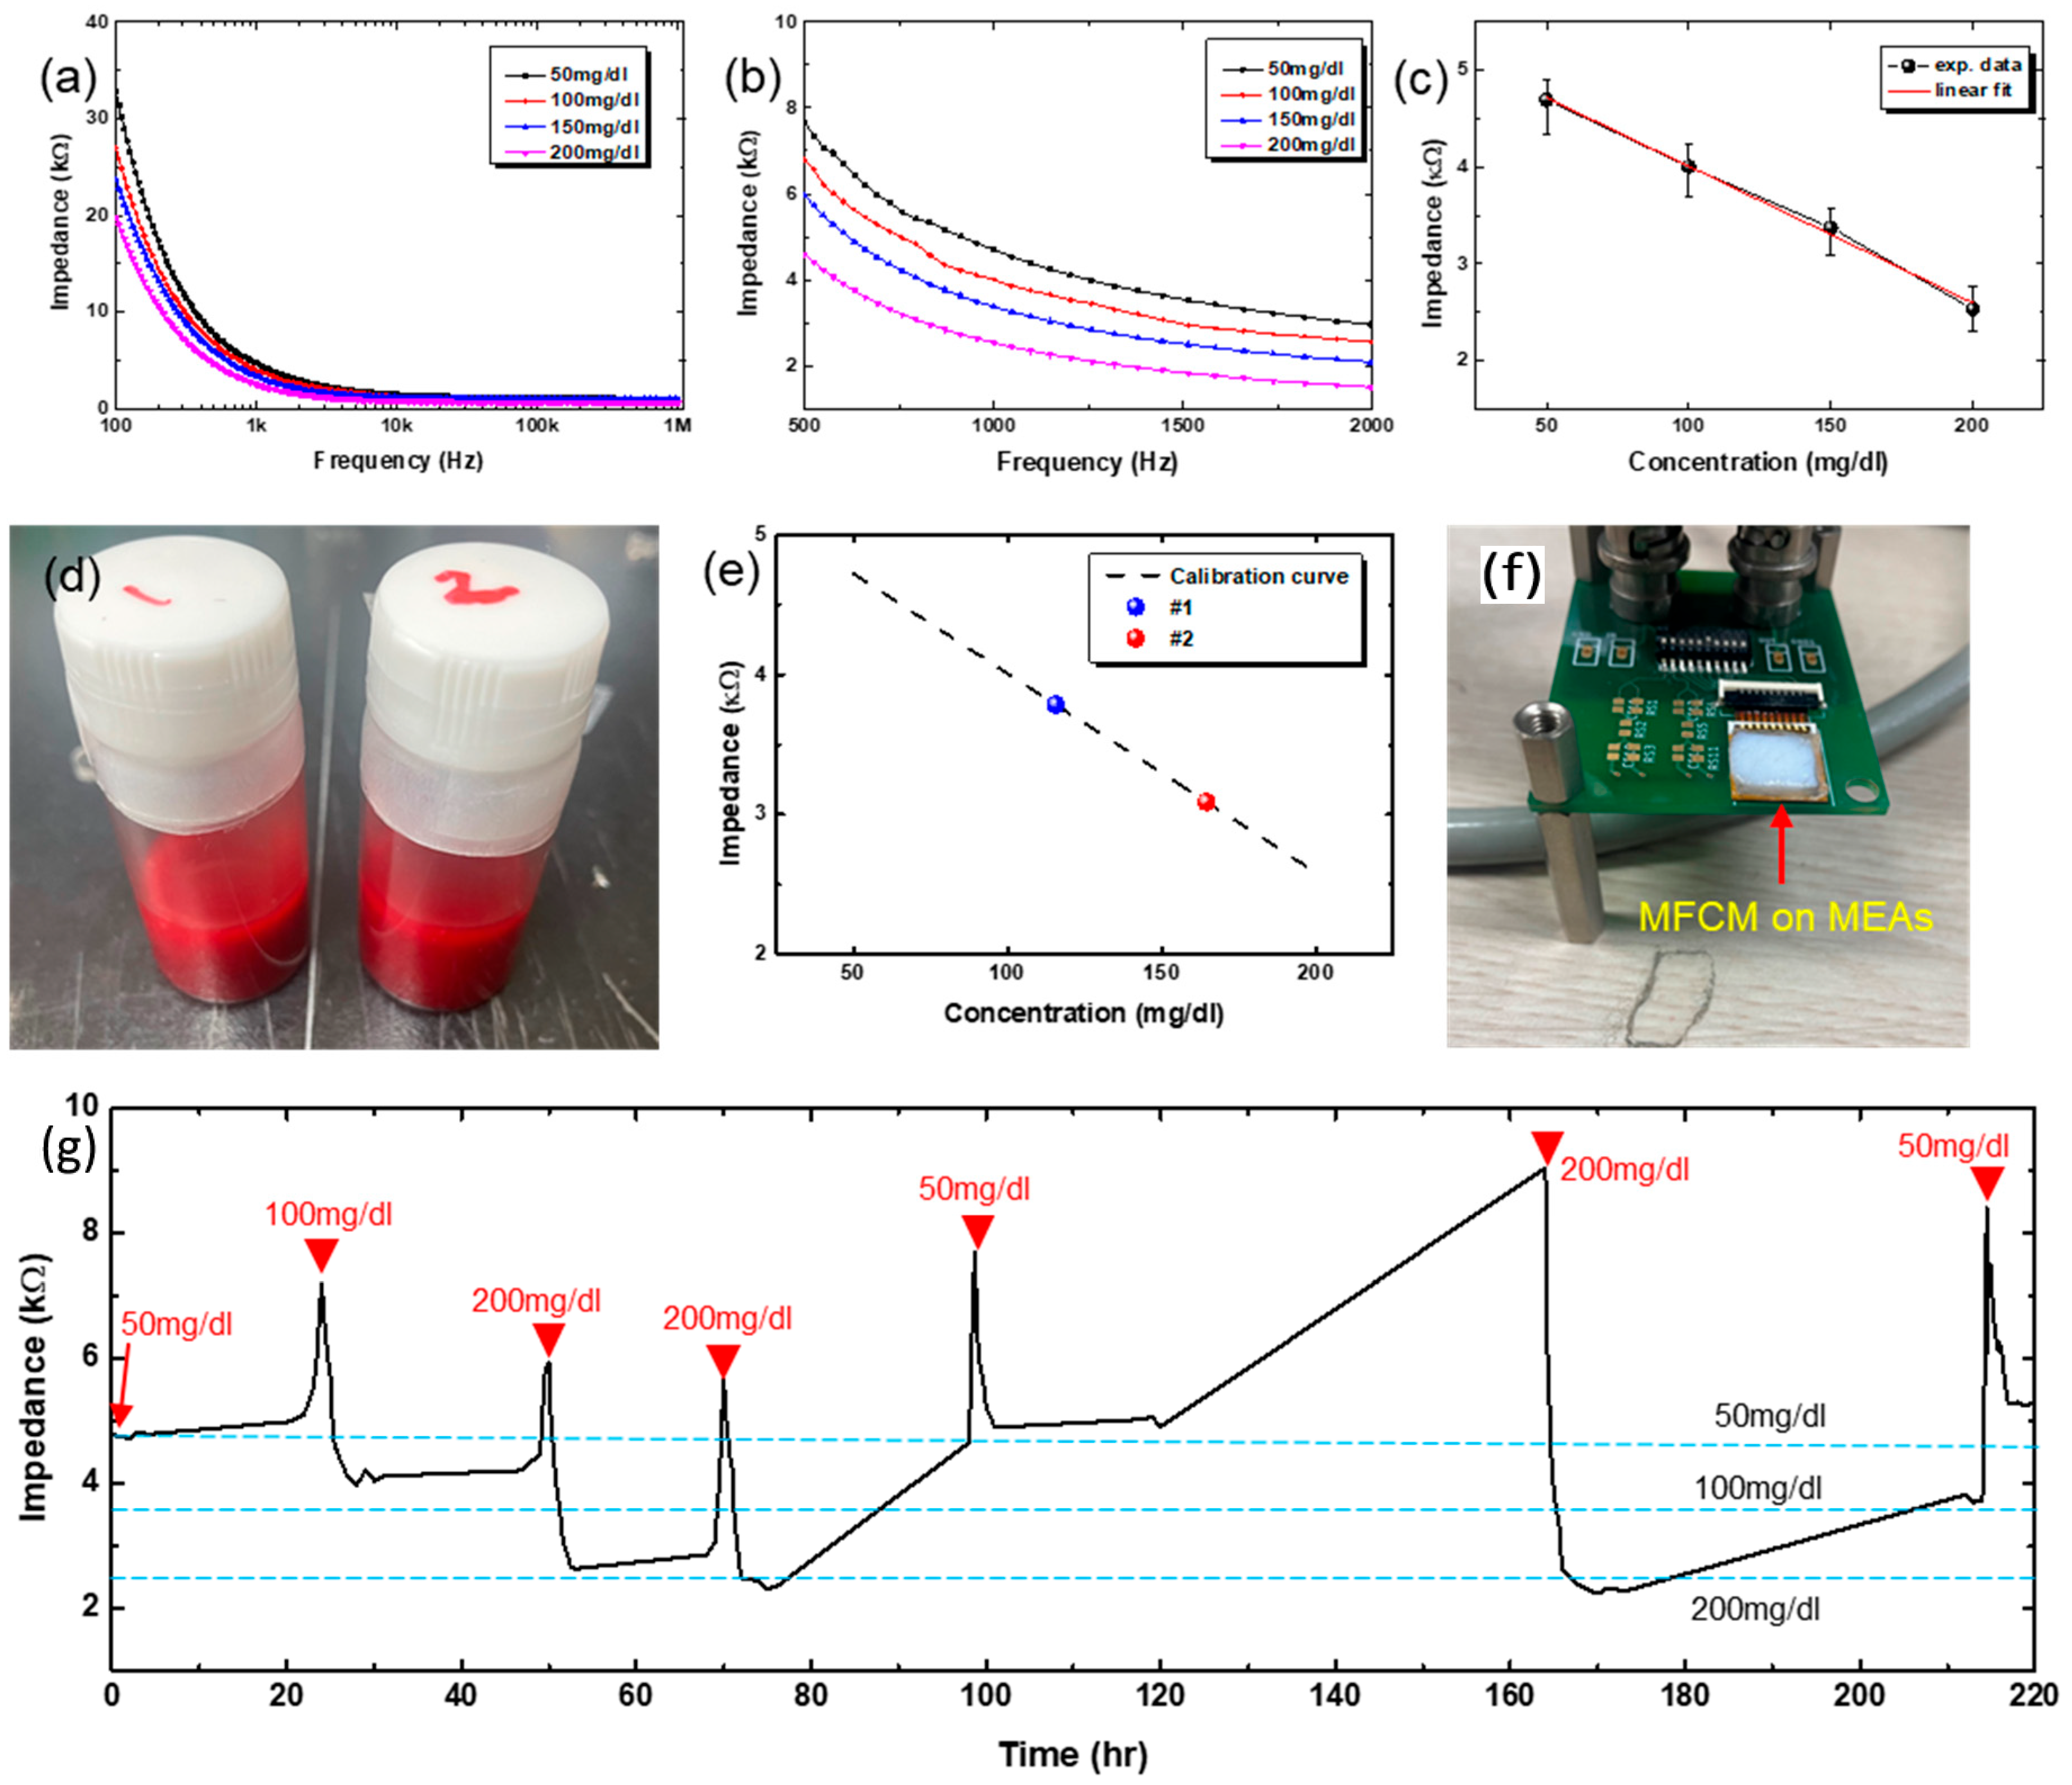
Figure 5a shows the change in impedance spectra for different concentrations of glucose solution, ranging from 50 mg/dL to 200 mg/dL. Shown in
Figure 5b is the magnified view of
Figure 5a, around 1 kHz, which shows quite a distinct difference in impedance over the frequency range from 500 Hz to 2 kHz. We used the impedance values at 1 kHz, and the corresponding values are plotted in
Figure 5c as a function of glucose concentration. The impedance decreases with glucose concentration, and the change is quite linear over the investigated range of glucose concentration. The experimentally measured data are fitted into a line by linear regression, shown as a red line, and the fitted line plays the role of a calibration curve.
Figure 5d shows the photo image of animal blood samples having different concentrations of glucose, denoted as #1 and #2. Using these blood solutions, the impedance values at 1 kHz were measured and plotted in
Figure 5e, indicated by #1 and #2. The calibration curve in
Figure 5c was re-drawn for comparison purposes. As shown, the measured impedance values with animal bloods having pre-defined concentrations of glucose lie on the calibration curve with negligible errors. From this, glucose concentration was determined to be 109~123 mg/dL for the #1 sample and 153~176 mg/dL for the #2 sample, respectively. The same blood samples were measured by a commercial glucose sensor and yielded 111 mg/dL for the #1 sample and 159 mg/dL for the #2 sample, respectively. The glucose concentrations measured by our GOx-immobilized MEAs are comparable to the value measured by the commercial sensor. Note here that the impedance (thus glucose concentration) measurement with our MEAs was carried out with all 8 electrodes (except a reference electrode), yielding slightly different values of glucose concentration, which is the reason for the ranged values of glucose concentration instead of a single value (
Figure S8). These data were all tabulated in
Table 1.
To check the possibility of the long-term glucose measurements, the MEAs were bonded to a printed circuit board having a comprehensive circuit for impedance spectroscopy, as shown in the photo image of
Figure 5f. The MEAs were inserted into the micropig Franz cell membrane (MFCM) that was pre-soaked with a specific concentration of glucose solution for the measurement. As the MFCM dries with time, the impedance starts to increase. Once the impedance starts to increase by MFCM drying, the MEAs with MFCM are stored in a Petri dish that is saturated with water vapor to re-hydrate the MFCM. To re-start the measurements, glucose solutions having different concentrations were dropped onto the MFCM. Shown in
Figure 5g is the long-term test result, plotted impedance values at 1 kHz as a function of time. As shown, the GOx-immobilized MEAs were found to be able to measure the glucose level for ~10 days. The blue-dotted horizontal lines denote the impedance values corresponding to different concentrations of glucose as noted, based on the calibration curve shown in
Figure 5c. The slight discrepancy between long-term measurement results and the calibrated values is believed to be due to the uncertainty in the glucose concentration. As explained above, we have added solution drops onto the MFCM intermittently (indicated by red arrowheads in
Figure 5g), which may mix with the remaining glucose solution inside the MFCM, making the exact determination of glucose concentration difficult. Another possible cause is that the MFCM seems to partially dry even with storage in a water-saturated environment. Once dried, the MFCM cannot absorb the glucose solution as before, meaning a kind of irreversible permanent degradation. This may lead to underestimation of glucose level, because some amount of glucose may be trapped in the inactive region of MFCM. Nevertheless, the GOx-immobilized MEAs have shown the possibility for long-term stable operation, which is critically important for CGM.
The MEAs are made of flexible polymer, PUA. The same process steps shown in
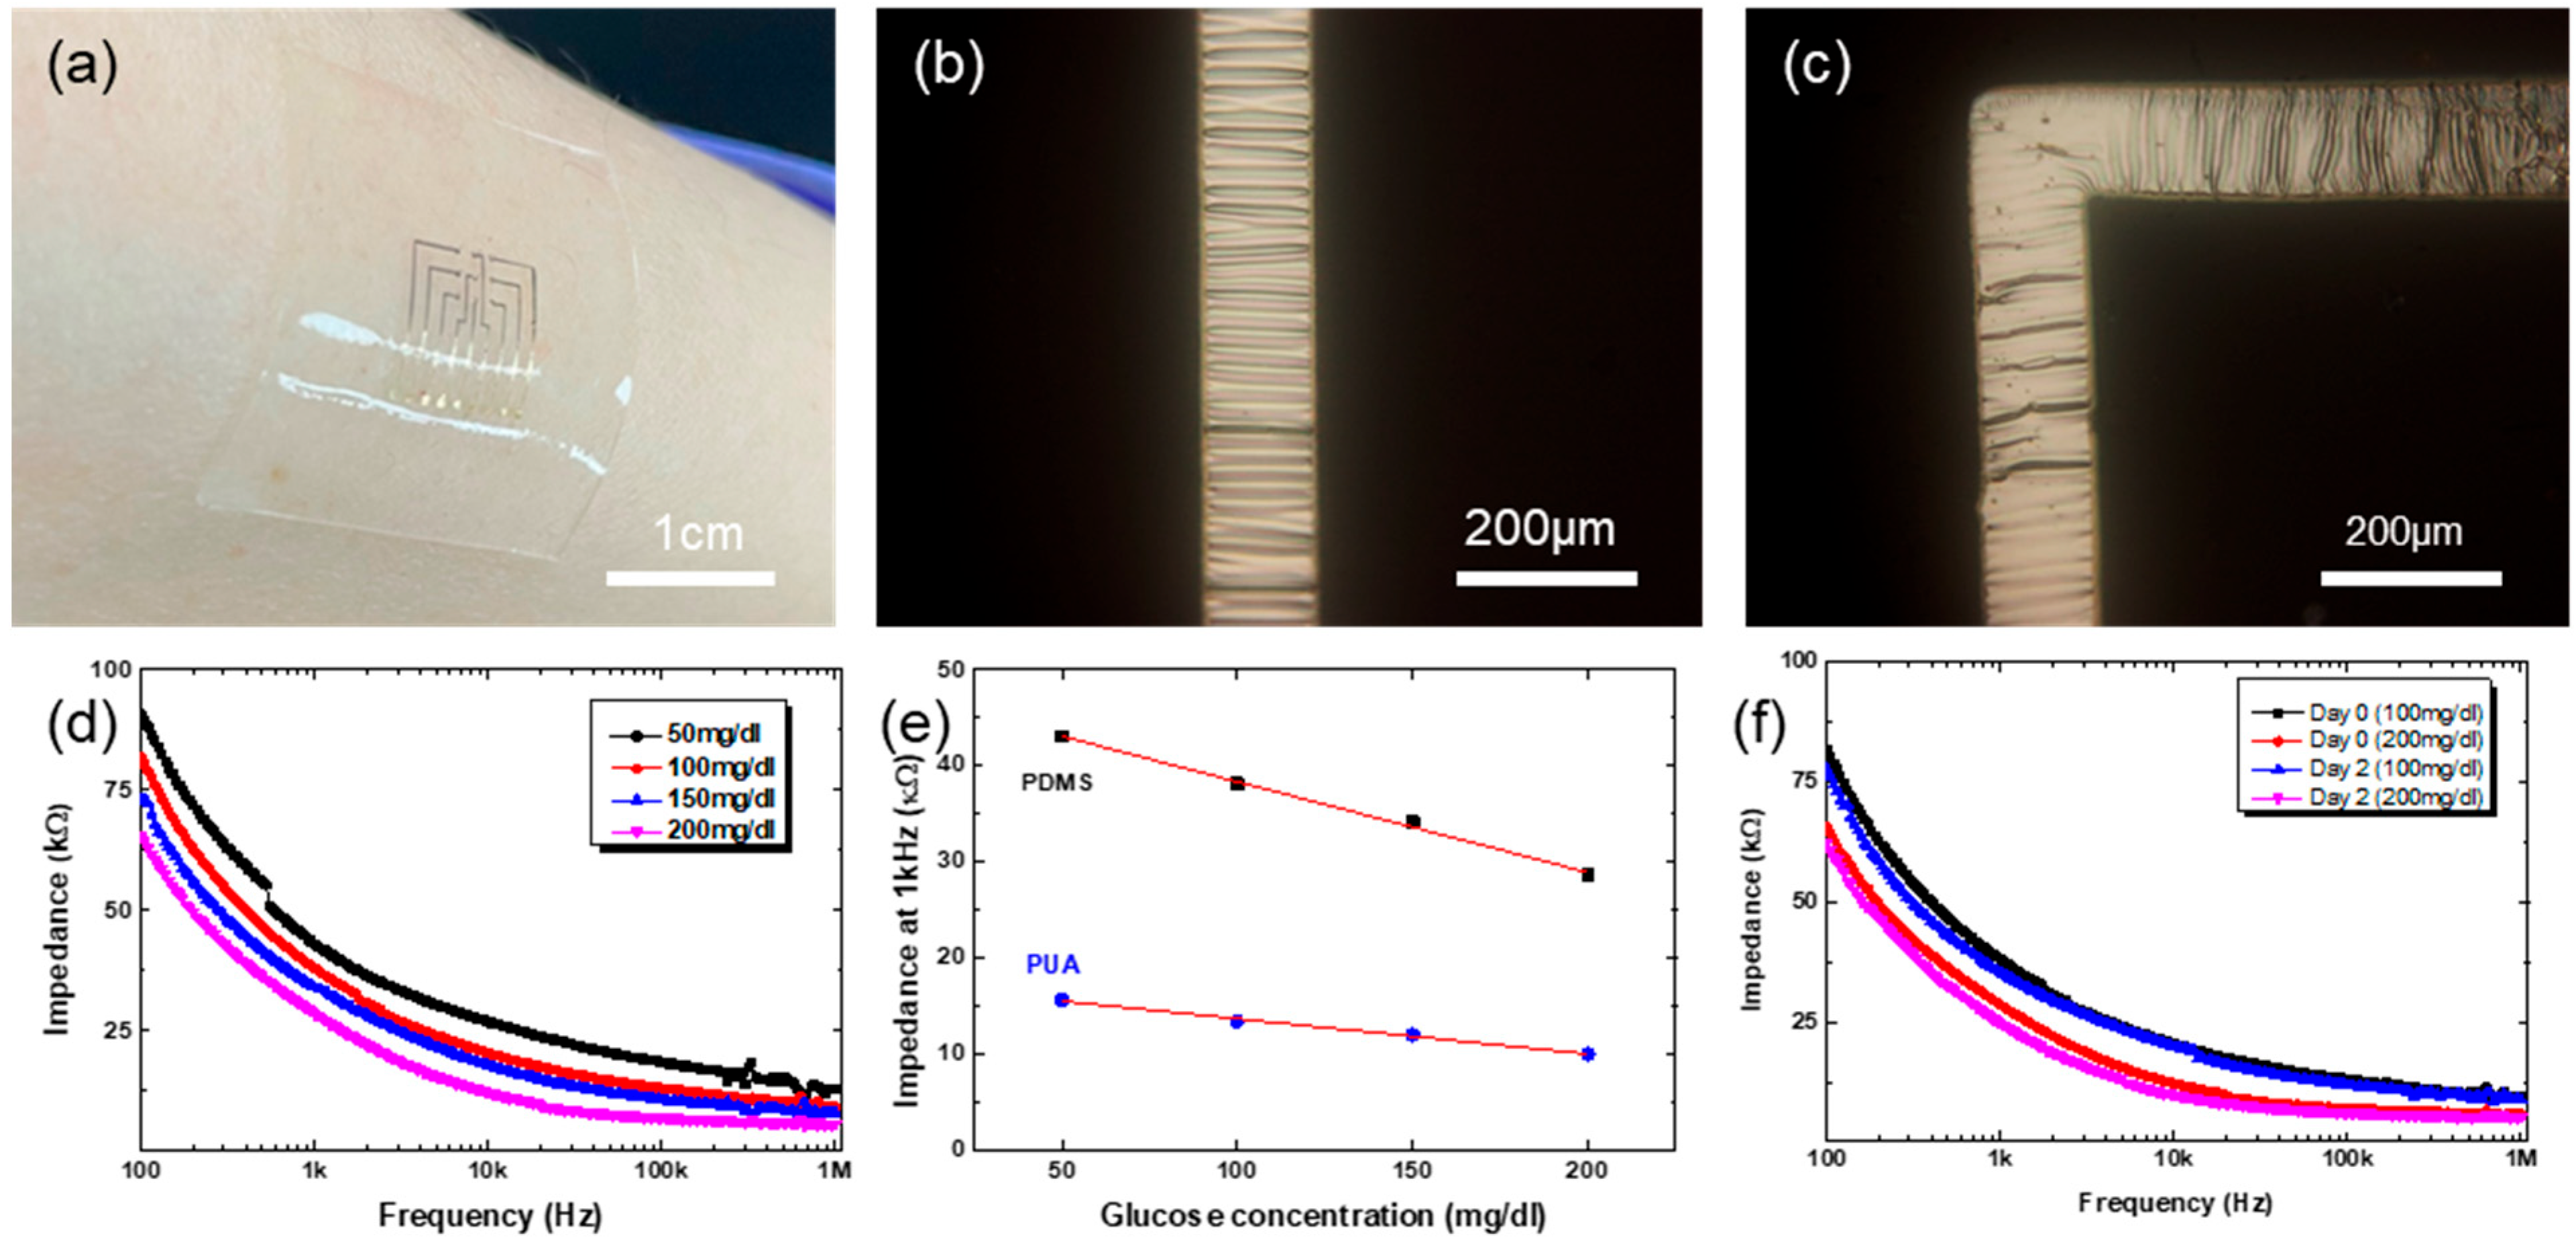
Figure 1a can be used to fabricate stretchable MEAs with elastomeric material such as PDMS. On the Au/Ti patterned hole-arrayed PDMS stamp, pouring and thermal curing of elastomeric PDMS, instead of UV-curable PUA prepolymer, followed by peeling off the MEAs, complete the fabrication of stretchable MEAs. While the flexible polymeric MEAs can be deformed into cylindrical shapes only, the stretchable elastomeric MEAs can be conformed onto complex curvilinear surfaces. Further, the elastomeric nature enables soft contact with biological materials, which may be beneficial for contacting very soft materials such as brain tissues. Shown in
Figure 6a is the conformable nature of elastomeric MEAs made of PDMS. It conforms and attaches quite firmly onto the human skin surface.
It should be noted that the metallic materials, Au and Ti in this work, should also be made stretchable for the fabrication of stretchable MEAs (MNAs made of PDMS are intrinsically stretchable). For this, the well-known mechanical wrinkling of metals was employed here [
33,
34,
35]. During the patterned metal evaporation with a shadow mask, the PDMS stamp was pre-stretched to 5% biaxially. Upon release of the pre-strain after the deposition, the metallic lines become buckled, as shown in
Figure 6b,c. There are interconnection lines having both straight and right-angled parts. If the metallic lines are straight in one direction only, a uniaxial stretching during metal evaporation would be enough for the wrinkling. For lines having right-angled parts, however, biaxial pre-strain should be applied for the buckling along the whole lines, as shown in
Figure 6c. The buckled metallic lines are reversibly stretchable: they flatten upon stretching strain while recovering their buckled state upon the release of external stretching strain. Overall, applying biaxial pre-strain to the PDMS stamp during patterned metal deposition leads to the mechanical buckling of interconnection metal lines, enabling the stretchable MEAs. It should be noted that the needles do not experience enough strain for buckling by such small biaxial pre-strain, because the applied biaxial pre-strain is largely absorbed by the inter-needle planar part of the MEAs. Thus, the metallic layer on 3D microneedles remains intact, not buckled at all. If the uniaxial pre-strain is large enough, 30%, for example, then the needle surface becomes buckled (
Figure S9). Such large biaxial pre-strain could not be applied due to limited availability of proper equipment.
The fabricated stretchable MEAs work well for the impedance measurements (
Figure S10), too, as shown in
Figure 6d. For the impedance measurement, GOx was immobilized onto the Au surface on stretchable MEAs. The impedance spectra with stretchable MEAs show quite similar behavior to those with polymeric MEAs shown in
Figure 5a. With the concentration of glucose solution, the impedance values decrease. While the impedance spectra look similar, there are differences in the absolute values of the impedance, as shown in
Figure 6e. The impedance values are smaller with polymeric MEAs than with elastomeric MEAs. The exact reason is unclear yet, but the micro-cracks in the Au electrode are likely to induce higher impedance in elastomeric MEAs. Regardless of the difference in the absolute values of impedance, the elastomeric MEAs can still be successfully used for the glucose sensing. Shown in
Figure 6f are the impedance spectra for different concentrations of glucose solution with stretchable MEAs. The measurement here was done by dropping glucose solution onto the stretchable MEAs. As shown, the stretchable MEAs show reliable impedance spectra with different glucose concentrations. In all, the unique fabrication strategy developed in this work enables the fabrication of flexible and even stretchable MEAs, and both the MEAs have successfully been applied for the monitoring of glucose level based on impedance spectroscopy.
