1. Introduction
Photoplethysmography (PPG) has become a prominent non-invasive optical technique for monitoring cardiovascular parameters, having been widely researched and developed over the past few decades. PPG sensors collect data by emitting light through the skin and interacting with blood vessels. The back-reflected light or transmitted light is then read and processed as a PPG signal, producing a waveform that can derive physical data such as heart rate and oxygen saturation (SpO
2) [
1]. Due to their non-invasive nature and ease of integration, PPG sensors are widely used in commercial products such as smartwatches (Apple Watches, Fitbits, etc.) and pulse oximeters. The light absorption characteristics of hemoglobin, which vary depending on the wavelength of light and its oxygenation state, are utilized in this process (as illustrated in
Figure 1). The Beer–Lambert law is fundamental to this process, relating light attenuation to the concentration of chromophores like oxygenated and deoxygenated hemoglobin, which is crucial for SpO
2 calculation [
2].
A typical PPG waveform has four key features (
Figure 2): the main peak, dicrotic notch, pulse width, and pulse amplitude. In a healthy cardiovascular system, the main peak typically measures about twice the amplitude of the dicrotic notch. Deviations from this ratio may indicate underlying health issues, thereby reinforcing the importance of accurate waveform interpretation.
Figure 3 illustrates several PPG waveforms associated with different health conditions. A “normal pulse” shape generally indicates healthy cardiovascular function. Deviations, such as “small and weak pulses” where the main peak’s amplitude is significantly reduced relative to the dicrotic notch, may suggest conditions such as heart disease. “Large and bounding pulses” could result from exercise or pathology. Bisferiens pulses, with dual systolic peaks, may indicate serious cardiac issues, and pulsus alternans—alternating amplitudes—are linked to life-threatening complications.
More recently, SpO
2 has gained public attention due to its pivotal role in assessing respiratory health during the COVID-19 pandemic. Reduced respiration from COVID-19 infection lowers SpO
2 levels to potentially fatal thresholds. Medical guidelines suggest that SpO
2 levels below 92% warrant medical attention, with levels below 88% considered critical [
7,
8,
9]. Given its clinical relevance, accurate and timely detection of SpO
2 is vital, particularly for diseases that compromise respiratory function. PPG sensors, which deliver SpO
2 and heart rate measurements to the user, must therefore operate with high fidelity. Even slight inaccuracies in SpO
2 readings can have significant clinical implications, contributing to the cautious adoption of some PPG-based devices for high-stakes medical decision-making.
A primary challenge to PPG sensor accuracy is the influence of various variables that many current designs do not adequately address, such as skin pigmentation, tattoos, movement, nail polish, and environmental lighting [
10,
11]. These factors influence the back-reflected light read by the system’s photodiode, which in turn affects the PPG signal. Both the pulsatile (AC) component, which reflects pulsatile changes due to cardiac cycles, and the baseline (DC) component, which represents baseline blood volume in the tissue, are susceptible to these interferences [
2]. Consequently, variations in these components can ultimately skew measurements that are essential for determining heart rate and hemoglobin levels [
12]. In other words, these PPG systems must be designed to preserve these waveform distinctions. However, if any of the environmental or physical variations mentioned cause a healthy waveform to resemble a pathological one, without compensation, the sensor’s diagnostic value could be compromised.
Numerous studies have identified factors that limit the accuracy of PPG sensors. Wearable devices, in particular, suffer from motion artifacts due to their placement on the wrist and fingers—mobile parts of the body exposed to both sedentary and dynamic activity. These artifacts distort the waveform, leading to amplitude spikes and corrupted readings [
13,
14]. Skin pigmentation and environmental lighting also introduce noise. Study [
15] found that darker skin tones exacerbate errors in SpO
2 measurements at low oxygen levels. At 60–70% saturation, participants with darker pigmentation experienced an average overestimation of 3.56 ± 2.45%, whereas those with lighter tones showed only a 0.37 ± 3.20% discrepancy. This variation underscores the urgency of addressing skin tone bias in sensor design. The study also highlighted that factors like tattoos and nail polish can further impact measurement reliability.
Similarly, research by Bazurto et al. [
16] investigated the impact of pigmentation on PPG readings. Their study utilized artificial skin phantoms of varying tones to simulate different levels of pigmentation. The findings demonstrated a consistent pattern: lighter skin resulted in higher output voltage readings, while darker skin tones yielded lower output voltage readings. This inverse relationship between pigmentation level and signal amplitude was observed across different red light intensities.
The COVID-19 crisis also accelerated interest in remote health monitoring, particularly through telehealth platforms. In this context, video photoplethysmography (vPPG) has emerged as a promising technique, using video rather than physical contact sensors to derive vital signs. However, as demonstrated in “Effect of Ambient Lighting and Skin Tone on Estimation of Heart Rate and Pulse Transit Time from Video Plethysmography” [
17], both skin pigmentation and lighting conditions significantly affect the accuracy of both vPPG and traditional PPG systems. While improved lighting conditions can help mitigate some inaccuracies, these studies suggest that such measures may not fully eliminate skin tone-related discrepancies in vPPG measurements.
Together, these studies highlight the pervasive impact of skin pigmentation on the performance of both contact and remote PPG systems. The implications extend beyond academia. For instance, wearable industry leaders like Apple and Garmin have faced criticism for sensor inaccuracies related to tattoos and darker skin tones. In response, these companies have introduced software-based correction algorithms, increased LED intensity, and improved sampling rates [
18]. Support resources provided by Garmin [
19] and Apple [
20] also aim to educate users on pigmentation-related discrepancies.
Other studies have also focused on improvements in heart rate detection algorithms. Ahn et al. [
21] proposed integrating a Viterbi algorithm with a hidden Markov model, boosting measurement accuracy to approximately 98%. This methodology assigns reliability scores to light intensity samples gathered by PPG sensors and filters out unreliable data. The proposed system operates with negligible latency (0.2 ms per sample) and a modest increase in power consumption (roughly 1 mA), making it a practical solution for real-time monitoring.
Advancements have also been made in integrating PPG technology into commercial-grade wearables. Lee et al. [
22] introduced organic thin-film transistor (OTFT)-based amplifiers for dual-function measurements: arterial pulse detection and sweat pH analysis. Although promising, this design yielded a heart rate error margin of ±1 beat per minute when compared with standard electrocardiogram (ECG) machines. For medical-grade applications, even this level of deviation may be deemed excessive and warrants further refinement.
This research aims to address the challenge of skin pigmentation-induced variability in PPG signal amplitude. Our primary objective is to develop and validate a system that normalizes PPG signals to achieve consistent output characteristics across users with diverse skin tones by performing a one-time gain calibration. Normalization, in this context, involves adjusting the sensor’s output to counteract the attenuating effects of melanin, thereby ensuring that the measured signal amplitude is less dependent on skin pigmentation.
To achieve this, we propose a system that performs a one-time gain calibration based on an individual’s skin tone at the beginning of a measurement. This “set-and-hold” approach was deliberately chosen over continuous real-time automatic gain control (AGC), which can distort the PPG waveform’s diagnostic features by altering its morphology. Our method preserves the crucial characteristics of the waveform, including its amplitude, width, and key morphological features, ensuring the clinical utility of the signal remains intact.
The system was implemented through a complete data acquisition pipeline using a programmable gain amplifier (PGA). The PGA’s gain is set based on the participant’s skin tone, determined from RGB image analysis, ensuring that amplification is tailored to compensate for melanin-specific light absorption. By compensating for signal attenuation without compromising intrinsic waveform morphology, our approach seeks to enhance the accuracy and reliability of PPG sensing, paving the way for more equitable and consistent use of these sensors in diverse populations and clinical applications.
This paper is organized as follows:
Section 2 outlines the methodology used to acquire PPG signals from human participants, including the design of the testing environment and data acquisition protocols.
Section 3 describes the steps taken to clean, segment, and analyze the raw signals, ensuring reliable input for further analysis. In
Section 4, the use of a PGA to normalize signal amplitude across varying skin tones is detailed, along with the algorithmic logic used to maintain waveform integrity.
Section 5 presents the outcomes of the experiments, including performance comparisons before and after gain normalization.
Section 6 interprets the results, evaluates the effectiveness of the approach, and addresses limitations and future improvements. Finally,
Section 7 summarizes the key contributions of the study and highlights its potential impact on the development of more equitable and accurate PPG-based health monitoring systems.
2. Data Collection
The primary objective of this phase was to collect accurate and representative PPG signals from a cohort of 70 human participants to investigate the effects of skin pigmentation and to test our gain compensation strategy. The data collection procedure was structured to ensure consistency, reliability, and control over environmental and physiological variables that could influence signal.
2.1. PPG Data Collection
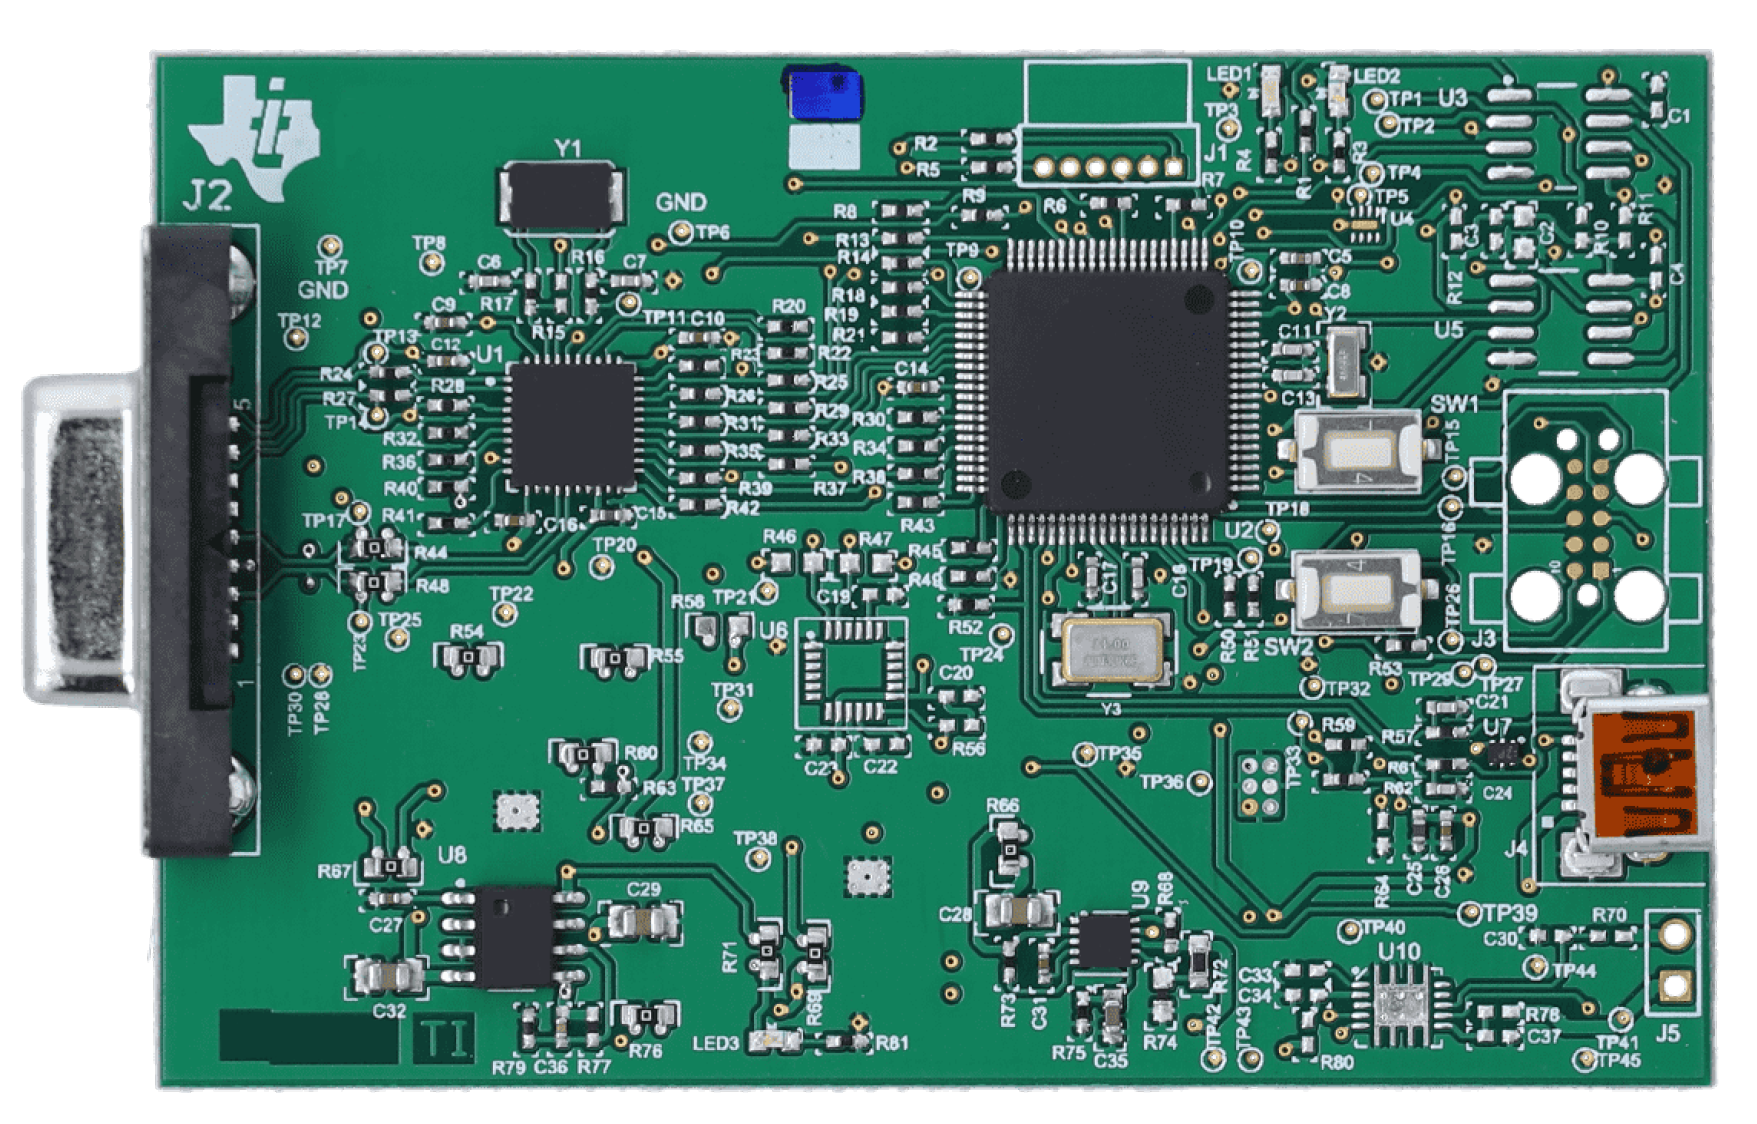
High-fidelity PPG data were acquired using a Texas Instruments AFE4400 evaluation module (EVM) (
Figure 4), a specialized analog front-end for optical biosensing applications, manufactured in Dallas, TX, USA [
23]. The AFE4400 was configured with a standard finger-clip PPG sensor. To minimize external interference, the sensor was positioned in a fixed location within a custom-designed, 3D-printed enclosure (
Figure 5). The enclosure was designed in SolidWorks, 2023 educational version and was 3D printed using a Bambu Lab 3D printer, based in Austin, TX, USA, serving to shield the sensor from ambient light and reduce motion artifacts by providing a stable platform for the participant’s hand. The enclosure also featured dedicated wiring ports, an opening for participants to insert their hands, and an opening for a webcam used for skin pigmentation assessment.
Participants were instructed to sit comfortably and remain still, with their figure placed in the PPG sensor clip inside the enclosure. During the resting phase, the TI AFE 4400 sensor captured the PPG waveform recorded at baseline, ensuring initial recordings reflected resting heart activity. Data acquisition was managed through the accompanying TI software, which also ensured standardized recording parameters and consistent file management. Following the baseline measurement, each participant engaged in brief physical activity to elevate heart rate (e.g., jumping jacks, walking up and down stairs), allowing the system to capture PPG waveforms under increased physiological demand. Throughout all trials, consistent lighting conditions within the laboratory and uniform sensor placement and data recording protocols were maintained to facilitate a focused analysis of the impact of skin pigmentation on PPG signal characteristics.
2.2. Skin Pigmentation Measurement
To ensure reproducible quantitative assessment of skin pigmentation, a standard 1080p webcam interfaced to a Raspberry Pi 4 was used under a highly controlled protocol. Each participant’s hand was photographed within the testing enclosure, which shielded the hand from variable ambient lighting and provided a consistent illumination environment. The webcam was maintained at a fixed distance and angle, and its settings (e.g., white balance, exposure) were held constant across all sessions to prevent automatic adjustments. The captured images were then processed using a k-means clustering algorithm implemented in Python (v3.13).
This algorithm first segmented the hand region from the image background. Then, k-means clustering was applied to the RGB pixel values within the hand region to identify dominant color clusters, making the measurement robust against minor local variations such as freckles or veins. The RGB value of the most dominant cluster was extracted and recorded as a quantitative representation of the participant’s skin pigmentation (an example of this process is shown in
Figure 6). This objective measure of skin tone was then used for correlating with PPG signal characteristics and for calibrating the gain system.
2.3. Participant Demographics and Ethical Considerations
To contextualize the PPG and pigmentation data, each participant completed a digital survey prior to testing. The survey collected information on heart conditions, gender, age, fitness level, and other relevant demographic and health-related factors. These metadata were collected to provide context for the physiological measurements and to aid in the interpretation of data variability.
The study protocol was approved by the Institutional Review Board (IRB) of California State University, Long Beach (Protocol ID: 2126009-2). All participants provided informed consent before engaging in the study. To ensure participant safety and data integrity, all equipment, including the testing enclosure and PPG sensor, was sanitized between sessions. All information is recorded anonymously, and all images are removed after the RGB value is recorded into our database.
3. Data Processing
Following data acquisition, the raw PPG signals and associated survey data underwent a series of processing steps to prepare them for analysis and use in the dynamic gain system.
3.1. PPG Signal Pre-Processing and Feature Extraction
The raw PPG signal contains both a large, slowly varying DC component, related to baseline tissue and non-pulsatile blood absorption, and a smaller, pulsatile AC component, which is modulated by cardiac-induced blood volume changes. The AC component, which carries the essential physiological information, was isolated for analysis. The TI AFE4400’s analog front-end includes an ambient light cancellation circuit and filtering stages that effectively remove the DC offset to extract the pulsatile signal.
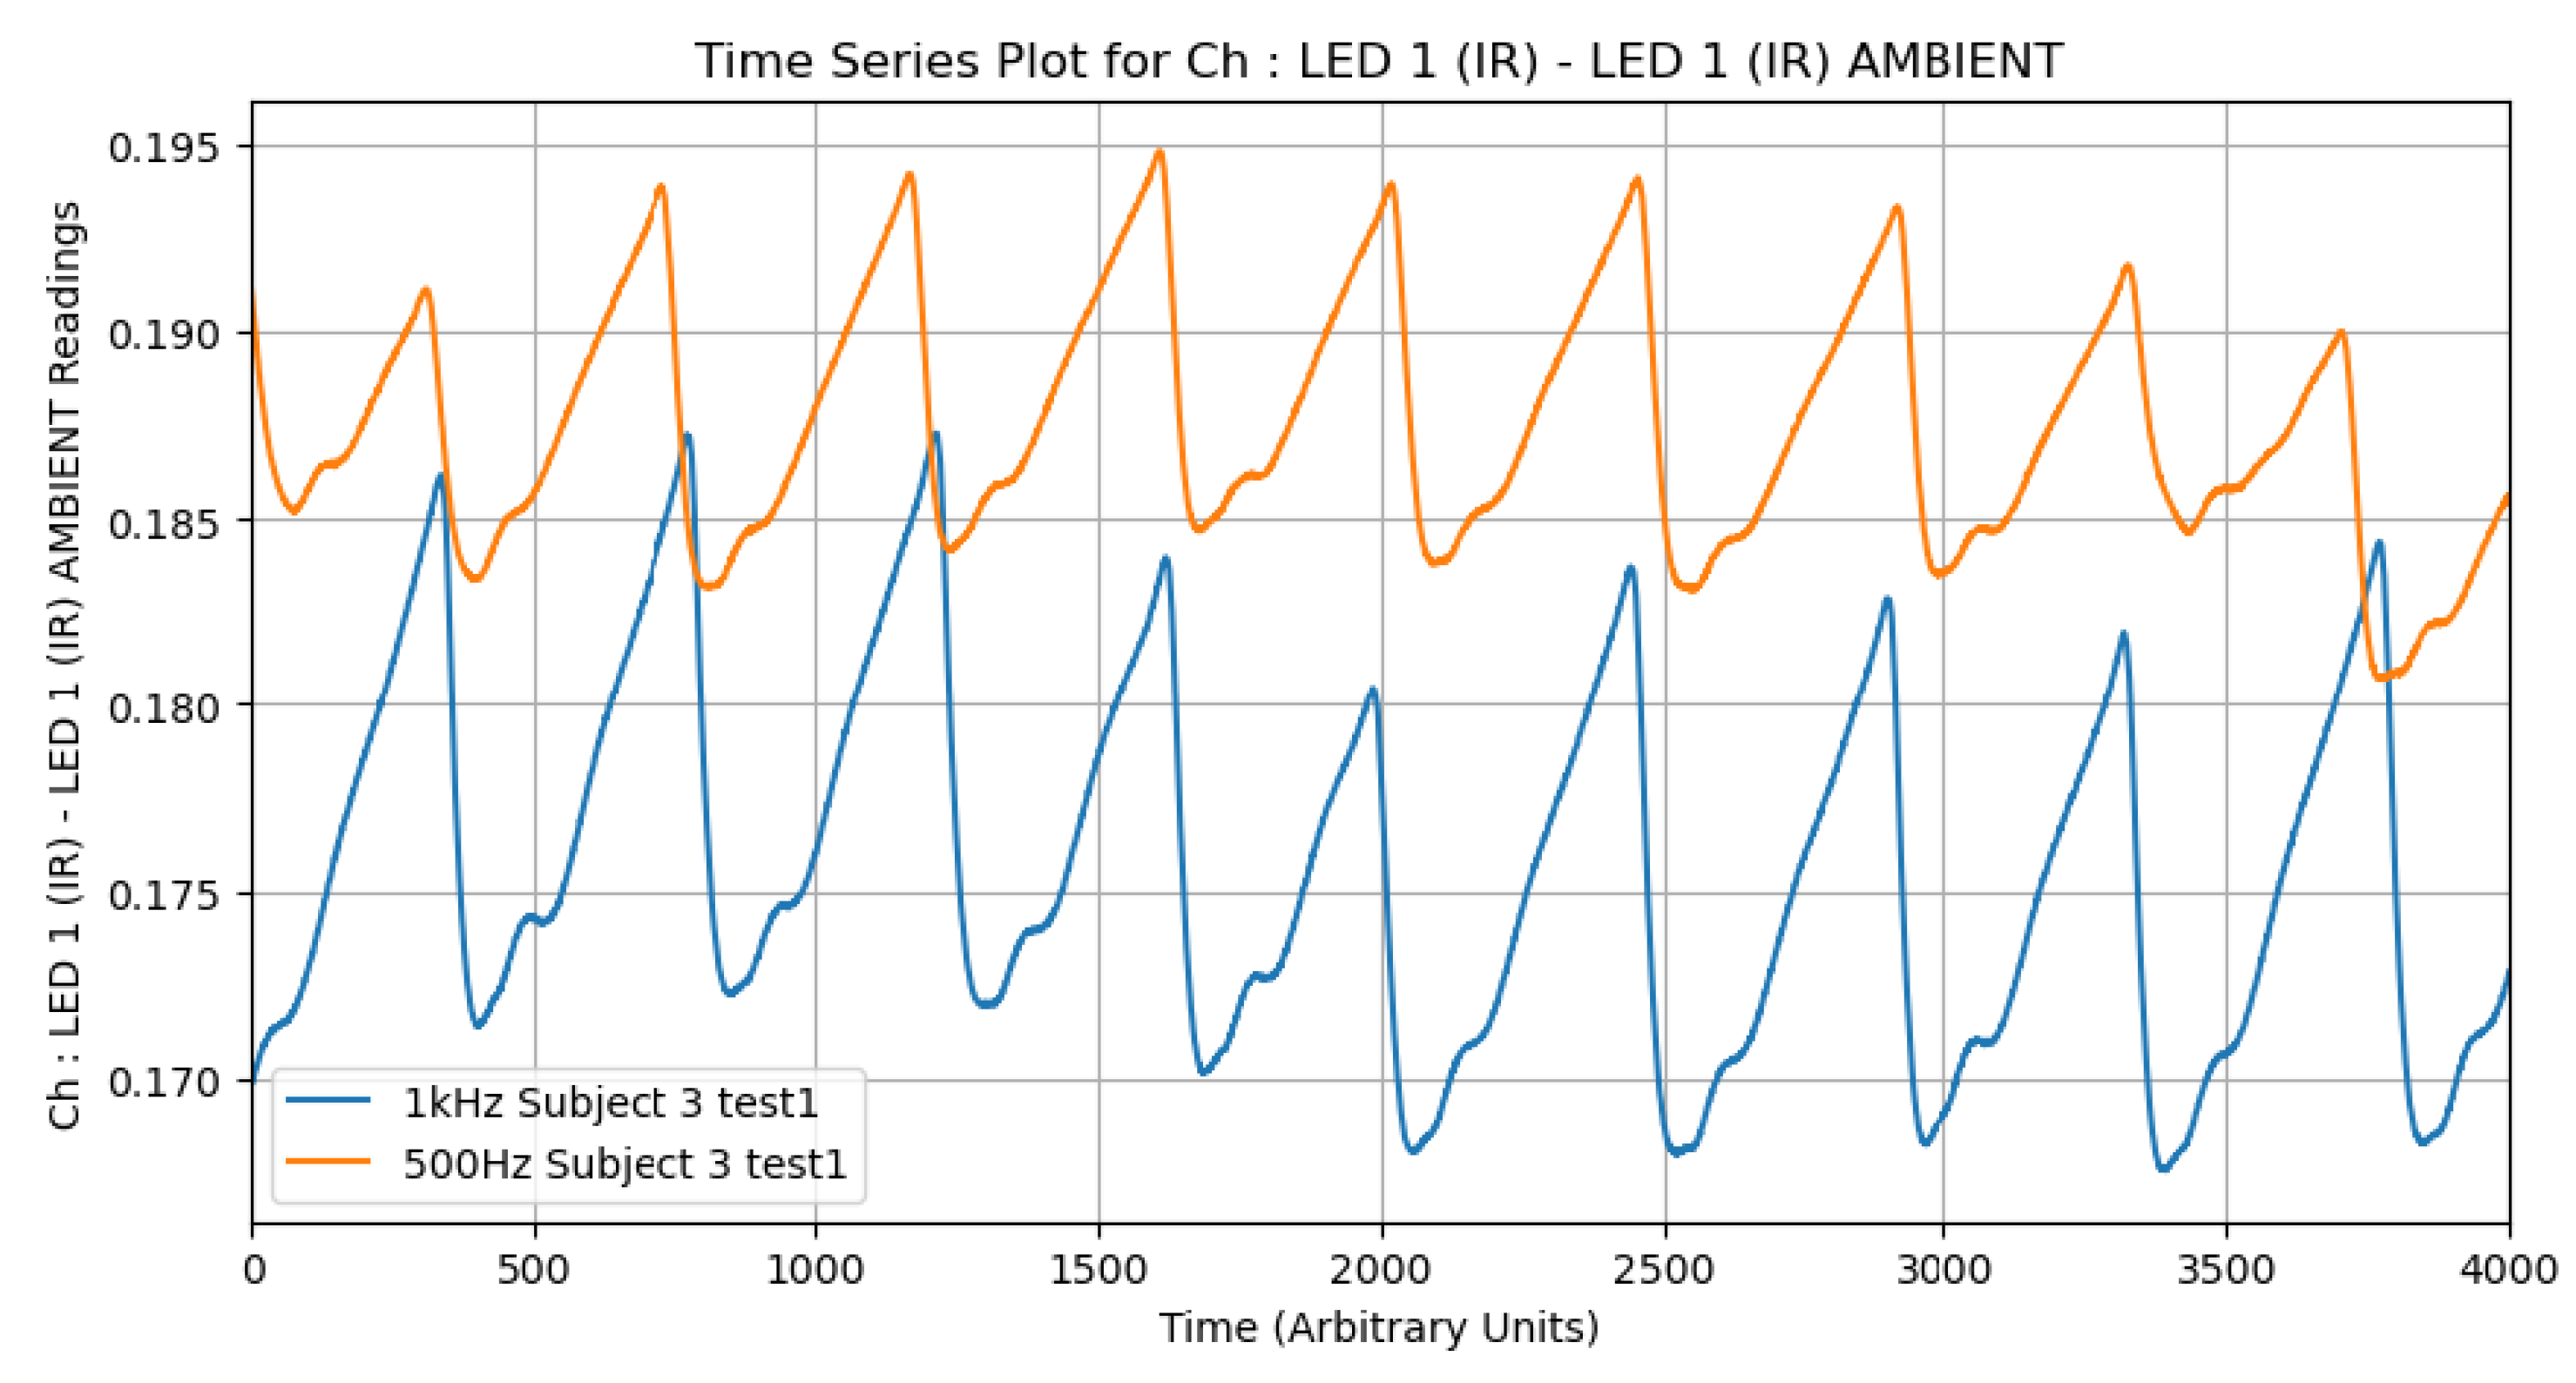
Raw PPG signals obtained from the TI AFE4400 often contain noise from various sources, including high-frequency electronic noise and baseline wander. To enhance the signal-to-noise ratio, appropriate filtering techniques are essential. As an initial investigation, we compared the effects of different low-pass filter settings (e.g., 500 Hz vs. 1 kHz cutoff frequencies) on the PPG waveform characteristics using data from a subset of subjects. It was consistently observed that the 500 Hz filter produced higher amplitude signals. This behavior suggests that lower-frequency filtering better preserves the pulsatile components of the waveform while attenuating higher-frequency noise, making it particularly valuable for detecting subtle physiological variations (
Figure 7). For the main analysis, specific filtering parameters from the TI AFE4400 EVM v1.4 software’s default configuration for SpO
2 were used, which typically include bandpass filtering to isolate the relevant frequency range of the PPG signal (e.g., 0.5 Hz to 5 Hz for heart rate).
The data collected for the PPG was processed using custom Python scripts, leveraging libraries such as Pandas and Scipy for data manipulation. Key steps included:
Signal segmentation: Isolating relevant portions of the PPG waveform corresponding to baseline and elevated heart rate periods.
Peak detection: A peak detection algorithm was employed to identify systolic peaks in the AC component of the PPG signal. Each detected peak corresponds to a heartbeat.
Heart rate calculation: Heart rate (HR) in beats per minute (BPM) was calculated from the intervals between successive systolic peaks.
Amplitude extraction: The peak-to-peak amplitude of the AC component () and the mean of the DC component () were extracted for both red and infrared PPG signals. These values are crucial for SpO2 calculation and for analyzing signal strength.
The processed physiological data, including calculated HR, , , and derived SpO2 values, were stored along with subject identifiers for subsequent merging with survey and skin pigmentation data. The data visualization was performed using Matplotlib.
The initial analysis of this processed data reaffirmed the existing literature in that skin pigmentation significantly affects PPG signal amplitude, with darker pigmentation generally leading to lower signal strength and potentially less accurate readings if not compensated for. This highlighted the necessity for the dynamic gain adjustment system developed in this research.
3.2. Survey Database Processing
Two primary datasets were used in this study: a structured survey database and physiological measurements recorded using the TI AFE 4400 evaluation board. The survey data were stored in a
.db SQLite database file, which was programmatically read into a Pandas DataFrame using Python (
Figure 8).
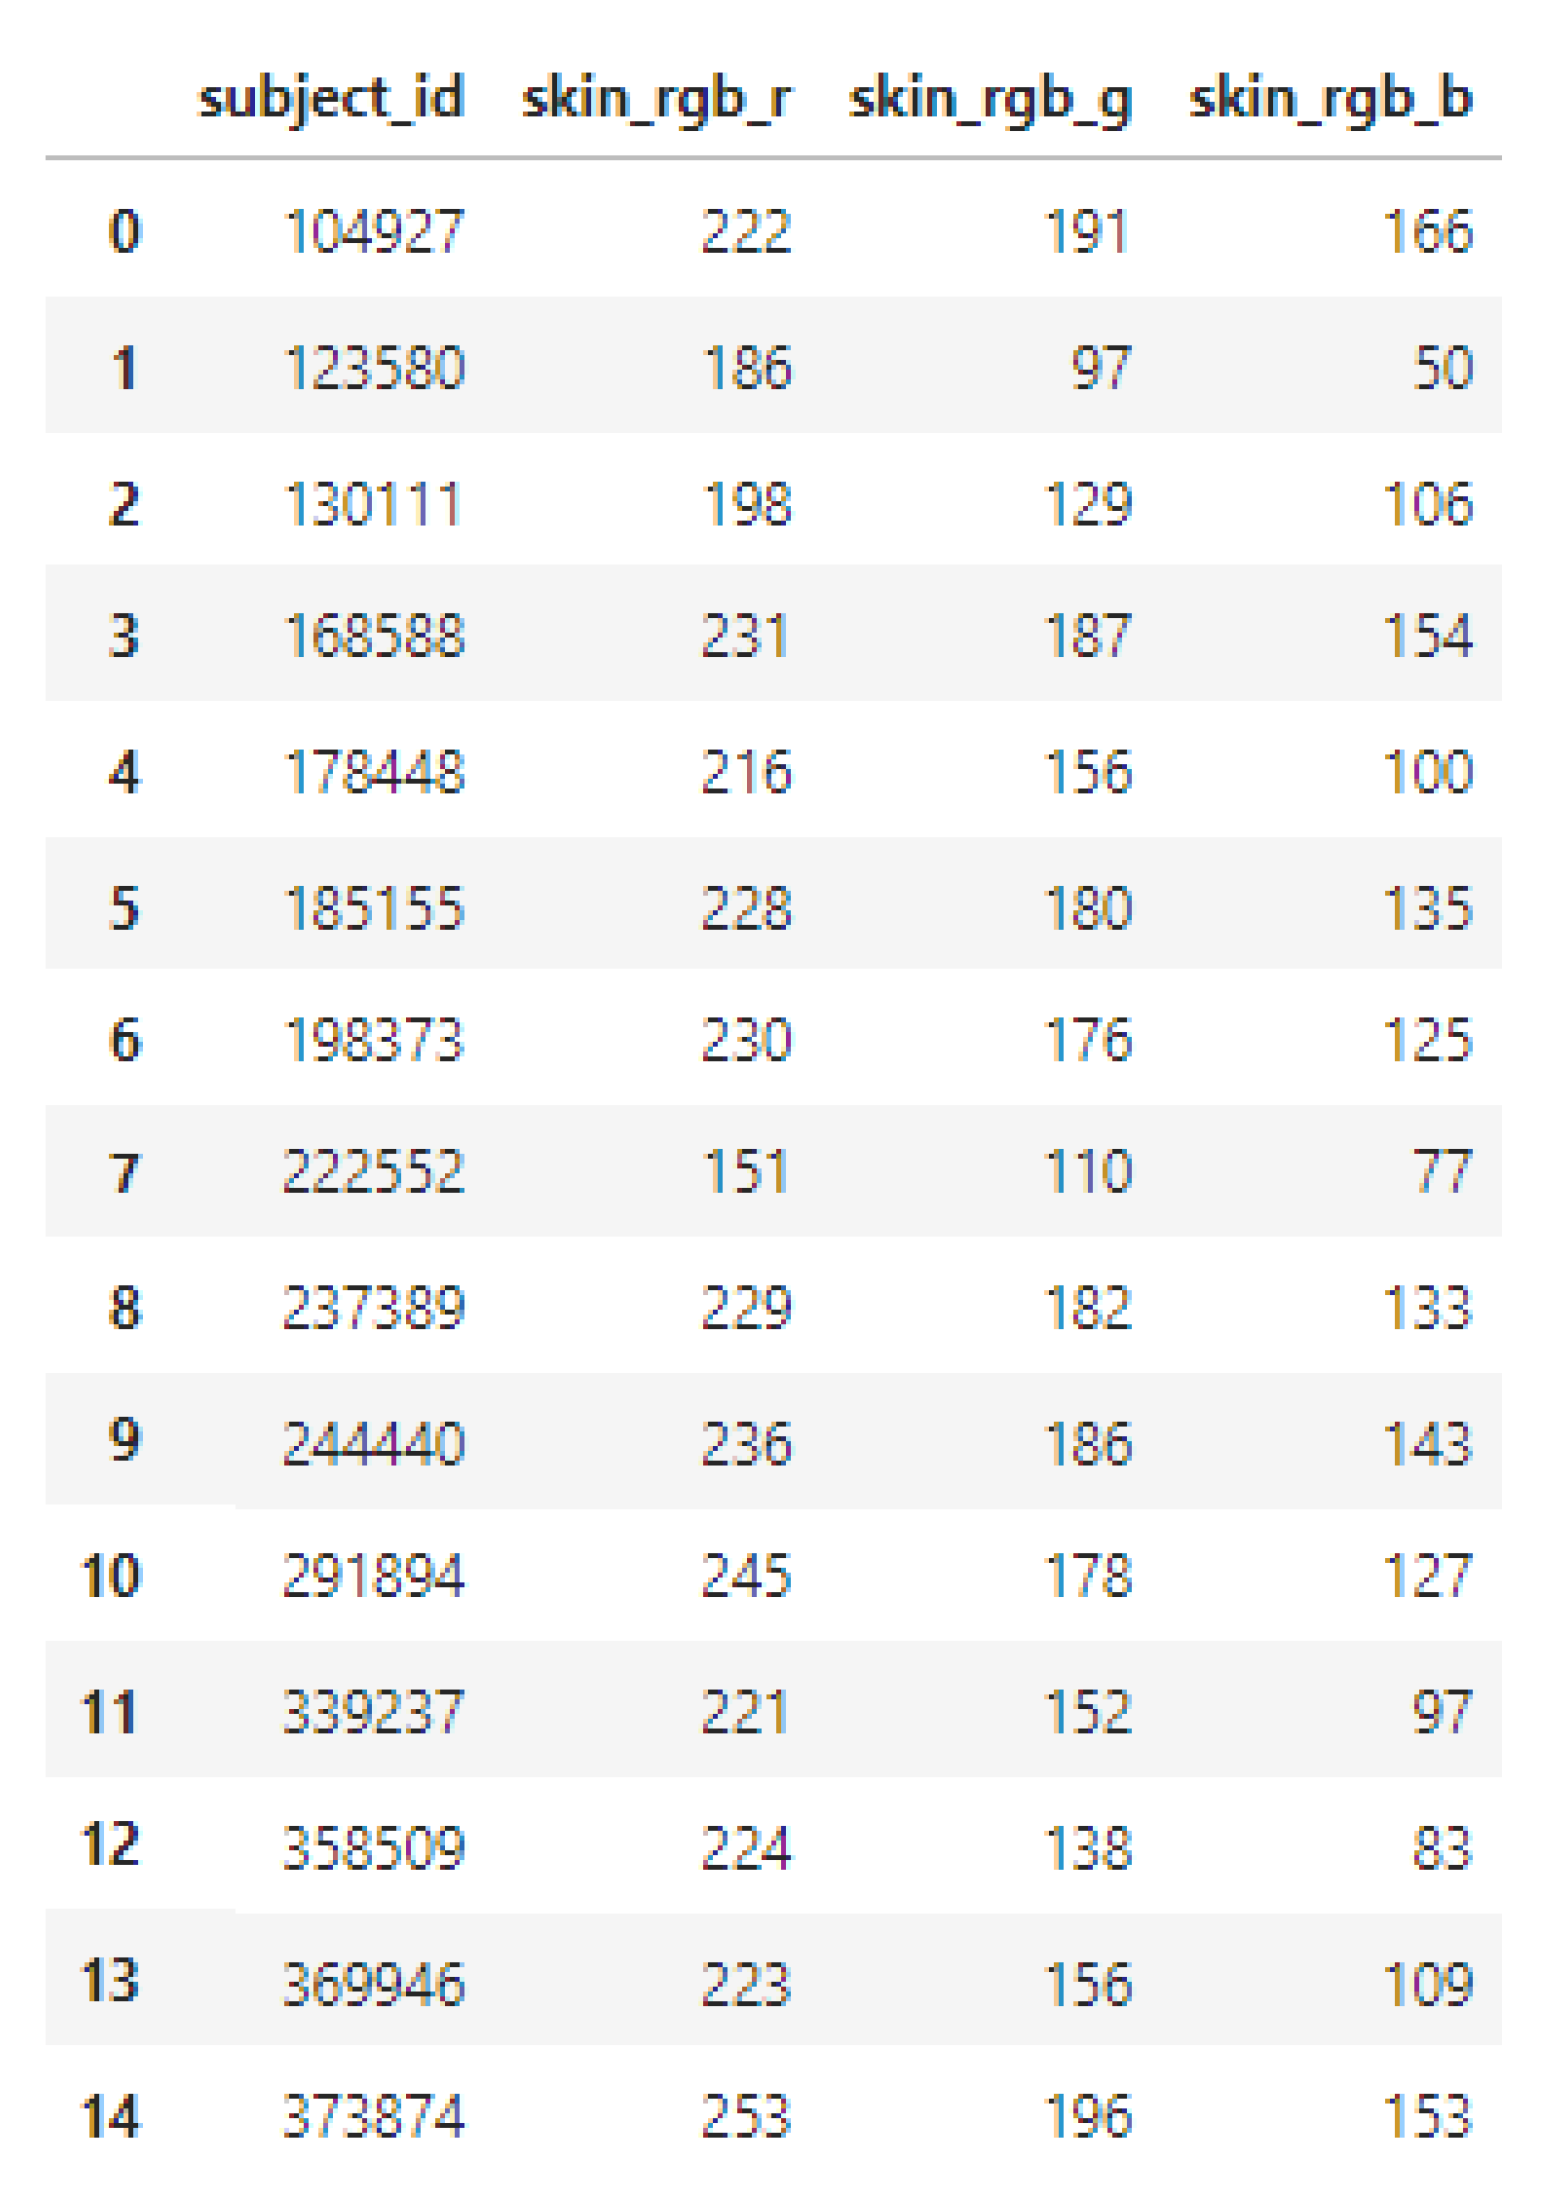
The full survey DataFrame contained various fields including subject ID, gender, age, and skin pigmentation values (RGB). For analysis purposes, only the RGB skin pigmentation values and subject IDs were retained; all other metadata were dropped to streamline the dataset (
Figure 9).
3.3. TI Physiological Data Processing
The second dataset consisted of physiological signals recorded using the TI AFE 4400 evaluation board. These data were organized into CSV files stored in a directory structure, with each file labeled with a subject ID and an indication of physical activity level (“elevated” or “base”). Python scripts recursively traversed the folders to locate files of interest, filtering based on naming patterns (see
Figure 10).
Each CSV file was parsed by skipping the first sixteen lines (headers) and reading six lines of signal data. Key metrics such as peak-to-peak voltage (Vpp), root-mean-square voltage (Vrms), and mean voltage (Vmean) were extracted and stored in a structured DataFrame. A subject ID field was added based on the filename for alignment with the survey data.
SpO2 was computed based on the principle that oxygenated hemoglobin (HbO
2) and deoxygenated hemoglobin (Hb) absorb red and infrared light differently [
24]. The “ratio of ratios” (
R), which relates the pulsatile (AC) and non-pulsatile (DC) components of the PPG signal at both wavelengths, is calculated as:
where
and
are the AC and DC components of the red light signal, and
and
are the corresponding components for the infrared signal.
SpO2 is typically estimated from R using a linear empirical formula of the form , where the coefficients A and B are determined by calibration against a reference co-oximeter. While the TI AFE4400 documentation suggests initial coefficients of and , we observed that this produced physiologically implausible results (e.g., >100%) with our specific sensor setup.
Therefore, for the purpose of this study, we made an empirical adjustment to constrain the SpO
2 estimates to a more realistic range, resulting in the following formula:
It is critical to acknowledge that this is a simplified, non-calibrated formula. Its purpose in this work is not for clinical diagnosis but rather to establish a functional relationship between the optical signal and a physiological parameter for testing our gain calibration methodology. For clinical-grade accuracy, a robust calibration procedure would be essential.
The extracted metrics, including HR and calculated SpO
2, were consolidated into a master DataFrame and merged with the filtered survey data and skin pigmentation data using the subject ID as the common key (an example of this processing is shown in
Figure 11).
4. Skin Tone-Based Gain Calibration System
To address the signal attenuation caused by varying skin pigmentation, we designed and implemented a system that performs a one-time gain calibration at the start of a measurement. This “set-and-hold” strategy adjusts the amplification of the PPG signal based on the participant’s skin tone and then maintains that fixed gain for the duration of the measurement. This approach is designed to normalize signal amplitude without distorting the waveform’s essential diagnostic features.
4.1. System Architecture and Workflow
The overall architecture of our system is illustrated in
Figure 12. The workflow is divided into two distinct stages: a one-time initialization and gain set/hold phase and a continuous PPG measurement phase. The entire process is automated by a microcontroller to ensure consistency and ease of use.
While the “set-and-hold” architecture is deliberately chosen for this study to prioritize waveform fidelity, future iterations of this work will explore a hybrid real-time gain control system. Such a system could use this initial calibration to set a baseline gain and then make minor, slow adjustments to account for transient factors like changes in pressure or perfusion, aiming to achieve the benefits of real-time adaptation without introducing the artifacts that corrupt diagnostic features.
The operational workflow, as depicted in the diagram, is realized by the core system components. The core of the hardware is the PGA circuit, built around the Texas Instruments OPA3S328 operational amplifier. This op-amp features integrated switches that allow for selectable feedback resistors, thereby changing the transimpedance gain. A Seeeduino Xiao microcontroller is used to control these switches.
The workflow steps are:
- 1.
Skin tone capture and analysis: An image of the user’s skin is captured and analyzed to extract its dominant RGB value (see
Section 2).
- 2.
Automated gain selection: The Seeeduino Xiao microcontroller uses the skin’s red (R) channel value and a pre-defined calibration curve (see
Section 5) to automatically determine the required gain level.
- 3.
Gain set and hold: The microcontroller sends a digital control signal to the PGA, which sets the gain and holds it constant for the entire measurement session.
- 4.
Continuous measurement and output: The raw PPG current from the sensor is continuously amplified by the PGA using the fixed gain, producing a normalized analog waveform ready for downstream processing.
For the purposes of system validation, the input PPG signal was replayed using a National Instruments MyDAQ and LabVIEW, as shown in
Figure 13 and
Figure 14. This allowed us to test the PGA’s response with controlled, repeatable inputs.
4.2. PGA Circuit Design and Stability
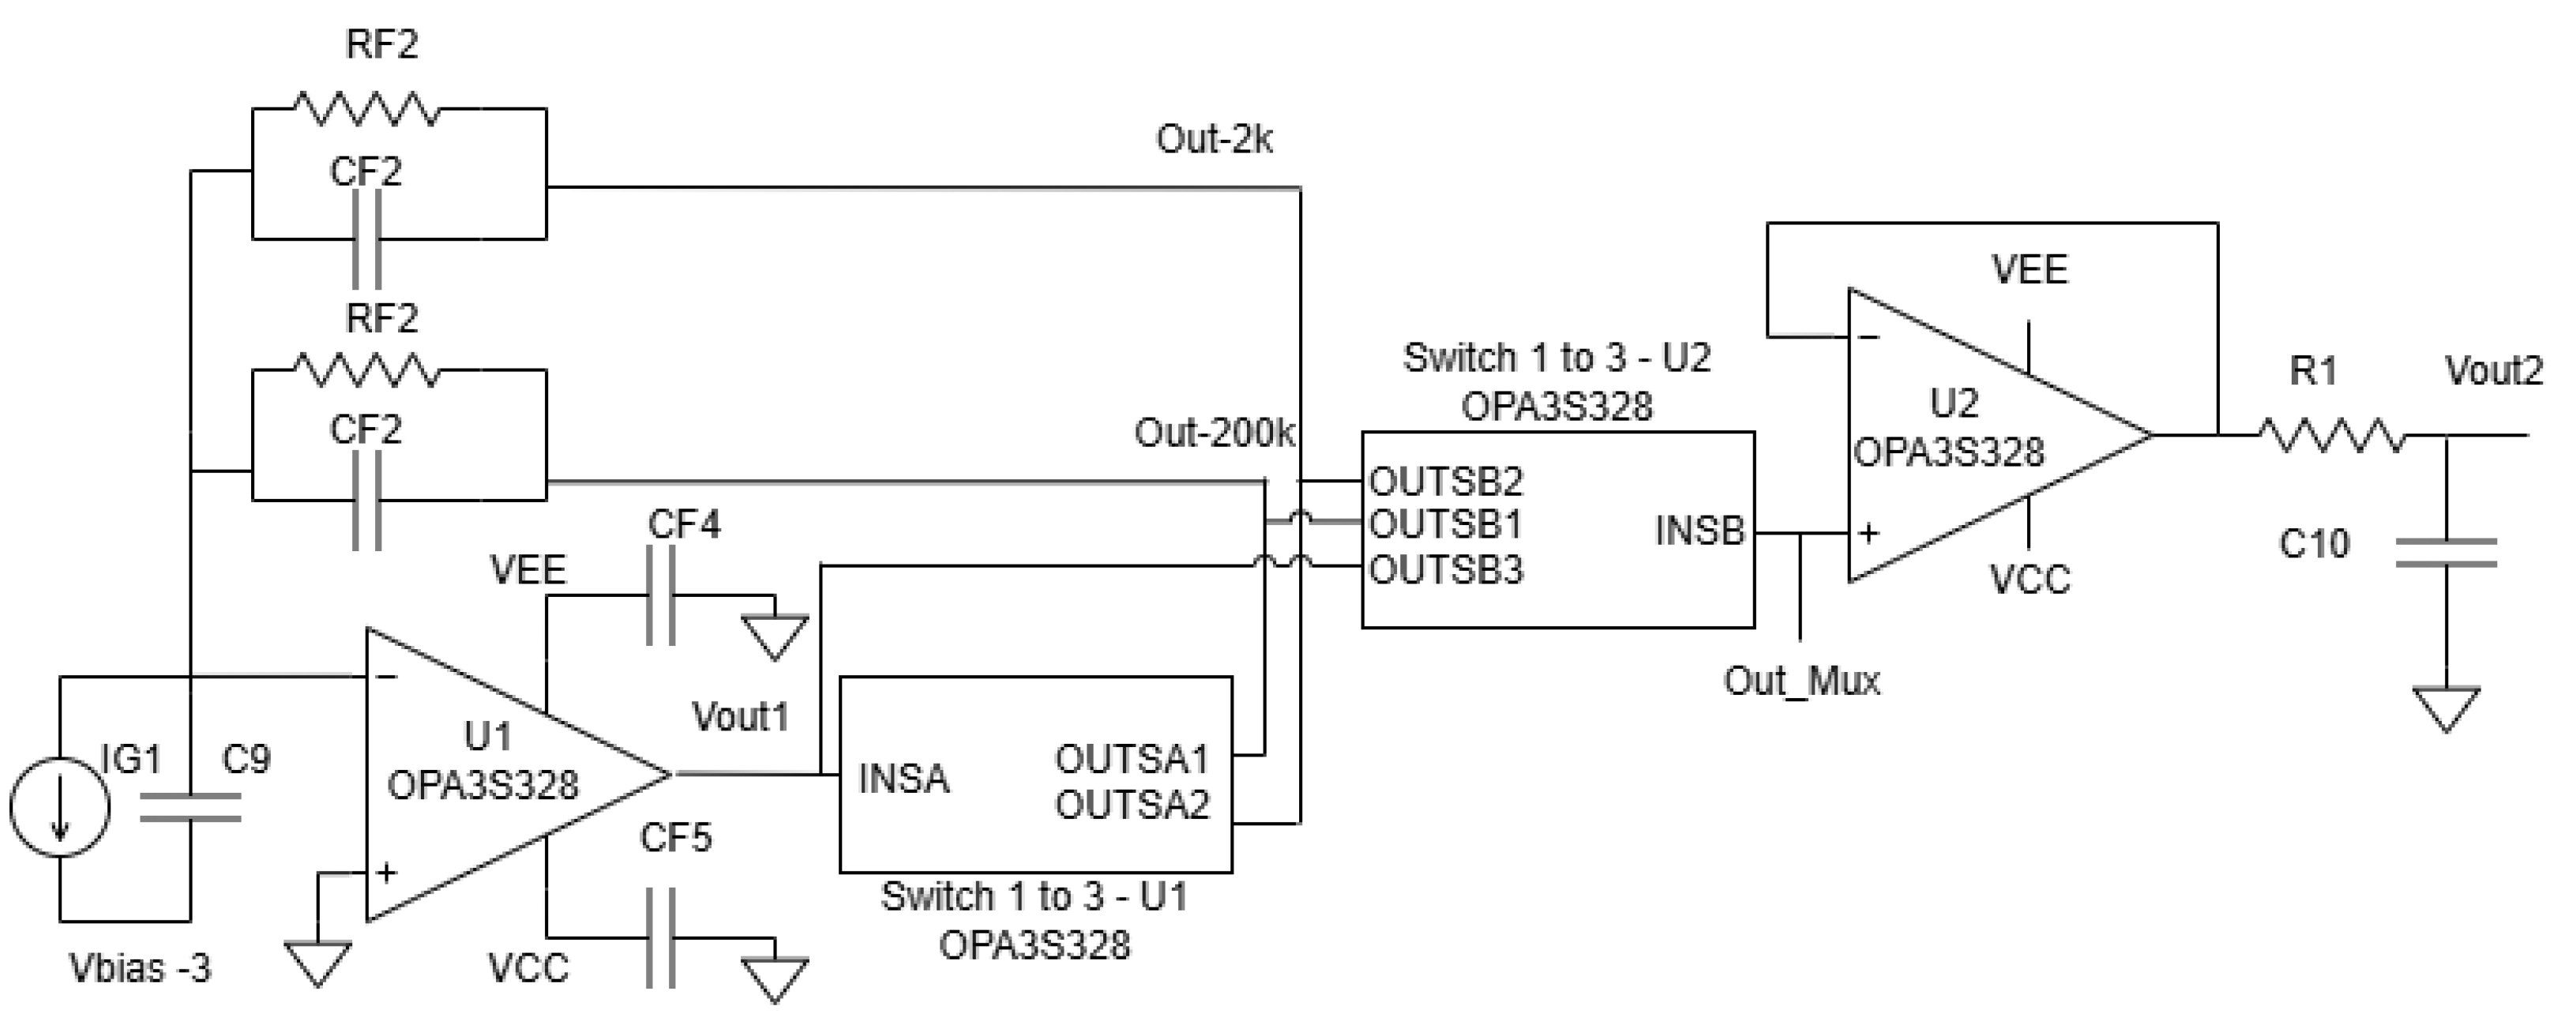
The programmable gain amplifier is the core of our calibration system. As shown in the detailed schematic in
Figure 15, the design is based on the OPA3S328 integrated circuit, which includes a transimpedance amplifier (U1A) and a series of controllable switches. The gain is controlled by a Seeeduino microcontroller, which sends digital signals to the ‘A1_CTRL’ and ‘A2_CTRL’ pins to select one of two primary feedback paths. The specific component values used in this implementation are listed in
Table 1.
Maintaining stability in a TIA circuit is crucial. The stability of the TIA circuit is ensured by managing the loop gain, which is defined as the product of the op-amp’s open-loop gain (AOL) and the feedback factor (). Stability is achieved when AOL equals , a condition that varies with frequency. The critical frequency , where these two curves intersect, must be carefully considered in the design.
Capacitor values must satisfy bandwidth constraints. For a desired closed-loop bandwidth of 500 kHz:
For , pF.
For , pF.
Parasitic capacitance from active switches and a series resistance (typically 90 ) must also be considered, as they can reduce the phase margin. At pF, the phase margin is approximately 54.6°, whereas at pF, it drops to 35.8°. To maintain a margin above 35°, a more conservative value of 50 pF is used.
The op-amp’s rail-to-rail output (RRO) stage must also be protected. If the output approaches supply rails too closely, performance may degrade. A buffer margin of 200 mV is recommended by the manufacturer [
25]. This constraint limits the allowable resistance in the feedback network. For worst-case diode current and switch resistance:
For μA and , .
For mA and , .
The selected resistor values fall within these constraints, ensuring stable amplifier operation without encroaching upon RRO limits. This dynamic gain design, integrated with real-time signal adaptation, provides a robust framework for improving the fidelity of PPG signals across diverse patient populations.
The overall system, including the PGA and microcontroller, was implemented on a custom-designed printed circuit board (PCB) shown in
Figure 16. Initial validation of the switch control and gain stages was performed on this hard PCB prototype before integrating it with the MyDAQ-based signal replay system for testing with the collected human PPG data.
6. Discussion
The results of this study highlight the importance and feasibility of normalizing PPG signal amplitudes to mitigate the influence of skin pigmentation on sensor accuracy. Our data confirm previous findings that darker skin pigmentation lead to a to a reduced signal amplitude due to increased light absorption, which can significantly distort physiological readings such as heart rate and SpO2. By implementing a PGA with a one-time gain calibration controlled through skin tone data, we were able to significantly reduce signal variability across participants with differing skin tones while preserving the waveform morphology critical for diagnostic use.
The test results indicated a significant improvement in the consistency of the output voltage when the PGA was integrated into the PPG sensor design. The following observations were made:
Light skin pigmentation: The output voltage remained stable, reflecting a consistent minimal deviation from the expected readings.
Medium skin pigmentation: The PGA effectively adjusted the gain to compensate for the reduced back-reflected light, resulting in a consistent output voltage similar to that of light skin pigmentation.
Dark skin pigmentation: The most notable improvement was observed in the readings of subjects with darker skin pigmentation. The PGA’s ability to boost the signal strength compensated for the lower back-reflected light intensity, producing output voltages comparable with those from lighter skin tones.
These findings collectively highlight the efficacy of the PGA-based normalization system in addressing the longstanding performance disparities observed in optical-based sensors across diverse populations. By implementing gain adjustments tailored to skin pigmentation, the system successfully bridges a critical equity gap in PPG signal acquisition.
A key advantage of our “set-and-hold” calibration, applied once at initialization, is the preservation of the PPG waveform’s morphological integrity. This was a deliberate design choice. Unlike continuous real-time gain adjustments, which can introduce artifacts by altering the relative amplitudes of the systolic peak and dicrotic notch, our method ensures the inherent shape of the signal is maintained. Such distortions from real-time systems can mask or even mimic pathological conditions, compromising the signal’s diagnostic value beyond simple heart rate extraction. By setting the gain only once, our system supports diagnostic reliability while providing a robust solution to the foundational problem of inter-individual signal variability due to skin tone.
Quantitative results further substantiate the impact of this approach. As shown in
Table 3 and
Table 4, post-gain signal amplitudes across pigmentation groups were effectively equalized, with a variance narrowed to within ±0.0008 V, compared with disparities exceeding 0.004 V prior to correction. Moreover, the regression analysis revealed a dramatic drop in the R
2 value from 0.0816 to 0.00004, indicating that over 98% of the variance attributable to skin pigmentation was eliminated. This aligns with the visual flattening of the amplitude distribution seen in
Figure 21. Importantly, this standardization not only enhances equity in signal interpretation but also bolsters diagnostic reliability. By minimizing pigmentation-induced attenuation while preserving waveform fidelity, the PGA-based system offers a robust and scalable solution for improving the inclusivity and accuracy of wearable biosensor technologies.
Additionally, the custom-designed 3D-printed enclosure provided a stable, controlled testing environment, minimizing interference from ambient light and motion artifacts. This control enabled us to isolate and analyze the true impact of skin pigmentation on signal attenuation. By pairing this environment with an automated gain control mechanism based on objective RGB skin tone measurement, we developed a novel and scalable method for improving sensor equity and reliability.
However, several limitations must be acknowledged. This study focused primarily on skin pigmentation; we did not experimentally test the system’s ability to mitigate other variables like motion artifacts or tattoos. The choice to use RGB values to infer absorption in the infrared spectrum is another limitation. While melanin, the primary determinant of skin color, is known to have broad-spectrum absorption that extends into the near-infrared range [
26], the relationship is complex, and future work could benefit from directly measuring skin reflectance at the sensor’s specific wavelengths. Finally, while we collected demographic data, the sample size was insufficient for a robust analysis of covariates like age or fitness level. While this implementation showed strong performance under controlled conditions, rigorously testing the system in real-world ambulatory environments remains an important area for future work. The integration of the PGA system has been shown to significantly equalize signal amplitude across skin tones without compromising diagnostic quality, establishing a strong foundation for further development of inclusive and clinically reliable PPG sensing technologies.


