A Review on Optical Biosensors for Monitoring of Uric Acid and Blood Glucose Using Portable POCT Devices: Status, Challenges, and Future Horizons

 ,
, 
 , ,
, ,  , ,
, ,
Abstract
1. Introduction
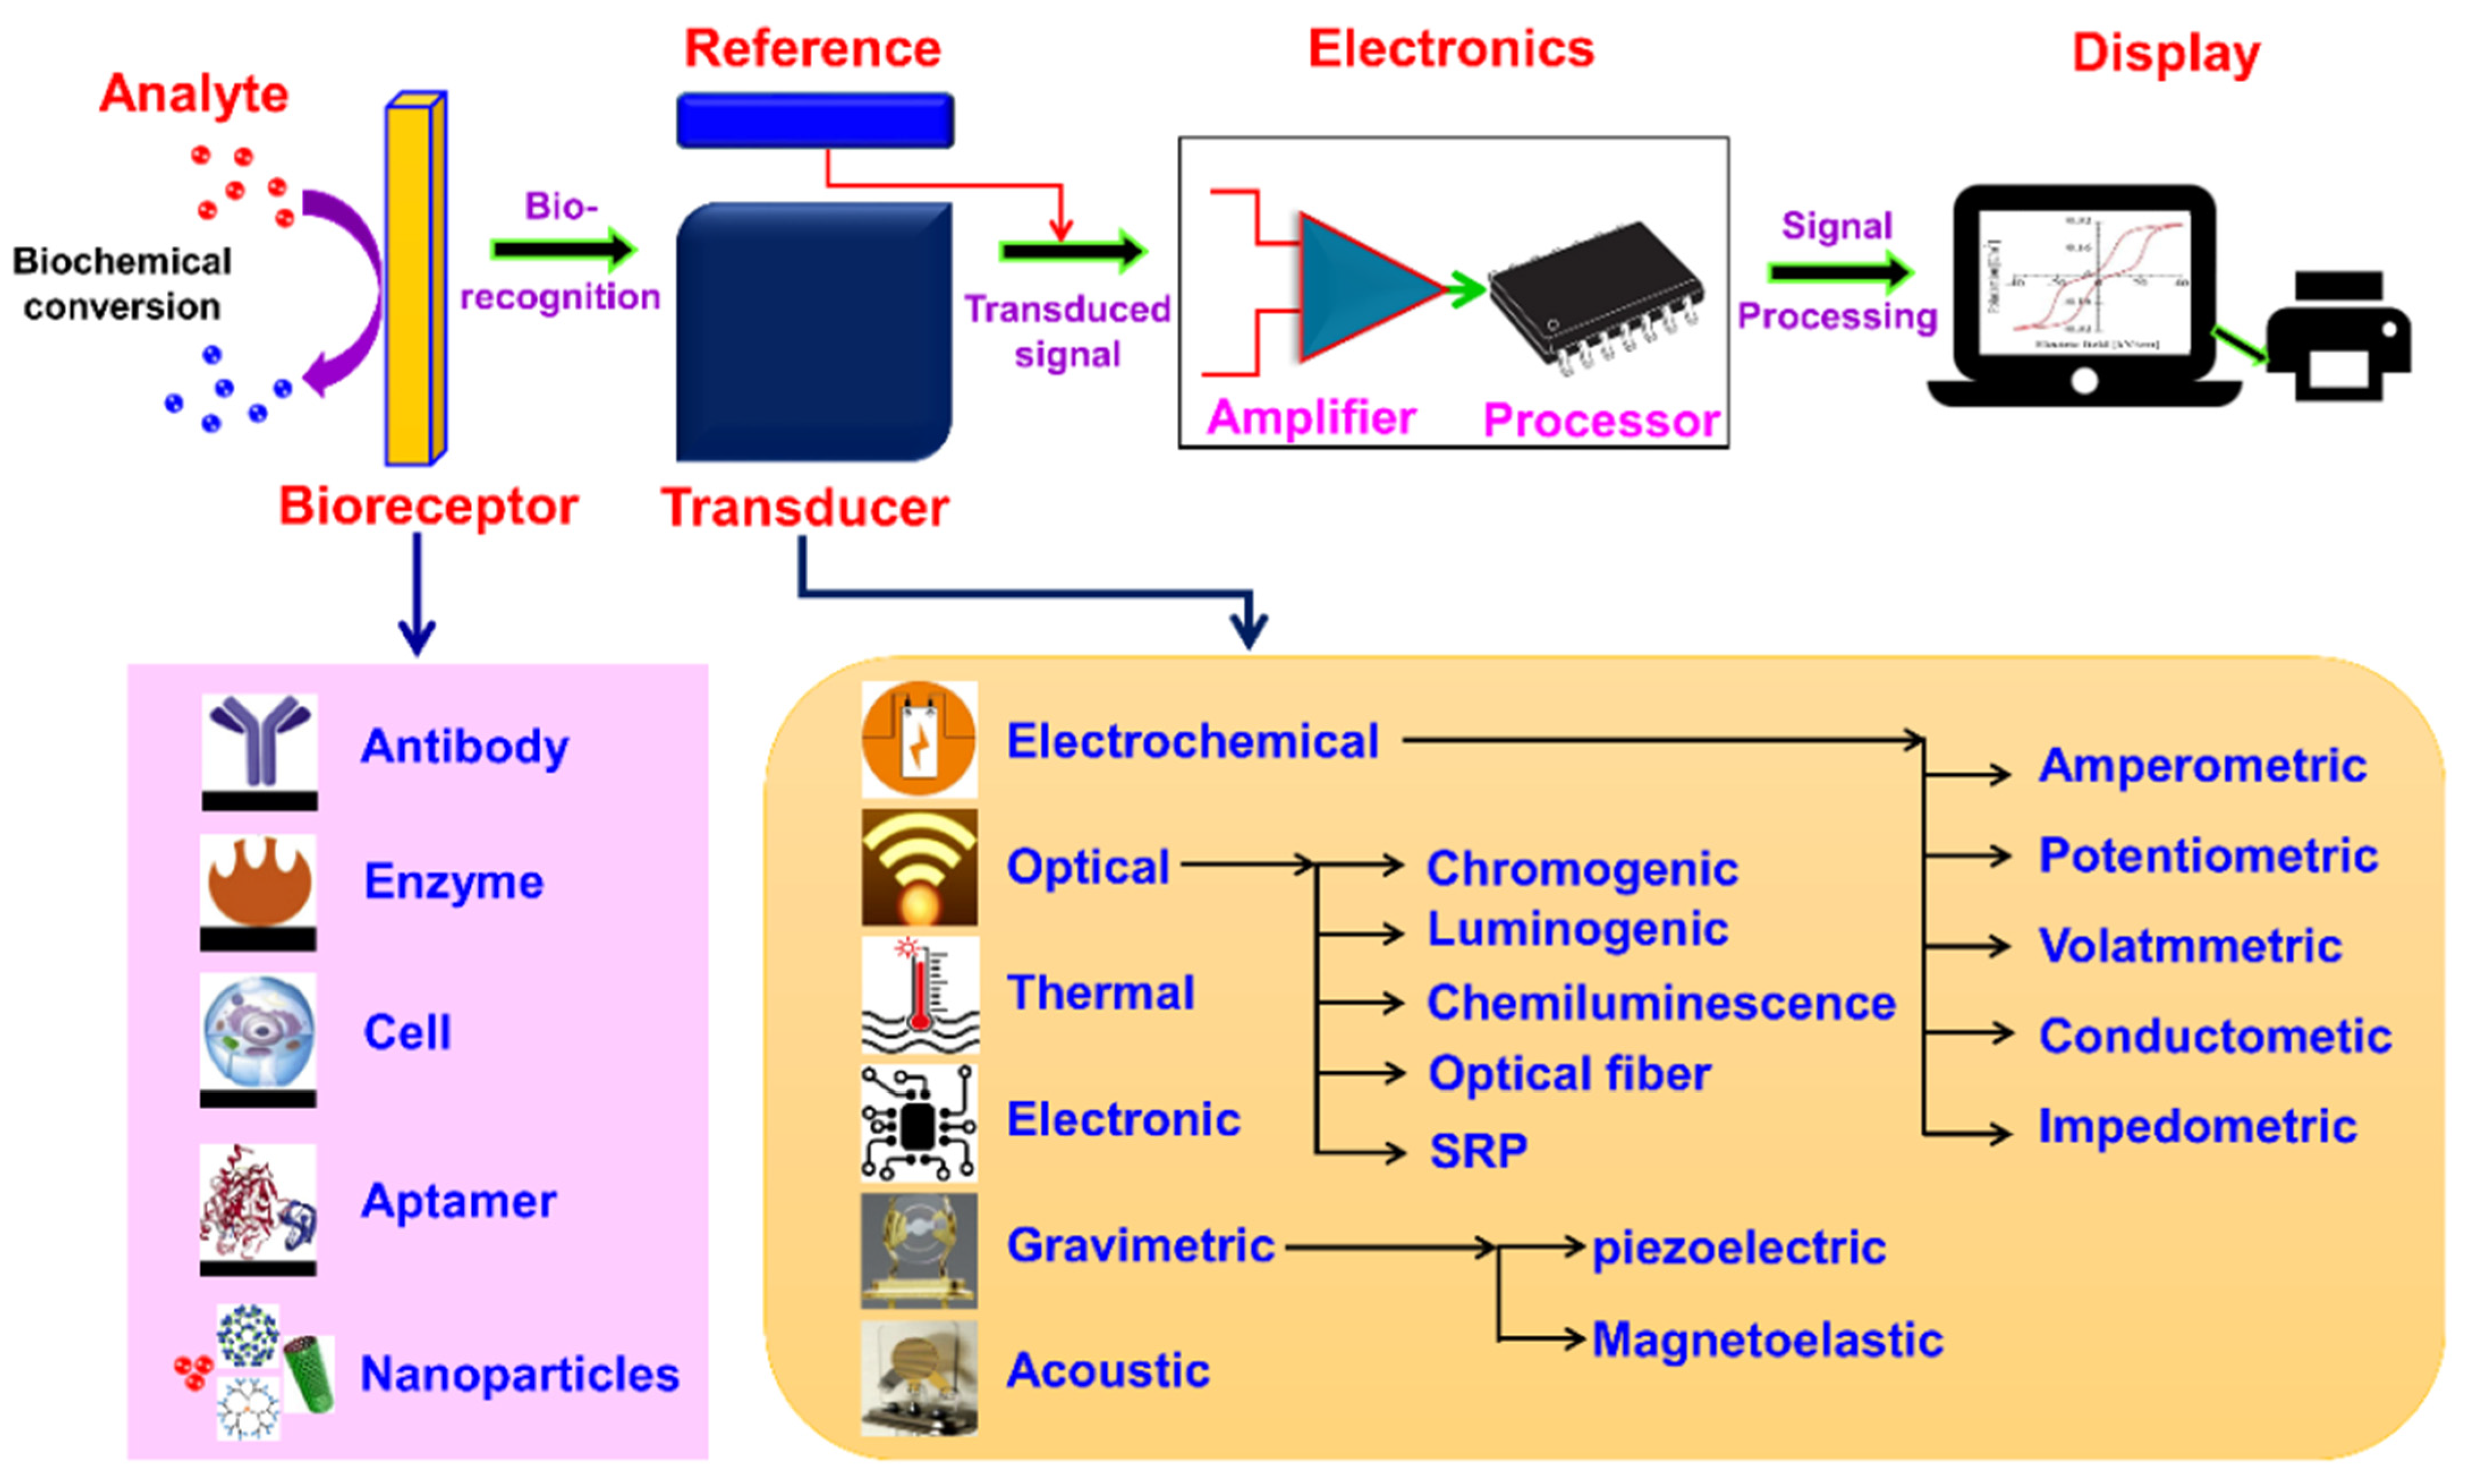
2. Biosensor
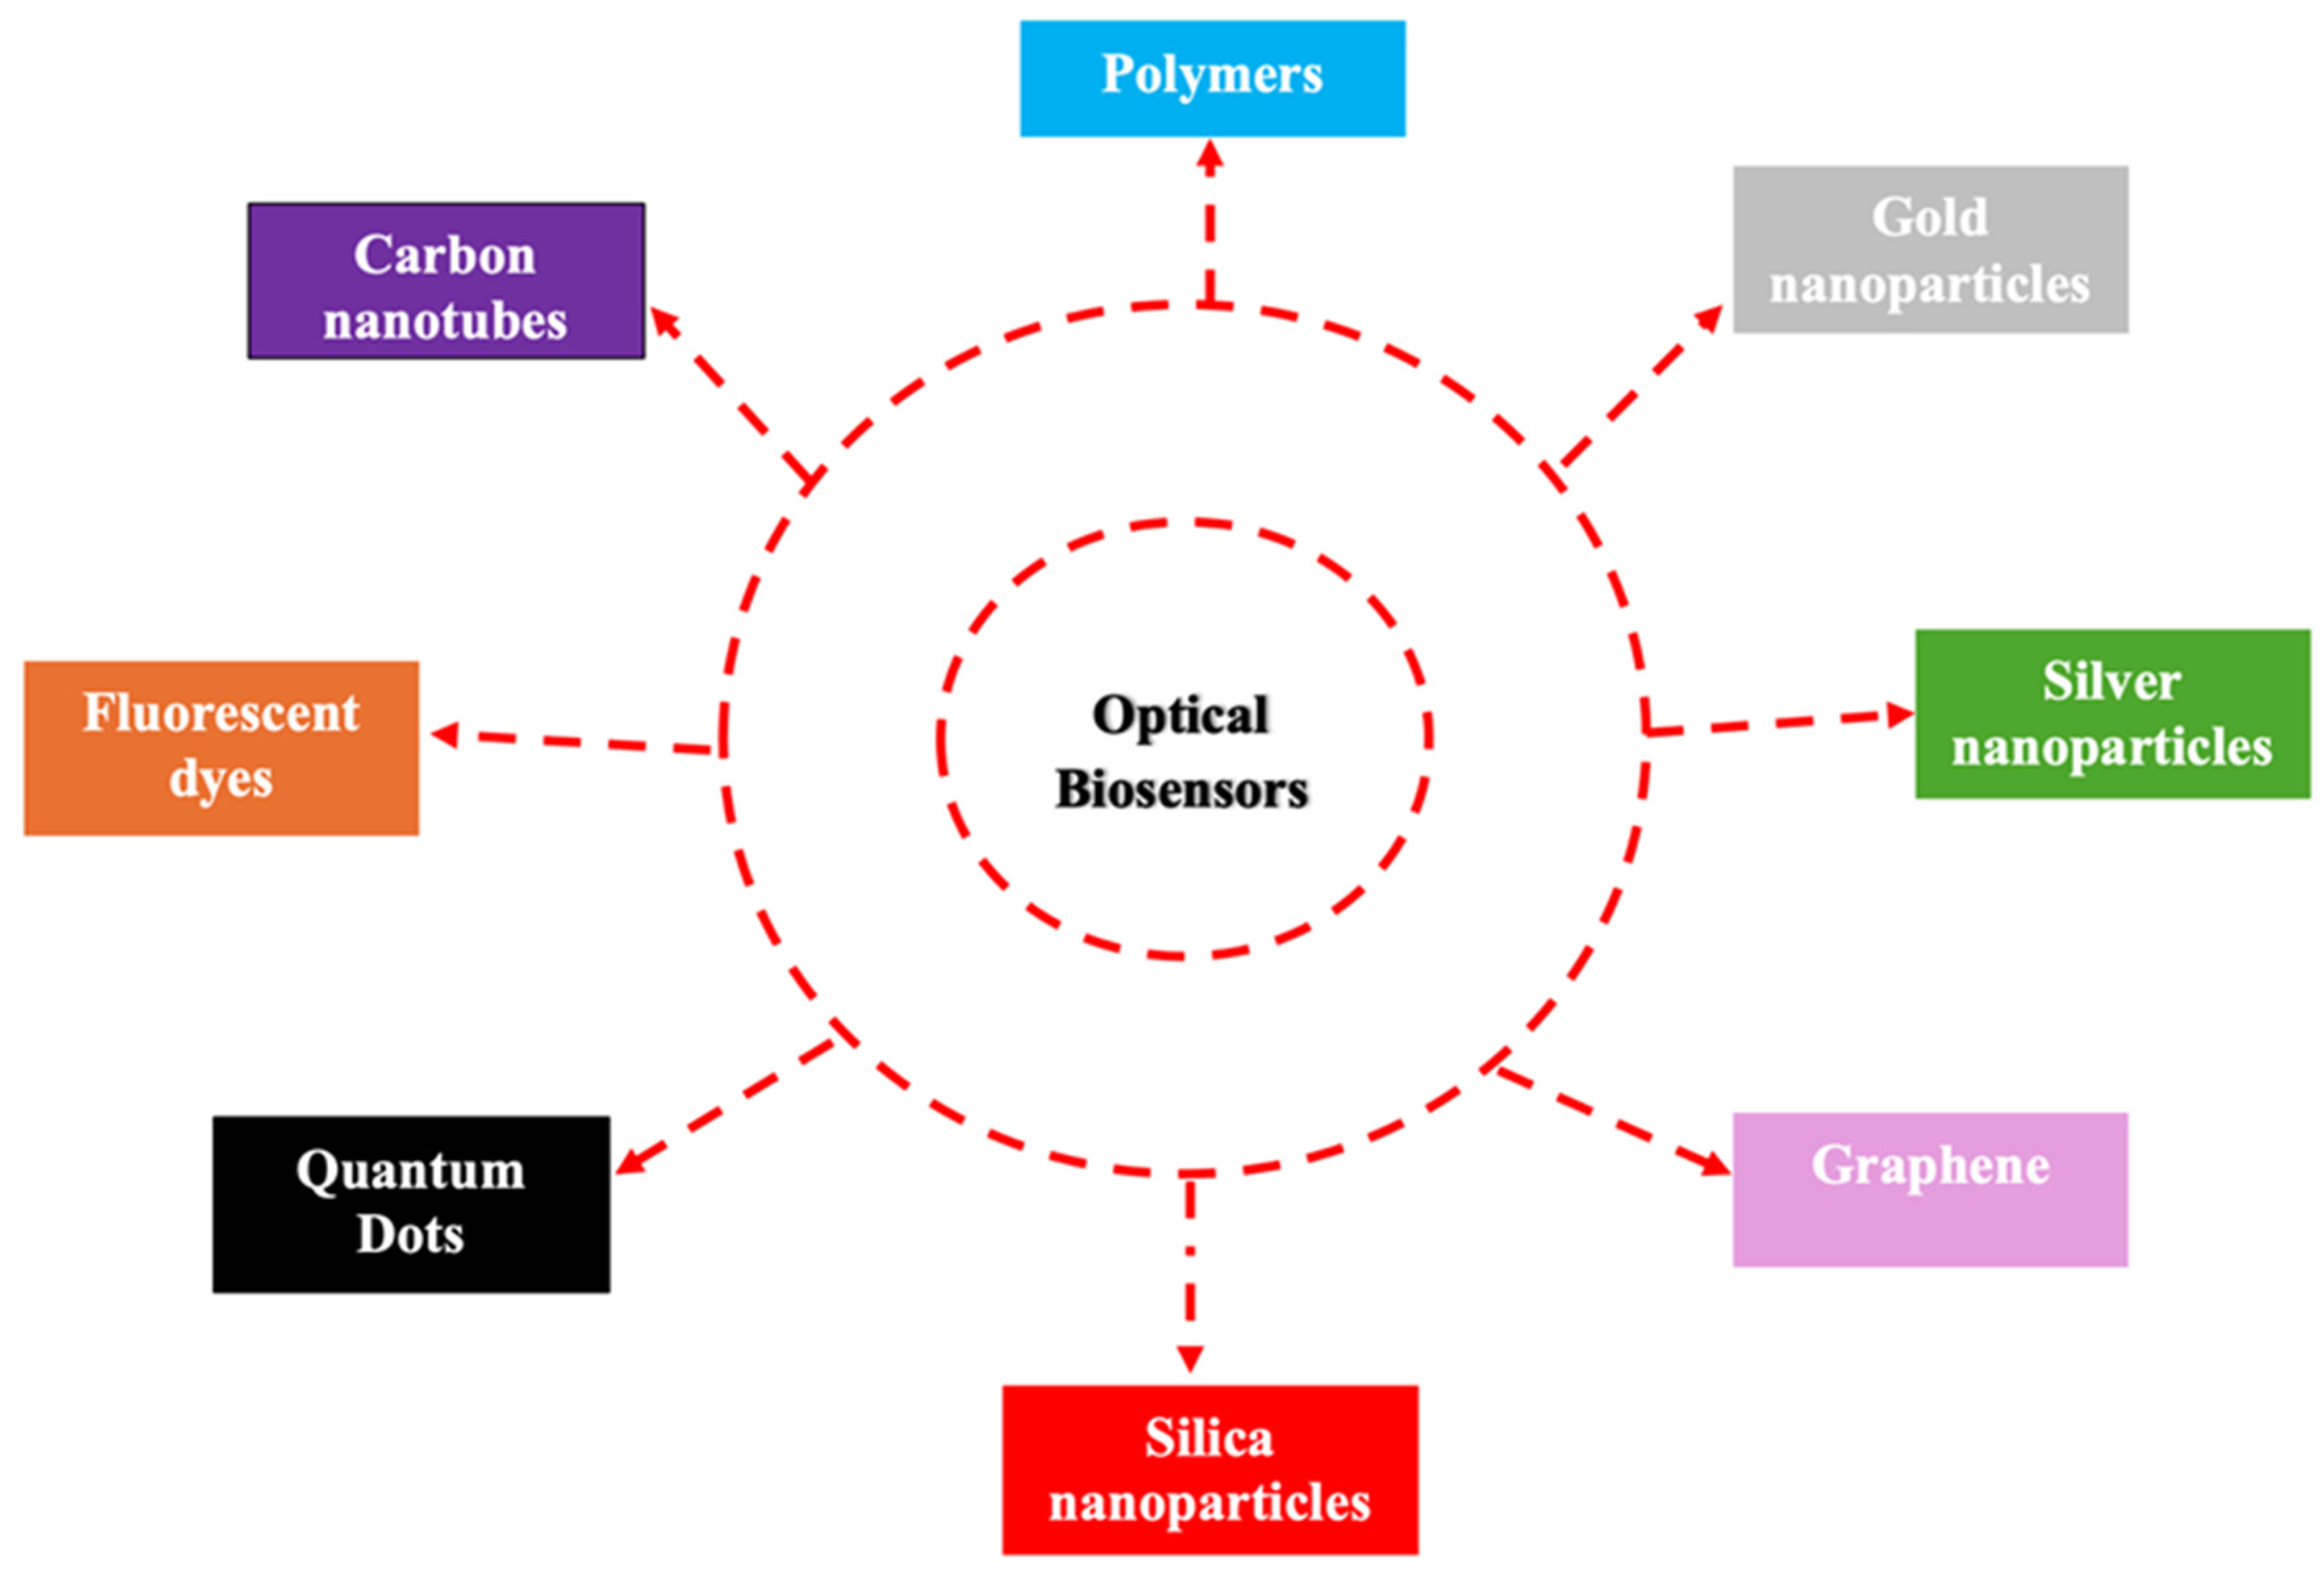
2.1. Integration of Biosensors with Nanotechnology
2.2. Impact and Characteristics of Biosensor as Biomarker Detector
2.3. Comparison of Point-of-Care Biosensors

| References | Analytes | Disease Diagnosis or Medical Application | Benefits | Challenges |
|---|---|---|---|---|
| [69] | Hydrogel-based biosensor | Regenerative medicine | Versatility, retention of bioactivity, ease of modification, water content. | Swelling and dehydration, diffusion imitations, limited mechanical strength. |
| [70] | Nanomaterials-based biosensor | For therapeutic applications | Enhanced sensitivity, rapid response time, multiplexed detection. | Toxicity concerns, standardization challenges, interference in biological samples. |
| [71] | Silicon biosensor | Cancer biomarker development and applications | Compatibility with microfabrication techniques, electronic readout, versatility in surface functionalization, long-term stability. | Brittleness, limited transparency, cost of fabrication. |
| [72] | Microfabricated biosensor | Optical corrections | High throughput, reduced sample volume, integration with electronics, automation compatibility. | Limited material compatibility, limited detection range, limited spatial resolution. |
| [73] | Uric acid biosensor | Cardiovascular and general disease diagnosis | Clinical relevance, rapid results, ease of use, portability, quantitative measurements. | Interference from other compounds, limited dynamic range, calibration requirements, sensor stability, and specificity challenges. |
| [74] | Glucose oxidase electrode-based biosensor and HbA1c (glycated haemoglobin) biosensor | Diabetes | High sensitivity and specificity, compact and portable, integration with electronics. | Oxygen dependency, temperature sensitivity, calibration requirements. |
2.4. Fundamentals of Optical Biosensors
2.5. Classification of Optical Biosensors Based on Transduction Mechanisms
2.5.1. Fiber Optics
2.5.2. Surface Plasmon Resonance-Optics
2.5.3. Surface-Enhanced Raman Scattering
2.6. New Developments in Optical Biosensors
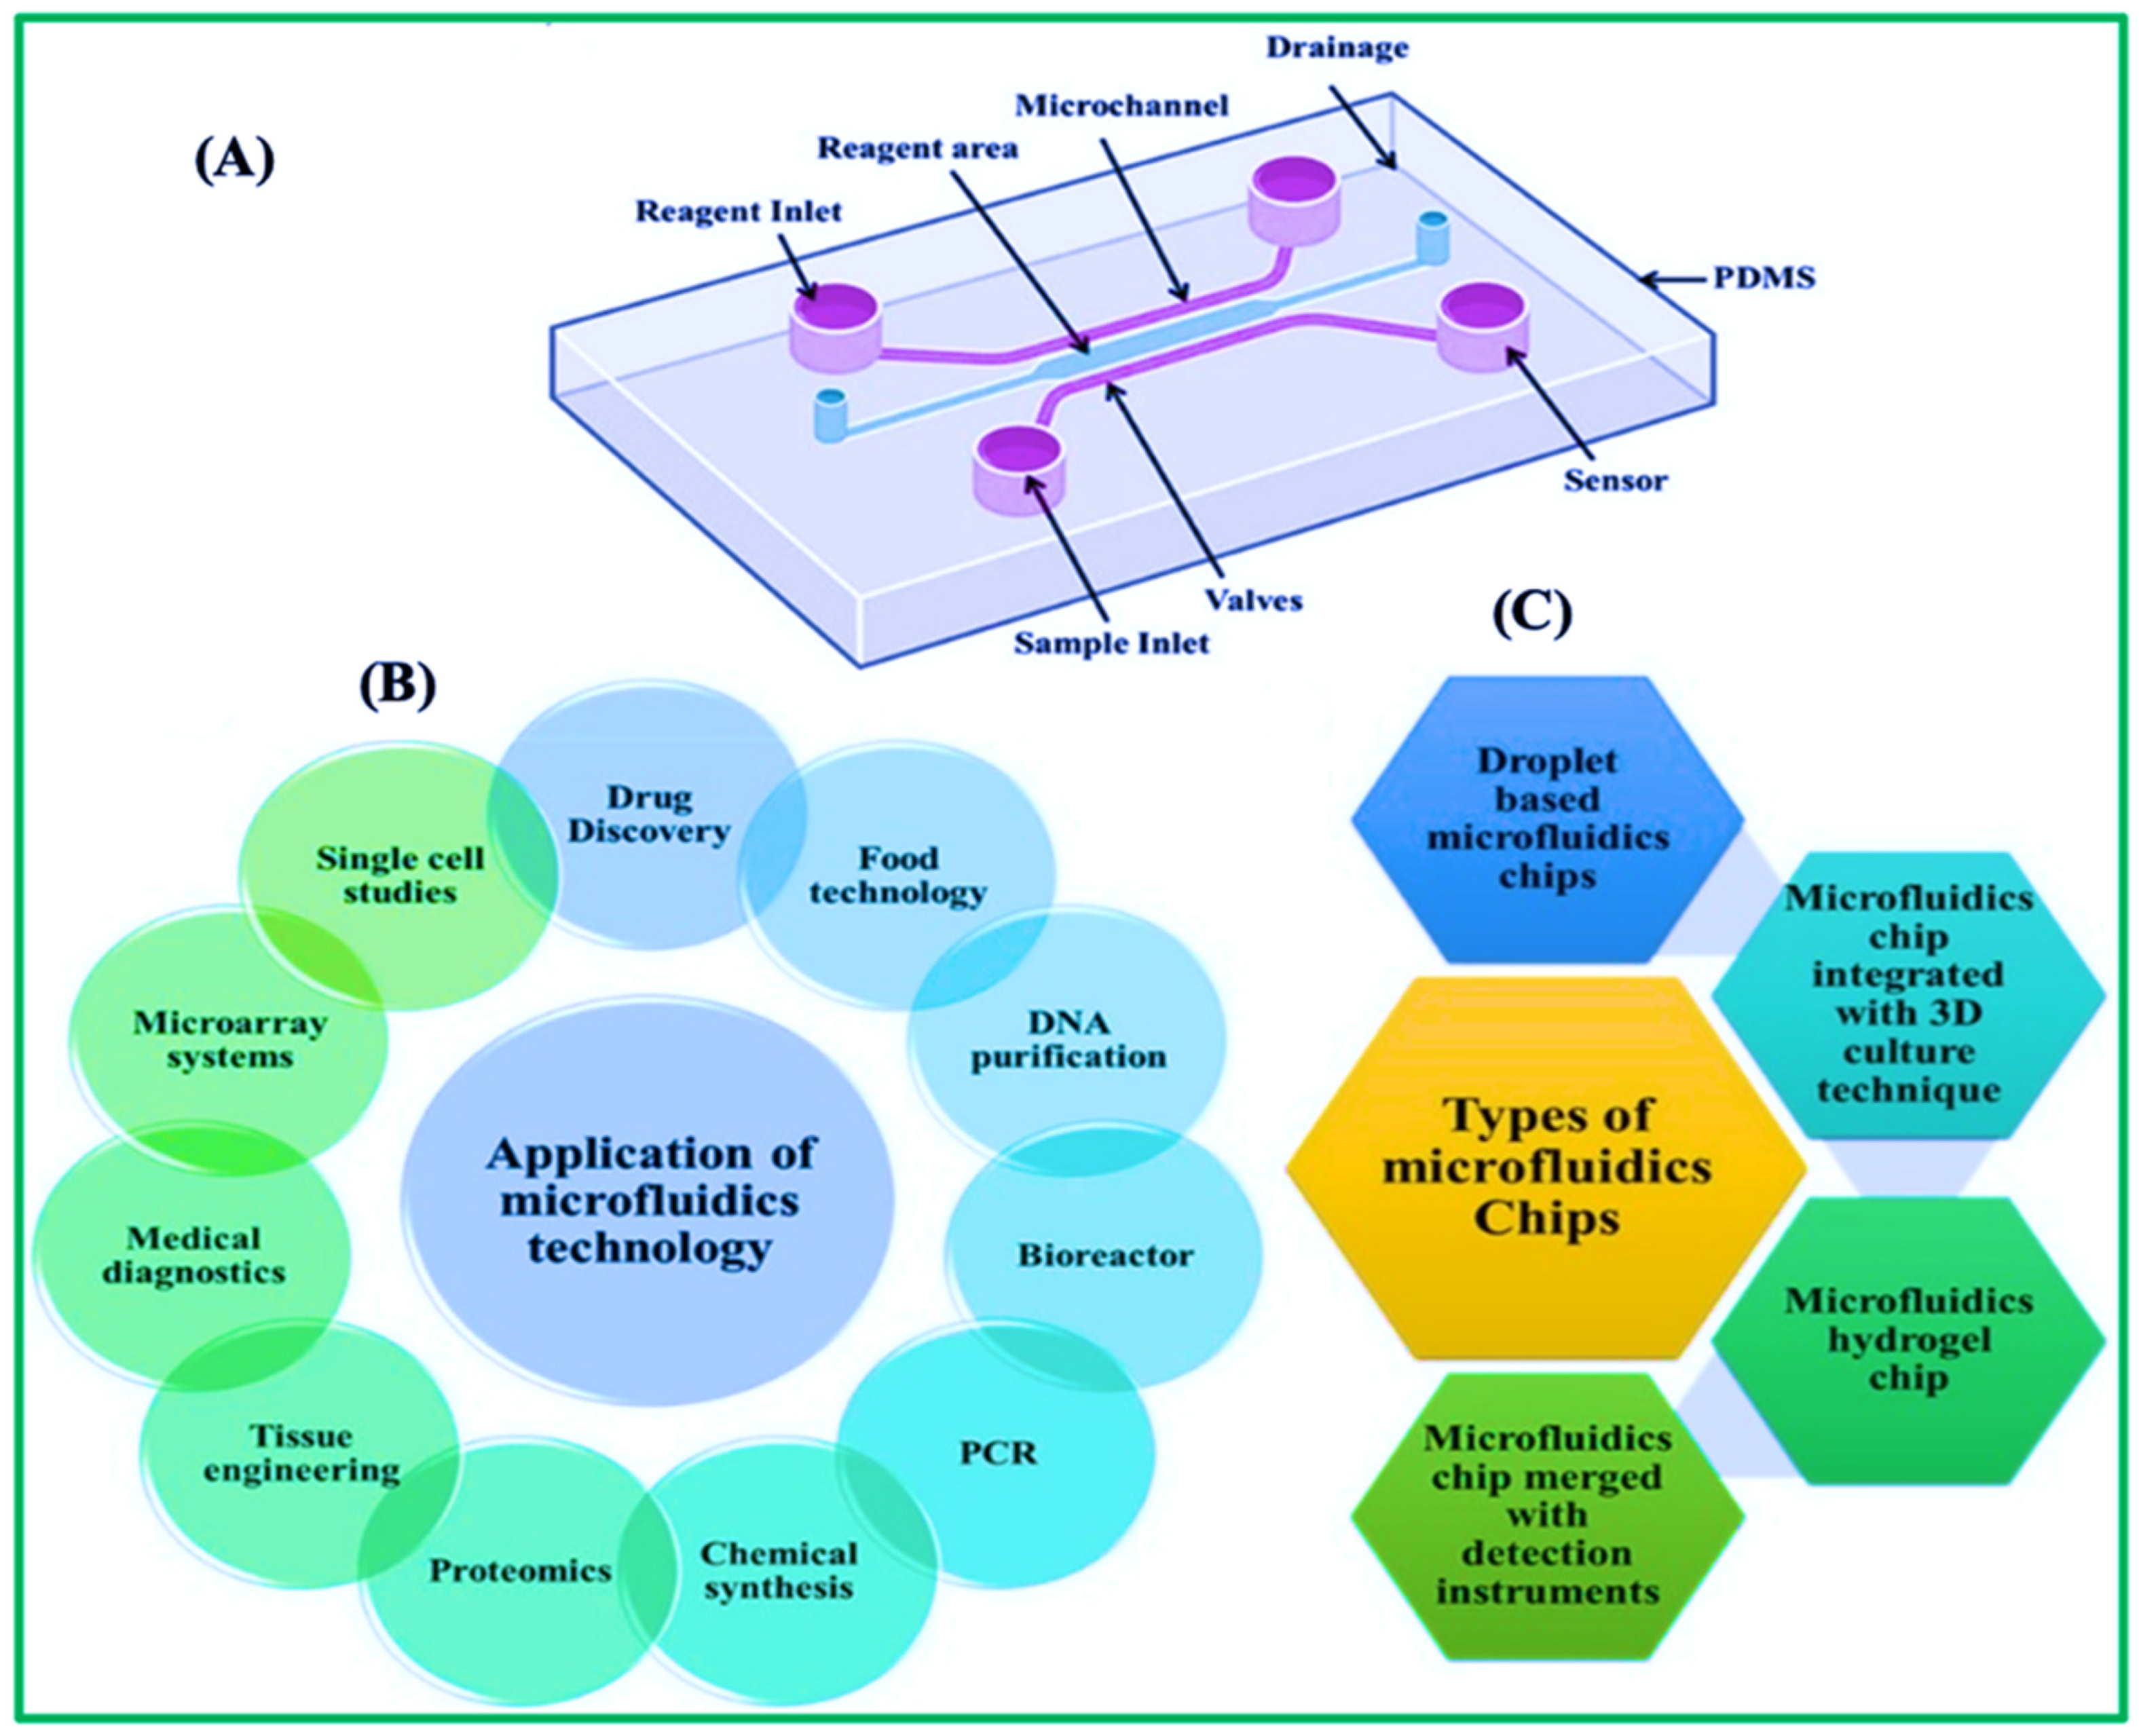
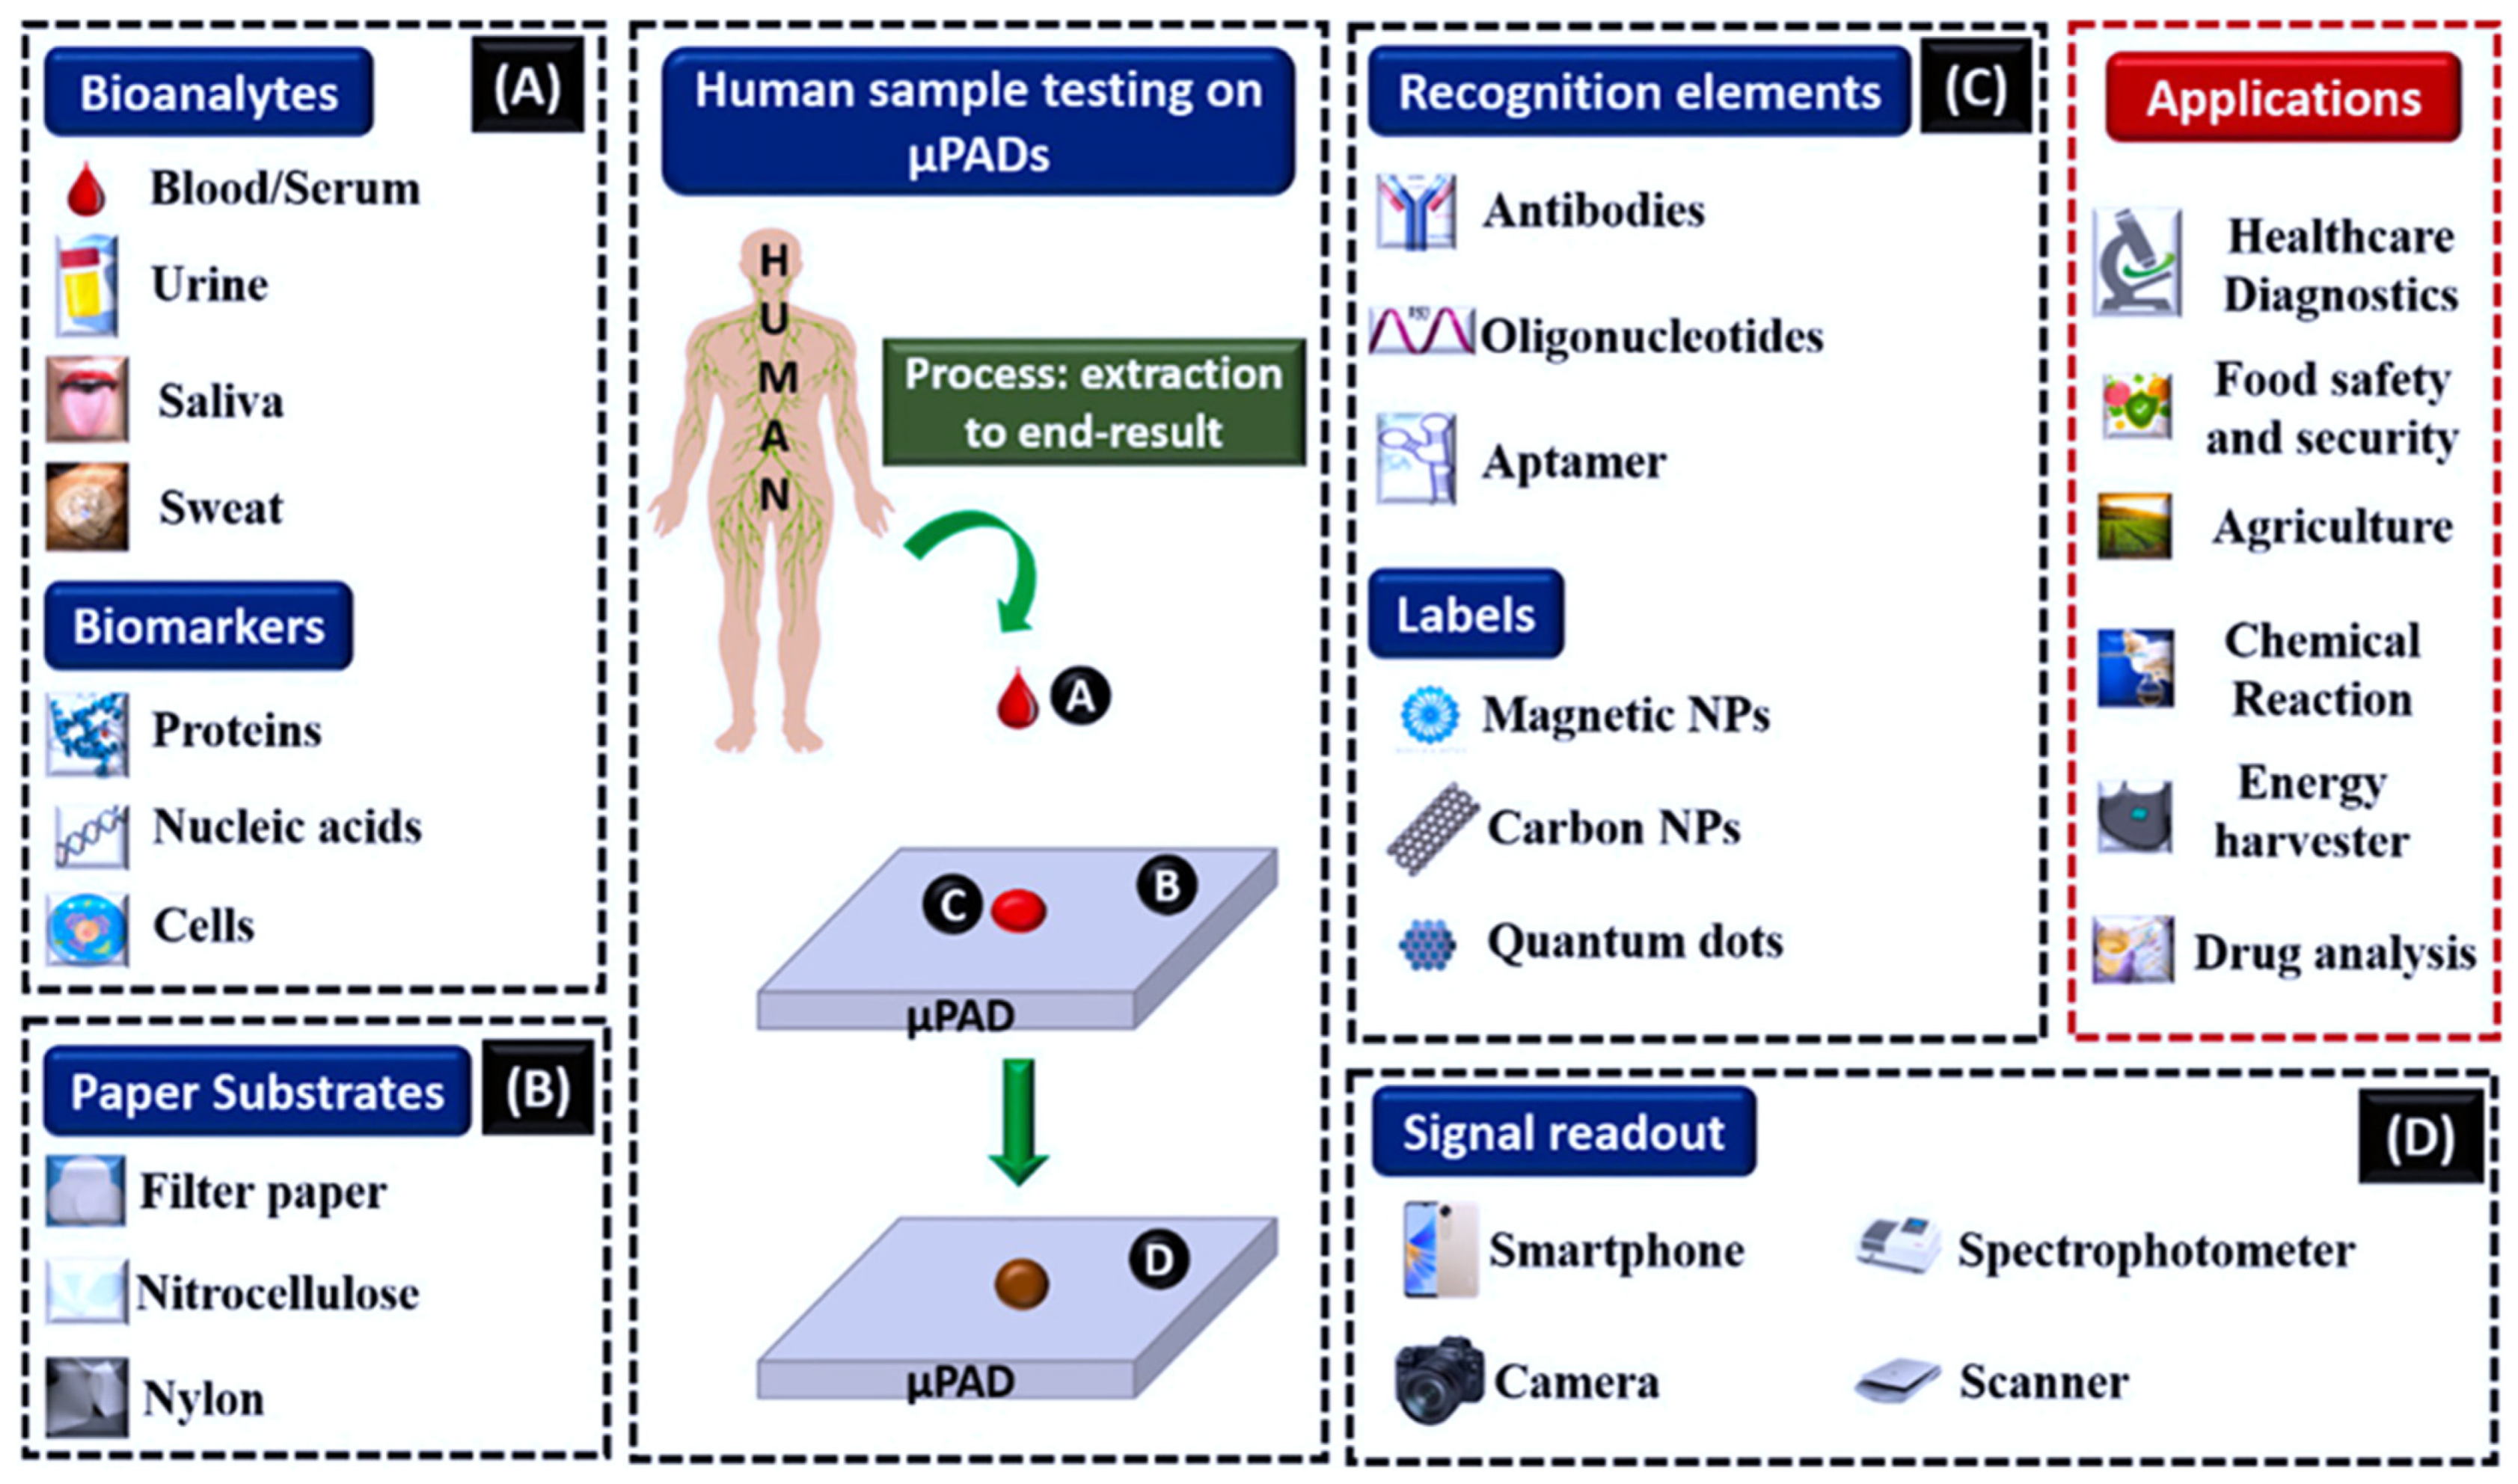
3. Microfluidic Paper-Based Analytical Strips (μPADs)
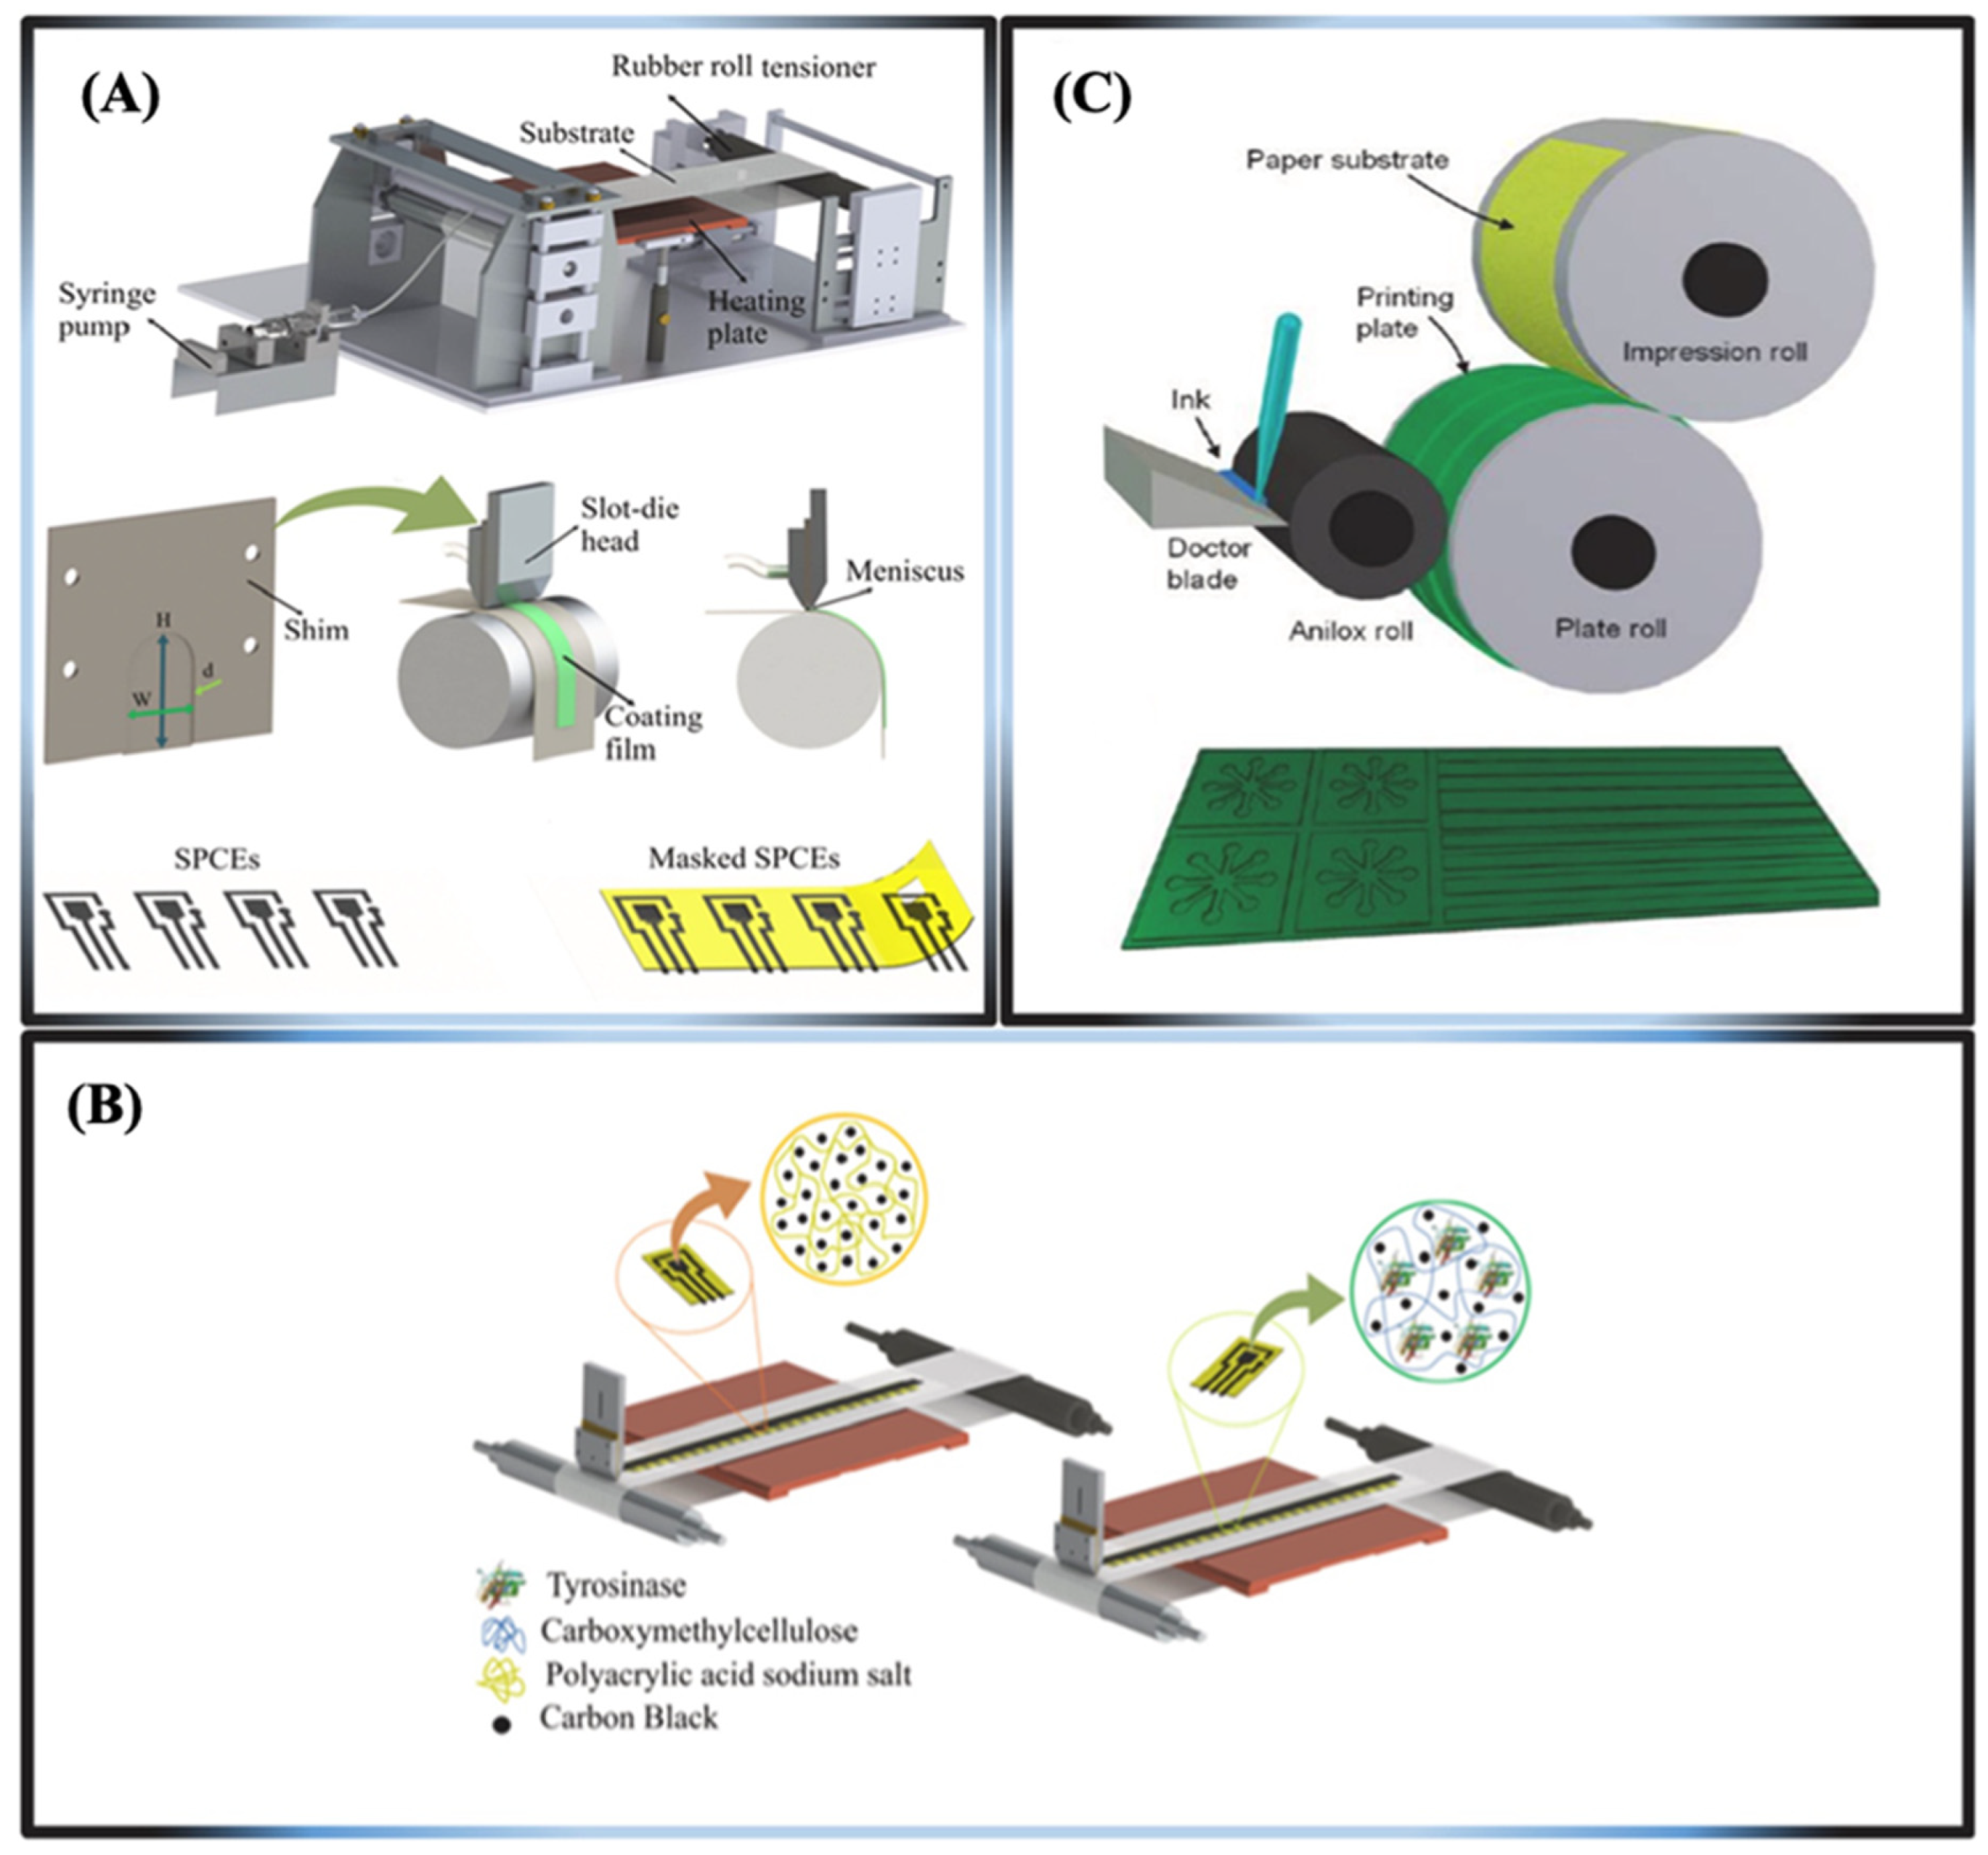
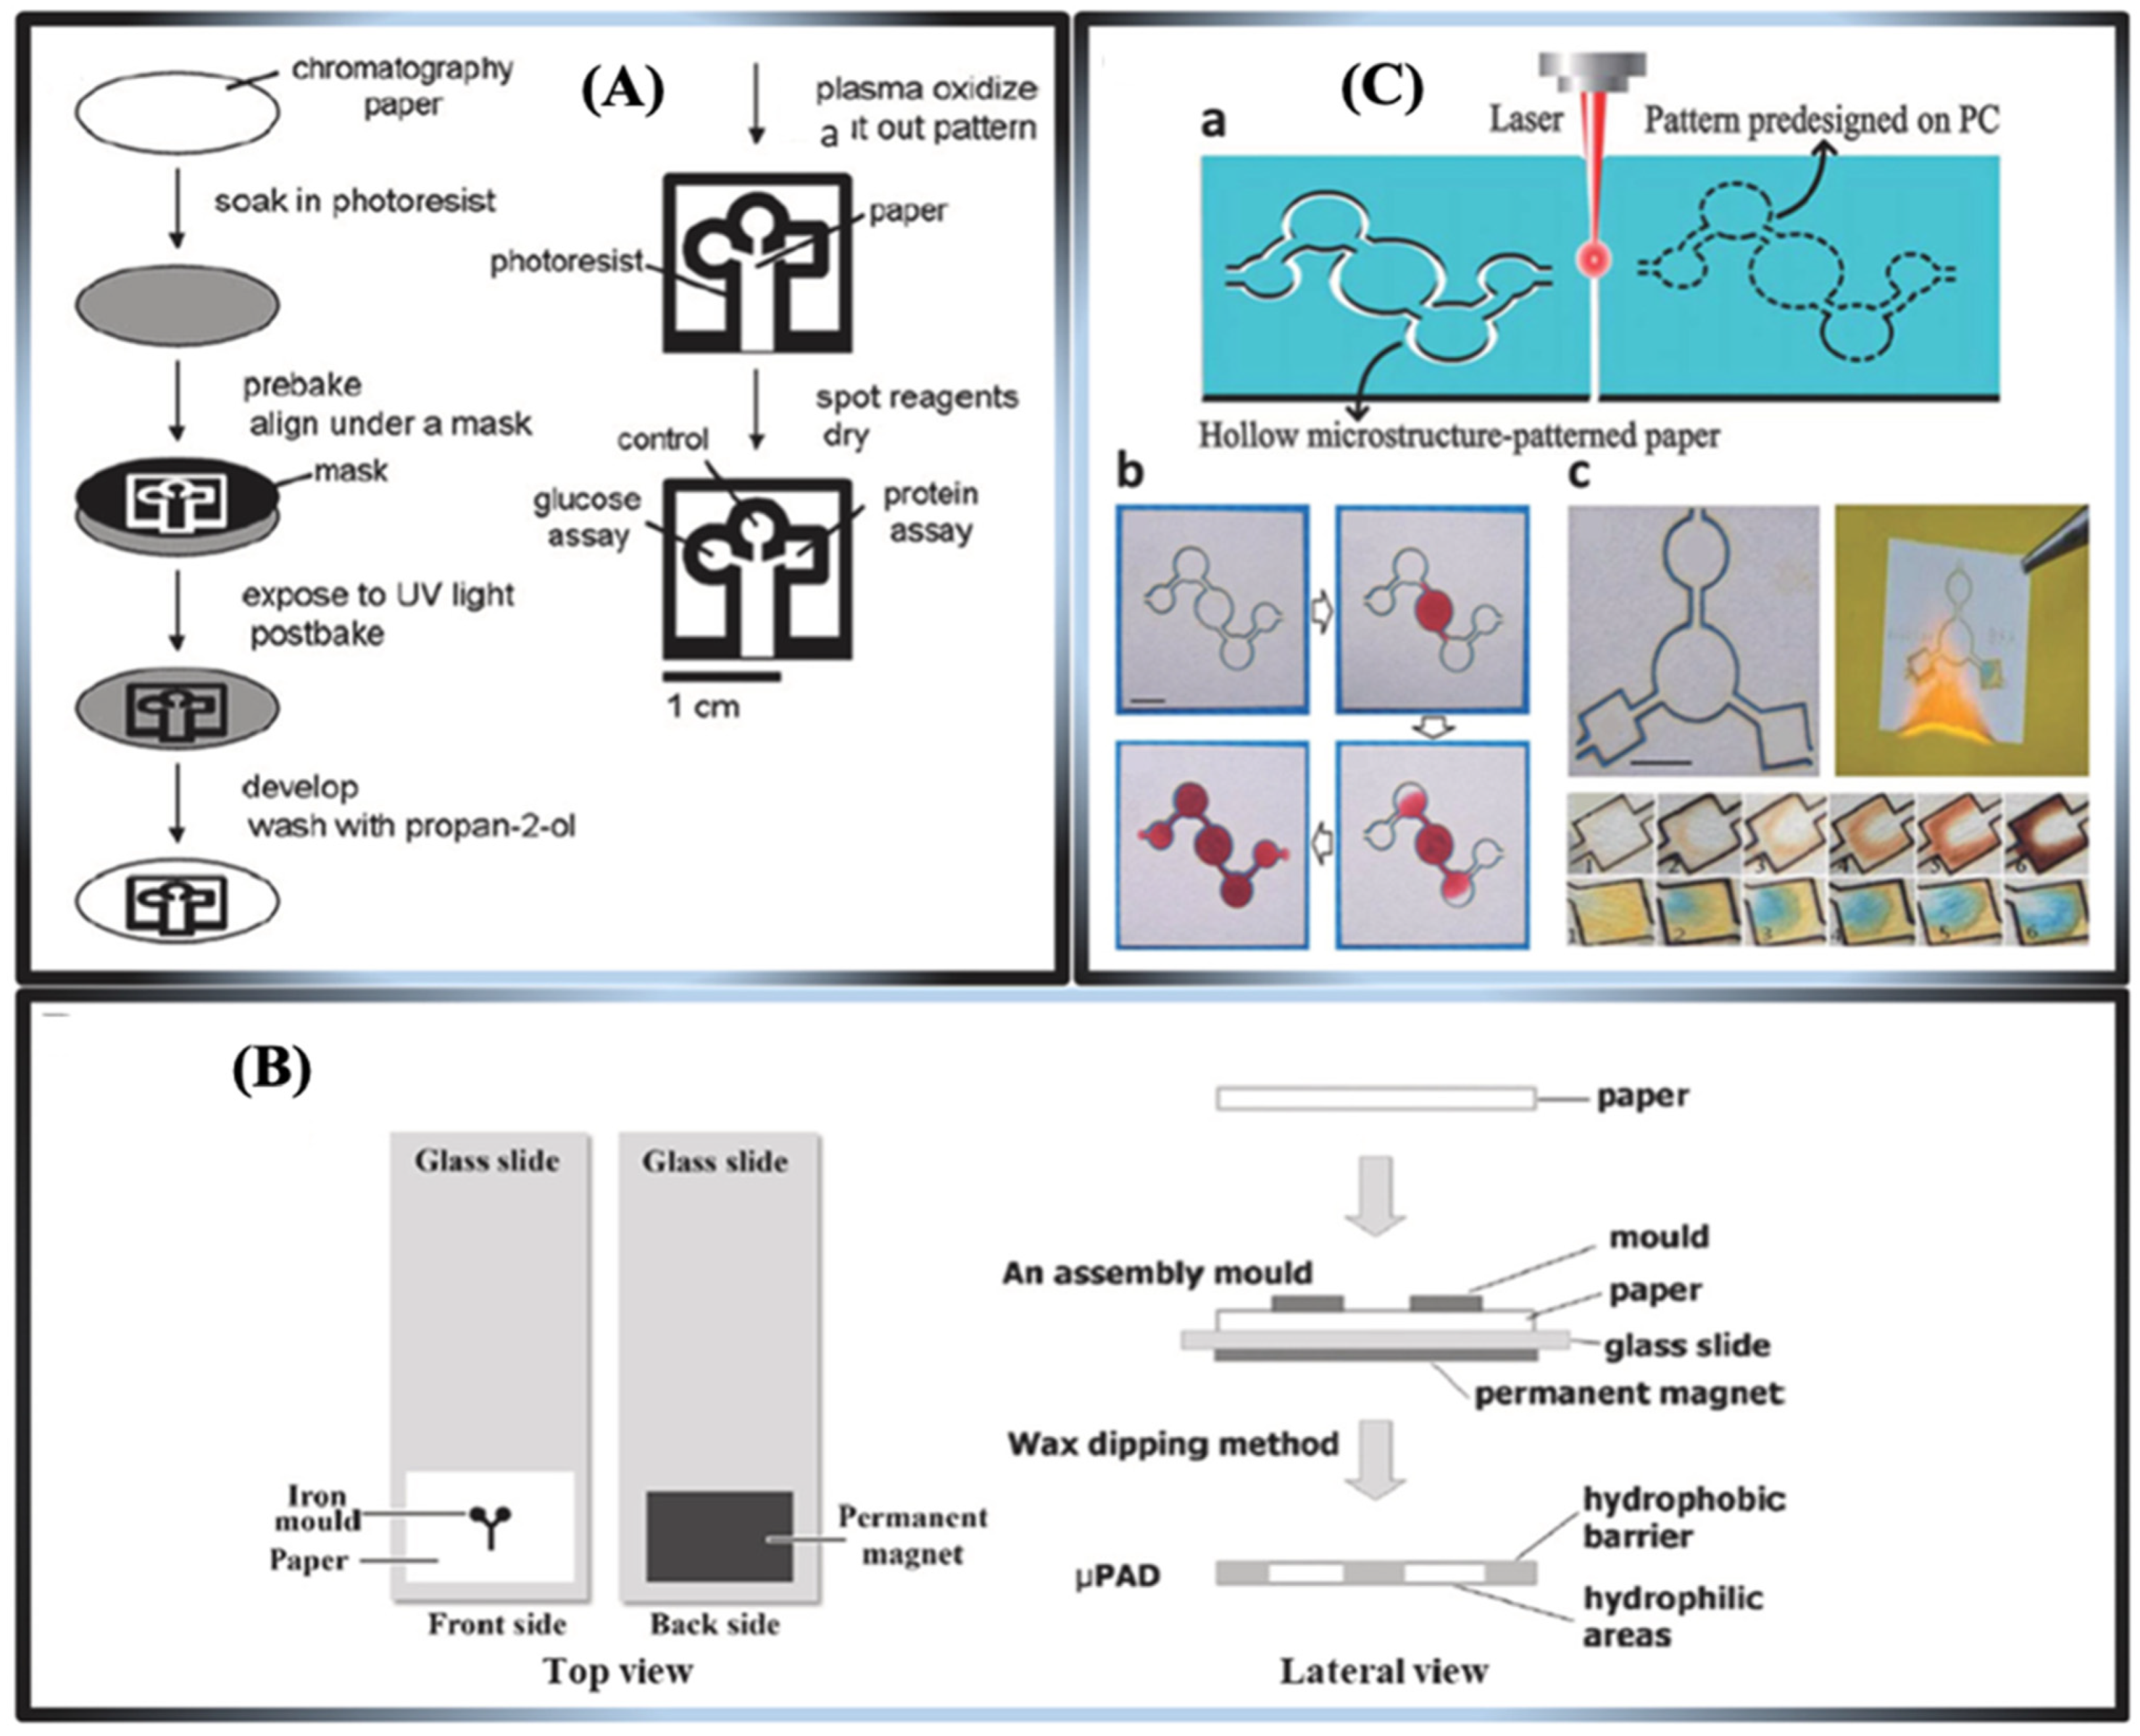
3.1. Practical Applications and Fabrication Methods for μPADs
Strategies for Patterning μPADs
- Printable fabrication methods
- 2.
- Non-printable fabrication methods
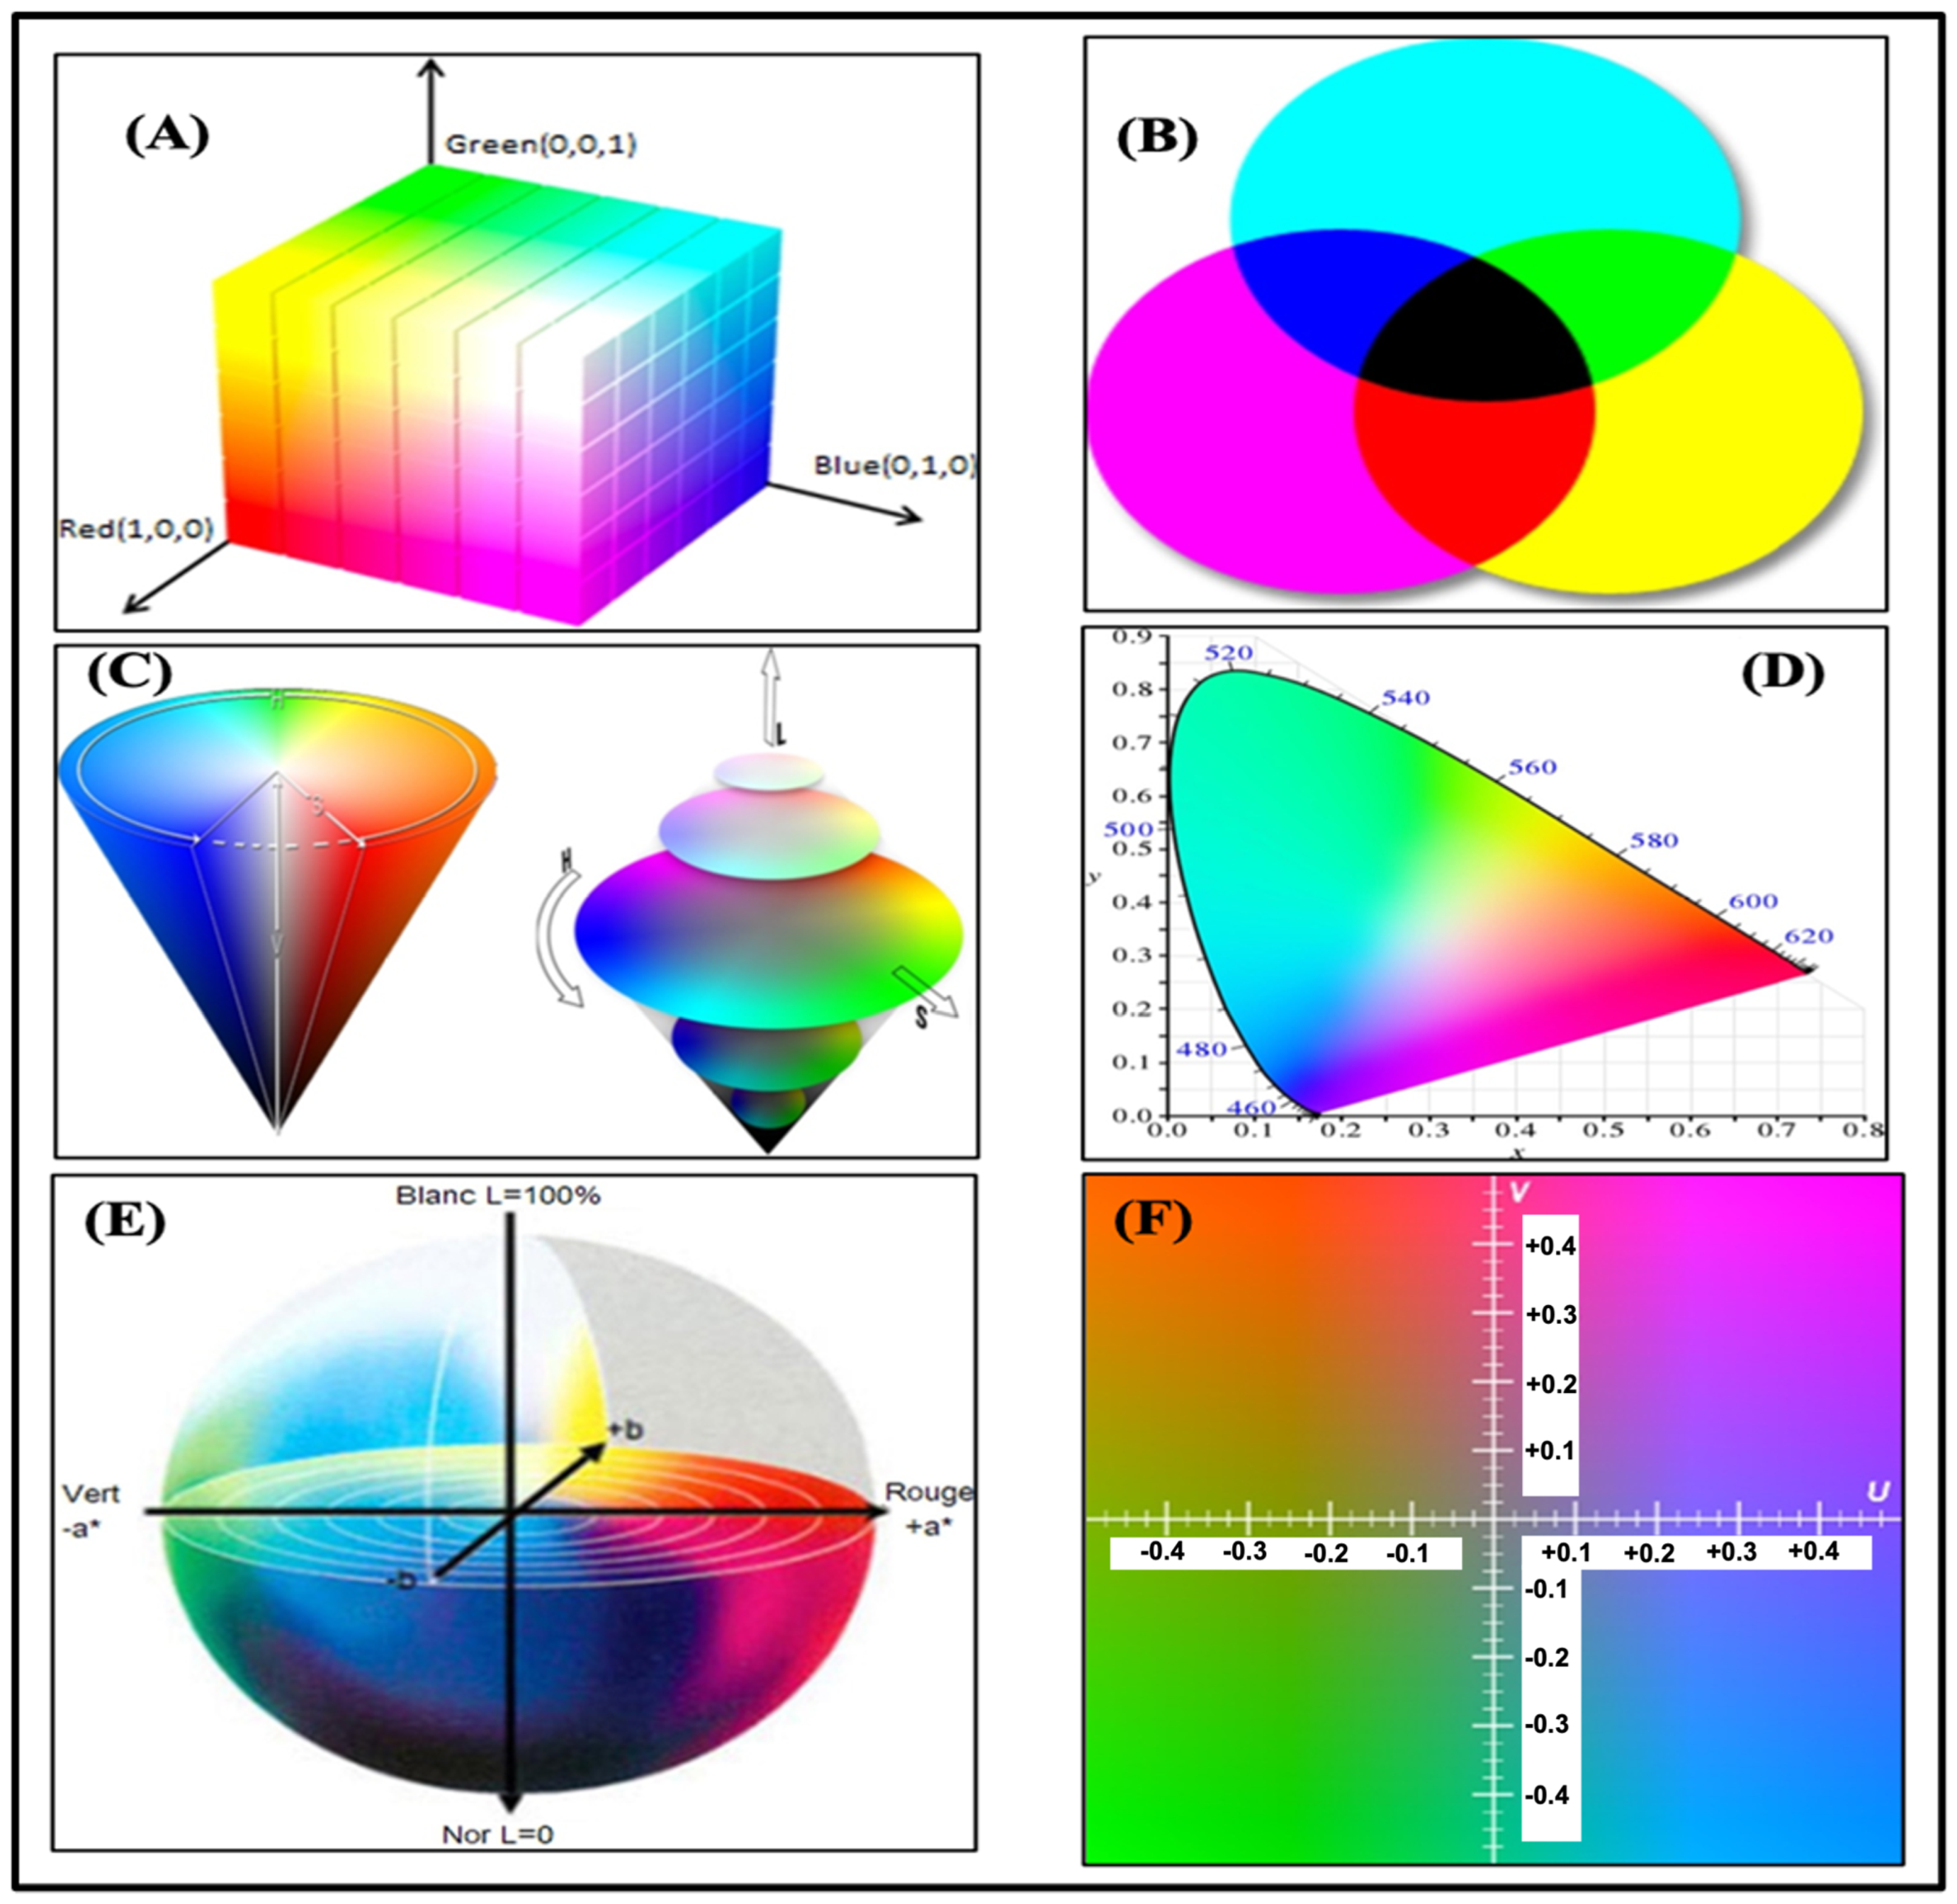
3.2. Color Spaces
3.3. Challenges of Microfluidic Extraction Systems
4. Biosensors for Uric Acid Detection
4.1. Optical Biosensing Techniques for Uric Acid on μPADs
4.2. Design and Fabrication Process of Optical Uric Acid μPADs
4.3. Clinical Applications of Microfluidic Paper-Based Analytical Devices for Uric Acid Detection
4.4. Mobile Device Technology
4.5. Specialized Devices Used for Uric Acid Detection
4.6. Challenges in Uric Acid Monitoring from Other Analytes
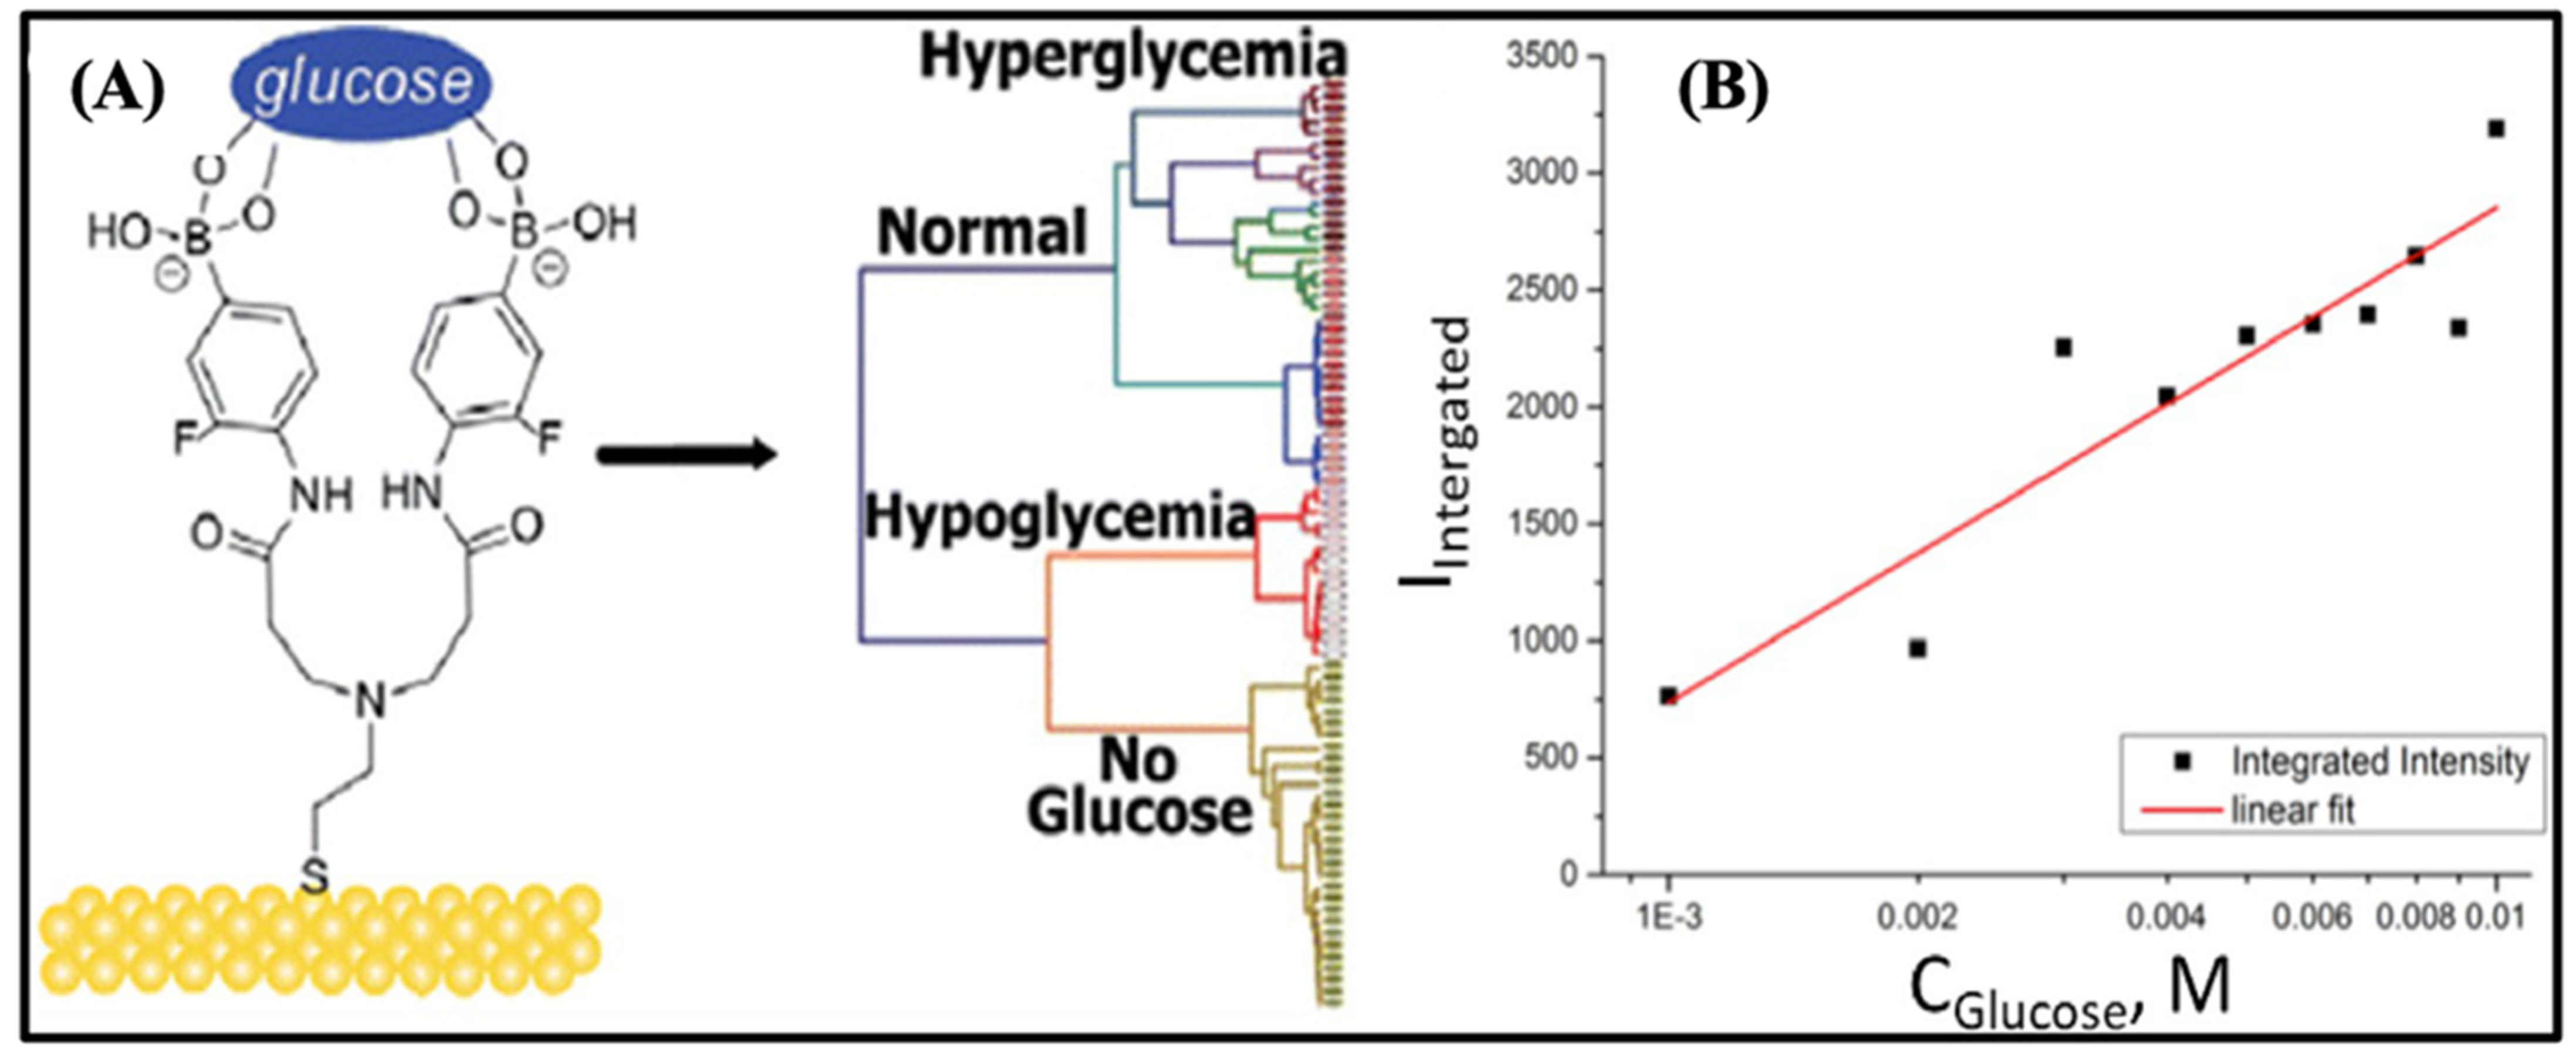
5. Biosensors for Blood Glucose Detection
5.1. Overview of Blood Glucose Monitoring and Its Significance
5.2. Optical Biosensing Methods for Glucose Detection on μPADs
| Analyte | Detection Method | Linear Range | LOD | Year | Ref. |
|---|---|---|---|---|---|
| Glucose | Optical | 1.0–150.0 μM | 0.31 | 2023 | [201] |
| Glucose | Optical | 20–500 μM | 4.1 μM | 2024 | [202] |
| Glucose | Optical | 0.5–50 μM | 0.2 μM | 2023 | [203] |
| Glucose | Optical | 0.2 mM to 30 mM | 0.06 | 2023 | [204] |
| Glucose and Hematocrit | Optical | 45–630 | 6.4 and 9.1 | 2024 | [205] |
| Glucose | Optical | 2–110 | 5 | 2024 | [206] |
| Glucose | Optical | 5.0 and 20.0 | 25 | 2024 | [207] |
5.3. Recent Progress in Portable Blood Glucose Monitoring Using μPADs
| Technology | Sensing Principle | Merit | Demerit | Reference |
|---|---|---|---|---|
| Affinity biosensors | The competitive binding between target molecules and fluorescent | Real-time detection, miniaturization and portability, enzyme free | Sensitivity to environmental conditions, potential for non-specific binding, limited reusability | [212] |
| Catalytic biosensor | Glucose enzymatic reaction affects the fluorescence intensity | Fast response time, reusable, high selectivity | Complex fabrication, enzyme instability, interference from other substances | [213] |
| Mid-infrared spectroscopy | Specific absorption of mid-infrared photons by glucose | High molecular specificity, non-destructive analysis, broad application range | Limited penetration depth, complex sample preparation, strong water absorption | [214] |
| Near-infrared spectroscopy | Specific absorption of near-infrared photons by glucose | Ability to penetrate biological tissues, rapid analysis with minimal sample preparation | Overlapping spectral bands, limited sensitivity and accuracy | [215] |
| Raman spectroscopy | Specific vibration modes produced by the interaction of photons with glucose | Noncontact detection, less overlapped spectra, strong anti-interference | Shallow penetration depth, long acquisition time, strong fluorescence background | [92] |
| Polarimetry | Optical rotation of polarized light for chiral molecule | Non-destructive analysis, wide range of applications, high sensitivity to molecular structure | Limited to optically active substances, susceptibility to external factors, specialized equipment and interpretation required | [216] |
| Infectious Disease Biomarkers | Biomarker | Transduction Mechanism | Platform | Sensor Characteristics | Pros | Cons | References |
|---|---|---|---|---|---|---|---|
| Blood glucose monitoring | Urea | Colorimetric | Smartphone | LOD: 0.19 mg/mL, LDR: 0.1–0.7 mg/mL | Minimal sample preprocessing, affordable optical phase, sensitive detection (PSD) system | Interfering substances may produce false results | [218] |
| Glucose Ketone | Colorimetric | 3D-printed portable photometer | LOD: 50 mg/dL and 5 mg/dL for glucose and ketone, respectively LDR: 10–1400 mg/dL and 5–160 mg/dL for glucose and ketone, respectively | Digital, frugal, portable testing device, non-invasive detection method, cost-effective | Detection of color change is negligible in low concentrations, some individuals may have ethical or legal objections to urine testing | [219] | |
| Glucose | Surface plasmon resonance | Optical fiber device | LOD: 3.10 mg/dL Linear range: 0–400 mg/dL | Professional operation skills are not required for operation, reusable samples can be directly loaded | Inefficient coupling of light reduces the accuracy and sensitivity, obtaining high signal-to- noise ratio is challenging | [220] | |
| Glucose cholesterol | Fluorescence | Paper strip | LOD:10 μmol L−1 for both dual-emission ratiometric fluorescent probe | Low cast, ease of operation, broad adaptability | Smartphone-based results are not reliable | [221] | |
| Glucose | Fluorescence | Paper strip | LOD: 2.1 μM | Excellent biocompatibility and recyclability | Vulnerable to interference and auto- fluorescence, difficulty in achieving quantitative detection | [222] | |
| Glucose | Colorimetric | Paper strip | Response time: 15 s LOD: 32 mg/dL Linear range: 32–516 mg/dL | Glucose monitoring via non-invasive saliva analysis, biodegradable, inexpensive test strip, fast response time | Enzymes require specific conditions to function properly, not reusable | [223] | |
| Glucose H2O2 | Colorimetric | Paper | LOD: 10 μM for glucose and 2.5 μM for H2O2 | Simple fabrication, high sensitivity, dual state (solution state and solid state) detection | Environmental factors (temp, pH, ionic strength) affect the accuracy and reproducibility of measurements | [224] |
5.4. Continuous Monitoring of Glucose in Different Body Fluids
5.5. Trends of Optical Biosensors in Medical Diagnosis
6. Challenges and Limitations
Future Horizons
7. Conclusions
Author Contributions
Funding
Data Availability Statement
Conflicts of Interest
Abbreviations
| 4-AAP and DHBS | Chromogenic Reagents |
| Ag TNPs | Silver Triangular Nanoprisms |
| AKD | Alkyl Ketene Dimer |
| CE | Capillary Electrophoresis |
| CE | Counter Electrode |
| CNC | Computer Numerical Controlled |
| CNs | Carbon Nanotubes |
| CO2 | Carbon dioxide |
| COC | Cyclic Olefin Copolymer |
| DNA | Deoxyribonucleic acid |
| DPV | Differential Pulse Voltammetry |
| EIS | Electrochemical Impedance Spectroscopy |
| FEP | Fluorinated ethylene propylene |
| FI | Fluorescein |
| FLASH | Fast Lithographic Activation Sheets |
| FRET | Förster Resonans Energy Transfer |
| GC | Glassy Carbon |
| GC5A | Guanidinocalix [5] arene |
| GNPs | Gold Nanoparticles |
| GNRs | Gold Nanorods |
| GSH | Glutathione |
| H2O | Water |
| H2O2 | Hydrogen Peroxide |
| HAuCl4 | Chloroauric acid |
| HPLC-UV | High-Performance Liquid Chromatography–Ultraviolet |
| HPLC | High Performance Liquid Chromatography |
| HPRT | Hypoxanthine–Guanine Phosphoribosyl Transferase |
| HRP | Horseradish Peroxidase |
| ICP-MS | Inductively Coupled Plasma Mass Spectrometry |
| IDA | Indicator Displacement Assay |
| LLE | Liquid–Liquid Extraction |
| LPME | Liquid-Phase Microextraction |
| LSPR | Localized Surface Plasmon Resonance |
| mHealth | Mobile Healthcare |
| MIP | Molecularly Imprinted Polymer |
| MPBs | mesoporous Prussian blue nanoparticles |
| MS | Mass Spectrometry |
| MWCNT | Multi-Walled Carbon Nanotubes |
| nFCD | Non-Fluorescent Carbon Dots |
| NMs | Nanomaterials |
| NPs | Nanoparticles |
| NRs | Nanorods |
| NWs | Nanowires |
| O2 | Oxygen |
| p-CMF | paper-based continuous microfluidic flow |
| PB | Prussian Blue |
| PBS | Phosphate Buffer Solution |
| PDMS | Polydimethylsiloxane |
| PFA | Perfluoroalkyl |
| PGMs | Personal Glucose Meters |
| PMMA | Poly methyl methacrylate |
| POCT | Point of Care Testing |
| PSA | Prostate-Specific Antigen |
| PZT | Piezoelectric Actuator |
| QDs | Quantum Dots |
| RE | Reference Electrode |
| RGB | Red, Green, Blue |
| SERS | Surface-Enhanced Raman Spectroscopy |
| SPE | Solid-Phase Extraction |
| SPI | Super-Amphiphilic |
| SPI | Surface Plasmon Imaging |
| SPO | Super-Amphiphobic |
| SPR | Surface Plasmon Resonance |
| SWV | Square Wave Voltammetry |
| TMB | Tetra-Methyl-Benzidine |
| UA | Uric Acid |
| WE | Working Electrode |
| XDH | Xanthine Dehydrogenase |
| μPADs | Microfluidic Paper-Based Analytical Devices |
References
- Huang, X.; Xu, D.; Chen, J.; Liu, J.; Li, Y.; Song, J.; Ma, X.; Guo, J. Smartphone-based analytical biosensors. Analyst 2018, 143, 5339–5351. [Google Scholar] [PubMed]
- Du, L.; Zong, Y.; Li, H.; Wang, Q.; Xie, L.; Yang, B.; Pang, Y.; Zhang, C.; Zhong, Z.; Gao, J. Hyperuricemia and its related diseases: Mechanisms and advances in therapy. Signal Transduct. Target. Ther. 2024, 9, 212. [Google Scholar]
- Xiong, Q.; Liu, J.; Xu, Y. Effects of uric acid on diabetes mellitus and its chronic complications. Int. J. Endocrinol. 2019, 2019, 9691345. [Google Scholar] [PubMed]
- Bodaghi, A.; Fattahi, N.; Ramazani, A. Biomarkers: Promising and valuable tools towards diagnosis, prognosis and treatment of Covid-19 and other diseases. Heliyon 2023, 9, e13323. [Google Scholar]
- Lino, C.; Barrias, S.; Chaves, R.; Adega, F.; Martins-Lopes, P.; Fernandes, J.R. Biosensors as diagnostic tools in clinical applications. Biochim. Biophys. Acta Rev. Cancer 2022, 1877, 188726. [Google Scholar]
- Skov, J.; Kristiansen, K.; Jespersen, J.; Olesen, P. Status and perspectives of biomarker validation for diagnosis, stratification, and treatment. Public Health 2021, 190, 173–175. [Google Scholar] [PubMed]
- Wang, C.; Liu, M.; Wang, Z.; Li, S.; Deng, Y.; He, N. Point-of-care diagnostics for infectious diseases: From methods to devices. Nano Today 2021, 37, 101092. [Google Scholar]
- Yu, Y.; Jain, B.; Anand, G.; Heidarian, M.; Lowe, A.; Kalra, A. Technologies for non-invasive physiological sensing: Status, challenges, and future horizons. Biosens. Bioelectron. X 2024, 16, 100420. [Google Scholar]
- Khan, A.R.; Hussain, W.L.; Shum, H.C.; Hassan, S.U. Point-of-care testing: A critical analysis of the market and future trends. Front. Lab A Chip Technol. 2024, 3, 1394752. [Google Scholar]
- Zarean Mousaabadi, K.; Talebi Vandishi, Z.; Kermani, M.; Arab, N.; Ensafi, A.A. Recent developments toward microfluidic point-of-care diagnostic sensors for viral infections. TrAC Trends Anal. Chem. 2023, 169, 117361. [Google Scholar]
- Kumar, S.; Nehra, M.; Khurana, S.; Dilbaghi, N.; Kumar, V.; Kaushik, A.; Kim, K.H. Aspects of Point-of-Care Diagnostics for Personalized Health Wellness. Int. J. Nanomed. 2021, 16, 383–402. [Google Scholar]
- Friend, S.H.; Ginsburg, G.S.; Picard, R.W. Wearable Digital Health Technology. N. Engl. J. Med. 2023, 389, 2100–2101. [Google Scholar] [PubMed]
- Huang, D.; Xu, C.; Jiang, C.; Chen, Q.; Xu, Z.; Fang, X. Advances and challenges of signal readout systems in CRISPR-based biosensors for point-of-care testing of nucleic acid. TrAC Trends Anal. Chem. 2024, 178, 117856. [Google Scholar]
- Kulkarni, M.B.; Ayachit, N.H.; Aminabhavi, T.M. Biosensors and Microfluidic Biosensors: From Fabrication to Application. Biosensors 2022, 12, 543. [Google Scholar] [CrossRef]
- Fu, L.-M.; Wang, Y.-N. Detection methods and applications of microfluidic paper-based analytical devices. TrAC Trends Anal. Chem. 2018, 107, 196–211. [Google Scholar]
- Abdollahi-Aghdam, A.; Majidi, M.R.; Omidi, Y. Microfluidic paper-based analytical devices (microPADs) for fast and ultrasensitive sensing of biomarkers and monitoring of diseases. Bioimpacts 2018, 8, 237–240. [Google Scholar]
- Brazaca, L.C.; Imamura, A.H.; Blasques, R.V.; Camargo, J.R.; Janegitz, B.C.; Carrilho, E. The use of biological fluids in microfluidic paper-based analytical devices (muPADs): Recent advances, challenges and future perspectives. Biosens. Bioelectron. 2024, 246, 115846. [Google Scholar]
- Nishat, S.; Jafry, A.T.; Martinez, A.W.; Awan, F.R. Paper-based microfluidics: Simplified fabrication and assay methods. Sens. Actuators B Chem. 2021, 336, 129681. [Google Scholar]
- Kumari, S.; Islam, M.; Gupta, A. Paper-based multiplex biosensors for inexpensive healthcare diagnostics: A comprehensive review. Biomed. Microdevices 2023, 25, 17. [Google Scholar] [CrossRef]
- Skoczynska, M.; Chowaniec, M.; Szymczak, A.; Langner-Hetmanczuk, A.; Maciazek-Chyra, B.; Wiland, P. Pathophysiology of hyperuricemia and its clinical significance—A narrative review. Reumatologia 2020, 58, 312–323. [Google Scholar]
- Jarnda, K.V.; Wang, D.; Qurrat Ul, A.; Anaman, R.; Johnson, V.E.; Roberts, G.P.; Johnson, P.S.; Jallawide, B.W.; Kai, T.; Ding, P. Recent advances in electrochemical non-enzymatic glucose sensor for the detection of glucose in tears and saliva: A Review. Sens. Actuators A Phys. 2023, 363, 114778. [Google Scholar] [CrossRef]
- Chen, C.; Wang, J. Optical biosensors: An exhaustive and comprehensive review. Analyst 2020, 145, 1605–1628. [Google Scholar] [CrossRef] [PubMed]
- Singh, A.K.; Mittal, S.; Das, M.; Saharia, A.; Tiwari, M. Optical biosensors: A decade in review. Alex. Eng. J. 2023, 67, 673–691. [Google Scholar] [CrossRef]
- Capelli, D.; Scognamiglio, V.; Montanari, R. Surface plasmon resonance technology: Recent advances, applications and experimental cases. TrAC Trends Anal. Chem. 2023, 163, 117079. [Google Scholar] [CrossRef]
- Amjad, A.; Xian, X. Optical sensors for transdermal biomarker detection: A review. Biosens. Bioelectron. 2025, 267, 116844. [Google Scholar] [CrossRef]
- Kumar, S.; Singh, R. Recent optical sensing technologies for the detection of various biomolecules: Review. Opt. Laser Technol. 2021, 134, 106620. [Google Scholar] [CrossRef]
- Chen, Y.T.; Lee, Y.C.; Lai, Y.H.; Lim, J.C.; Huang, N.T.; Lin, C.T.; Huang, J.J. Review of Integrated Optical Biosensors for Point-Of-Care Applications. Biosensors 2020, 10, 209. [Google Scholar] [CrossRef] [PubMed]
- Chang, C.C.; Chen, C.P.; Wu, T.H.; Yang, C.H.; Lin, C.W.; Chen, C.Y. Gold Nanoparticle-Based Colorimetric Strategies for Chemical and Biological Sensing Applications. Nanomaterials 2019, 9, 861. [Google Scholar] [CrossRef]
- Azeredo, N.F.B.; Goncalves, J.M.; Rossini, P.O.; Araki, K.; Wang, J.; Angnes, L. Uric acid electrochemical sensing in biofluids based on Ni/Zn hydroxide nanocatalyst. Mikrochim. Acta 2020, 187, 379. [Google Scholar]
- Kimura, Y.; Tsukui, D.; Kono, H. Uric Acid in Inflammation and the Pathogenesis of Atherosclerosis. Int. J. Mol. Sci. 2021, 22, 12394. [Google Scholar] [CrossRef]
- Grossman, C.; Grossman, E.; Goldbourt, U. Uric acid variability at midlife as an independent predictor of coronary heart disease and all-cause mortality. PLoS ONE 2019, 14, e0220532. [Google Scholar]
- Li, Q.; Qiu, Y.; Han, W.; Zheng, Y.; Wang, X.; Xiao, D.; Mao, M.; Li, Q. Determination of uric acid in biological samples by high performance liquid chromatography-electrospray ionization-tandem mass spectrometry and study on pathogenesis of pulmonary arterial hypertension in pulmonary artery endothelium cells. RSC Adv. 2018, 8, 25808–25814. [Google Scholar]
- Wijemanne, N.; Soysa, P.; Wijesundara, S.; Perera, H. Development and Validation of a Simple High Performance Liquid Chromatography/UV Method for Simultaneous Determination of Urinary Uric Acid, Hypoxanthine, and Creatinine in Human Urine. Int. J. Anal. Chem. 2018, 2018, 1647923. [Google Scholar] [CrossRef]
- Lin, T.J.; Yen, K.T.; Chen, C.F.; Yan, S.T.; Su, K.W.; Chiang, Y.L. Label-Free Uric Acid Estimation of Spot Urine Using Portable Device Based on UV Spectrophotometry. Sensors 2022, 22, 3009. [Google Scholar] [CrossRef] [PubMed]
- Yaacob, A.; Ngajikin, N.H.; Rashid, N.C.A.; Yaacob, M.; Ali, S.H.A.; Azmi, N.E.; Cholan, N.A. Linearity range enhancement in direct detection of low concentration uric acid. Optik 2022, 249, 168243. [Google Scholar]
- Sagar, R.C.; Abbas, A.; Ajjan, R. Glucose monitoring in diabetes: From clinical studies to real-world practice. Pract. Diabetes 2019, 36, 57–62. [Google Scholar]
- Cheng, A.Y.Y.; Feig, D.S.; Ho, J.; Siemens, R.; Bajaj, H.; Gilbert, J.; Houlden, R.; Kim, J.; Mackay, D.; Rabi, D.M.; et al. Blood Glucose Monitoring in Adults and Children with Diabetes: Update 2021. Can. J. Diabetes 2021, 45, 580–587. [Google Scholar]
- Antar, S.A.; Ashour, N.A.; Sharaky, M.; Khattab, M.; Ashour, N.A.; Zaid, R.T.; Roh, E.J.; Elkamhawy, A.; Al-Karmalawy, A.A. Diabetes mellitus: Classification, mediators, and complications; A gate to identify potential targets for the development of new effective treatments. Biomed. Pharmacother. 2023, 168, 115734. [Google Scholar]
- Reddy, M.; Oliver, N. The role of real-time continuous glucose monitoring in diabetes management and how it should link to integrated personalized diabetes management. Diabetes Obes. Metab. 2024, 26 (Suppl. S1), 46–56. [Google Scholar]
- Nadia Ahmad, N.F.; Nik Ghazali, N.N.; Wong, Y.H. Wearable patch delivery system for artificial pancreas health diagnostic-therapeutic application: A review. Biosens. Bioelectron. 2021, 189, 113384. [Google Scholar]
- Manjakkal, L.; Yin, L.; Nathan, A.; Wang, J.; Dahiya, R. Energy Autonomous Sweat-Based Wearable Systems. Adv. Mater. 2021, 33, e2100899. [Google Scholar] [CrossRef]
- Meng, K.; Xiao, X.; Wei, W.; Chen, G.; Nashalian, A.; Shen, S.; Xiao, X.; Chen, J. Wearable Pressure Sensors for Pulse Wave Monitoring. Adv. Mater. 2022, 34, e2109357. [Google Scholar] [CrossRef] [PubMed]
- Meng, K.; Xiao, X.; Liu, Z.; Shen, S.; Tat, T.; Wang, Z.; Lu, C.; Ding, W.; He, X.; Yang, J.; et al. Kirigami-Inspired Pressure Sensors for Wearable Dynamic Cardiovascular Monitoring. Adv. Mater. 2022, 34, e2202478. [Google Scholar] [CrossRef]
- Wu, J.; Liu, H.; Chen, W.; Ma, B.; Ju, H. Device integration of electrochemical biosensors. Nat. Rev. Bioeng. 2023, 1, 346–360. [Google Scholar] [CrossRef] [PubMed]
- Allameh, S.; Rabbani, M. A Distance-Based Microfluidic Paper-Based Biosensor for Glucose Measurements in Tear Range. Appl. Biochem. Biotechnol. 2022, 194, 2077–2092. [Google Scholar] [CrossRef] [PubMed]
- Nishan, U.; Khan, N.; Muhammad, N.; Afridi, S.; Badshah, A.; Shah, M.; Asad, M.; Ullah, R.; Niamat, H.; Ullah, R.; et al. Colorimetric sensing of uric acid based on sawdust-deposited silver nanoparticles via an eco-friendly and cost-effective approach. Front. Mater. 2023, 10, 1298873. [Google Scholar] [CrossRef]
- Fortibui, M.M.; Yoon, S.A.; Yoo, S.Y.; Son, J.Y.; Lee, M.H. Advances in dual-sensing bioprobes for simultaneous monitoring ATP and various biological species. Coord. Chem. Rev. 2024, 510, 215800. [Google Scholar] [CrossRef]
- Sajid, M. Nanomaterials: Types, properties, recent advances, and toxicity concerns. Curr. Opin. Environ. Sci. Health 2022, 25, 100319. [Google Scholar] [CrossRef]
- Chunta, S.; Jarujamrus, P.; Prakobkij, A.; Khongwichit, S.; Ditcharoen, N.; Pencharee, S.; Amatatongchai, M. Point-of-care blood tests using a smartphone-based colorimetric analyzer for health check-up. Mikrochim. Acta 2024, 191, 402. [Google Scholar] [CrossRef]
- Sekhwama, M.; Mpofu, K.; Sivarasu, S.; Mthunzi-Kufa, P. Applications of microfluidics in biosensing. Discov. Appl. Sci. 2024, 6, 303. [Google Scholar] [CrossRef]
- Kapoor, A.; Ramamoorthy, S.; Sundaramurthy, A.; Vaishampayan, V.; Sridhar, A.; Balasubramanian, S.; Ponnuchamy, M. Paper-based lab-on-a-chip devices for detection of agri-food contamination. Trends Food Sci. Technol. 2024, 147, 104476. [Google Scholar] [CrossRef]
- Alahmad, W.; Cetinkaya, A.; Kaya, S.I.; Ozkan, S.A. Innovative and cutting-edge approaches in microfluidic paper-based analytical devices for detection of food adulteration. TrAC Trends Anal. Chem. 2024, 181, 118012. [Google Scholar]
- Wu, X.; You, C. The biomarkers discovery of hyperuricemia and gout: Proteomics and metabolomics. PeerJ 2023, 11, e14554. [Google Scholar] [CrossRef]
- Rypar, T.; Bezdekova, J.; Pavelicova, K.; Vodova, M.; Adam, V.; Vaculovicova, M.; Macka, M. Low-tech vs. high-tech approaches in muPADs as a result of contrasting needs and capabilities of developed and developing countries focusing on diagnostics and point-of-care testing. Talanta 2024, 266, 124911. [Google Scholar] [PubMed]
- Sagar Shrikrishna, N.; Sharma, R.; Sahoo, J.; Kaushik, A.; Gandhi, S. Navigating the landscape of optical biosensors. Chem. Eng. J. 2024, 490, 151661. [Google Scholar]
- Sharma, M.; Mahajan, P.; Alsubaie, A.S.; Khanna, V.; Chahal, S.; Thakur, A.; Yadav, A.; Arya, A.; Singh, A.; Singh, G. Next-generation nanomaterials-based biosensors: Real-time biosensing devices for detecting emerging environmental pollutants. Mater. Today Sustain. 2025, 29, 101068. [Google Scholar]
- Pohanka, M. Overview of Piezoelectric Biosensors, Immunosensors and DNA Sensors and Their Applications. Materials 2018, 11, 448. [Google Scholar] [CrossRef] [PubMed]
- Ramesh, M.; Janani, R.; Deepa, C.; Rajeshkumar, L. Nanotechnology-Enabled Biosensors: A Review of Fundamentals, Design Principles, Materials, and Applications. Biosensors 2022, 13, 40. [Google Scholar] [CrossRef]
- Chadha, U.; Bhardwaj, P.; Agarwal, R.; Rawat, P.; Agarwal, R.; Gupta, I.; Panjwani, M.; Singh, S.; Ahuja, C.; Selvaraj, S.K.; et al. Recent progress and growth in biosensors technology: A critical review. J. Ind. Eng. Chem. 2022, 109, 21–51. [Google Scholar]
- Malik, S.; Singh, J.; Goyat, R.; Saharan, Y.; Chaudhry, V.; Umar, A.; Ibrahim, A.A.; Akbar, S.; Ameen, S.; Baskoutas, S. Nanomaterials-based biosensor and their applications: A review. Heliyon 2023, 9, e19929. [Google Scholar]
- Sharma, A.; Majdinasab, M.; Khan, R.; Li, Z.; Hayat, A.; Marty, J.L. Nanomaterials in fluorescence-based biosensors: Defining key roles. Nano-Struct. Nano-Objects 2021, 27, 100774. [Google Scholar] [CrossRef]
- Naresh, V.; Lee, N. A Review on Biosensors and Recent Development of Nanostructured Materials-Enabled Biosensors. Sensors 2021, 21, 1109. [Google Scholar] [CrossRef] [PubMed]
- Falk, M.; Psotta, C.; Cirovic, S.; Shleev, S. Non-Invasive Electrochemical Biosensors Operating in Human Physiological Fluids. Sensors 2020, 20, 6352. [Google Scholar] [CrossRef] [PubMed]
- Li, P.; Lee, G.H.; Kim, S.Y.; Kwon, S.Y.; Kim, H.R.; Park, S. From Diagnosis to Treatment: Recent Advances in Patient-Friendly Biosensors and Implantable Devices. ACS Nano 2021, 15, 1960–2004. [Google Scholar] [CrossRef]
- Jirakunakorn, R.; Khumngern, S.; Choosang, J.; Thavarungkul, P.; Kanatharana, P.; Numnuam, A. Uric acid enzyme biosensor based on a screen-printed electrode coated with Prussian blue and modified with chitosan-graphene composite cryogel. Microchem. J. 2020, 154, 104624. [Google Scholar] [CrossRef]
- Roy, L.; Buragohain, P.; Borse, V. Strategies for sensitivity enhancement of point-of-care devices. Biosens. Bioelectron. X 2022, 10, 100098. [Google Scholar] [CrossRef]
- Zhang, L.; Guo, W.; Lv, C.; Liu, X.; Yang, M.; Guo, M.; Fu, Q. Electrochemical biosensors represent promising detection tools in medical field. Adv. Sens. Energy Mater. 2023, 2, 100081. [Google Scholar] [CrossRef]
- Hernandez-Vargas, G.; Sosa-Hernandez, J.E.; Saldarriaga-Hernandez, S.; Villalba-Rodriguez, A.M.; Parra-Saldivar, R.; Iqbal, H.M.N. Electrochemical Biosensors: A Solution to Pollution Detection with Reference to Environmental Contaminants. Biosensors 2018, 8, 29. [Google Scholar] [CrossRef]
- Herrmann, A.; Haag, R.; Schedler, U. Hydrogels and Their Role in Biosensing Applications. Adv. Healthc. Mater. 2021, 10, 2100062. [Google Scholar] [CrossRef]
- Jebasingh, B.; Sneha, A.R.; Thushara, K.M.; Ephrin, S.; Anna Benedict, B. Nanostructured Materials–Enabled Biosensors for Drug Delivery and Medical Diagnosis. In Nanovaccinology: Clinical Application of Nanostructured Materials Research to Translational Medicine; Pal, K., Ed.; Springer: Berlin/Heidelberg, Germany, 2023. [Google Scholar]
- Kaushal, A.; Kaur, N.; Sharma, S.; Sharma, A.K.; Kala, D.; Prakash, H.; Gupta, S. Current Update on Biomarkers for Detection of Cancer: Comprehensive Analysis. Vaccines 2022, 10, 2138. [Google Scholar] [CrossRef]
- Didier, C.M.; Orrico, J.F.; Cepeda Torres, O.S.; Castro, J.M.; Baksh, A.; Rajaraman, S. Microfabricated polymer-metal biosensors for multifarious data collection from electrogenic cellular models. Microsyst. Nanoeng. 2023, 9, 22. [Google Scholar] [PubMed]
- Yan, Q.; Zhi, N.; Yang, L.; Xu, G.; Feng, Q.; Zhang, Q.; Sun, S. A highly sensitive uric acid electrochemical biosensor based on a nano-cube cuprous oxide/ferrocene/uricase modified glassy carbon electrode. Sci. Rep. 2020, 10, 10607. [Google Scholar]
- Pullano, S.A.; Greco, M.; Bianco, M.G.; Foti, D.; Brunetti, A.; Fiorillo, A.S. Glucose biosensors in clinical practice: Principles, limits and perspectives of currently used devices. Theranostics 2022, 12, 493–511. [Google Scholar] [PubMed]
- Mostufa, S.; Rezaei, B.; Ciannella, S.; Yari, P.; Gómez-Pastora, J.; He, R.; Wu, K. Advancements and Perspectives in Optical Biosensors. ACS Omega 2024, 9, 24181–24202. [Google Scholar] [CrossRef]
- Camarca, A.; Varriale, A.; Capo, A.; Pennacchio, A.; Calabrese, A.; Giannattasio, C.; Murillo Almuzara, C.; D’Auria, S.; Staiano, M. Emergent Biosensing Technologies Based on Fluorescence Spectroscopy and Surface Plasmon Resonance. Sensors 2021, 21, 906. [Google Scholar] [CrossRef] [PubMed]
- Elbasiony, A.M.; Alharthi, S.; Ghobashy, M.M.; Boraie, W.E.; Attia, M.S.; Madani, M.; Al-Gahtany, S.A.; Darwesh, R.; Shaban, M.; Sharshir, A.I. Development and application of novel biosensors for enhanced detection in medical diagnostics. Microchem. J. 2024, 207, 111938. [Google Scholar] [CrossRef]
- Liao, Z.; Zhang, Y.; Li, Y.; Miao, Y.; Gao, S.; Lin, F.; Deng, Y.; Geng, L. Microfluidic chip coupled with optical biosensors for simultaneous detection of multiple analytes: A review. Biosens. Bioelectron. 2019, 126, 697–706. [Google Scholar] [CrossRef]
- Mostufa, S.; Rezaei, B.; Yari, P.; Xu, K.; Gomez-Pastora, J.; Sun, J.; Shi, Z.; Wu, K. Giant Magnetoresistance Based Biosensors for Cancer Screening and Detection. ACS Appl. Bio Mater. 2023, 6, 4042–4059. [Google Scholar]
- Jiao, L.; Zhong, N.; Zhao, X.; Ma, S.; Fu, X.; Dong, D. Recent advances in fiber-optic evanescent wave sensors for monitoring organic and inorganic pollutants in water. TrAC Trends Anal. Chem. 2020, 127, 115892. [Google Scholar]
- Thomas, N.; Singh, V.; Kuss, S. Optical fibers in analytical electrochemistry: Recent developments in probe design and applications. TrAC Trends Anal. Chem. 2021, 136, 116196. [Google Scholar] [CrossRef]
- Akgönüllü, S.; Denizli, A. Piezoelectric biosensors for virus detection. In Biosensors for Virus Detection; IOP Publishing: Bristol, UK, 2021. [Google Scholar]
- Zhang, H. Molecularly Imprinted Nanoparticles for Biomedical Applications. Adv. Mater. 2020, 32, e1806328. [Google Scholar]
- Nanda, B.P.; Rani, P.; Paul, P.; Aman; Subrahmanya, S.G.; Bhatia, R. Recent Trends and Impact of Localized Surface Plasmon Resonance (LSPR) and Surface-Enhanced Raman Spectroscopy (SERS) in Modern Analysis. J. Pharm. Anal. 2024, 14, 100959. [Google Scholar] [PubMed]
- Kaushik, S.; Tiwari, U.K.; Deep, A.; Sinha, R.K. Two-dimensional transition metal dichalcogenides assisted biofunctionalized optical fiber SPR biosensor for efficient and rapid detection of bovine serum albumin. Sci. Rep. 2019, 9, 6987. [Google Scholar] [CrossRef] [PubMed]
- Wei, T.; Ren, P.; Huang, L.; Ouyang, Z.; Wang, Z.; Kong, X.; Li, T.; Yin, Y.; Wu, Y.; He, Q. Simultaneous detection of aflatoxin B1, ochratoxin A, zearalenone and deoxynivalenol in corn and wheat using surface plasmon resonance. Food Chem. 2019, 300, 125176. [Google Scholar]
- Kim, H.M.; Jeong, D.H.; Lee, H.Y.; Park, J.H.; Lee, S.K. Design and validation of fiber optic localized surface plasmon resonance sensor for thyroglobulin immunoassay with high sensitivity and rapid detection. Sci. Rep. 2021, 11, 15985. [Google Scholar]
- Konoplev, G.; Agafonova, D.; Bakhchova, L.; Mukhin, N.; Kurachkina, M.; Schmidt, M.P.; Verlov, N.; Sidorov, A.; Oseev, A.; Stepanova, O.; et al. Label-Free Physical Techniques and Methodologies for Proteins Detection in Microfluidic Biosensor Structures. Biomedicines 2022, 10, 207. [Google Scholar] [CrossRef] [PubMed]
- Liu, Y.; Zhang, X. Microfluidics-Based Plasmonic Biosensing System Based on Patterned Plasmonic Nanostructure Arrays. Micromachines 2021, 12, 826. [Google Scholar] [CrossRef]
- Ambartsumyan, O.; Gribanyov, D.; Kukushkin, V.; Kopylov, A.; Zavyalova, E. SERS-Based Biosensors for Virus Determination with Oligonucleotides as Recognition Elements. Int. J. Mol. Sci. 2020, 21, 3373. [Google Scholar] [CrossRef]
- Chen, D. Biomarkers navigate drug development: Pharmacology, effectiveness and safety. Med. Drug Discov. 2024, 21, 100174. [Google Scholar]
- Sun, X. Glucose detection through surface-enhanced Raman spectroscopy: A review. Anal. Chim. Acta 2022, 1206, 339226. [Google Scholar]
- Zhang, M.; Xu, D.; Fang, J.; Li, H.; Li, Y.; Liu, C.; Cao, N.; Hu, N. A dynamic and quantitative biosensing assessment for electroporated membrane evolution of cardiomyocytes. Biosens. Bioelectron. 2022, 202, 114016. [Google Scholar] [CrossRef]
- Cheng, L.; Guo, R.; Zheng, W.; He, K.; Geng, Y.; Liu, L.; Ai, Q.; He, Y.; Zhang, Y.N.; Zhao, Y. ZnO-Nafion assisted optical fiber dual-SPR biosensor for simultaneous detection of urea and uric acid concentrations. Biosens. Bioelectron. 2025, 271, 117076. [Google Scholar] [CrossRef] [PubMed]
- Ma, C.; Jiang, N.; Sun, X.; Kong, L.; Liang, T.; Wei, X.; Wang, P. Progress in optical sensors-based uric acid detection. Biosens. Bioelectron. 2023, 237, 115495. [Google Scholar] [CrossRef] [PubMed]
- Kazanskiy, N.L.; Khonina, S.N.; Butt, M.A. A review on flexible wearables—Recent developments in non-invasive continuous health monitoring. Sens. Actuators A Phys. 2024, 366, 100174. [Google Scholar] [CrossRef]
- Rasheed, S.; Kanwal, T.; Ahmad, N.; Fatima, B.; Najam-ul-Haq, M.; Hussain, D. Advances and challenges in portable optical biosensors for onsite detection and point-of-care diagnostics. TrAC Trends Anal. Chem. 2024, 173, 117640. [Google Scholar] [CrossRef]
- Zub, K.; Hoeppener, S.; Schubert, U.S. Inkjet Printing and 3D Printing Strategies for Biosensing, Analytical, and Diagnostic Applications. Adv. Mater. 2022, 34, e2105015. [Google Scholar] [CrossRef]
- Hemmateenejad, B.; Rafatmah, E.; Shojaeifard, Z. Microfluidic paper and thread-based separations: Chromatography and electrophoresis. J. Chromatogr. A 2023, 1704, 464117. [Google Scholar] [CrossRef]
- Almeida, M.; Jayawardane, B.M.; Kolev, S.D.; McKelvie, I.D. Developments of microfluidic paper-based analytical devices (muPADs) for water analysis: A review. Talanta 2018, 177, 176–190. [Google Scholar] [CrossRef]
- Kulkarni, M.B.; Goel, S. Recent advancements in integrated microthermofluidic systems for biochemical and biomedical applications—A review. Sens. Actuators A Phys. 2022, 341, 113590. [Google Scholar] [CrossRef]
- Zhou, J.W.; Zheng, X.B.; Liu, H.S.; Wen, B.Y.; Kou, Y.C.; Zhang, L.; Song, J.J.; Zhang, Y.J.; Li, J.F. Reliable quantitative detection of uric acid in urine by surface-enhanced Raman spectroscopy with endogenous internal standard. Biosens. Bioelectron. 2024, 251, 116101. [Google Scholar] [CrossRef]
- Wen, S.; Arakawa, H.; Tamai, I. Uric acid in health and disease: From physiological functions to pathogenic mechanisms. Pharmacol. Ther. 2024, 256, 108615. [Google Scholar] [PubMed]
- Musile, G.; Grazioli, C.; Fornasaro, S.; Dossi, N.; De Palo, E.F.; Tagliaro, F.; Bortolotti, F. Application of Paper-Based Microfluidic Analytical Devices (microPAD) in Forensic and Clinical Toxicology: A Review. Biosensors 2023, 13, 743. [Google Scholar] [CrossRef] [PubMed]
- Pattanayak, P.; Singh, S.K.; Gulati, M.; Vishwas, S.; Kapoor, B.; Chellappan, D.K.; Anand, K.; Gupta, G.; Jha, N.K.; Gupta, P.K.; et al. Microfluidic chips: Recent advances, critical strategies in design, applications and future perspectives. Microfluid. Nanofluid. 2021, 25, 99. [Google Scholar] [CrossRef]
- Baek, S.H.; Park, C.; Jeon, J.; Park, S. Three-Dimensional Paper-Based Microfluidic Analysis Device for Simultaneous Detection of Multiple Biomarkers with a Smartphone. Biosensors 2020, 10, 187. [Google Scholar] [CrossRef]
- Trinh, K.T.L.; Chae, W.R.; Lee, N.Y. Recent advances in the fabrication strategies of paper-based microfluidic devices for rapid detection of bacteria and viruses. Microchem. J. 2022, 180, 107548. [Google Scholar]
- Alidoust, M.; Baharfar, M.; Manouchehri, M.; Yamini, Y.; Tajik, M.; Seidi, S. Emergence of microfluidic devices in sample extraction; an overview of diverse methodologies, principals, and recent advancements. TrAC Trends Anal. Chem. 2021, 143, 116352. [Google Scholar]
- Gupta, D.; Boora, A.; Thakur, A.; Gupta, T.K. Green and sustainable synthesis of nanomaterials: Recent advancements and limitations. Environ. Res. 2023, 231, 116316. [Google Scholar]
- Nilimaa, J. Smart materials and technologies for sustainable concrete construction. Dev. Built Environ. 2023, 15, 100177. [Google Scholar]
- Li, X.; Wan, C.; Tao, T.; Chai, H.; Huang, Q.; Chai, Y.; Wu, Y. An overview of the development status and applications of cellulose-based functional materials. Cellulose 2023, 31, 61–99. [Google Scholar] [CrossRef]
- Ahmad, F.; Salem-Bekhit, M.M.; Khan, F.; Alshehri, S.; Khan, A.; Ghoneim, M.M.; Wu, H.F.; Taha, E.I.; Elbagory, I. Unique Properties of Surface-Functionalized Nanoparticles for Bio-Application: Functionalization Mechanisms and Importance in Application. Nanomaterials 2022, 12, 1333. [Google Scholar] [CrossRef]
- Meena, J.; Gupta, A.; Ahuja, R.; Singh, M.; Panda, A.K. Recent advances in nano-engineered approaches used for enzyme immobilization with enhanced activity. J. Mol. Liq. 2021, 338, 116602. [Google Scholar]
- Chandnani, K.; Rajput, N.; Jadav, T.; Pillai, M.; Dhakne, P.; Tekade, R.K.; Sengupta, P. Technological advancement and current standing of microfluidic chip based devices for targeted analysis of biomarkers. Microchem. J. 2023, 195, 109532. [Google Scholar]
- Kulkarni, M.B.; Ayachit, N.H.; Aminabhavi, T.M.; Pogue, B.W. Recent advances in microfluidics-based paper analytical devices (µPADs) for biochemical sensors: From fabrication to detection techniques. Biochem. Eng. J. 2023, 198, 109027. [Google Scholar]
- Li, D.; Ming, P.; Niu, S.; Yang, G.; Cheng, K. Fabricating Precise and Smooth Microgroove Structures on Zr-Based Metallic Glass Using Jet-ECM. Micromachines 2024, 15, 497. [Google Scholar] [CrossRef] [PubMed]
- Kong, T.F.; Ang, A.W.J.; Marcos. Characterization of Shrink Film Properties for Rapid Microfluidics Lab-on-Chip Fabrication. Micromachines 2024, 15, 308. [Google Scholar] [CrossRef]
- Sadeghi, I.; Lu, X.; Sarmadi, M.; Langer, R.; Jaklenec, A. Micromolding of Thermoplastic Polymers for Direct Fabrication of Discrete, Multilayered Microparticles. Small Methods 2022, 6, e2200232. [Google Scholar]
- Jahanbakhsh, A.; Wlodarczyk, K.L.; Hand, D.P.; Maier, R.R.J.; Maroto-Valer, M.M. Review of Microfluidic Devices and Imaging Techniques for Fluid Flow Study in Porous Geomaterials. Sensors 2020, 20, 4030. [Google Scholar] [CrossRef]
- Juang, Y.J.; Hsu, S.K. Fabrication of Paper-Based Microfluidics by Spray on Printed Paper. Polymers 2022, 14, 639. [Google Scholar] [CrossRef]
- Alarifi, I.M. A comprehensive review on advancements of elastomers for engineering applications. Adv. Ind. Eng. Polym. Res. 2023, 6, 451–464. [Google Scholar]
- Park, J.; Lee, K.-T.; Yeon, G.; Choi, J.; Kim, M.; Han, B.; Baac, H.W.; Guo, L.J.; Ok, J.G. Demonstration of the one-step continuous fabrication of flexible polymer ridge waveguides via nanochannel-guided lithography. J. Ind. Eng. Chem. 2021, 95, 286–291. [Google Scholar]
- Scott, S.M.; Ali, Z. Fabrication Methods for Microfluidic Devices: An Overview. Micromachines 2021, 12, 319. [Google Scholar] [CrossRef]
- Akbari, Z.; Raoufi, M.A.; Mirjalali, S.; Aghajanloo, B. A review on inertial microfluidic fabrication methods. Biomicrofluidics 2023, 17, 051504. [Google Scholar]
- Poskus, M.D.; Wang, T.; Deng, Y.; Borcherding, S.; Atkinson, J.; Zervantonakis, I.K. Fabrication of 3D-printed molds for polydimethylsiloxane-based microfluidic devices using a liquid crystal display-based vat photopolymerization process: Printing quality, drug response and 3D invasion cell culture assays. Microsyst. Nanoeng. 2023, 9, 140. [Google Scholar]
- Pashayev, S.; Lhermerout, R.; Roblin, C.; Alibert, E.; Barbat, J.; Desgarceaux, R.; Jelinek, R.; Chauveau, E.; Tahir, S.; Jourdain, V.; et al. Quantifying the performances of SU-8 microfluidic devices: High liquid water tightness, long-term stability, and vacuum compatibility. Microfluid. Nanofluidics 2024, 28, 25. [Google Scholar]
- Giri, K.; Tsao, C.W. Recent Advances in Thermoplastic Microfluidic Bonding. Micromachines 2022, 13, 486. [Google Scholar] [CrossRef]
- Han, T.; Jin, Y.; Geng, C.; Aziz, A.u.R.; Zhang, Y.; Deng, S.; Ren, H.; Liu, B. Microfluidic Paper-based Analytical Devices in Clinical Applications. Chromatographia 2020, 83, 693–701. [Google Scholar]
- Zhang, T.; Ding, F.; Yang, Y.; Zhao, G.; Zhang, C.; Wang, R.; Huang, X. Research Progress and Future Trends of Microfluidic Paper-Based Analytical Devices in In-Vitro Diagnosis. Biosensors 2022, 12, 485. [Google Scholar] [CrossRef]
- Anushka; Bandopadhyay, A.; Das, P.K. Paper based microfluidic devices: A review of fabrication techniques and applications. Eur. Phys. J. Spec. Top. 2023, 232, 781–815. [Google Scholar]
- Ortiz-Gomez, I.; Rivadeneyra, A.; Salmeron, J.F.; Orbe-Paya, I.; Morales, D.P.; Capitan-Vallvey, L.F.; Salinas-Castillo, A. Near-Field Communication Tag for Colorimetric Glutathione Determination with a Paper-Based Microfluidic Device. Biosensors 2023, 13, 267. [Google Scholar] [CrossRef]
- Guan, Y.; Sun, B. Detection and extraction of heavy metal ions using paper-based analytical devices fabricated via atom stamp printing. Microsyst. Nanoeng. 2020, 6, 14. [Google Scholar]
- Pandya, D.J.; Muthu Pandian, P.; Kumar, I.; Parmar, A.; Sravanthi; Singh, N.; Abd Al-saheb, A.J.; Arun, V. Supercapacitors: Review of materials and fabrication methods. Mater. Today Proc. 2023; in press. [Google Scholar]
- Jang, J.-W.; Min, K.-E.; Kim, C.; Shin, J.; Lee, J.; Yi, S. Review: Scaffold Characteristics, Fabrication Methods, and Biomaterials for the Bone Tissue Engineering. Int. J. Precis. Eng. Manuf. 2023, 24, 511–529. [Google Scholar]
- Pena-Pereira, F.; Matesanz, O.; Lavilla, I.; Bendicho, C. A paper-based gas sensor for simultaneous noninstrumental colorimetric detection of nitrite and sulfide in waters. J. Sep. Sci. 2020, 43, 1908–1914. [Google Scholar]
- Cao, L.; Kiely, J.; Piano, M.; Luxton, R. Nanoparticle-based 3D membrane for impedimetric biosensor applications. Bioelectrochemistry 2020, 136, 107593. [Google Scholar]
- Cagnani, G.R.; Ibanez-Redin, G.; Tirich, B.; Goncalves, D.; Balogh, D.T.; Oliveira, O.N., Jr. Fully-printed electrochemical sensors made with flexible screen-printed electrodes modified by roll-to-roll slot-die coating. Biosens. Bioelectron. 2020, 165, 112428. [Google Scholar]
- Chiang, C.K.; Kurniawan, A.; Kao, C.Y.; Wang, M.J. Single step and mask-free 3D wax printing of microfluidic paper-based analytical devices for glucose and nitrite assays. Talanta 2019, 194, 837–845. [Google Scholar] [PubMed]
- Akyazi, T.; Basabe-Desmonts, L.; Benito-Lopez, F. Review on microfluidic paper-based analytical devices towards commercialisation. Anal. Chim. Acta 2018, 1001, 1–17. [Google Scholar] [PubMed]
- Raoufi, M.A.; Razavi Bazaz, S.; Niazmand, H.; Rouhi, O.; Asadnia, M.; Razmjou, A.; Ebrahimi Warkiani, M. Fabrication of unconventional inertial microfluidic channels using wax 3D printing. Soft Matter 2020, 16, 2448–2459. [Google Scholar]
- Liu, C.; Wang, D.; Zhang, C. A novel paperfluidic closed bipolar electrode-electrochemiluminescence sensing platform: Potential for multiplex detection at crossing-channel closed bipolar electrodes. Sens. Actuators B Chem. 2018, 270, 341–352. [Google Scholar]
- Park, C.; Han, Y.D.; Kim, H.V.; Lee, J.; Yoon, H.C.; Park, S. Double-sided 3D printing on paper towards mass production of three-dimensional paper-based microfluidic analytical devices (3D-muPADs). Lab. Chip 2018, 18, 1533–1538. [Google Scholar]
- Ma, P.; Wang, S.; Wang, J.; Wang, Y.; Dong, Y.; Li, S.; Su, H.; Chen, P.; Feng, X.; Li, Y.; et al. Rapid Assembly of Cellulose Microfibers into Translucent and Flexible Microfluidic Paper-Based Analytical Devices via Wettability Patterning. Anal. Chem. 2022, 94, 13332–13341. [Google Scholar]
- Khairy, G.M.; Duerkop, A. Dipsticks and sensor microtiterplate for determination of copper (II) in drinking water using reflectometric RGB readout of digital images, fluorescence or eye-vision. Sens. Actuators B Chem. 2019, 281, 878–884. [Google Scholar]
- Kondekar, V.H.; Bodhe, S.K.A. Comprehensive Investigation of Color Models used in Image Processing. Int. J. Comput. Appl. 2018, 180, 19–24. [Google Scholar]
- Yedire, S.G.; Khan, H.; AbdelFatah, T.; Siavash Moakhar, R.; Mahshid, S. Microfluidic-based colorimetric nucleic acid detection of pathogens. Sens. Diagn. 2023, 2, 763–780. [Google Scholar]
- Liu, X.; Zhang, D.; Liu, J.; Wang, L.; Li, S. RGB Color Model Analysis for a Simple Structured Polydimethylsiloxane Pneumatic Micromixer. SLAS Technol. 2021, 26, 510–518. [Google Scholar]
- Potter, J.; Brisk, P.; Grover, W.H. Using printer ink color to control the behavior of paper microfluidics. Lab. Chip 2019, 19, 2000–2008. [Google Scholar]
- Fan, Y.; Li, J.; Guo, Y.; Xie, L.; Zhang, G. Digital image colorimetry on smartphone for chemical analysis: A review. Measurement 2021, 171, 108829. [Google Scholar]
- Fiedoruk-Pogrebniak, M. Mathematical processing of RGB data in microfluidic paper-based analytical devices. Sci. Rep. 2024, 14, 13635. [Google Scholar]
- Kannouma, R.E.; Hammad, M.A.; Kamal, A.H.; Mansour, F.R. Miniaturization of Liquid-Liquid extraction; the barriers and the enablers. Microchem. J. 2022, 182, 107863. [Google Scholar]
- He, Z.; Wu, H.; Yan, X.; Liu, W. Recent advances in droplet microfluidics for microbiology. Chin. Chem. Lett. 2022, 33, 1729–1742. [Google Scholar]
- Li, P.; Li, M.; Yue, D.; Chen, H. Solid-phase extraction methods for nucleic acid separation. A review. J. Sep. Sci. 2022, 45, 172–184. [Google Scholar]
- Hussain Khan, Z.; Maki Aldulaimi, A.; Varpaei, H.A.; Mohammadi, M. Various Aspects of Non-Invasive Ventilation in COVID-19 Patients: A Narrative Review. Iran. J. Med. Sci. 2022, 47, 194–209. [Google Scholar]
- Moulahoum, H.; Ghorbanizamani, F.; Beduk, T.; Beduk, D.; Ozufuklar, O.; Guler Celik, E.; Timur, S. Emerging trends in nanomaterial design for the development of point-of-care platforms and practical applications. J. Pharm. Biomed. Anal. 2023, 235, 115623. [Google Scholar]
- Jin, B.; Zhang, C.; Ma, C.; Yin, H.; Li, S.; Du, Z.; Zhao, G.; Huang, H.; Li, Z. Innovative strategies and approaches for enhancing performance in optical probe-based biosensors for point-of-care testing. TrAC Trends Anal. Chem. 2024, 176, 117775. [Google Scholar]
- Reali, S.; Najib, E.Y.; Treuerne Balazs, K.E.; Chern Hui Tan, A.; Varadi, L.; Hibbs, D.E.; Groundwater, P.W. Novel diagnostics for point-of-care bacterial detection and identification. RSC Adv. 2019, 9, 21486–21497. [Google Scholar]
- Saylan, Y.; Özgür, E.; Denizli, A. Recent advances of medical biosensors for clinical applications. Med. Devices Sens. 2020, 4, e10129. [Google Scholar]
- Pour, S.R.S.; Calabria, D.; Emamiamin, A.; Lazzarini, E.; Pace, A.; Guardigli, M.; Zangheri, M.; Mirasoli, M. Electrochemical vs. Optical Biosensors for Point-of-Care Applications: A Critical Review. Chemosensors 2023, 11, 546. [Google Scholar] [CrossRef]
- Lu, S.; Lin, S.; Zhang, H.; Liang, L.; Shen, S. Methods of Respiratory Virus Detection: Advances towards Point-of-Care for Early Intervention. Micromachines 2021, 12, 697. [Google Scholar] [CrossRef]
- Pashchenko, O.; Shelby, T.; Banerjee, T.; Santra, S. A Comparison of Optical, Electrochemical, Magnetic, and Colorimetric Point-of-Care Biosensors for Infectious Disease Diagnosis. ACS Infect. Dis. 2018, 4, 1162–1178. [Google Scholar]
- Chaturvedi, N.; Goncharov, A.; Tripathy, S.; San Juan, A.M.T.; Mabbott, S.B.; Ozcan, A.; Ligler, F.S.; Coté, G.L. Advances in point-of-care optical biosensing for underserved populations. TrAC Trends Anal. Chem. 2024, 175, 117731. [Google Scholar]
- Tang, L.; Chang, S.J.; Chen, C.J.; Liu, J.T. Non-Invasive Blood Glucose Monitoring Technology: A Review. Sensors 2020, 20, 6925. [Google Scholar] [CrossRef]
- Li, N.; Zhang, T.; Chen, G.; Xu, J.; Ouyang, G.; Zhu, F. Recent advances in sample preparation techniques for quantitative detection of pharmaceuticals in biological samples. TrAC Trends Anal. Chem. 2021, 142, 116318. [Google Scholar] [CrossRef]
- Zheng, W.; Wang, K.; Xu, H.; Zheng, C.; Cao, B.; Qin, Q.; Jin, Q.; Cui, D. Strategies for the detection of target analytes using microfluidic paper-based analytical devices. Anal. Bioanal. Chem. 2021, 413, 2429–2445. [Google Scholar] [CrossRef]
- Boobphahom, S.; Ly, M.N.; Soum, V.; Pyun, N.; Kwon, O.S.; Rodthongkum, N.; Shin, K. Recent Advances in Microfluidic Paper-Based Analytical Devices toward High-Throughput Screening. Molecules 2020, 25, 2970. [Google Scholar] [CrossRef] [PubMed]
- Zheng, J.; Zhu, M.; Kong, J.; Li, Z.; Jiang, J.; Xi, Y.; Li, F. Microfluidic paper-based analytical device by using Pt nanoparticles as highly active peroxidase mimic for simultaneous detection of glucose and uric acid with use of a smartphone. Talanta 2022, 237, 122954. [Google Scholar] [CrossRef] [PubMed]
- Chen, C.; Meng, H.; Guo, T.; Deshpande, S.; Chen, H. Development of Paper Microfluidics with 3D-Printed PDMS Barriers for Flow Control. ACS Appl. Mater. Interfaces 2022, 14, 40286–40296. [Google Scholar] [CrossRef]
- Fu, X.; Xia, B.; Ji, B.; Lei, S.; Zhou, Y. Flow controllable three-dimensional paper-based microfluidic analytical devices fabricated by 3D printing technology. Anal. Chim. Acta 2019, 1065, 64–70. [Google Scholar] [CrossRef]
- Waqar, A.; Othman, I.; Almujibah, H.R.; Sajjad, M.; Deifalla, A.; Shafiq, N.; Azab, M.; Qureshi, A.H. Overcoming implementation barriers in 3D printing for gaining positive influence considering PEST environment. Ain Shams Eng. J. 2024, 15, 102517. [Google Scholar] [CrossRef]
- Borok, A.; Laboda, K.; Bonyar, A. PDMS Bonding Technologies for Microfluidic Applications: A Review. Biosensors 2021, 11, 292. [Google Scholar] [CrossRef]
- Lamas-Ardisana, P.J.; Martinez-Paredes, G.; Anorga, L.; Grande, H.J. Glucose biosensor based on disposable electrochemical paper-based transducers fully fabricated by screen-printing. Biosens. Bioelectron. 2018, 109, 8–12. [Google Scholar] [CrossRef]
- Wu, K.; He, X.; Wang, J.; Pan, T.; He, R.; Kong, F.; Cao, Z.; Ju, F.; Huang, Z.; Nie, L. Recent progress of microfluidic chips in immunoassay. Front. Bioeng. Biotechnol. 2022, 10, 1112327. [Google Scholar] [CrossRef]
- Toda, H.; Iwasaki, W.; Morita, N.; Motomura, T.; Takemura, K.; Nagano, M.; Nakanishi, Y.; Nakashima, Y. Reversible Thermo-Responsive Valve for Microfluidic Paper-Based Analytical Devices. Micromachines 2022, 13, 690. [Google Scholar] [CrossRef] [PubMed]
- Heidari-Bafroui, H.; Kumar, A.; Hahn, C.; Scholz, N.; Charbaji, A.; Rahmani, N.; Anagnostopoulos, C.; Faghri, M. Development of a New Lab-on-Paper Microfluidics Platform Using Bi-Material Cantilever Actuators for ELISA on Paper. Biosensors 2023, 13, 310. [Google Scholar] [CrossRef] [PubMed]
- Jang, I.; Berg, K.E.; Henry, C.S. Viscosity measurements utilizing a fast-flow microfluidic paper-based device. Sens. Actuators B Chem. 2020, 319, 128240. [Google Scholar]
- Mikolei, J.J.; Helbrecht, C.; Pleitner, J.C.; Stanzel, M.; Pardehkhorram, R.; Biesalski, M.; Schabel, S.; Andrieu-Brunsen, A. Single-fibre coating and additive manufacturing of multifunctional papers. RSC Adv. 2024, 14, 14161–14169. [Google Scholar]
- Kulkarni, M.B.; Rajagopal, S.; Prieto-Simon, B.; Pogue, B.W. Recent advances in smart wearable sensors for continuous human health monitoring. Talanta 2024, 272, 125817. [Google Scholar] [CrossRef]
- Shibata, H.; Hiruta, Y.; Citterio, D. Fully inkjet-printed distance-based paper microfluidic devices for colorimetric calcium determination using ion-selective optodes. Analyst 2019, 144, 1178–1186. [Google Scholar] [PubMed]
- Devadhasan, J.P.; Kim, J. A chemically functionalized paper-based microfluidic platform for multiplex heavy metal detection. Sens. Actuators B Chem. 2018, 273, 18–24. [Google Scholar] [CrossRef]
- Hernandez Ruiz, K.; Wang, Z.; Ciprian, M.; Zhu, M.; Tu, R.; Zhang, L.; Luo, W.; Fan, Y.; Jiang, W. Chemical Vapor Deposition Mediated Phase Engineering for 2D Transition Metal Dichalcogenides: Strategies and Applications. Small Sci. 2021, 2, 2100047. [Google Scholar]
- Bahri, M.; Gebre, S.H.; Elaguech, M.A.; Dajan, F.T.; Sendeku, M.G.; Tlili, C.; Wang, D. Recent advances in chemical vapour deposition techniques for graphene-based nanoarchitectures: From synthesis to contemporary applications. Coord. Chem. Rev. 2023, 475, 214910. [Google Scholar]
- del Barrio, J.; Sánchez-Somolinos, C. Light to Shape the Future: From Photolithography to 4D Printing. Adv. Opt. Mater. 2019, 7, 1900598. [Google Scholar] [CrossRef]
- Fernandez-Ramos, M.D.; Bolanos-Banuelos, M.; Capitan-Vallvey, L.F. Point-of-care assay platform for uric acid, urea, and triglycerides with a microfluidic paper device (muPAD) controlled by stimulus-sensitive valves. Talanta 2023, 254, 124189. [Google Scholar] [PubMed]
- Li, W.; Ma, X.; Yong, Y.C.; Liu, G.; Yang, Z. Review of paper-based microfluidic analytical devices for in-field testing of pathogens. Anal. Chim. Acta 2023, 1278, 341614. [Google Scholar] [PubMed]
- Xie, C.; Li, X.; Yu, Q.; Wang, M.; Yang, B.; Ying, B.; Wu, P. Dual-FRET aptasensor for rapid screening of Ochratoxin A in food samples. Sens. Actuators B Chem. 2024, 408, 135515. [Google Scholar]
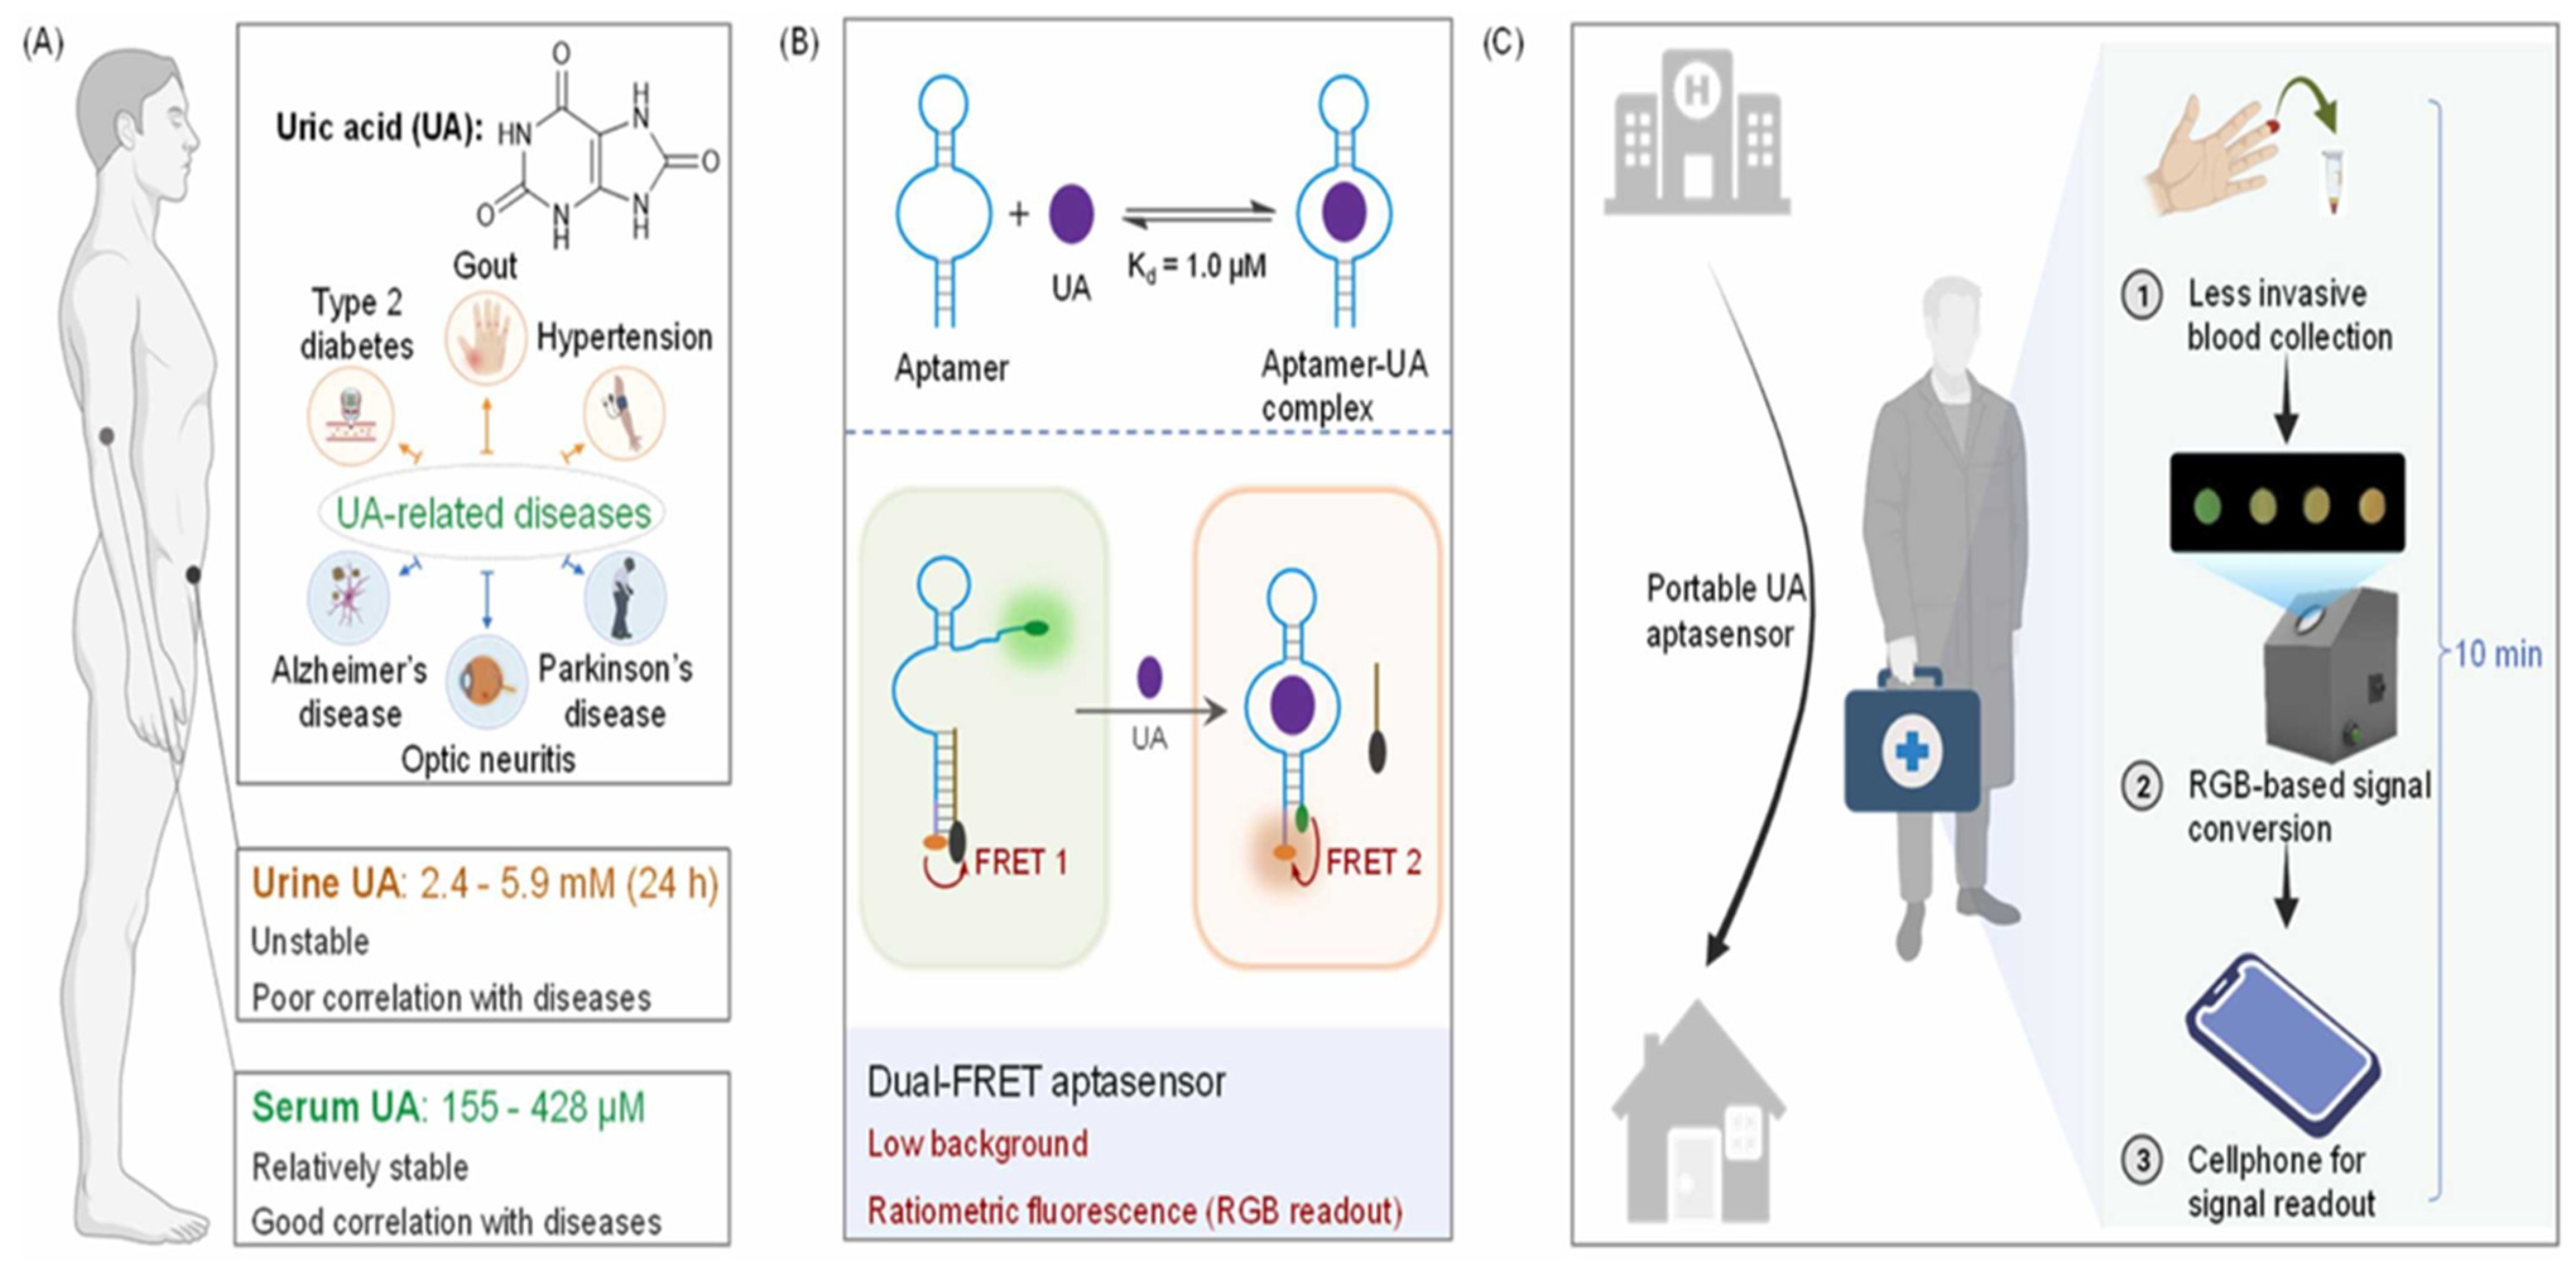
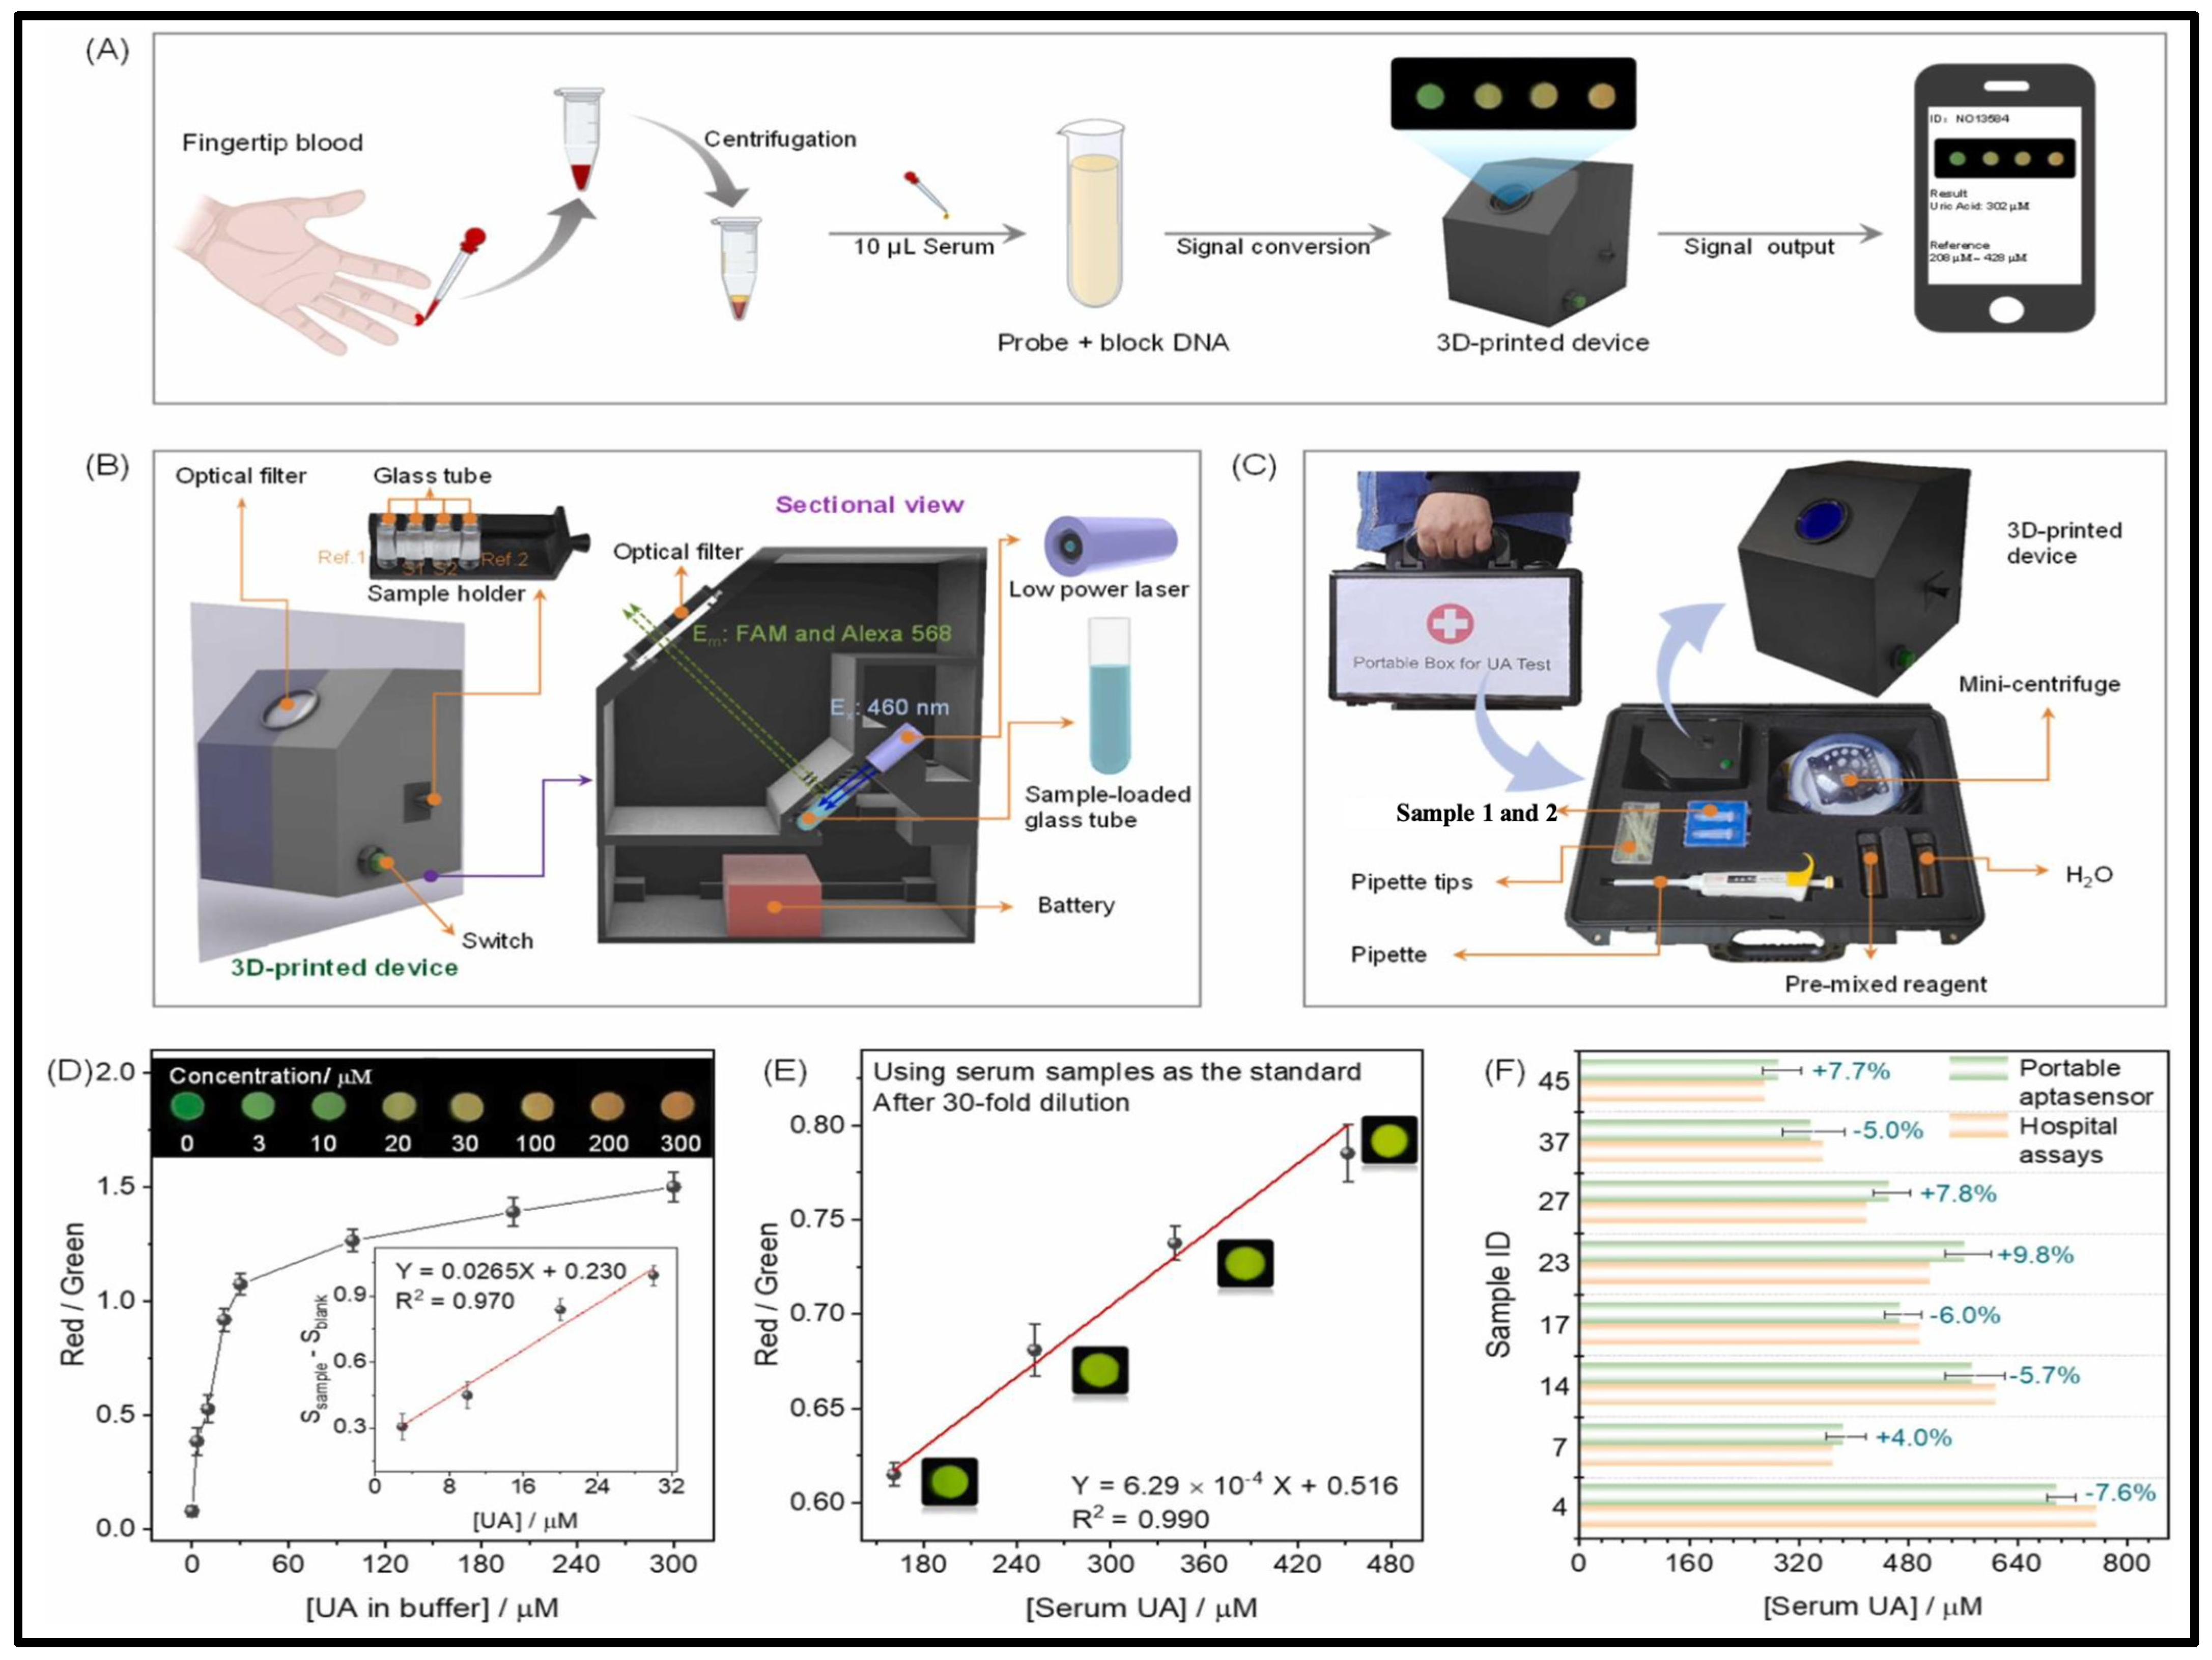
- Li, X.; Li, C.; Liu, Y.; Tang, H.; Zhao, Y.; Wu, P. A portable aptasensor for facile personalized monitoring of serum uric acid. Sens. Actuators B Chem. 2023, 394, 134351. [Google Scholar]
- Lan, Y.; He, B.; Tan, C.S.; Ming, D. Applications of Smartphone-Based Aptasensor for Diverse Targets Detection. Biosensors 2022, 12, 477. [Google Scholar] [CrossRef]
- Wang, Z.; Luan, J.; Seth, A.; Liu, L.; You, M.; Gupta, P.; Rathi, P.; Wang, Y.; Cao, S.; Jiang, Q.; et al. Microneedle patch for the ultrasensitive quantification of protein biomarkers in interstitial fluid. Nat. Biomed. Eng. 2021, 5, 64–76. [Google Scholar]
- Li, N.S.; Chen, Y.T.; Hsu, Y.P.; Pang, H.H.; Huang, C.Y.; Shiue, Y.L.; Wei, K.C.; Yang, H.W. Mobile healthcare system based on the combination of a lateral flow pad and smartphone for rapid detection of uric acid in whole blood. Biosens. Bioelectron. 2020, 164, 112309. [Google Scholar]
- Han, H.; Lee, J.S.; Kim, H.; Shin, S.; Lee, J.; Kim, J.; Hou, X.; Cho, S.W.; Seo, J.; Lee, T. Single-Droplet Multiplex Bioassay on a Robust and Stretchable Extreme Wetting Substrate through Vacuum-Based Droplet Manipulation. ACS Nano 2018, 12, 932–941. [Google Scholar]
- Wang, C.; Fu, Y.; Guo, J.; Guo, J. An automatic whole blood analyzer for renal function analysis with a centrifugal microfluidic device. Analyst 2022, 147, 4804–4814. [Google Scholar]
- Ma, C.; Kong, L.; Sun, X.; Zhang, Y.; Wang, X.; Wei, X.; Wan, H.; Wang, P. Enzyme-free and wide-range portable colorimetric sensing system for uric acid and hydrogen peroxide based on copper nanoparticles. Talanta 2023, 255, 124196. [Google Scholar]
- Jain, S.; Paliwal, A.; Gupta, V.; Tomar, M. Smartphone integrated handheld Long Range Surface Plasmon Resonance based fiber-optic biosensor with tunable SiO2 sensing matrix. Biosens. Bioelectron. 2022, 201, 113919. [Google Scholar]
- Fan, K.; Zeng, J.; Yang, C.; Wang, G.; Lian, K.; Zhou, X.; Deng, Y.; Liu, G. Digital Quantification Method for Sensitive Point-of-Care Detection of Salivary Uric Acid Using Smartphone-Assisted muPADs. ACS Sens. 2022, 7, 2049–2057. [Google Scholar] [PubMed]
- He, R.; Liu, H.; Fang, T.; Niu, Y.; Zhang, H.; Han, F.; Gao, B.; Li, F.; Xu, F. A Colorimetric Dermal Tattoo Biosensor Fabricated by Microneedle Patch for Multiplexed Detection of Health-Related Biomarkers. Adv. Sci. 2021, 8, e2103030. [Google Scholar]
- Ajjan, R.; Slattery, D.; Wright, E. Continuous Glucose Monitoring: A Brief Review for Primary Care Practitioners. Adv. Ther. 2019, 36, 579–596. [Google Scholar]
- Lima Chagas, G.C.; Teixeira, L.; Clemente, M.R.C.; Lima Chagas, R.C.; Santinelli Pestana, D.V.; Silva Sombra, L.R.; Lima, B.B.; Galindo, R.J.; Abreu, M. Use of continuous glucose monitoring and point-of-care glucose testing in hospitalized patients with diabetes mellitus in non-intensive care unit settings: A systematic review and meta-analysis of randomized controlled trials. Diabetes Res. Clin. Pract. 2025, 220, 111986. [Google Scholar]
- Kim, Y.; Gonzales, J.; Zheng, Y. Sensitivity-Enhancing Strategies in Optical Biosensing. Small 2021, 17, e2004988. [Google Scholar]
- Peng, Z.; Yang, Z. Optical blood glucose non-invasive detection and its research progress. Analyst 2024, 149, 4830–4841. [Google Scholar]
- Ayaz, S.; Uzer, A.; Dilgin, Y.; Apak, M.R. Fabrication of a Novel Optical Glucose Biosensor Using Copper(II) Neocuproine as a Chromogenic Oxidant and Glucose Dehydrogenase-Immobilized Magnetite Nanoparticles. ACS Omega 2023, 8, 47163–47172. [Google Scholar]
- Kumar, A.; Maiti, P. Paper-based sustainable biosensors. Mater. Adv. 2024, 5, 3563–3586. [Google Scholar]
- Braz, J.F.; Dencheva, N.V.; Tohidi, S.D.; Denchev, Z.Z. Fast, Multiple-Use Optical Biosensor for Point-of-Care Glucose Detection with Mobile Devices Based on Bienzyme Cascade Supported on Polyamide 6 Microparticles. Polymers 2023, 15, 2802. [Google Scholar] [CrossRef]
- Yi, X.; Yuan, Y.; Qing, M.; Wang, L.; Li, H.; Bai, L. Smartphone and paper-based device for glucose monitoring using acetylene black-hemin nanozyme as catalyst. Spectrochim. Acta A Mol. Biomol. Spectrosc. 2023, 296, 122667. [Google Scholar] [CrossRef]
- Cai, Z.X.; Jiang, M.Z.; Chuang, Y.J.; Kuo, J.N. Paper-Based Microfluidic Analytical Device Patterned by Label Printer for Point-of-Care Blood Glucose and Hematocrit Detection Using 3D-Printed Smartphone Cassette. Sensors 2024, 24, 4792. [Google Scholar] [CrossRef] [PubMed]
- Isgor, P.K.; Abbasiasl, T.; Das, R.; Istif, E.; Yener, U.C.; Beker, L. Paper integrated microfluidic contact lens for colorimetric glucose detection. Sens. Diagn. 2024, 3, 1743–1748. [Google Scholar] [CrossRef]
- Khachornsakkul, K.; Del-Rio-Ruiz, R.; Asci, C.; Sonkusale, S. NFC-enabled photothermal-based microfluidic paper analytical device for glucose detection. Analyst 2024, 149, 3756–3764. [Google Scholar] [CrossRef] [PubMed]
- Larijani, S.; Zarepour, A.; Khosravi, A.; Iravani, S.; Eskandari, M.; Zarrabi, A. Advancing paper-based sensors with MXenes and MOFs: Exploring cutting-edge innovations. J. Mater. Chem. A 2025, 13, 158–183. [Google Scholar] [CrossRef]
- Susu, L.; Vulpoi, A.; Astilean, S.; Focsan, M. Portable Plasmonic Paper-Based Biosensor for Simple and Rapid Indirect Detection of CEACAM5 Biomarker via Metal-Enhanced Fluorescence. Int. J. Mol. Sci. 2022, 23, 11982. [Google Scholar] [CrossRef] [PubMed]
- Jeon, H.J.; Kim, H.S.; Chung, E.; Lee, D.Y. Nanozyme-based colorimetric biosensor with a systemic quantification algorithm for noninvasive glucose monitoring. Theranostics 2022, 12, 6308–6338. [Google Scholar] [CrossRef]
- Lin, Q.; Huang, J.; Zhang, Y.; Chen, M.; Xu, Y.; Zou, X.; Liu, S.-Y.; Dai, Z. A smartphone-assisted “all-in-one” paper chip for one-pot noninvasive detection of salivary glucose level. Chem. Eng. J. 2023, 468, 143608. [Google Scholar] [CrossRef]
- Sabu, C.; Henna, T.K.; Raphey, V.R.; Nivitha, K.P.; Pramod, K. Advanced biosensors for glucose and insulin. Biosens. Bioelectron. 2019, 141, 111201. [Google Scholar] [CrossRef]
- Peng, Z.; Xie, X.; Tan, Q.; Kang, H.; Cui, J.; Zhang, X.; Li, W.; Feng, G. Blood glucose sensors and recent advances: A review. J. Innov. Opt. Health Sci. 2022, 15, 2230003. [Google Scholar] [CrossRef]
- Uluc, N.; Glasl, S.; Gasparin, F.; Yuan, T.; He, H.; Justel, D.; Pleitez, M.A.; Ntziachristos, V. Non-invasive measurements of blood glucose levels by time-gating mid-infrared optoacoustic signals. Nat. Metab. 2024, 6, 678–686. [Google Scholar]
- Hina, A.; Saadeh, W. Noninvasive Blood Glucose Monitoring Systems Using Near-Infrared Technology-A Review. Sensors 2022, 22, 4855. [Google Scholar] [CrossRef]
- Li, T.; Bai, D.; Prioleau, T.; Bui, N.; Vu, T.; Zhou, X. Noninvasive glucose monitoring using polarized light. In Proceedings of the 18th Conference on Embedded Networked Sensor Systems, Virtual, 16–19 November 2020; pp. 544–557. [Google Scholar]
- Arias, A.; Windham, P.E.; Cheyne, N.A.; Gilliland, W.M., Jr. Rapid fabrication of hydrophobic/hydrophilic patterns on paper substrates for paper spray mass spectrometry. Analyst 2023, 148, 5496–5506. [Google Scholar]
- Nandeshwar, R.; Mandal, P.; Tallur, S. Portable and Low-Cost Colorimetric Sensor for Detection of Urea in Milk Samples. IEEE Sens. J. 2023, 23, 16287–16292. [Google Scholar]
- Mitra, S.; Basak, M.; Biswas, S.; Gooh Pattader, P.S. Digital electronic based portable device for colorimetric quantification of ketones and glucose level in human urine. Measurement 2023, 214, 112848. [Google Scholar]
- Zhang, J.; Mai, X.; Hong, X.; Chen, Y.; Li, X. Optical fiber SPR biosensor with a solid-phase enzymatic reaction device for glucose detection. Sens. Actuators B Chem. 2022, 366, 131984. [Google Scholar] [CrossRef]
- Guo, L.; Chen, S.; Yu, Y.L.; Wang, J.H. A Smartphone Optical Device for Point-of-Care Testing of Glucose and Cholesterol Using Ag NPs/UiO-66-NH(2)-Based Ratiometric Fluorescent Probe. Anal. Chem. 2021, 93, 16240–16247. [Google Scholar]
- Tam, T.V.; Hur, S.H.; Chung, J.S.; Choi, W.M. Novel paper- and fiber optic-based fluorescent sensor for glucose detection using aniline-functionalized graphene quantum dots. Sens. Actuators B Chem. 2021, 329, 129250. [Google Scholar] [CrossRef]
- Panwar, S.; Sarkar, P.; Kasim, D.S.; Anand, R.; Priya, A.; Prakash, S.; Jha, S.K. Portable optical biosensor for point-of-care monitoring of salivary glucose using a paper-based microfluidic strip. Biosens. Bioelectron. X 2024, 17, 100452. [Google Scholar]
- Chang, J.; Li, H.; Hou, T.; Duan, W.; Li, F. Paper-based fluorescent sensor via aggregation induced emission fluorogen for facile and sensitive visual detection of hydrogen peroxide and glucose. Biosens. Bioelectron. 2018, 104, 152–157. [Google Scholar] [CrossRef]
- Brasier, N.; Wang, J.; Gao, W.; Sempionatto, J.R.; Dincer, C.; Ates, H.C.; Guder, F.; Olenik, S.; Schauwecker, I.; Schaffarczyk, D.; et al. Applied body-fluid analysis by wearable devices. Nature 2024, 636, 57–68. [Google Scholar] [PubMed]
- Jin, X.; Cai, A.; Xu, T.; Zhang, X. Artificial intelligence biosensors for continuous glucose monitoring. Interdiscip. Mater. 2023, 2, 290–307. [Google Scholar]
- Bordbar, M.M.; Hosseini, M.S.; Sheini, A.; Safaei, E.; Halabian, R.; Daryanavard, S.M.; Samadinia, H.; Bagheri, H. Monitoring saliva compositions for non-invasive detection of diabetes using a colorimetric-based multiple sensor. Sci. Rep. 2023, 13, 16174. [Google Scholar]
- Serag, A.; Shakkour, Z.; Halboup, A.M.; Kobeissy, F.; Farag, M.A. Sweat metabolome and proteome: Recent trends in analytical advances and potential biological functions. J. Proteom. 2021, 246, 104310. [Google Scholar]
- Kim, S.; Jeon, H.J.; Park, S.; Lee, D.Y.; Chung, E. Tear Glucose Measurement by Reflectance Spectrum of a Nanoparticle Embedded Contact Lens. Sci. Rep. 2020, 10, 8254. [Google Scholar]
- Bechir, F.; Pacurar, M.; Tohati, A.; Bataga, S.M. Comparative Study of Salivary pH, Buffer Capacity, and Flow in Patients with and without Gastroesophageal Reflux Disease. Int. J. Environ. Res. Public. Health 2021, 19, 201. [Google Scholar]
- Jakobek, L.; Strelec, I.; Kenjeric, D.; Soher, L.; Tomac, I.; Matic, P. Simulated Gastric and Intestinal Fluid Electrolyte Solutions as an Environment for the Adsorption of Apple Polyphenols onto beta-Glucan. Molecules 2022, 27, 6683. [Google Scholar] [PubMed]
- Abeje, A. Urine test strip analysis, concentration range and its interpretations of the parameters. GSC Biol. Pharm. Sci. 2023, 22, 1–13. [Google Scholar]
- Shaw, I.; Gregory, K. Acid-base balance: A review of normal physiology. BJA Educ. 2022, 22, 396–401. [Google Scholar]
- Parnetti, L.; Gaetani, L.; Eusebi, P.; Paciotti, S.; Hansson, O.; El-Agnaf, O.; Mollenhauer, B.; Blennow, K.; Calabresi, P. CSF and blood biomarkers for Parkinson’s disease. Lancet Neurol. 2019, 18, 573–586. [Google Scholar] [CrossRef]
- Gil Rosa, B.; Akingbade, O.E.; Guo, X.; Gonzalez-Macia, L.; Crone, M.A.; Cameron, L.P.; Freemont, P.; Choy, K.L.; Guder, F.; Yeatman, E.; et al. Multiplexed immunosensors for point-of-care diagnostic applications. Biosens. Bioelectron. 2022, 203, 114050. [Google Scholar]
- Byrnes, S.A.; Weigl, B.H. Selecting analytical biomarkers for diagnostic applications: A first principles approach. Expert. Rev. Mol. Diagn. 2018, 18, 19–26. [Google Scholar]
- Aryal, P.; Henry, C.S. Advancements and challenges in microfluidic paper-based analytical devices: Design, manufacturing, sustainability, and field applications. Front. Lab. A Chip Technol. 2024, 3, 1467423. [Google Scholar] [CrossRef]
- Nguyen, V.T.; Song, S.; Park, S.; Joo, C. Recent advances in high-sensitivity detection methods for paper-based lateral-flow assay. Biosens. Bioelectron. 2020, 152, 112015. [Google Scholar] [CrossRef] [PubMed]
- Kabir, M.F.; Ju, L.-K. On optimization of enzymatic processes: Temperature effects on activity and long-term deactivation kinetics. Process Biochem. 2023, 130, 734–746. [Google Scholar]
- Duan, X.; Liu, Q.; Wang, G.; Su, X. WS2 quantum dots as a sensitive fluorescence probe for the detection of glucose. J. Lumin. 2019, 207, 491–496. [Google Scholar]
- Zhou, B.; Fu, J.; Yuan, Y.; Han, F.; Huo, K.; Chu, P.K.; Zhang, X. Potential-dependent simultaneous detection of uric acid and glucose using dual-function Ni@CNT supported carbon fiber electrodes. Microchem. J. 2024, 205, 111244. [Google Scholar] [CrossRef]
- Gao, Q.; Li, S. Intelligent point of care testing for medicine diagnosis. Interdiscip. Med. 2024, 2, e20230031. [Google Scholar]
- Jia, Z.; Qiu, Q.; He, R.; Zhou, T.; Chen, L. Identification of Metabolite Interference Is Necessary for Accurate LC-MS Targeted Metabolomics Analysis. Anal. Chem. 2023, 95, 7985–7992. [Google Scholar] [CrossRef]
- Heijsters, F.; van Loon, G.A.P.; Santema, J.M.M.; Mullender, M.G.; Bouman, M.; de Bruijne, M.C.; van Nassau, F. A usability evaluation of the perceived user friendliness, accessibility, and inclusiveness of a personalized digital care pathway tool. Int. J. Med. Inform. 2023, 175, 105070. [Google Scholar]
- Zou, Y.; Clark, J.D.; May, A.A. A systematic investigation on the effects of temperature and relative humidity on the performance of eight low-cost particle sensors and devices. J. Aerosol Sci. 2021, 152, 105715. [Google Scholar] [CrossRef]
- Parsa Sadr, A.; Maraghechi, S.; Suiker, A.S.J.; Bosco, E. Chemo-mechanical ageing of paper: Effect of acidity, moisture and micro-structural features. Cellulose 2024, 31, 6923–6944. [Google Scholar]
- Gideon, O.; Samuel, H.S.; Okino, I.A. Biocompatible materials for next-generation biosensors. Discov. Chem. 2024, 1, 34. [Google Scholar]
- Kumi, M.; Ejeromedoghene, O.; Sudane, W.D.; Zhang, Z. Unlocking the biological response of smart Stimuli-Responsive hydrogels and their application in biological systems. Eur. Polym. J. 2024, 209, 112906. [Google Scholar]
- Madrid, R.E.; Ashur Ramallo, F.; Barraza, D.E.; Chaile, R.E. Smartphone-Based Biosensor Devices for Healthcare: Technologies, Trends, and Adoption by End-Users. Bioengineering 2022, 9, 101. [Google Scholar] [CrossRef]
- Klebes, A.; Ates, H.C.; Verboket, R.D.; Urban, G.A.; von Stetten, F.; Dincer, C.; Fruh, S.M. Emerging multianalyte biosensors for the simultaneous detection of protein and nucleic acid biomarkers. Biosens. Bioelectron. 2024, 244, 115800. [Google Scholar]
- Al-Emran, M.; Griffy-Brown, C. The role of technology adoption in sustainable development: Overview, opportunities, challenges, and future research agendas. Technol. Soc. 2023, 73, 102240. [Google Scholar]
- Xu, J.; Fang, Y.; Chen, J. Wearable Biosensors for Non-Invasive Sweat Diagnostics. Biosensors 2021, 11, 245. [Google Scholar] [CrossRef]
- Oyefolu, O.; Gronvall, G.K. Exploring challenges and policy considerations in point-of-care testing for hospital preparedness ahead of infectious disease emergencies: A qualitative study. Infect. Dis. Health 2024, in press. [Google Scholar]
- Taha, B.A.; Abdulrahm, Z.M.; Addie, A.J.; Haider, A.J.; Alkawaz, A.N.; Yaqoob, I.A.M.; Arsad, N. Advancing optical nanosensors with artificial intelligence: A powerful tool to identify disease-specific biomarkers in multi-omics profiling. Talanta 2025, 287, 127693. [Google Scholar]
- Zhou, Y.; Zhang, Y.-N.; Yu, Q.; Ren, L.; Liu, Q.; Zhao, Y. Application of machine learning in optical fiber sensors. Measurement 2024, 228, 114391. [Google Scholar]
- Yammouri, G.; Ait Lahcen, A. AI-Reinforced Wearable Sensors and Intelligent Point-of-Care Tests. J. Pers. Med. 2024, 14, 1088. [Google Scholar] [CrossRef] [PubMed]


| References | Analytes | Compatible Solvents | Fabrication Methods | Channel Dimension | Working Temperature (°C) |
|---|---|---|---|---|---|
| [116,117] | Polyimide | Most solvents | Photopolymerization; casting | <100 nm | <400 |
| [104] | Paper | No organic, surfactant solvents | Etching, printing | ~200 µM | <30–50 |
| [118] | Thermoplastics | Good solvent compatible | Thermomoulding | ~10 µM | High |
| [119] | Poly-methyl methacrylate (PMMA) | No alcohol, acetone, benzol | Thermomoulding, 3D printing | ~100 nm | <60–100 |
| [105] | Fluorinated ethylene propylene | Most solvents | Thermomoulding | ~100 nm | <200 |
| [120] | Hydrogel | No most solvents | Casting; photopolymerization | ~10 µm | <25–32 |
| [121] | Elastomer | Less solvent compatible | casting | <1 µm (3D) | Medium |
| [122] | Perfluoroalkyl (Teflon PFA) | Most solvents | Thermomoulding | ~100 nm | <125 |
| [123] | Silicon | Most solvents, no potassium hydroxide (KOH) | Etching | <100 nm | <1415 |
| [124] | Polycarbonate | No KOH, ketones, acetone | Thermomoulding | ~100 nm | <260 |
| [125] | Polydimethylsiloxane (PDMS) | No most organic solvents | Casting | ~20 nm | <40–50 |
| [126] | SU-8 photoresist | Most solvents | Casting; photopolymerization | ~100 nm | <150 |
| [127] | Thermoset | High solvent compatible | Casting, photopolymerization | ~100 nm | High |
| References | Disease | Biomarker | Technique | MOC | Matrix | LOD |
|---|---|---|---|---|---|---|
| [135] | Periodontitis | Nitrite | Optical | μPAD | Saliva | 10 μmol/L |
| [136] | Prognosis in chronic heart and kidney disease | Creative protein (CRP) | Optical | μPAD | Plasma and serum | 54 ng/mL |
| References | Color Space (Primary Parameters) | Color mixing | Merit | Demerits |
|---|---|---|---|---|
| [147] | Y (luminance), U (blue chroma), V (red chroma) I (rotated from U), Q (rotated from V) | Additive | Better separation of luminance and chrominance, alignment with human perception, convenient for image acquisition and display. | Non-uniform, illumination, color is not linear. |
| [148] | Cyan, magenta, yellow, and black | Subtractive | Precision in color mixing, better color, reproduction for printing, efficient use of ink. | Limited gamut, difficult to achieve bright color, complex color management. |
| [149] | L: Luminance a: red to green b: blue to yellow u: Saturation v: Hue angle | Additive | Perceptual uniformity, device-independent, better representation of human vision. | Not intuitive for users, limited gamut coverage, mathematical complexity. |
| [146] | Hue, saturation, value hue, saturation, intensity | Additive | Intuitive for artists and designers, better control over color adjustments, effective for color selection. | Not physically accurate, limited for complex color representation, no true perceptual uniformity. |
| [150] | Red, green, blue | Additive | Intuitive for displays, wide support in digital media, efficient for additive color mixing. | Not ideal for print, limited range for some colors, device dependency. |
| References | Challenges | Advantages | Disadvantages |
|---|---|---|---|
| [154] | Non-invasive | Minimizes patient discomfort and risk of infection. | May lack the ability to detect biomarkers at very low levels. |
| [155] | Rapid | Provides quick results, enabling timely decision-making. | Requires precise calibration to maintain accuracy. |
| [156] | Real-time analysis | Allows for continuous monitoring of patient conditions. | Susceptible to environmental interference |
| [157] | User-friendly | Easy to use for medical personnel with minimal training. | May require expensive equipment for certain applications. |
| [158] | Portability | Compact and suitable for use in diverse settings. | Limited battery life or power requirements can be a constraint. |
| [159] | Sensitivity | High sensitivity for specific biomarkers. | Cross-reactivity may result in false positives. |
| [160] | Specificity | Targeted detection reduces misdiagnosis. | Narrow detection range may overlook broader health indicators. |
| [161] | Cost-effectiveness | Reduces overall diagnostic costs in some cases. | Initial setup costs for devices may be high. |
| [162] | Scalability | Easily adaptable for mass screening in public health. | May not be suitable for all biomarkers or diseases. |
| [163] | Environmental impact | Reduces waste by eliminating invasive consumables. | Sensor components may involve complex recycling. |
| References | Technique of Fabrication | Materials | Channel (μM) | Barriers (μM) | Advantages | Disadvantages | Devices |
|---|---|---|---|---|---|---|---|
| [142,168,169,170] | 3D Printing | Conductive/non-conductive filament | 541 | 490 | Fast process; accessible to mass production. | Expensive, resolution depends on the type of printer | 3D printer with a custom-made extruder |
| [171] | Polydimethylsiloxane printing (PDMS) | PDMS | 285 | 1100 | Cheap, easily adaptable and transparent. | Low resolution, permeability | Desktop plotter |
| [172] | Punching | Wax/polystyrene/conductive ink; screen stencil | 210 | 850 | Flexibility; ease of application. | Durability, environmental impact | Hot plate or oven (for heating), Commercial ink |
| [173] | Screen printing | Polystyrene; wax | 129 | 321 | Affordability, versatility. | Output quality, durability | Customized masks kit |
| [174,175] | Spraying | Mask, back supporting plate, hydrophobic coating material | 532 | 900 | Uniform coating, reduced waste. | Process complexity, quality consistency | Hand-held spray tool with customized masks |
| [176,177] | Wax printing | Wax | 561 | 467 ± 33 | Rapid prototyping, high resolution; suitable for mass production. | Low tenacity by use of wax, temperature sensitivity | Wax printer; hot plate |
| [178] | Casting | Metal substrate | 245 | 56 | Cost effective; design flexibility. | Dimensional accuracy, material limitations | Casting tools and equipment |
| [179] | Inkjet printing | Alkyl ketene dimer UV-curable acrylate | 190 | 810 | Low cost; energy efficiency. | Resolution limitations, quality control | Inkjet printer (conductive/non- conductive ink) |
| [180,181,182] | Chemical vapor deposition | Novel materials and hydrophobic chemicals, chlorosilane | 624 | 125 | High purity films, conformal coating. | Slow deposition rate, surface contamination | Vacuum chamber, heat block, hot plate |
| [183] | Photolithography | Photoresist and developer, photomask | 186 | 248 | High resolution, scalability. | Costly, complex fabrication procedure | Photomask, UV light source (sunlight, UV lamp) |
| Body Fluids | pH | Viscosity | Glucose Concentration Range | References |
|---|---|---|---|---|
| Sweat | 4.5–7 | 0.92 | 0.02–0.6 μM | [228] |
| Tear | 6.5–7.6 | 1.5–3 | 0.1–0.6 μM | [229] |
| Saliva | 6.2–7.6 | 2–8 | 0.03–0.08 μM | [230] |
| Interstitial fluid | 7.2–7.4 | 1–10 | 2–22.2 μM | [231] |
| Urine | 4.5–8 | 0.6–1.2 | 0–0.8 μM | [232] |
| Blood | 7.35–7.45 | 1.52–1.54 | 2–30 μM | [233] |
Disclaimer/Publisher’s Note: The statements, opinions and data contained in all publications are solely those of the individual author(s) and contributor(s) and not of MDPI and/or the editor(s). MDPI and/or the editor(s) disclaim responsibility for any injury to people or property resulting from any ideas, methods, instructions or products referred to in the content. |
© 2025 by the authors. Licensee MDPI, Basel, Switzerland. This article is an open access article distributed under the terms and conditions of the Creative Commons Attribution (CC BY) license (https://creativecommons.org/licenses/by/4.0/).
Share and Cite
Jarnda, K.V.; Dai, H.; Ali, A.; Bestman, P.L.; Trafialek, J.; Roberts-Jarnda, G.P.; Anaman, R.; Kamara, M.G.; Wu, P.; Ding, P. A Review on Optical Biosensors for Monitoring of Uric Acid and Blood Glucose Using Portable POCT Devices: Status, Challenges, and Future Horizons. Biosensors 2025, 15, 222. https://doi.org/10.3390/bios15040222
Jarnda KV, Dai H, Ali A, Bestman PL, Trafialek J, Roberts-Jarnda GP, Anaman R, Kamara MG, Wu P, Ding P. A Review on Optical Biosensors for Monitoring of Uric Acid and Blood Glucose Using Portable POCT Devices: Status, Challenges, and Future Horizons. Biosensors. 2025; 15(4):222. https://doi.org/10.3390/bios15040222
Chicago/Turabian StyleJarnda, Kermue Vasco, Heng Dai, Anwar Ali, Prince L. Bestman, Joanna Trafialek, Garmai Prosperity Roberts-Jarnda, Richmond Anaman, Mohamed Gbanda Kamara, Pian Wu, and Ping Ding. 2025. "A Review on Optical Biosensors for Monitoring of Uric Acid and Blood Glucose Using Portable POCT Devices: Status, Challenges, and Future Horizons" Biosensors 15, no. 4: 222. https://doi.org/10.3390/bios15040222
APA StyleJarnda, K. V., Dai, H., Ali, A., Bestman, P. L., Trafialek, J., Roberts-Jarnda, G. P., Anaman, R., Kamara, M. G., Wu, P., & Ding, P. (2025). A Review on Optical Biosensors for Monitoring of Uric Acid and Blood Glucose Using Portable POCT Devices: Status, Challenges, and Future Horizons. Biosensors, 15(4), 222. https://doi.org/10.3390/bios15040222