Article

Raman Spectroscopy for Urea Breath Test

Institute of Advanced Data Transfer Systems, ITMO University, Birzhevaya Liniya 14, 199034 Saint Petersburg, Russia
*
Author to whom correspondence should be addressed.
Biosensors 2023, 13(6), 609; https://doi.org/10.3390/bios13060609
Submission received: 18 April 2023 / Revised: 15 May 2023 / Accepted: 17 May 2023 / Published: 2 June 2023
(This article belongs to the Section Optical and Photonic Biosensors)

Abstract

:
The urea breath test is a non-invasive diagnostic method for Helicobacter pylori infections, which relies on the change in the proportion of 13CO2 in exhaled air. Nondispersive infrared sensors are commonly used for the urea breath test in laboratory equipment, but Raman spectroscopy demonstrated potential for more accurate measurements. The accuracy of the Helicobacter pylori detection via the urea breath test using 13CO2 as a biomarker is affected by measurement errors, including equipment error and δ13C measurement uncertainty. We present a Raman scattering-based gas analyzer capable of δ13C measurements in exhaled air. The technical details of the various measurement conditions have been discussed. Standard gas samples were measured. 12CO2 and 13CO2 calibration coefficients were determined. The Raman spectrum of the exhaled air was measured and the δ13C change (in the process of the urea breath test) was calculated. The total error measured was 6% and does not exceed the limit of 10% that was analytically calculated.

1. Introduction

Exhaled human breath is a mixture of alveolar, pulmonary, and oral air, which contains biomarkers that allow for tracking of cellular changes [1]. The heterogeneity of human breath outcomes and associated biomarkers is the result of multiple factors, such as variations and inconsistencies in sampling techniques (both within and between individuals), variations inherent in human physiology, the complex interaction of diverse compounds present in the exhaled air, and interference from concurrent medical conditions [1]. The examination of human breath has a potential application as a screening tool in many medical fields, such as gastric cancer [2,3,4], esophageal cancer [5,6], esophagogastric adenocarcinoma [7], lung cancer, and asthma [8,9]. These topics have been discussed in detail in the research literature [10]. The volume of exhaled air at complete rest is approximately 0.5 L per breath cycle for a typical adult male and 400–500 mL per breath for females, and approximately 5% of its volume fraction consists of CO2. The latter allows for determining the presence of Helicobacter pylori in the organism.
Helicobacter pylori can cause many diseases, including chronic gastritis and a peptic ulcer. It has also been associated with extragastric diseases, including atherosclerotic diseases, hepatobiliary diseases, and lung diseases [11]. Various studies have been conducted in order to investigate different diagnostic approaches, the most utilized of which include the histopathologic examination of biopsies, stool antigen test, urea breath test (UBT), and serological testing [12]. Although endoscopy is commonly used as the initial diagnostic method, non-invasive diagnostic methods such as the urea breath test are more preferred due to their convenience for patients.
The urea breath test (UBT) relies on the change in the proportion of 12CO2 and 13CO2 in exhaled air. This change occurs due to the Helicobacter pylori’s activity, the result of which is the bacteria converting 13C-labeled urea into NH3 and 13CO2 [13]. To develop a high-quality device for the δ13С determination in human breath, it is necessary to accurately calibrate the device with standard gas samples beforehand.
There are several techniques available for gas sample pattern analysis, including nondispersive infrared sensors (NDIR), Fourier-transform spectroscopy, mass spectrometry, and Raman spectroscopy [14,15,16]. Numerous publications have compared these techniques against each other and against other diagnostic methods such as antigen tests, serological tests, and histopathologic examinations [14,15,16,17,18,19], but NDIR-based sensors are still the most employed for the UBT in laboratories. The sensitivity, specificity, and accuracy of the NDIR method compared to mass spectroscopy are 87.5%, 100%, and 96.3%, correspondingly [20].
Various sources provide conflicting information regarding the UBT’s sensitivity (ratio of true positive results to all positive results) and specificity (ratio of true negative results to all negative results), ranging from 92% to 99% [21,22,23,24]. The UBT’s accuracy (ratio of correct results to all results) fluctuates between 95.3% and 99% [21,23]. The method’s variability in the accuracy values may be related to sensor component instabilities and instrumental errors.
One of the most powerful methods for measuring the volume fraction of isotopologues in a gaseous sample is Raman spectroscopy [25,26,27,28]. The high accuracy of gas analyzers based on Raman spectrometry makes it possible to more accurately determine the 12CO2 and 13CO2 volume fraction changes in breath samples. Several studies have demonstrated the potential of using Raman spectroscopy for the UBT [29,30,31], but further investigation is needed to improve the detection of changes in the 12CO2 and 13CO2 volume fraction. In this study, we investigate the accuracy of measurements and the stability of results achieved by using a previously developed Raman gas analyzer [25]. The presented results pave the way to the application of Raman spectroscopy for the UBT, allowing for reducing the number of controversial results, which potentially could simplify the diagnosis.

2. Materials and Methods
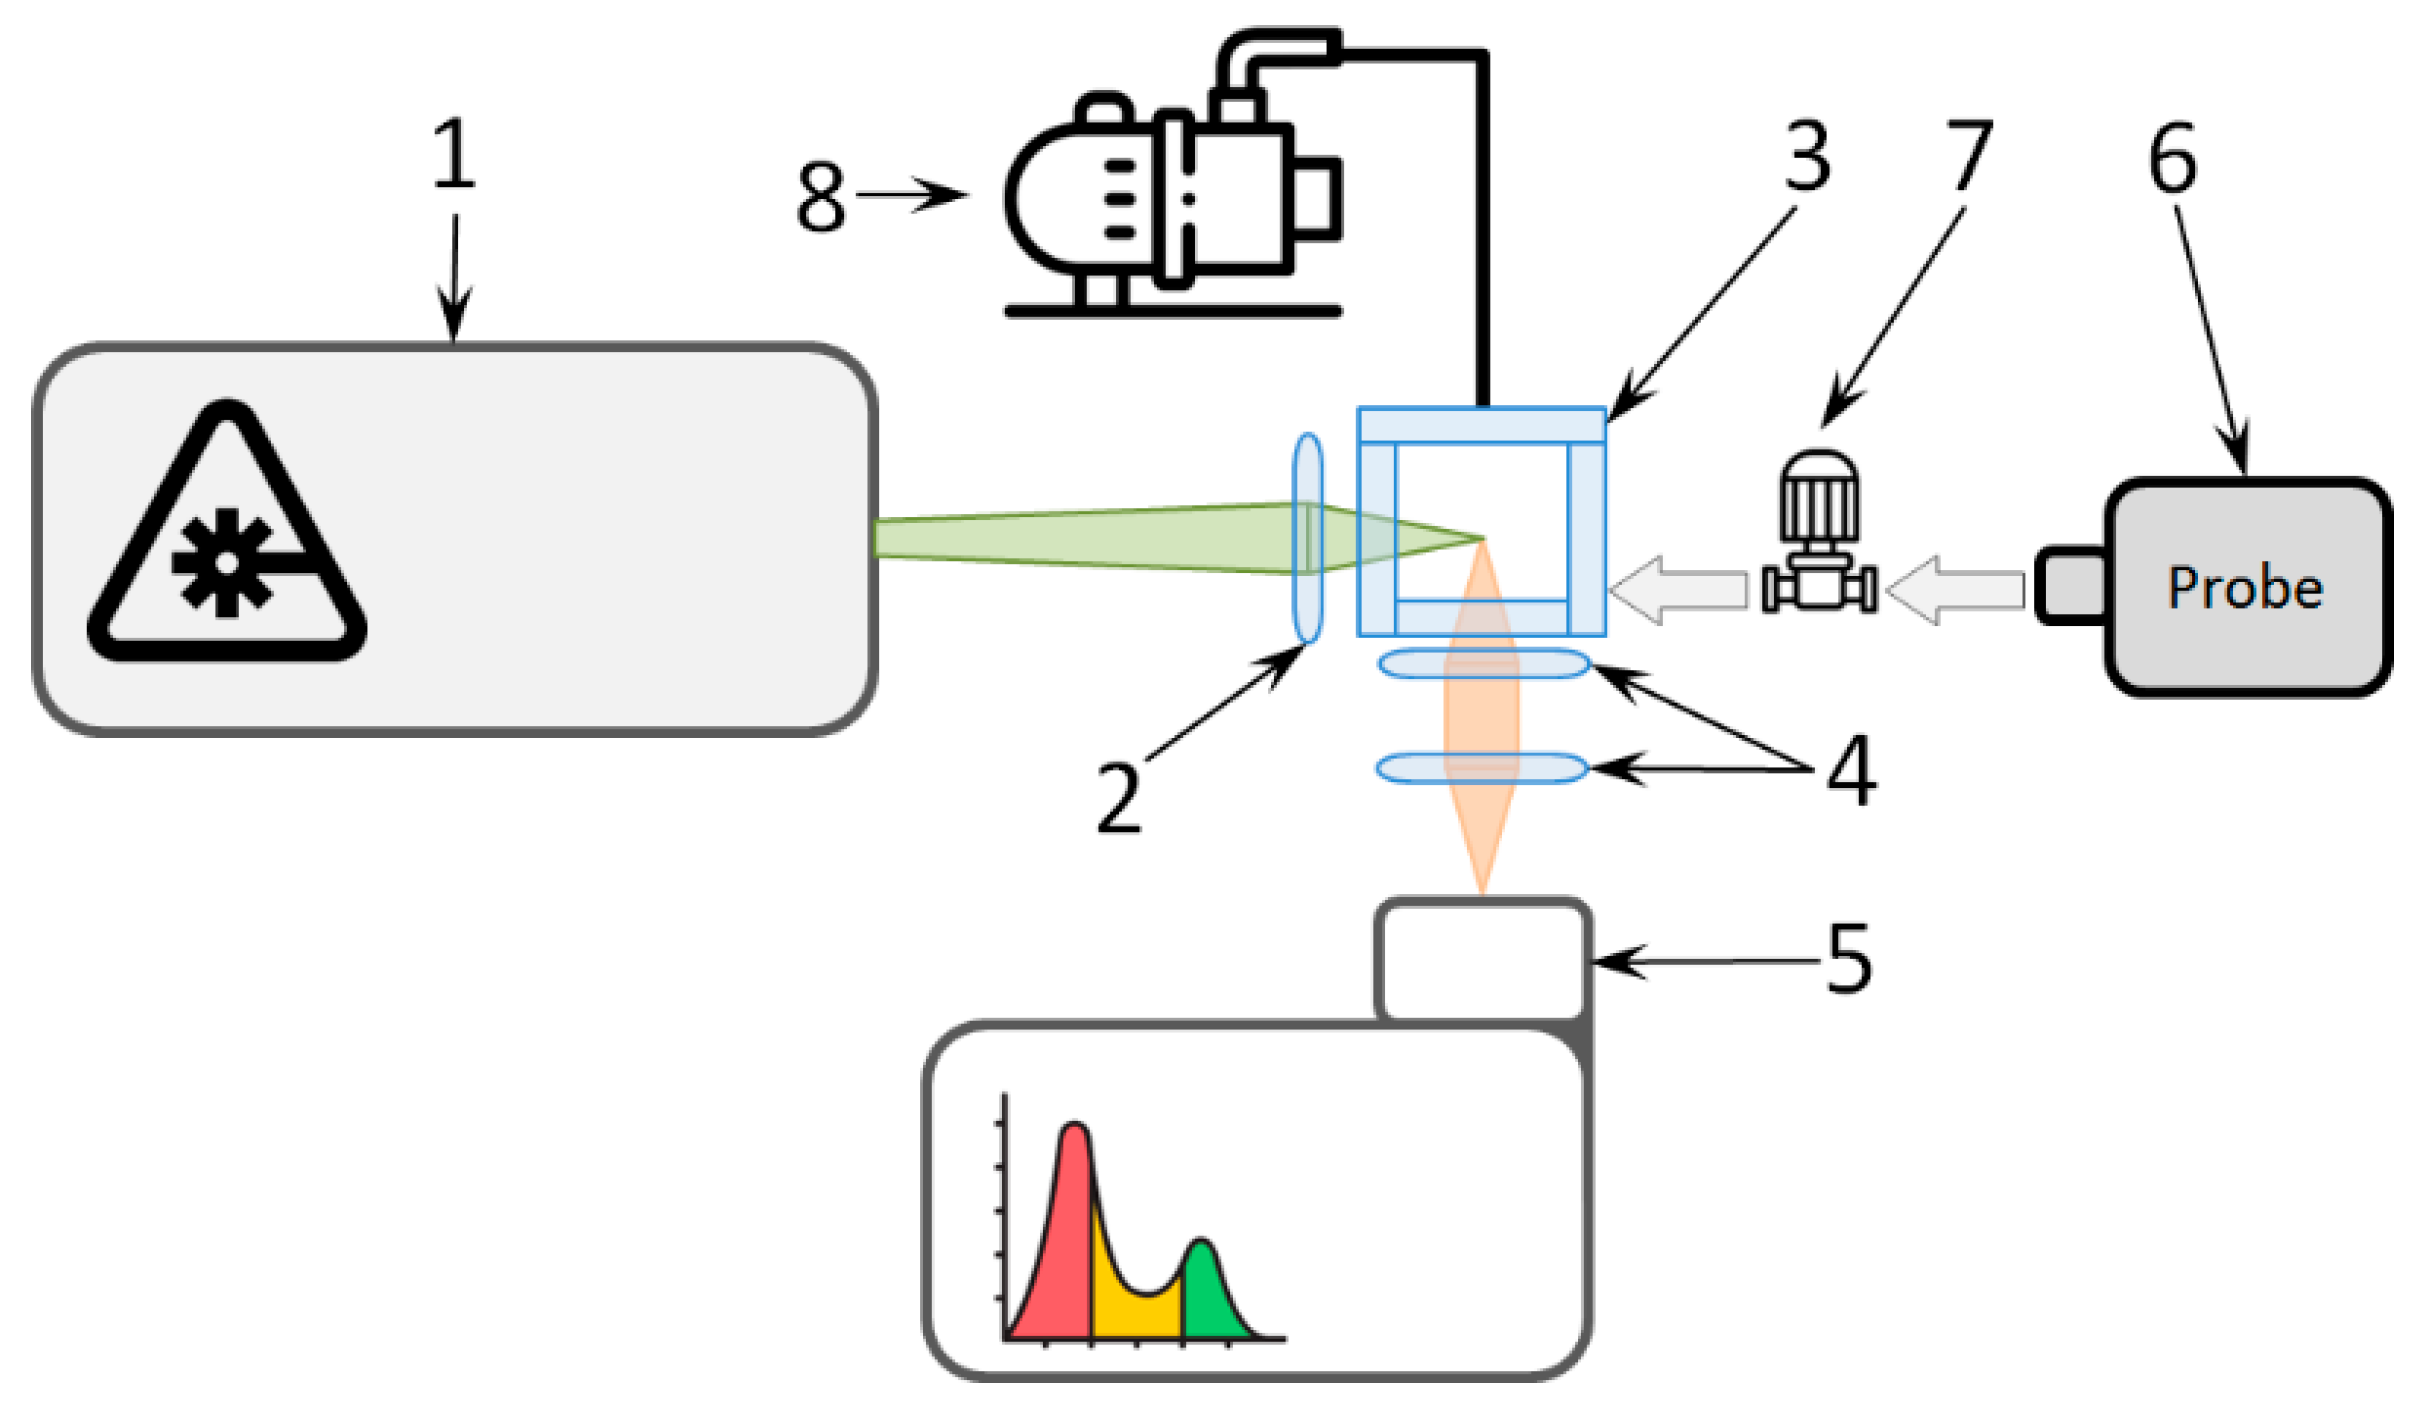
The Raman gas analyzer used is the same as in our recent works [25,32]. In this study, we specified some extra characteristics of the device to estimate its ability to conduct the UBT for the Helicobacter pylori identification.

2.1. Gas Analyzer

The gas analyzer consisted of a gas cell, laser, and high-resolution spectrometer based on the Czerny–Turner scheme with a Hamamatsu HS 101H-2048/250-HR1 CCD camera cooled down to −40 °C. The spectral resolution obtained was 1 cm−1 within the spectral region ranging from 200 cm−1 to 1500 cm−1 (from 540 nm to 600 nm at the laser’s wavelength of 532.1 nm). The gas analyzer scheme is shown in Figure 1.
The root-mean-square deviation (RMSD) of the camera’s dark noise at the photodetector’s minimum temperature did not exceed 12 Analog-to-Digital Converter (ADC) counts (number of digital values that can be assigned to the analog signal, the sensor used has a 6 × 10⁴ count range) in the full image mode with maximum resolution. The quantum efficiency at 25 °C of photodetector temperature was not less than 985 at a 571 nm wavelength. The cooled camera provided lower levels of the dark current and Johnson–Nyquist noise. Working at a temperature of −40 °C increased the signal-to-noise ratio (SNR) up to 100 times compared to room temperature. The influence of temperature on the SNR will be discussed further in more detail.
The laser used was a 5 W, 532.1 nm solid-state laser (MSL-R-532 by CNI Lasers). This laser had a narrow line width up to 0.01 nm to achieve the sample’s spectral resolution of the Raman spectrum of 1 cm−1.
In Raman spectroscopy, it is important to use a laser with stable output power and a stable spectrum. We measured these parameters for 5 h and found that the relative deviation from the nominal power for the laser used was 2.1% and the relative deviation of the laser’s central wavelength was 0.001%. The medium value of the laser wavelength was 532,106 nm. The standard deviation of the central laser wavelength position was 0.008 nm, which corresponds to the deviation of one pixel of camera. It can be assumed that the stability of the laser’s central wavelength is higher than the error of the spectrometer used. The 2% deviation of laser power increased the uncertainty of our measurements.
In addition to the gas cell, the gas subsystem included a pressure boosting system and a preliminary cleaning system. The pressure boosting system consisted of a piston-type pump custom designed for this device. The preliminary cleaning system included a vacuum pump.

2.2. Samples

Two types of samples were used in this study. The first type consisted of standard gas samples containing 12CO2 and 13CO2 in N2, with the volume fraction of 12CO2 ranging from 3.9% to 5.78% and the volume fraction of 13CO2 ranging from 0.0426% to 0.0647% (provided by the D.I. Mendeleev All-Russian Institute for Metrology; standard sample number 11576-2020). Compounds of samples are shown in Table 1; the δ13C value is the difference between the sample and the standard that is calculated by Equation (3).
The second type of samples used in this work was the samples of human breath provided voluntarily by ITMO University employees. The samples were collected in accordance with the generally accepted procedure of conducting the UBT [12]. The samples included two specimens: a base specimen and a diagnostic specimen (taken after ingestion of the 13C-enriched substrate). The specimens were collected into special bags (the volume of the bag was 400 mL) provided with the commercial kit for the UBT (from Isocarb company, Moscow, Russia); the dose of urea was 50 mg [20]. Informed consent was obtained from all subjects involved in this study.

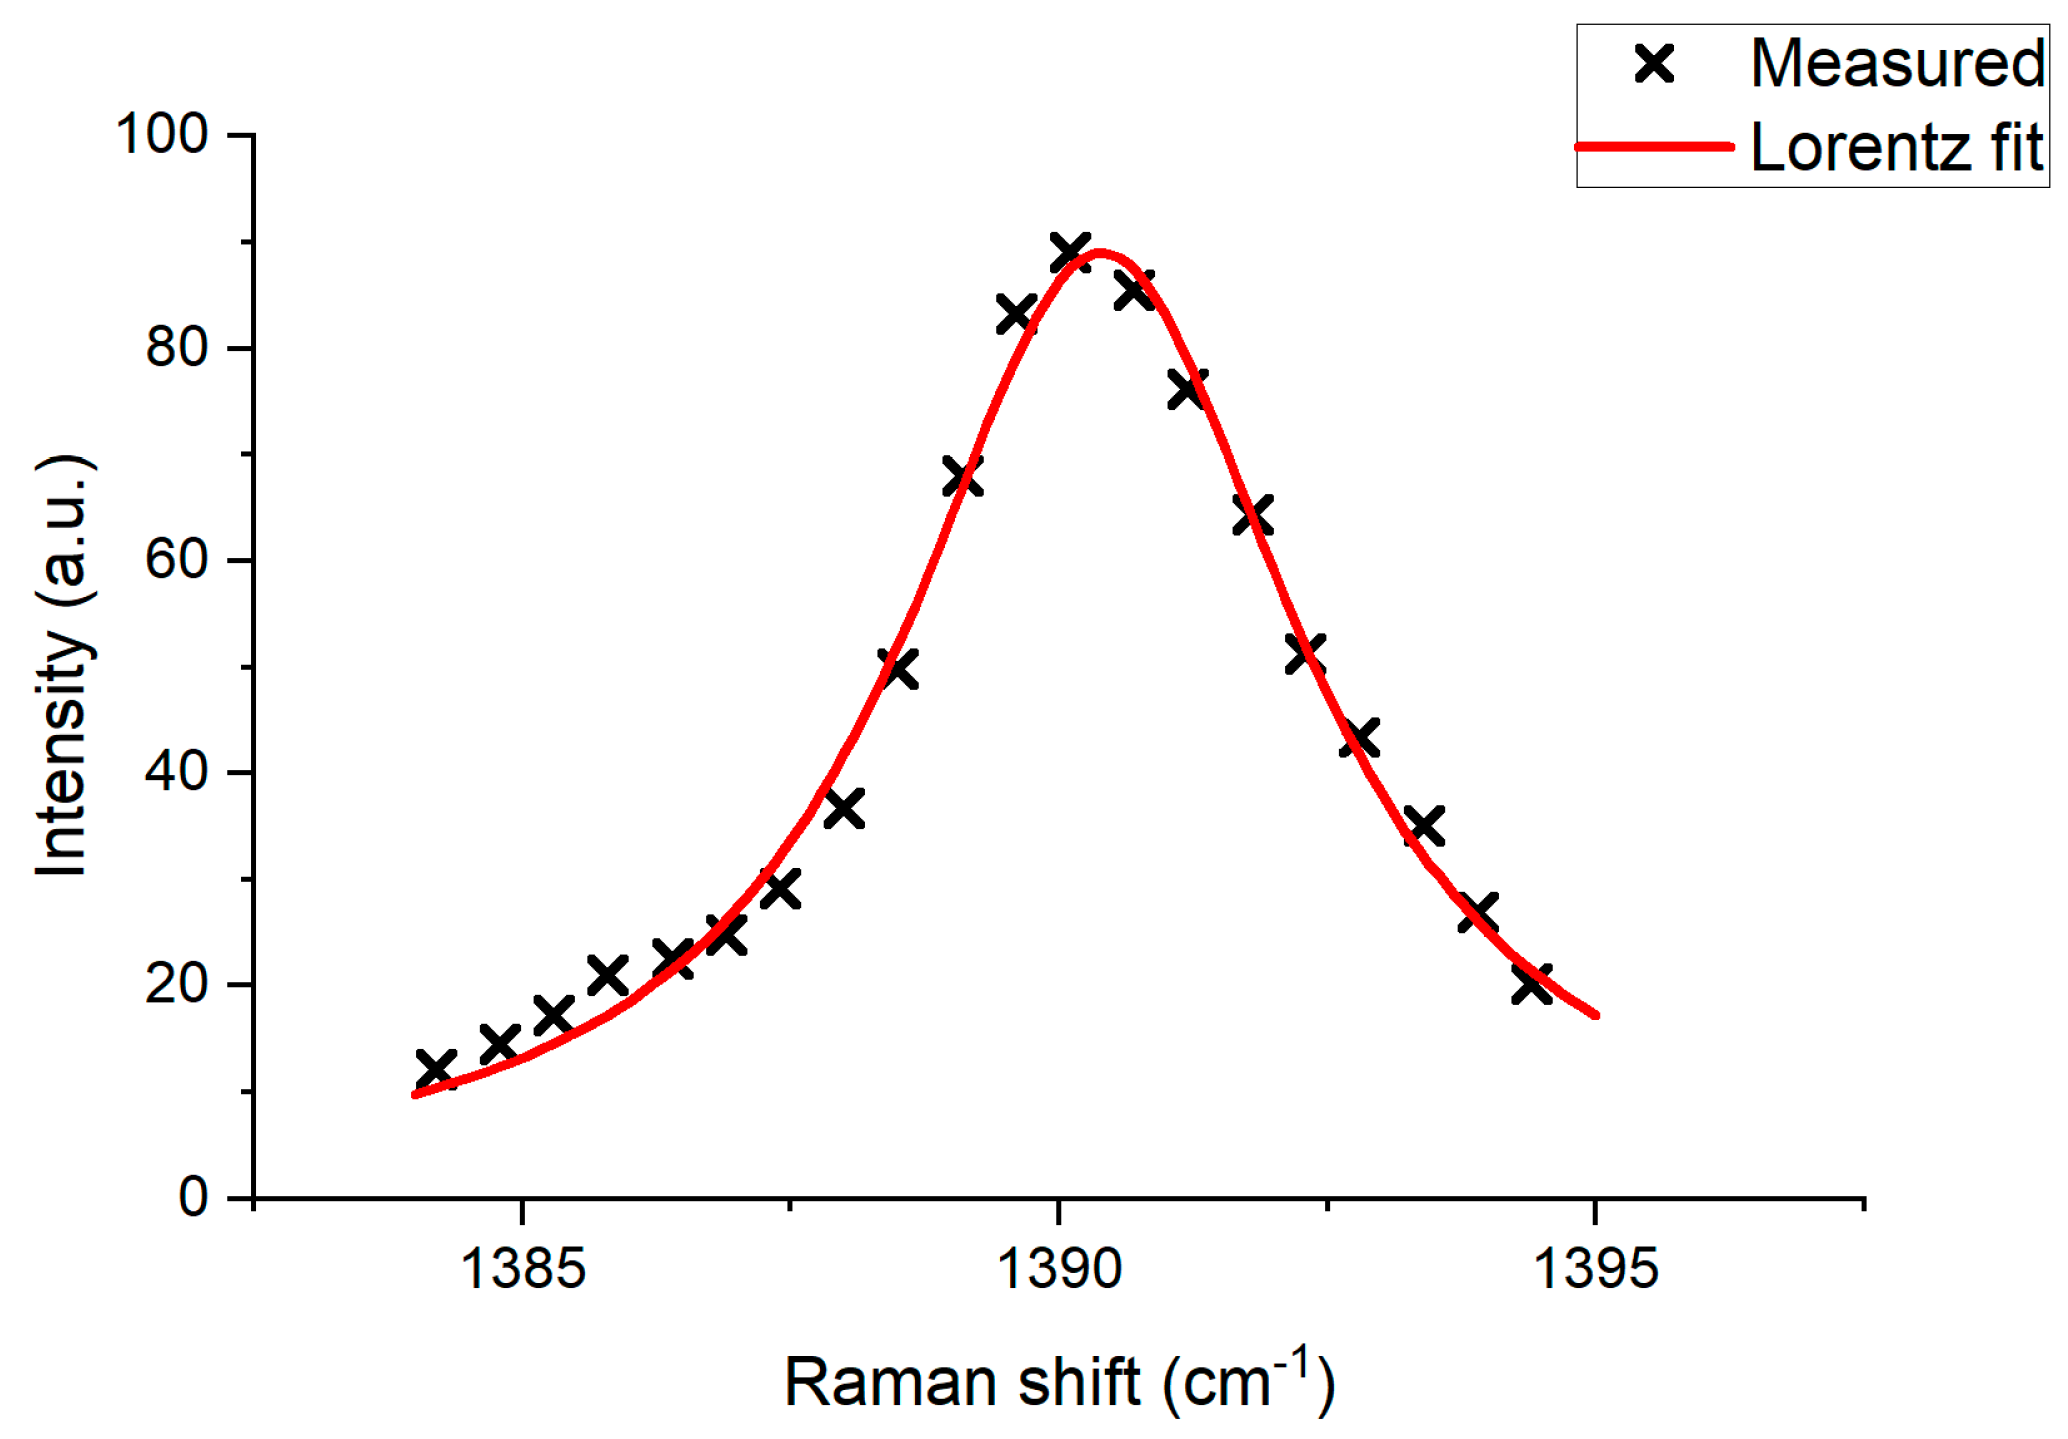
2.3. Signal Processing

The Raman spectrum of a gas sample can be described with a Lorentz function [33]. Figure 2 demonstrates the example of pure 12CO2 gas Raman spectrum fit with the Lorentz function.
The intensity of Raman scattering ( I R ) is described by the following equation [33]:
IR = I0·σj·D·dz
where I0—the intensity of the laser radiation; σj—the cross section of Raman scattering for the vibration frequency νj (m2·molecule−1·moles−1); D—the density of molecules; and dz—the length of the optical path.
Equation (1) shows that the amplitude of the registered Raman scattering signal is a linear function of pressure, exposure time, and laser power. To evaluate the amount of the specimen, we normalize the spectral signal amplitude and bring it to a pressure value of 1 atm, laser power of 1 watt, and exposure duration of 1 s. Furthermore, it is essential during normalization to account for the influence of pressure on spectral broadening using a correction coefficient. It is also necessary to consider the dark current, which must also be brought to a zero level.
Equation (1) allows for determining the volume fraction from the analysis of the scattering spectrum. This can be done by using the Raman spectrum peak intensity or area as a basis. In this work, the amount of specimen was determined by the area (S) under the Raman scattering peak of a specific isotopologue (1388 cm−1 peak for 12CO2 and 1370 cm−1 peak for 13CO2). This allowed for a reduction in the thermal noise influence on the stability of the obtained result. To prove this, we conducted the modeling of the CCD camera noise level influence on the volume fraction relative measurement standard deviation using the peak intensity and the area under the peak as a basis for the volume fraction estimation. For the modelling, a Lorentzian profile was assumed, and the CCD noise amplitude standard deviation was defined by the signal-to-noise ratio.
As seen in Figure 3, the usage of the area under the component’s Raman scattering spectral peak can decrease the relative standard deviation of the measurement about 3 times for a SNR of more than 60. The close values obtained by two methods at a SNR less than 10 indicates a low amount of information obtained under conditions of a low SNR.
The calculation of the volume fraction was performed from signal through calibration functions:
X12C = k12·S12C·CΔw/(P·W·t)
X13C = k13·S13C·CΔw/(P·W·t)
where k12 (k13) are calibration coefficients for 12CO2 (13CO2) (k12 = 0.0123, k13 = 7.4·10−3); S12C (S13C) is the area under the 12CO2 (13CO2) Raman scattering peak; P—the pressure of the specimen in the cuvette; W—laser power; t—exposure time; CΔw—the correction coefficient for spectral broadening calculated by Equation (7) (see below).
The calibration coefficients were obtained through the analysis of data from Raman scattering spectra of the standard samples listed in Table 1. Measurements were conducted in a series of 100 measurements for each sample at pressures ranging from 1 to 10 atm and exposure durations ranging from 1 to 600 s. The power of the laser radiation did not vary due to the technical limitations and stayed at 5 ± 0.11 W. The actual power value was recorded at the time of measurement and used for the calibration. As a result, a total of over 7000 measurements were performed. The coefficient of determination for the calibration curve, formed from the results of the measurements, was not less than 0.98.
The volume fractions obtained by Equation (2) are used to calculate the δ13C value according to the following equation:
δ 13 C = X 13 C X 12 C sample X 13 C X 12 C standard 1 1000
where X13C—the volume fraction of 13CO2; X12C—the volume fraction of 12CO2. The standard value of (X13C/X12C) was 0.0112372 for the Pee Dee Belemnite (VPDB) [34].
It is important to notice that the volume fraction of 12CO2 did not change significantly for a certain person during multiple measurements under the same measurement conditions. Therefore, the δ13C value could be estimated via 13CO2 volume fraction difference in diagnostic and base samples:
δ 13 C = ( V PDB / 1000 ) · ( 1 / X 12 C ) · ( X 13 C diag X 13 C base )
where X13C—the volume fraction of 13CO2, the upper index is for the base and diagnostic specimen; X12C—the volume fraction of 12CO2.

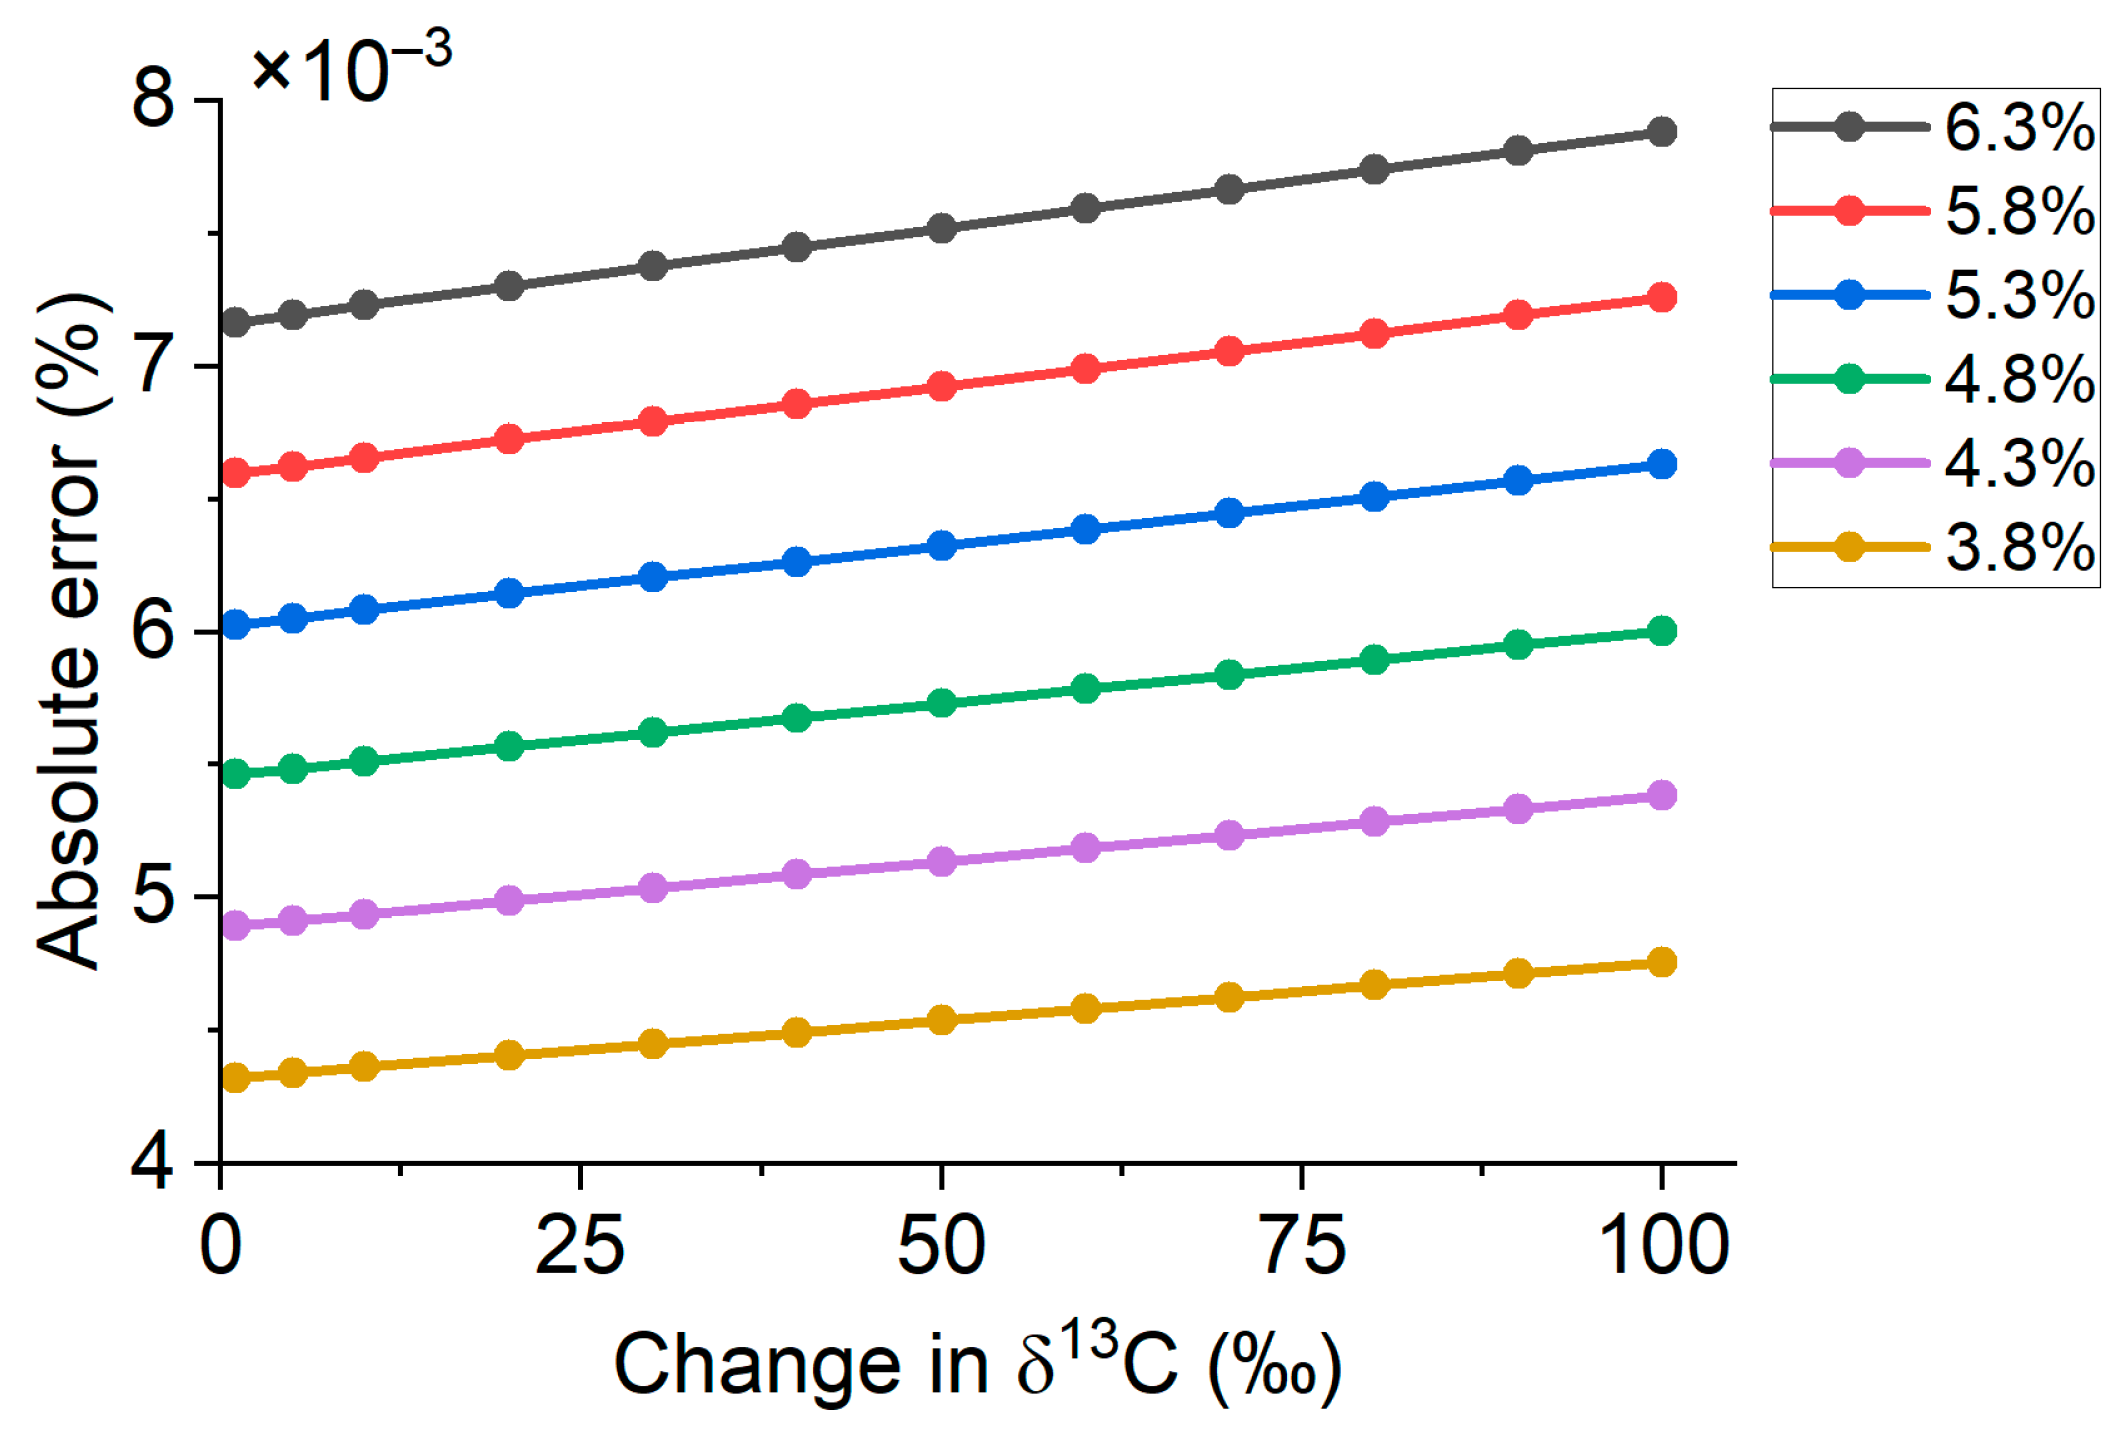
2.4. Absolute Uncertainty of Measurement Requirements

The measurement of the exhaled air using the UBT method requires a certain level of absolute measurement uncertainty, which characterizes the variability of the measured value. The volume fraction of CO2 in exhaled air typically varies from 4% to 6% [35,36], while the natural abundance of 12CO2 and 13CO2 is 98.85–99.04% and 0.96–1.15%, respectively [37,38,39]. While it is important to measure the relative volume fraction of both the 12CO2 and 13CO2 components during the UBT, it could be difficult to measure their signals simultaneously due to the differences in the signal strength. Since the change in the 13CO2 volume fraction is more important for the UBT, the required level of measurement uncertainty was estimated for a 3.8% to 6.3% CO2 volume fraction (1.05 safety factor) in exhaled air and a change in δ13C from 3‰ to 100‰. The determination of the required maximum absolute measurement error was conducted according to the following formula:
Δabs = Δrel·(VPDB·[δ13Cchange + 1]·XCO2·[1 + (VPDB·[δ13Cchange + 1])])
where Δabs—the absolute error of measurement; Δrel—the relative error of measurement; VPDB—the relative volume fraction of 12CO2 to 13CO2 in Pee Dee Belemnite (constant at δ13C = 0, VPDB = 0.01123720, according to the International Atomic Energy Agency); XCO2–the volume fraction of CO2 in the exhaled air; and δ13Cchange—the change in δ13C between the base specimen and a diagnostic specimen (δ13Cchange = [δ13Cdiag − δ13Cbase ]/1000).
Figure 4 shows the results of the modeling.
For accurate determination of the volume fraction, it is necessary that its measuring resolution does not exceed two standard deviations for a series of measurements. In this case, there will be a 95% probability that the data obtained using this instrument will represent truly different values. The estimated measurement uncertainty value of the 13CO2 volume fraction required for the UBT was found to be 45 ppm (10% relative error), while the standard deviation of the measurement should be less than 22.5 ppm for a 95% probability. The error budget is therefore limited to 10%.

3. Results

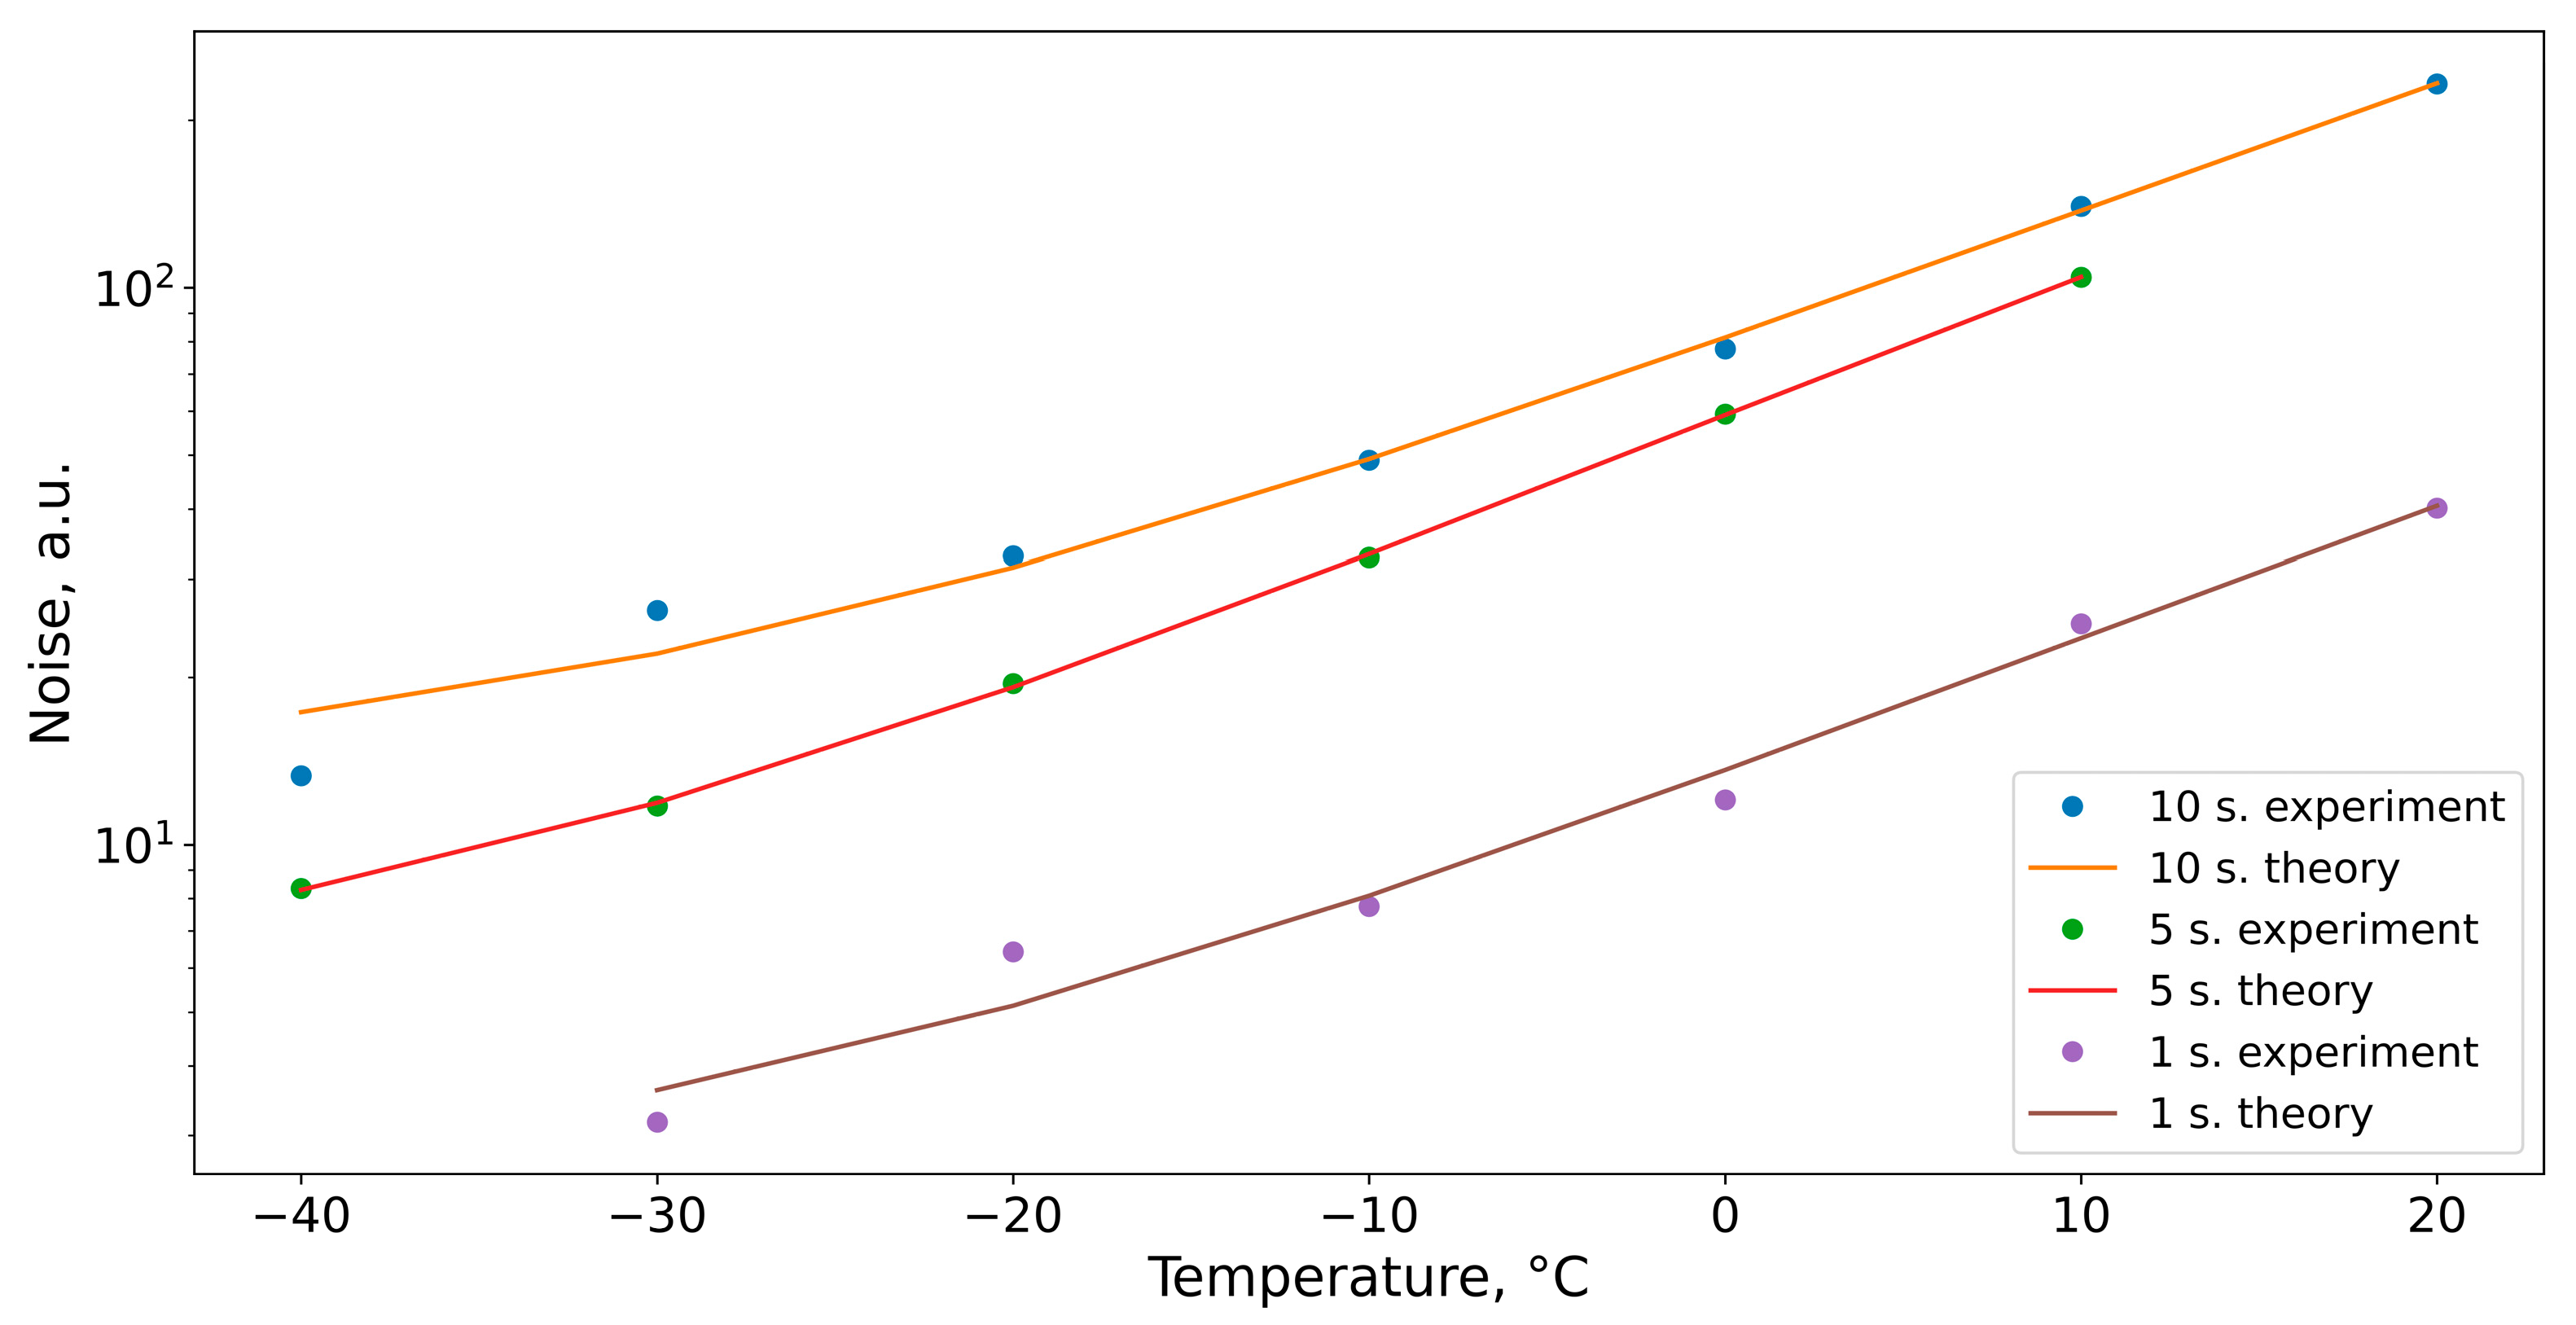
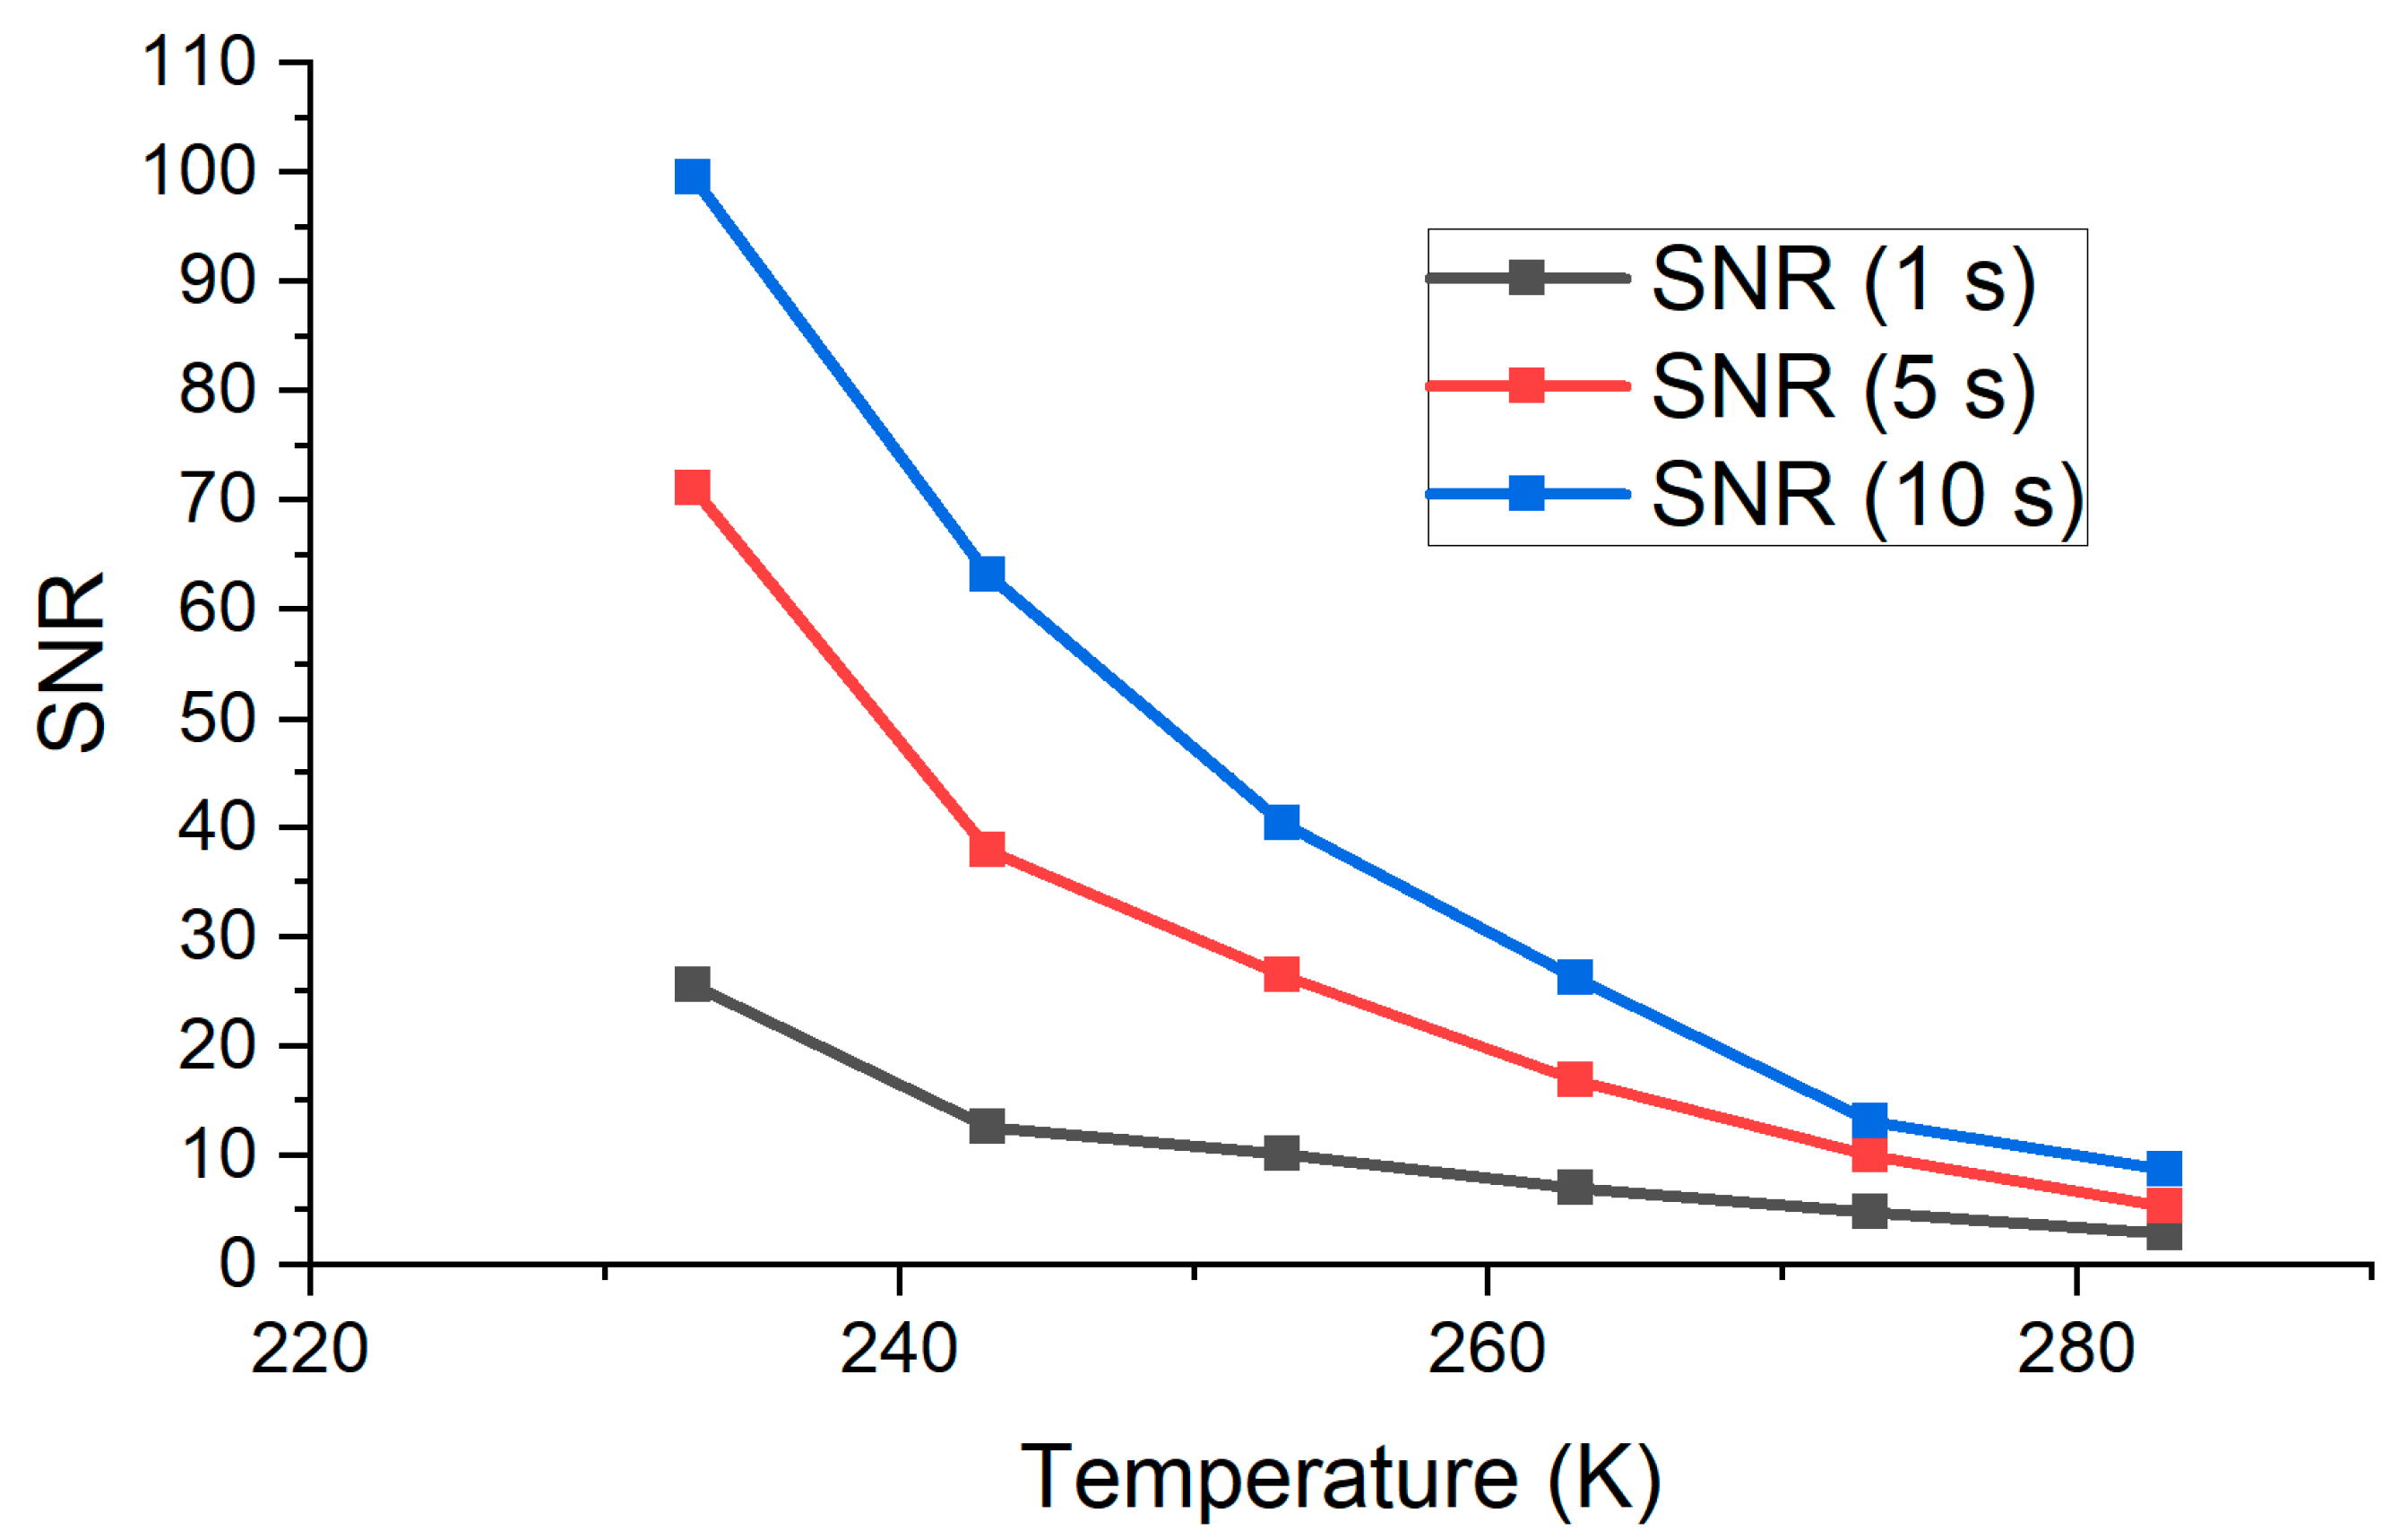
3.1. Influence of Temperature on SNR

As aforementioned, it is important to estimate the dark current noise and Johnson–Nyquist noise when using a CCD camera. These types of noise are temperature-dependent and affect the results obtained; thus, they should be analyzed to estimate their contribution in the uncertainty of the measurements. During this experiment, Sample 2 (Table 1) was measured at different exposure times and different temperatures of the camera. The SNR was estimated by the N2 signal (1.01 × 10⁻⁶ moles of the 95% N2 gas sample, 1 cm3 volume, and 0.08 atm pressure). Figure 5 shows the experimental results of the noise standard deviation (STD) measurement at 1, 5, and 10 s of exposure and temperature ranging from −40 °C to 20 °C (note that vertical axes have a logarithmic scale).
It is clearly observed that the noise STD increases with the increase in temperature. The lowest noise was obtained at a camera temperature of −40 °C and exposure time of 1 s. The noise amplitude as a function of temperature was described by the following equation [40] (theoretical curves in Figure 5):
De = De0diff·T3·exp(Eg/kT) + De0dep·T3/2·exp(Eg/2kT)
where k—the Boltzmann constant; T—the temperature of the sensor; De0diff—the amplitude of the dark current diffusion noise; De0dep—the amplitude of the dark current depletion noise; and Eg—energy of a band gap that varies from temperature Eg = f(T) [40].
The determination coefficient (R2) was used to estimate the accuracy of approximation. The closer it is to 1, the better fit of data is achieved. The determination coefficient (R2) was 0.92, 0.99, and 0.9 at 1, 5, and 10 s of exposure time, correspondingly.
The Raman scattering intensity of N2 can be described with Equation (1). Sample 2 (Table 1) and measured spectra of Raman scattering at different exposure times and different temperatures of the camera were used to estimate the SNR, as shown in Figure 6.
It is clear that the increase in exposure time influences both the noise level and intensity of the Raman spectrum registered by the camera, but for exposure time ranging from 1 to 300 s, the exponential form of SNR dependence on the temperature was observed as the noise level grew more slowly with the exposure time, compared to the signal level. The biggest SNR achieved in this experiment was 200 at −40 °C at an exposure time of 300 s.
All things considered, the dark current noise error was less than 1% at a camera temperature of −40 °C while the temperature and exposure time connected errors were below the error budget.

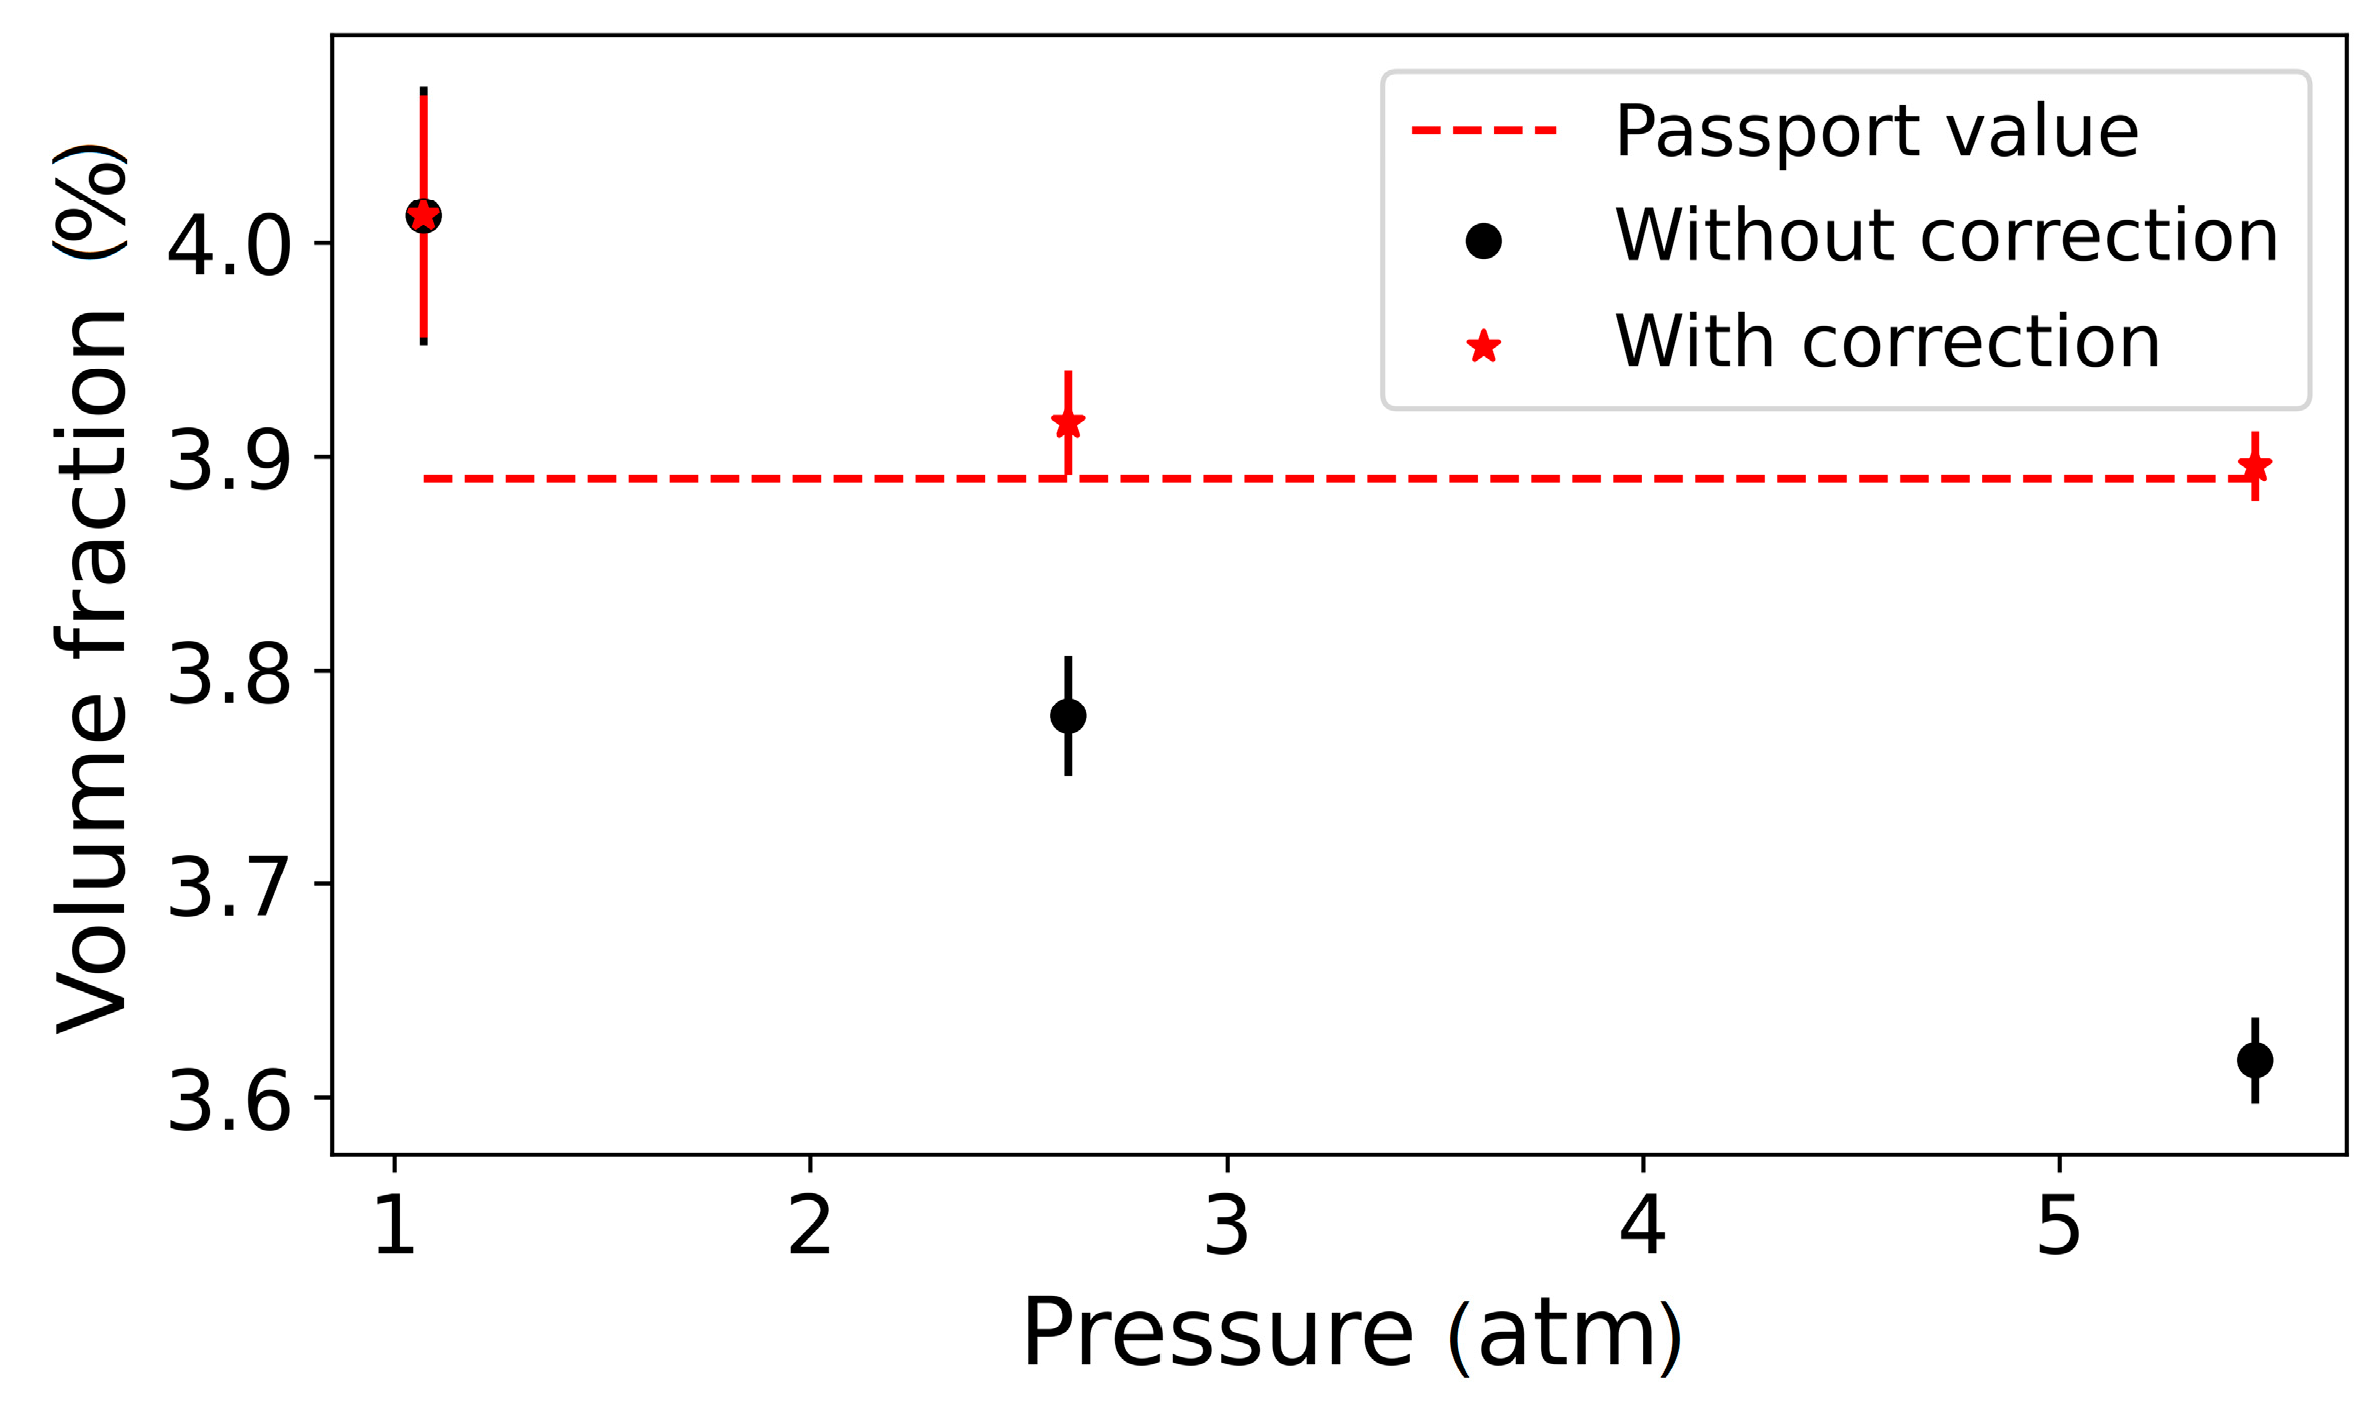
3.2. Influence of Pressure on SNR

The pressure of a gas in the cell affects the SNR since the intensity of the Raman scattering is proportional to the density of molecules in the sample, while the density of molecules itself relates to the amount of the sample (in moles).
The influence of pressure on the Raman line width is well known [41], so the broadening coefficient was taken as 140 × 10−3 cm−1/atm in our estimation.
Sample 1 (Table 1) was used in this experiment to determine the influence of pressure on the SNR. As shown before, we calculate an area under the Raman line as it has less deviation during the measurement compared to the peak intensity deviation. To consider the effect of spectral broadening, we use the correction coefficient (CΔw). This coefficient is calculated using the following formula:
CΔw = 1 + Δw·P
where Δw—the broadening coefficient; P—gas pressure in a gas cell.
Figure 7 shows the resulting influence of pressure on a measured signal. We compared the results of the volume fraction of 12CO2 measurement obtained for Sample 4 (Table 1) with and without the correction coefficient CΔw. The measurements were performed in the range from 1 to 5.5 atm. The known value of the 12CO2 volume fraction is 3.9%.
As seen from Figure 7, in the case when the correction coefficient was used, the average relative deviation of the mean value from the known value decreased from 5% to 1%. Thus, the correction factor could be accounted to measured data to achieve a more accurate result.

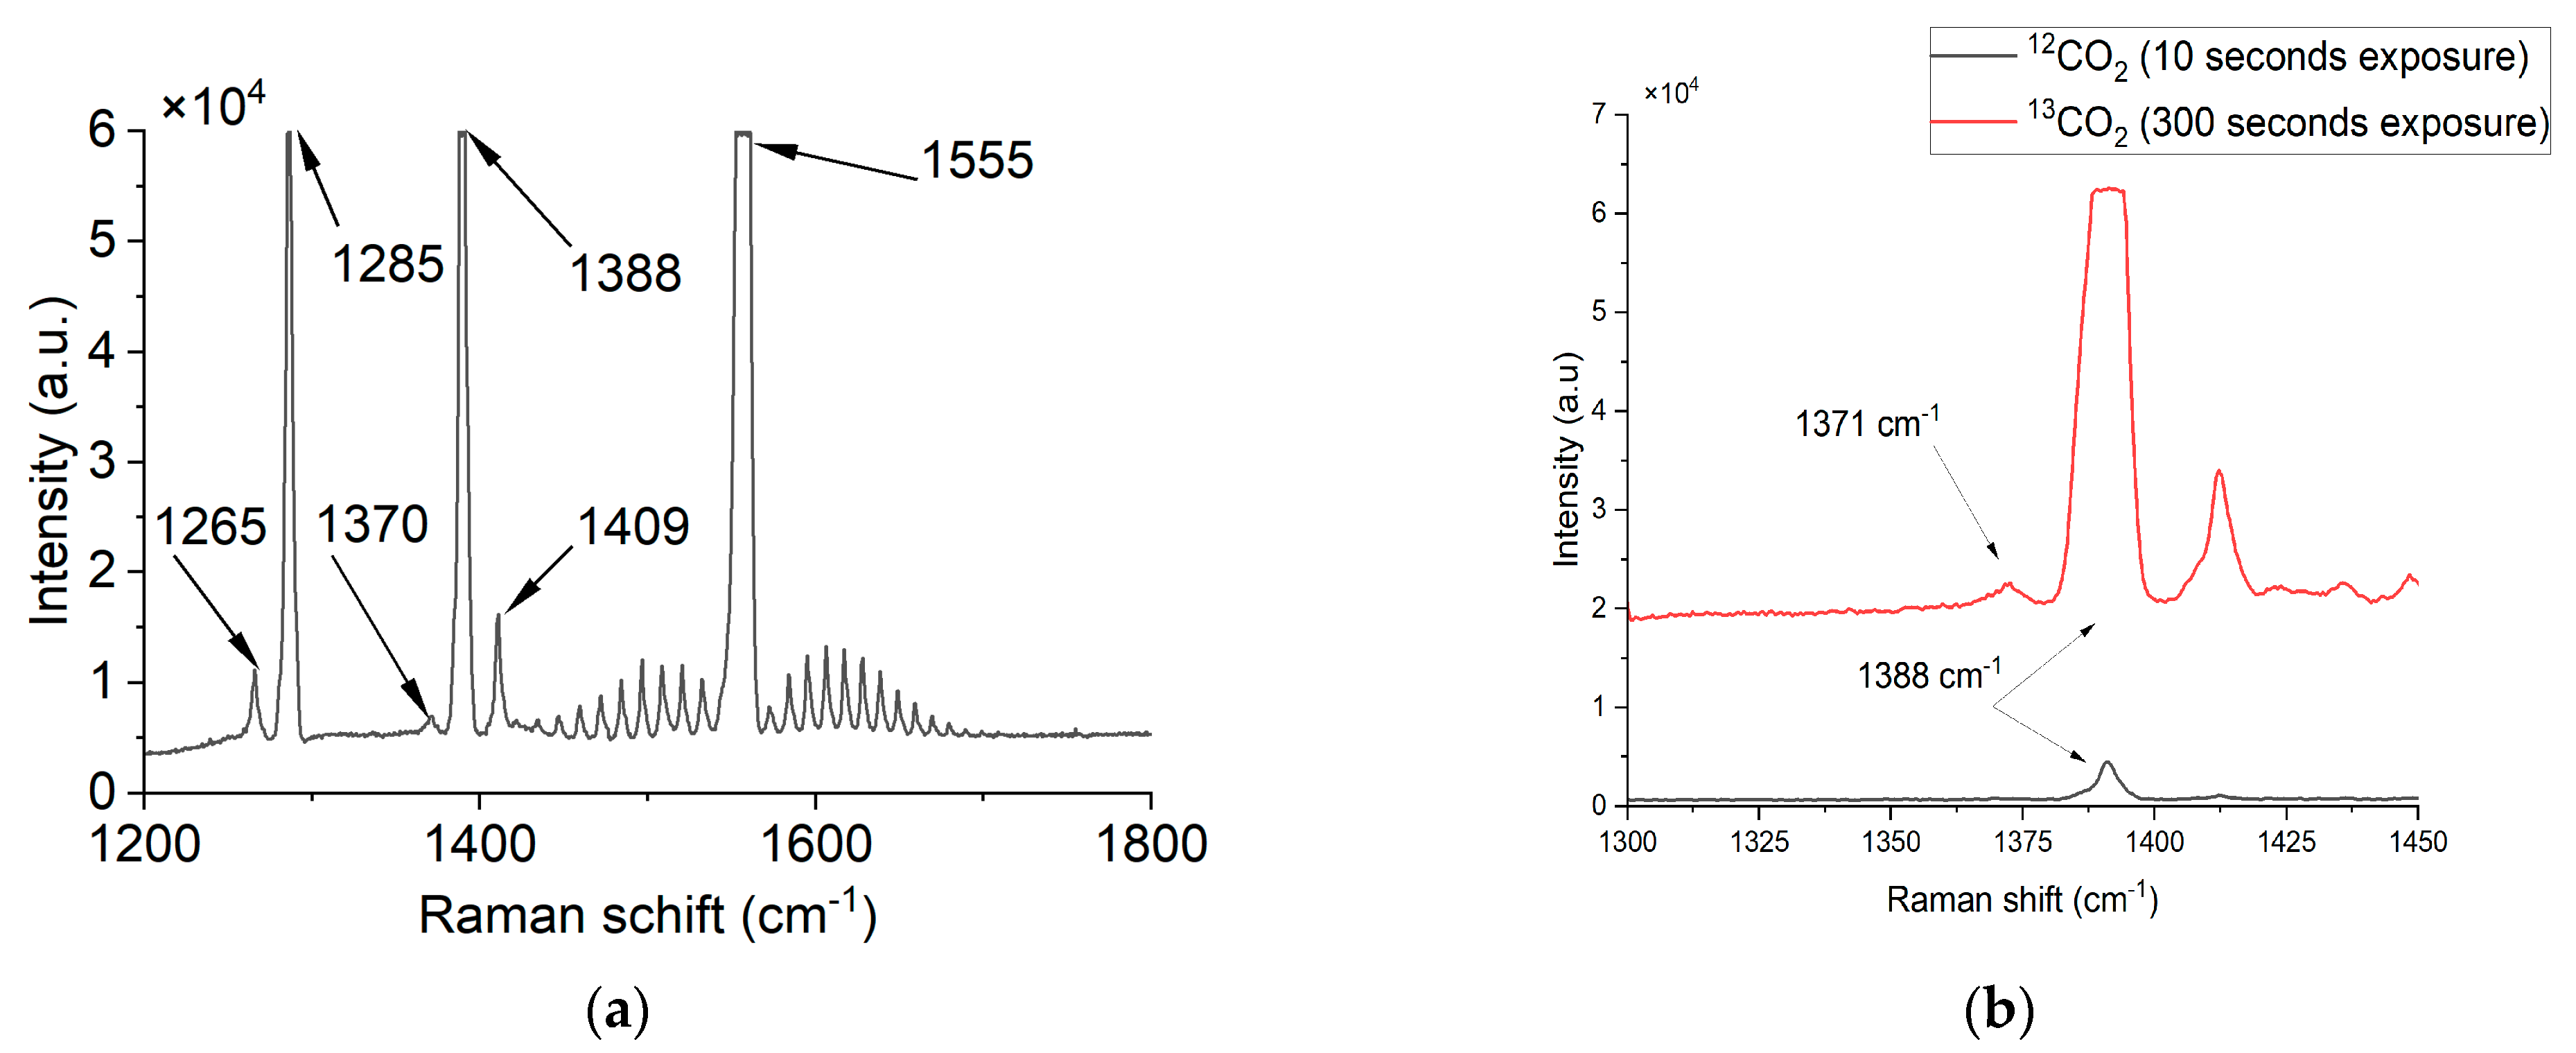
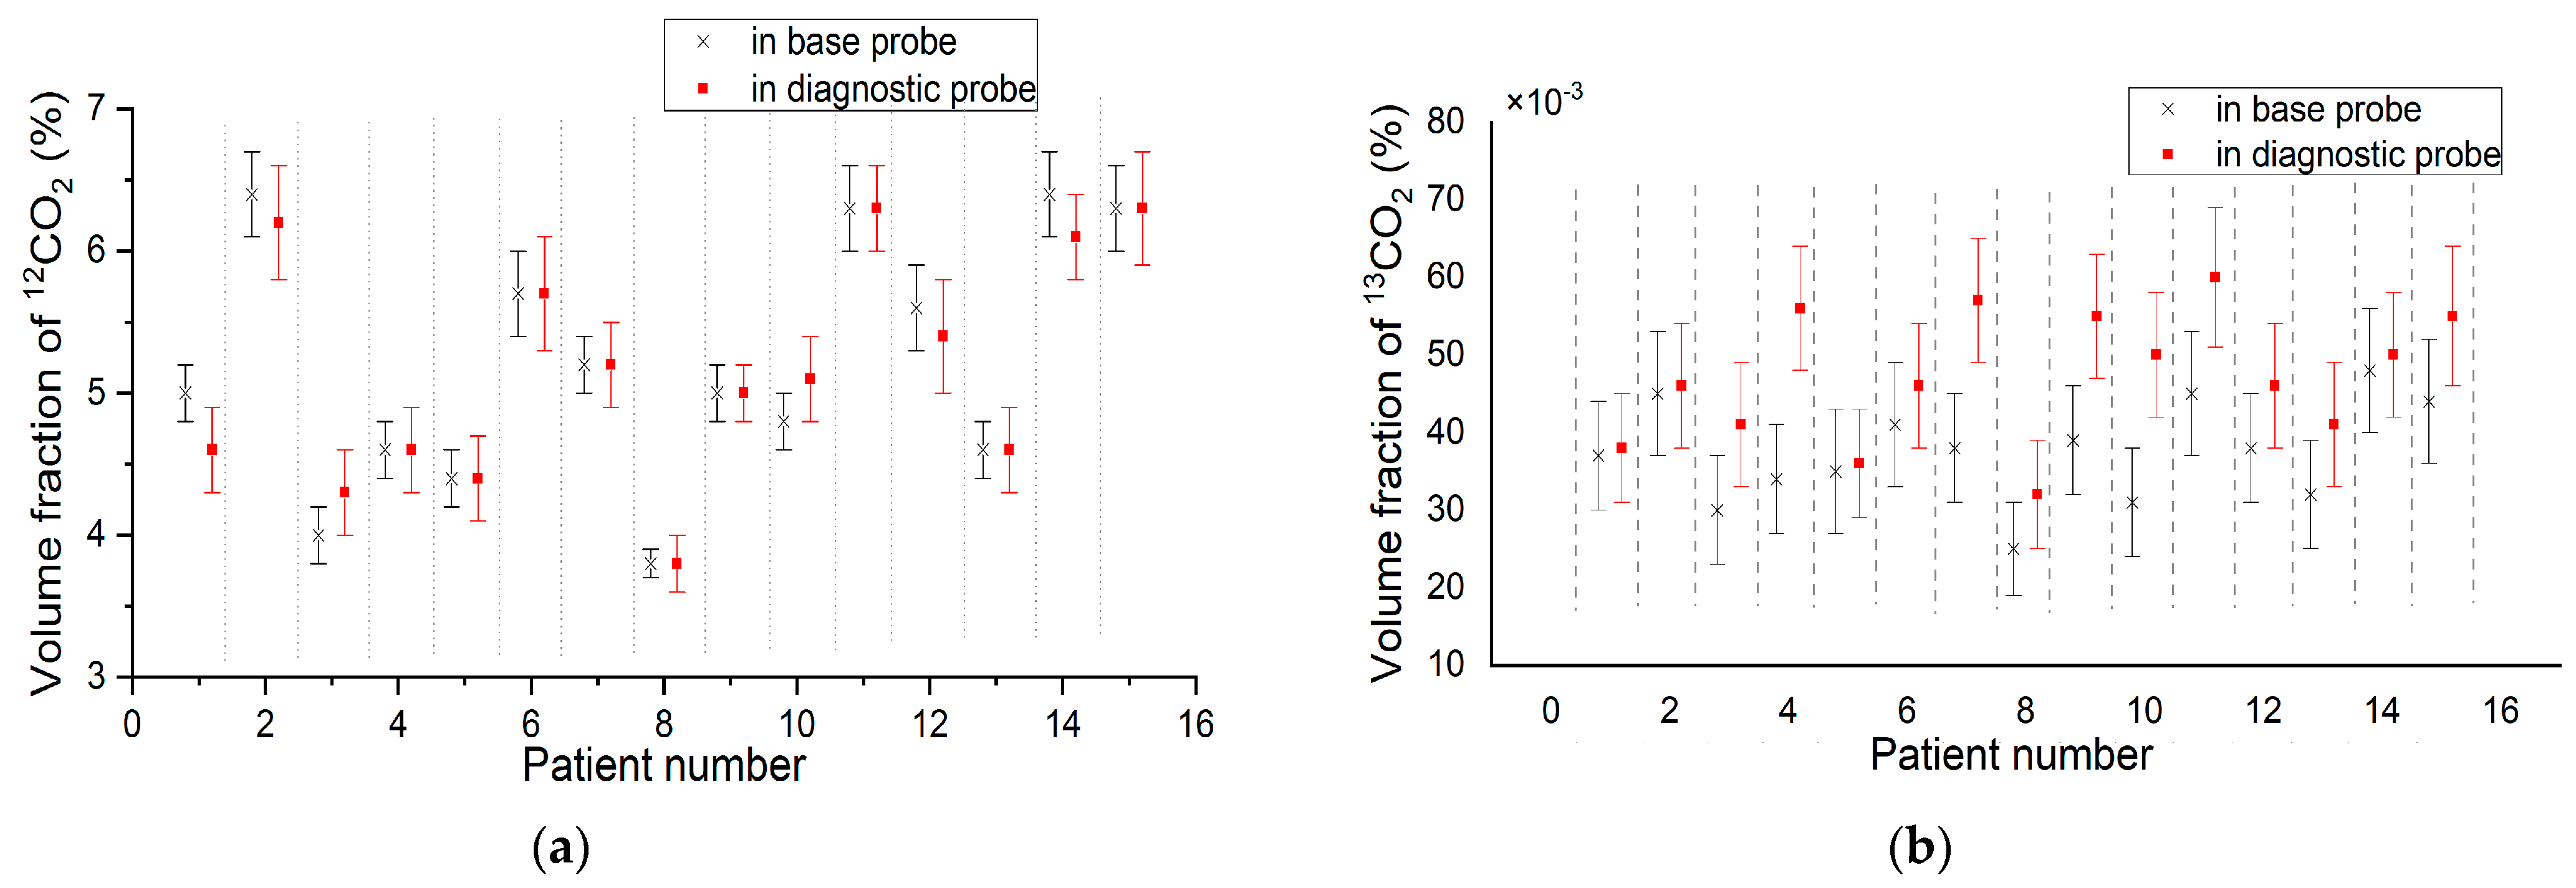
3.3. Exhaled Air Measurements

The experimentally obtained typical spectrum of the exhaled air Raman scattering at a 60 s exposure in the region from 1200 сm−1 to 1750 сm−1 is shown in Figure 8a, and the Raman spectrum of 12CO2 and 13CO2 at 10 and 300 s exposure times, correspondingly, in Figure 8b.
The exhaled air’s spectrum clearly shows the lines of 12CO2 (1265 сm−1, 1285 сm−1, 1388 сm−1, and 1409 сm−1) and 13CO2 (1370 сm−1), as well as O2 (with a characteristic structure of polyads and the most intense peak near 1555 сm−1), and is in good agreement with the known data [42,43]. Notably, the 13CO2 line is significantly lower than the 12CO2 line due to a lower volume fraction. Due to the fact that in a single sample both 12CO2 and 13CO2 were measured at a different exposure time, we can see an overflow of a 1388 cm−1 peak of 12CO2 while the 1371 cm−1 peak of 13CO2 is slightly higher than the noise level.
To calculate the ratio of the 13CO2 to 12CO2 volume fraction, 10 spectra at 10 s (for 12CO2) and 10 spectra at 300 s (for 13CO2) were measured both for base and diagnostic samples. The volume fractions were estimated by the calibration function Equation (2); δ13C was then calculated according to Equation (4) for base and diagnostic samples, after which the difference between two samples was calculated. The results of measuring the volume fraction of 12CO2 and 13CO2 are shown in Table 2 and Figure 9.
This study involved a group of volunteers (15 persons: 5 males 20–45 years old, 8 females 20–30 years old, and 2 females 50> years old); it included participants who took an antigen test for Helicobacter pylori (IgG test) and blood test for Helicobacter pylori.
Results shown in Table 2 allow for seeing that the change in the volume fraction of 13CO2 is close to the standard deviation of the measurement. Table 3 shows that the change in the 13CO2 volume fraction corresponds to the change in δ13C, which is also clearly observed from Equation (4).
The relative measurement uncertainty obtained during this experiment was below 6% while the estimated measurement uncertainty was 4%, which increases the accuracy of volume fraction measurements compared to our previous work [25,29]. The results obtained with the UBT compared with the IgG test are shown in Table 4.
The number of uncertain results achieved with the UBT is 2 against 6 for the IgG test, which decreases the number of extra diagnostics for patients. The percentage of true positive results is 75%, and the percentage of true negative results is 75%.
The results of this experiment show that the obtained values are in good agreement with the typical values measured in other works [13,14,15,16,17,18,19,20,21,22]. Comparing UBT results with IgG, the number of true negative results was 100%. Yet we cannot describe the result as 100% specifically due to the small size of the group and the lack of information about participants. The number of true positive results was 75% (4/7 results) and 24% (3 results) was obtained as an uncertain result. The false-negative results obtained are explained by the inaccuracy during the UBT sampling process (not all participants had not eaten within 6 h prior to sampling). The lesser number of uncertain results was obtained in comparison to the NDIR method, which is an advantage of Raman spectroscopy. Although the sensitivity, specificity, and accuracy should be measured for a larger population to be generalized.

4. Discussion

In this work, for the first time to our knowledge, Raman spectroscopy was demonstrated not only as an accurate method for the isotope analysis of human breath, but was also specified as a Helicobacter pylori diagnosing instrument in comparison with an IgG diagnostic.
The 13CO2 volume fraction error had the greatest effect on the obtained results. The measurement uncertainty has included the device measurement error. To reduce this influence, a new quantification method and a pressure-dependent correction factor have been proposed. The method for estimating the amount of a specific component in a sample, based on the area under the Raman spectrum calculation and presented in this work, made it possible to reduce the measurement uncertainty by a factor of three. The evaluation of the spectral broadening influence on the results obtained provided a 40% reduction in the measurement uncertainty due to the introduction of a correction coefficient into the calculation. Using all the methods described above, the device error was up to 5%, resulting in the δ13C measurement uncertainty becoming 6%. All results are in good agreement with the results obtained in other works.
The influence of the methodology for making measurements and obtaining samples, as well as the method of calculation, affects the results obtained. Further research is required with more attention to the UBT procedure to assess accuracy and specificity compared to other methods.

Author Contributions

Conceptualization, A.K. and V.V.; methodology, A.P.; software, validation, formal analysis, and investigation, E.P.; resources, A.P.; data curation, A.K.; writing—original draft preparation, E.P.; writing—review and editing, A.P. and A.K.; visualization, E.P.; supervision, A.K.; project administration and funding acquisition, V.V. All authors have read and agreed to the published version of the manuscript.

Funding

This research was funded by the Ministry of Science and Higher Education of the Russian Federation, grant number 075-15-2021-1349.

Institutional Review Board Statement

The study was conducted in accordance with the Declaration of Helsinki, and approved by the Institutional Ethics Committee of Pavlov First Saint Petersburg State Medical University (protocol code 273 and date of approval: 29 May 2023).

Informed Consent Statement

Informed consent was obtained from all subjects involved in this study. The study was conducted in accordance with the Declaration of Helsinki and approved by the Institutional Ethics Committee of ITMO University (protocol code 273 and date of approval: 29 May 2023).

Data Availability Statement

The data supporting the research can be provided by a correspondence author upon reasonable request.

Acknowledgments

We acknowledge the ITMO Be Healthy project and Denisova Darya in particular.

Conflicts of Interest

The authors declare no conflict of interest.

References

  1. Issitt, T.; Wiggins, L.; Veysey, M.; Sweeney, S.T.; Brackenbury, W.J.; Redeker, K. Volatile compounds in human breath: Critical review and meta-analysis. J. Breath Res. 2022, 16, 024001. [Google Scholar] [CrossRef] [PubMed]
  2. Chen, Y.; Zhang, Y.; Pan, F.; Liu, J.; Wang, K.; Zhang, C.; Gabriel, A.; Jesús, M.; Chen, D.; Cui, D. Breath analysis based on surface-enhanced Raman scattering sensors distinguishes early and advanced gastric cancer patients from healthy persons. ACS Nano 2016, 10, 8169–8179. [Google Scholar] [CrossRef] [PubMed]
  3. Ligor, T.; Szeliga, J.; Jackowski, M.; Buszewski, B. Preliminary study of volatile organic compounds from breath and stomach tissue by means of solid phase microextraction and gas chromatography–mass spectrometry. J. Breath Res. 2007, 1, 016001. [Google Scholar] [CrossRef] [PubMed]
  4. Jaimes, A.L.; Durán, C.M.; Gualdrón, O.E.; Ionescu, S.R. Stomach cancer detection through exhaled breath using biomarkers analysis. Chem. Eng. 2018, 68, 43–48. [Google Scholar]
  5. Kumar, S.; Huang, J.; Abbassi-Ghadi, N.; Španěl, P.; Smith, D.; Hanna, G.B. Selected ion flow tube mass spectrometry analysis of exhaled breath for volatile organic compound profiling of esophago-gastric cancer. Anal. Chem. 2013, 85, 6121–6128. [Google Scholar] [CrossRef]
  6. Kumar, S.; Huang, J.; Abbassi-Ghadi, N.; Mackenzie, H.A.; Veselkov, K.A.; Hoare, J.M.; Lovat, L.B.; Španěl, P.; Smith, D.; Hanna, G.B. Mass spectrometric analysis of exhaled breath for the identification of volatile organic compound biomarkers in esophageal and gastric adenocarcinoma. Ann. Surg. 2015, 262, 981–990. [Google Scholar] [CrossRef]
  7. Markar, S.R.; Wiggins, T.; Antonowicz, S.; Chin, S.T.; Romano, A.; Nikolic, K.; Benjamin, E.; David, C.; Muntzer, M.; Jesper, L.; et al. Assessment of a noninvasive exhaled breath test for the diagnosis of oesophagogastric cancer. JAMA Oncol. 2018, 4, 970–976. [Google Scholar] [CrossRef] [Green Version]
  8. Shehada, N.; Cancilla, J.C.; Torrecilla, J.S.; Pariente, E.S.; Brönstrup, G.; Christiansen, S.; Douglas, W.; Johnson Marcis, L.; Davies, M.P.A.; Liran, O.; et al. Silicon nanowire sensors enable diagnosis of patients via exhaled breath. ACS Nano 2016, 10, 7047–7057. [Google Scholar] [CrossRef] [Green Version]
  9. Gharra, A.; Broza, Y.Y.; Yu, G.; Mao, W.; Shen, D.; Deng, L.; Wu, C.; Wang, Q.; Sun, X.; Huang, J.; et al. Exhaled breath diagnostics of lung and gastric cancers in China using nanosensors. Cancer Commun. 2020, 40, 273. [Google Scholar] [CrossRef]
  10. Haddad, G.; Schouwenburg, S.; Altesha, A.; Xu, W.; Liu, G. Using breath analysis as a screening tool to detect gastric cancer: A systematic review. J. Breath Res. 2021, 15, 016013. [Google Scholar] [CrossRef]
  11. Franceschi, F.; Gasbarrini, A. Helicobacter pylori and extragastric diseases. Best Pract. Res. Clin. Gastroenterol. 2007, 21, 325–334. [Google Scholar] [CrossRef]
  12. Bordin, D.S.; Voynovan, I.N.; Andreev, D.N.; Maev, I.V. Current Helicobacter pylori diagnostics. Diagnostics 2021, 11, 1458. [Google Scholar] [CrossRef]
  13. Logan, R. Urea breath tests in the management of Helicobacter pylori infection. Gut 1998, 43, S47. [Google Scholar] [CrossRef]
  14. Metsälä, M. Optical techniques for breath analysis: From single to multi-species detection. J. Breath Res. 2018, 12, 027104. [Google Scholar] [CrossRef]
  15. Gisbert, J.P.; Pajares, J.M. 13C-urea breath test in the diagnosis of Helicobacter pylori infection—A critical review. Aliment. Pharmacol. Ther. 2004, 20, 1001–1017. [Google Scholar] [CrossRef]
  16. Barth, E.; Tugtekin, I.; Weidenbach, H.; Wachter, U.; Vogt, J.; Radermacher, P.; Adler, G.; Georgieff, M. Determination of 13CO2/12CO2 ratio by IRMS and NDIRS. Isot. Environ. Health Stud. 1998, 34, 209–213. [Google Scholar] [CrossRef]
  17. Kwon, Y.H.; Kim, N.; Lee, J.Y.; Choi, Y.J.; Yoon, K.; Hwang, J.J.; Hyun, J.L.; AeRa, L.; Yeon, S.J.; Sooyeon, O.; et al. The Diagnostic Validity of Citric Acid-Free, High Dose 13C-Urea Breath Test after Helicobacter pylori Eradication in Korea. Helicobacter 2015, 20, 159–168. [Google Scholar] [CrossRef]
  18. Kawai, S.; Arai, K.; Li, Y.; Nishiyama, T.; Sasakabe, T.; Wan, C.; Hiroto, M.; Kikuchi, S. Comparison of the detection of Helicobacter pylori infection by commercially available serological testing kits and the 13C-urea breath test. J. Infect. Chemother. 2019, 25, 769–773. [Google Scholar] [CrossRef]
  19. Machado, R.S.; Reber, M.; Patrício, F.R. 13C-urea breath test with infrared spectroscopy for diagnosing Helicobacter pylori infection in children and adolescents. J. Pediatr. Gastroenterol. Nutr. 2002, 35, 39–43. [Google Scholar]
  20. Плавник, Р.Г.; Невмержицкий, В.И.; Бутoрoва, Л.И.; Плавник, Т. Сравнительная oценка масс-спектрoметрии и инфракраснoй спектрoметрии при прoведении 13С-уреазнoгo дыхательнoгo теста на Helicobacter pylori. Клиническая медицина 2015, 93, 42–45. [Google Scholar]
  21. Pichon, M.; Pichard, B.; Barrioz, T.; Plouzeau, C.; Croquet, V.; Fotsin, G.; Chéron, A.; Vuillemin, É.; Wangermez, M.; Haineaux, P.A. Diagnostic Accuracy of a Noninvasive Test for Detection of Helicobacter pylori and Resistance to Clarithromycin in Stool by the Amplidiag H. pylori + ClariR Real-Time PCR Assay. J. Clin. Microbiol. 2020, 58, e01787-19. [Google Scholar] [CrossRef] [PubMed]
  22. Ferwana, M.; Abdulmajeed, I.; Alhajiahmed, A.; Madani, W.; Firwana, B.; Hasan, R.; Altayar, O.; Limburg, P.J.; Murad, M.H.; Knawy, B. Accuracy of urea breath test in Helicobacter pylori infection: Meta-analysis. World J. Gastroenterol. 2015, 21, 1305–1314. [Google Scholar] [CrossRef] [PubMed]
  23. Leal, Y.A.; Flores, L.L.; Fuentes-Pananá, E.M.; Cedillo-Rivera, R.; Torres, J. 13C-urea breath test for the diagnosis of Helicobacter pylori infection in children: A systematic review and meta-analysis. Helicobacter 2011, 16, 327–337. [Google Scholar] [CrossRef] [PubMed]
  24. Peng, N.J.; Lai, K.H.; Liu, R.S.; Lee, S.C.; Tsay, D.G.; Lo, C.C. Clinical significance of oral urease in diagnosis of Helicobacter pylori infection by [13C] urea breath test. Dig. Dis. Sci. 2001, 46, 1772–1778. [Google Scholar] [CrossRef]
  25. Vitkin, V.; Polishchuk, A.; Chubchenko, I.; Popov, E.; Grigorenko, K.; Kharitonov, A.; Davtian, A.; Kovalev, A.; Kurikova, V.; Camy, P.; et al. Raman laser spectrometer: Application to 12C/13C isotope identification in CH4 and CO2 greenhouse gases. Appl. Sci. 2020, 10, 7473. [Google Scholar] [CrossRef]
  26. Petrov, D.V.; Matrosov, I.I. Raman gas analyzer (RGA): Natural gas measurements. Appl. Spectrosc. 2016, 70, 1770–1776. [Google Scholar] [CrossRef]
  27. Petrov, D.V.; Matrosov, I.I.; Zaripov, A.R.; Tanichev, A.S. Raman Natural Gas Analyzer: Effects of Composition on Measurement Precision. Sensors 2022, 22, 3492. [Google Scholar] [CrossRef]
  28. Petrov, D.V.; Matrosov, I.I.; Kostenko, M.A. Possibilities of measuring the exhaled air composition using Raman spectroscopy. Quantum Electron. 2021, 51, 389. [Google Scholar] [CrossRef]
  29. Popov, E.E.; Polischuk, A.V.; Vitkin, V.V. Exhaled air Raman spectroscopy for Helicobacter pylori diagnostics. J. Phys. Conf. Ser. 2022, 2388, 012015. [Google Scholar] [CrossRef]
  30. Polishchuk, A.; Kenzhebayeva, Y.; Grigorenko, K.; Popov, E.; Vitkin, V. Raman-based high-resolution detection of 13CO2 isotopes in human breath Biomedical. Spectrosc. Microsc. Imaging 2020, 11359, 269–273. [Google Scholar]
  31. Velez, J.S.G.; Muller, A. Spontaneous Raman scattering at trace gas concentrations with a pressurized external multipass cavity. Meas. Sci. Technol. 2021, 32, 045501. [Google Scholar] [CrossRef]
  32. Popov, E.; Polishchuk, A.; Grigorenko, K.; Chubchenko, I.; Vitkin, V. Raman detector of carbon isotopes. Opt. Sens. Detect. VI 2020, 11354, 385–389. [Google Scholar]
  33. Richard, L. Chemical Analysis: A Series of Monographs on Analytical Chemistry and Its Applications; John Wiley & Sons: Hoboken, NJ, USA, 2000. [Google Scholar]
  34. Slater, C.; Preston, T.; Weaver, L.T. Stable isotopes and the international system of units. Rapid Commun. Mass Spectrom. 2001, 15, 1270–1273. [Google Scholar] [CrossRef]
  35. Pleil, J.D.; Wallace, M.A.G.; Davis, M.D.; Matty, C.M. The physics of human breathing: Flow, timing, volume, and pressure parameters for normal, on-demand, and ventilator respiration. J. Breath Res. 2021, 15, 042002. [Google Scholar] [CrossRef]
  36. Tsoukias Nikolaos, M.; Wilson, A.F.; George, S.C. Single-exhalation profiles of NO and CO2 in humans: Effect of dynamically changing flow rate. J. Appl. Physiol. 1998, 85, 642–652. [Google Scholar] [CrossRef] [Green Version]
  37. Eggleston, S.; Schmitt, J.; Bereiter, B.; Schneider, R.; Fischer, H. Evolution of the stable carbon isotope composition of atmospheric CO2 over the last glacial cycle. Paleoceanography 2016, 31, 434–452. [Google Scholar] [CrossRef] [Green Version]
  38. De Laeter, J.R.; Böhlke, J.K.; De Bievre, P.; Hidaka, H.; Peise, H.S.; Rosman, K.J.R.; Taylor, P.D.P. Atomic weights of the elements. Review 2000 (IUPAC Technical Report). Pure Appl. Chem. 2003, 75, 683–800. [Google Scholar] [CrossRef]
  39. Berglund, M.; Wieser, M.E. Isotopic compositions of the elements 2009 (IUPAC Technical Report). Pure Appl. Chem. 2011, 83, 397–410. [Google Scholar] [CrossRef] [Green Version]
  40. Widenhorn, R.; Blouke, M.M.; Weber, A.; Rest, A.; Bodegom, E. Temperature dependence of dark current in a CCD Sensors and Camera Systems for Scientific, Industrial, and Digital Photography. Appl. III 2002, 4669, 193–201. [Google Scholar]
  41. Jammu, K.S.; John GE, S.; Welsh, H.L. Pressure broadening of the rotational Raman lines of some simple gases. Can. J. Phys. 1966, 44, 797–814. [Google Scholar] [CrossRef]
  42. Polishchuk, A.V.; Kurikova, V.V.; Grigorenko, K.M.; Vitkin, V.V. High Resolution Raman Detection of 12CO2 and 13CO2 Isotopes in Human Breath. In Proceedings of the 2020 International Conference Laser Optics (ICLO), St. Petersburg, Russia, 2–6 November 2020; p. 1. [Google Scholar]
  43. Popov, E.E.; Kurikova, V.V. Human breath Raman analysis. In Proceedings of the 2020 International Conference Laser Optics (ICLO), St. Petersburg, Russia, 2–6 November 2020; p. 1. [Google Scholar]
Figure 1. The scheme of the gas analyzer (not in scale): 1—laser; 2—objective; 3—gas cell; 4—f-matcher; 5—spectrometer; 6—specimen; 7—pressure boosting system; and 8—vacuum pump.
Biosensors 13 00609 g001
Figure 2. Example of Raman spectrum–Lorentz contour fit: dots—measured values; line—Lorentz function.
Biosensors 13 00609 g002
Figure 3. Influence of SNR on a relative standard deviation of volume fraction for two methods: via intensity calculation (blue line) and via the area measurement calculation (orange line).
Biosensors 13 00609 g003
Figure 4. Correspondence of absolute error of the 13CO2 volume fraction measurement from change in δ13C and the CO2 volume fraction in exhaled air.
Biosensors 13 00609 g004
Figure 5. Noise standard deviation as a function of exposure time via different temperatures of CCD camera, points—experimental results, line—fit with Equation (6).
Biosensors 13 00609 g005
Figure 6. SNR as a function of exposure time via different temperatures of CCD camera.
Biosensors 13 00609 g006
Figure 7. Influence of spectral broadening on signal measured, red stars—with correction of spectral broadening, black dots—without correction of spectral broadening.
Biosensors 13 00609 g007
Figure 8. Raman spectrum of the exhaled air: (a) the broad range; (b) 12CO2 and 13CO2 peaks.
Biosensors 13 00609 g008
Figure 9. Results of measuring volume fraction in base and diagnostic probes for: (a) 12CO2; (b) 13CO2.
Biosensors 13 00609 g009
Table 1. Compounds of standard gas samples.
Sample12CO2 Volume Fraction13CO2 Volume Fractionδ13C
Sample 15.78% ± 0.08%0.0647% ± 0.0008% 1.9   ±   0.2
Sample 24.89% ± 0.03%0.0526% ± 0.0003% 43.4   ±   0.2
Sample 34.89% ± 0.03%0.0548% ± 0.0003% 1.9   ±   0.2
Sample 43.9% ± 0.03%0.0426% ± 0.0003% 1.9   ±   0.2
Table 2. Results of exhaled air analysis for participants.
ParticipantVolume Fraction of 12CO2, %Volume Fraction of 13CO2 in Base Sample, %Volume Fraction of 13CO2 in Diagnostic Sample, %
Participant 14.7 ± 0.20.037 ± 0.0070.038 ± 0.007
Participant 26.2 ± 0.30.045 ± 0.0080.046 ± 0.008
Participant 34.3 ± 0.20.030 ± 0.0070.041 ± 0.008
Participant 44.6 ± 0.20.034 ± 0.0070.056 ± 0.008
Participant 54.4 ± 0.20.035 ± 0.0080.036 ± 0.007
Participant 65.7 ± 0.30.041 ± 0.0080.046 ± 0.008
Participant 75.2 ± 0.20.038 ± 0.0070.057 ± 0.008
Participant 83.8 ± 0.10.025 ± 0.0060.032 ± 0.007
Participant 95.0 ± 0.20.039 ± 0.0070.055 ± 0.008
Participant 105.1 ± 0.20.031 ± 0.0070.050 ± 0.008
Participant 116.3 ± 0.30.045 ± 0.0080.060 ± 0.009
Participant 125.4 ± 0.30.038 ± 0.0070.046 ± 0.008
Participant 134.6 ± 0.20.032 ± 0.0070.041 ± 0.008
Participant 146.1 ± 0.30.048 ± 0.0080.050 ± 0.008
Participant 156.3 ± 0.30.044 ± 0.0080.055 ± 0.009
Table 3. Results of δ13C change measurement for different participants.
Participantδ13C Difference, ‰Participantδ13C Difference, ‰
Participant 10.26 ± 0.02Participant 95.0 ± 0.2
Participant 20.76 ± 0.02Participant 105.6 ± 0.3
Participant 33.8 ± 0.2Participant 112.4 ± 0.05
Participant 47.4 ± 0.2Participant 122.3 ± 0.05
Participant 50.57 ± 0.02Participant 133.2 ± 0.05
Participant 61.3 ± 0.05Participant 140.6 ± 0.03
Participant 75.6 ± 0.3Participant 152.5 ± 0.05
Participant 82.6 ± 0.1
Table 4. Comparison of the IgG and UBT results.
ParticipantIgG ResultUBT Result
Participant 1negativenegative
Participant 2uncertainnegative
Participant 3uncertainuncertain
Participant 4positivepositive
Participant 5negativenegative
Participant 6uncertainnegative
Participant 7positivepositive
Participant 8uncertainnegative
Participant 9positivepositive
Participant 10negativepositive
Participant 11negativenegative
Participant 12uncertainnegative
Participant 13uncertainuncertain
Participant 14negativenegative
Participant 15positivenegative
Disclaimer/Publisher’s Note: The statements, opinions and data contained in all publications are solely those of the individual author(s) and contributor(s) and not of MDPI and/or the editor(s). MDPI and/or the editor(s) disclaim responsibility for any injury to people or property resulting from any ideas, methods, instructions or products referred to in the content.

