Abstract
Pathogenic Escherichia coli (E. coli) remains a safety concern in the preservation and quality of green leafy vegetables. Sugar–lectin interactions provide a reliable, specific, and effective sensing platform for the detection of bacteria as compared to the tedious conventional plate counting technique. Herein, we present the synthesis of 4-(N-mannosyl) benzoic acid (4-NMBA) and 4-thiophenyl-N-mannose (4-TNM) via a two-step reductive amination for the detection of E. coli using a quartz crystal microbalance (QCM) biosensor. The 4-NMBA was synthesized with mannose and para-aminobenzoic (4-PBA), while the 4-TNM was synthesized with mannose and 4-aminophenyl disulfide (4-AHP) using water and acetic acid in a 1:1 ratio. The resultant structure of mannose derivatives (4-NMBA and 4-TNM) was characterized and confirmed using analytical tools, such as Mass Spectrometer, SEM, and FTIR. The choice of ligands (mannose derivatives) is ascribed to the specific recognition of mannose to the FimH lectin of the type 1 pilus of E. coli. Furthermore, the 4-PBA and 4-AHP conjugated to mannose increase the ligand affinity to FimH lectins. The setup of the QCM biosensor was composed of modification of the crystal surface and the covalent attachment of ligands for the detection of E. coli. The piezoelectric effect (frequency shift of the quartz) was proportional to the change in mass added to the gold crystal surface. Both the 4-NMBA- and 4-TNM-coated QCM sensors had a limit of detection of 3.7 CFU/mL and 6.6 CFU/mL with a sensitivity of 2.56 × 10³ ng/mL and 8.99 × 10⁻⁵ ng/mL, respectively, within the dynamic range of 103 to 106 CFU/mL. This study demonstrates the application of ligand-coated QCM biosensors as a cost-effective, simple, and label-free technology for monitoring pathogenic bacteria via molecular interactions on crystal surfaces.
Keywords:
quartz crystal microbalance; sensor; bacterial enumeration; ligands; E. coli; FimH; selectivity 1. Introduction
Pathogenic bacteria pose a threat to food quality and water systems globally. E. coli is a commensal microorganism that naturally inhabits the intestinal tracts of warm-blooded animals to facilitate vitamin B12 synthesis [1]. Shiga toxin-producing E. coli (STEC) is an infectious strain of E.coli that causes pediatric hemolytic uremic syndrome (HUS) and acute gastroenteritis by the consumption of contaminated food and water [2,3]. The case of the hemolytic uremic syndrome and diarrhea outbreak in May 2011 was linked to Escherichia coli O104:H4, which recorded 810 cases and 39 deaths [4]. Furthermore, 9.4 million illnesses and 1351 deaths annually in the United States are attributed to foodborne infections. For instance, <1 CFU/mL of E. coli can cause detrimental effects in humans [5,6]. These alarming numbers call for researchers and healthcare practitioners to investigate and develop sensitive methods for detecting the presence of E. coli in contaminated food samples and water. The goal of this study is to design a mannose derivative for the detection of E. coli via a QCM biosensor.
Bacteria toxins bind to the carbohydrate derivatives present on cell surfaces. The adherence and binding affinity of bacteria to human cells is the beginning of their pathogenesis [7]. The attachment of bacteria to cells provides the basis for developing a biosensor that targets bacteria. For example, FimH is type 1 pili expressed in E. coli that binds to mannose [8,9]. Cumulative reports have shown that introducing hydrophobic groups and phenyl rings to mannose enhances the affinity between mannose and FimH lectin [8,10]. This idea is utilized in the design of biosensors. Conventional methods to detect and quantify foodborne pathogens in water systems and food products depend on reliable techniques and trained expertise. Furthermore, these instruments are time-consuming and function within a specific detection range. However, fluorescence [11], ELISA [12], and electrochemistry [13] are a few biosensors applied to rapidly detect foodborne pathogens [14]. The limitations of these detection methods increase the need to develop new rapid, reliable, portable, reagent-less, field-deployable, and inexpensive sensors.
Quartz crystal microbalance (QCM) is one method that has the potential for rapid and inexpensive detection [15]. However, low detection limits of bacteria using QCM biosensors is a challenge partly due to the sample size, and the resultant sensitivity is compromised by the interference of the matrix effect [15,16]. QCM is an acoustic (mass) piezoelectric sensing technology that detects minute changes in mass (ng, nanogram level). The change in mass of the analyte on the quartz surface is proportional to the oscillating frequency shift of the quartz, and this phenomenon is known as the piezoelectric effect [17,18]. In this regard, QCM sensing permits cost-effective, real-time monitoring of molecular interactions between sugar and lectin on a gold crystal surface. Notably, several QCM sensors have been developed to target proteins and viruses. Reports by Mao et al. [19] show the application of QCM biosensors to detect E. coli. The sensor was prepared with ssDNA probes complementary to a target DNA combined with nanoparticle amplification [19]. The work was completed by conjugating the DNA sequences to Fe3O4 nanoparticles via streptavidin to increase the frequency change with promising detection limits and sensitivity [19,20].
In this work, we demonstrated the synthesis of mannose-derived ligands (4-NMBA and 4-TNM have) for detecting E. coli via interaction with the FimH lectin, using QCM as a detection platform. First, 4-NMBA was synthesized using mannose and para-aminobenzoic acid, while the 4-TNM was synthesized using mannose and 4-aminophenyl disulfide [8]. The ligands were characterized using a mass spectrometer, SEM, and FTIR. Using the Sauerbrey equation [21,22], we could calculate the different masses of bacteria added to the mannose-derived coated gold crystal. This is the first study demonstrating the application of a QCM-based biosensor utilizing sugar–lectin interactions to directly detect bacteria using 11-mercaptoundecanoic (MUA) as a linker to attach the sugars to the gold-plated crystal surface. Our results showed low detection limits and low sensitivity. This study broadens the cost-effective and reliable methods available for detecting pathogenic bacteria.
2. Materials and Methods
2.1. Materials
D (+)-mannose, 11-mercaptoundecanoic acid(MUA), 4-aminophenyl disulfide, and tryptic soy broth were purchased from Sigma (St. Louis, MO, USA). Para-Aminobenzoic acid and N-(3-dimethyl aminopropyl)-N′-ethyl carbodiimide (EDC) were purchased from Fisher Scientific (Fair Lawn, NJ, USA). The borane–dimethylamine complex was purchased from Acros Organic (Beel, Belgium). N-hydroxysuccimide (NHS) was purchased from Pierce Chemical Company (Waltham, MA, USA). Escherichia coli (25922) were purchased from ATCC (Manassas, VA, USA). A quartz crystal analyzer model QCA917 from Seiko EG&G was used for all measurements. Furthermore, 10 MHz quartz crystals plated with gold were purchased from Princeton Applied Research (Berwyn, PA, USA.) All reagents were analytical grade. Aqueous solutions were prepared with nano-pure water with 18.2 MΩ specific resistance.
2.2. Synthesis of Mannose-Derived Ligands
Mannose derivative (4-NMBA) was synthesized by reacting the aldehyde group of D (+)-mannose and the amino group of para-aminobenzoic acid (reductive amination). Briefly, 20 mM of D (+)-mannose was dissolved in a 1:1 ratio of ultrapure water and acetic acid. Once completely dissolved, 22 mM of p-aminobenzoic acid was added to the reaction. The solutions were mixed and incubated in a sealed flask for 1 h at 20 °C. Amination of the reactants was achieved following this step. After incubation, a 50 mM borane–dimethylamine reducing agent was added to the reaction and incubated overnight to achieve the reduction step. The resulting product was filtered and washed with pure water to remove unreacted reagents. The final product was crystallized. A similar procedure was adapted for synthesizing 4-TNM using 4-aminophenyl disulfide, for which 11 mM concentration was utilized. The names and identities of the synthesized ligands were predicted using ChemDraw and confirmed with mass spectrometry [8].
2.3. Characterization of Mannose-Derived Ligands
Mass spectrometry characterization was performed for the mannose ligands to confirm the molecular structures. Both ligands were dissolved in liquid chromatography (LC) grade 50:50 mixture of acetic acid and water, followed by ESI-MS/MS analysis (Thermo Scientific LCQ, Fleet mass spectrometer) [8,23] to determine their molecular weights. The surface chemistry of mannose-derived ligands was visualized with scanning electron microscopy (SEM) performed at room temperature using JEOL SEM-2100F. Elemental analysis was determined by an energy-dispersive X-ray (EDX) analyzer. Fourier-transform infrared (FT-IR) spectra were recorded using a Shimadzu IRTracer-100 equipped with an ATR [24]. NMR characterization of the mannose derivatives was performed to determine the formation of a new amide bond between the mannose and the 4-PBA,4-AHP.
2.4. Fabrication of Mannose-Derived QCM Sensor
To design the mannose-derived QCM biosensor, the gold crystal was cleaned following a standard procedure, modified with the mannose derivatives or E. coli, and inserted into a cassette connected to the quartz crystal analyzer. Both frequency shifts of the sensor were measured as a function of time. The sensor fabrication consisted of the following steps: a 1 mM solution of 11-mercaptoundecanoic acid (MUA) was made using ethanol 200 proof. Gold-plated quartz crystals were incubated in the MUA solution overnight. After incubation, the gold crystals were rinsed with ethanol to remove excess MUA [25]. Carboxyl groups of MUA were then activated using EDC and NHS solution mixture in the ratio of 0.3 to 0.1 respectively. The crystal was then coated with a 10 mM solution of the modified mannose ligand for 1 h and rinsed with ultrapure water. The proposed chemistry of mannose-based ligands is depicted in Scheme 1. The unbound E. coli to the modified gold crystal was removed by incubating the sensor in 100 mM glycine solution. After each modification step, the crystal was inserted into the cassette for QCM measurements to determine the amount of individual mass added to the crystal.
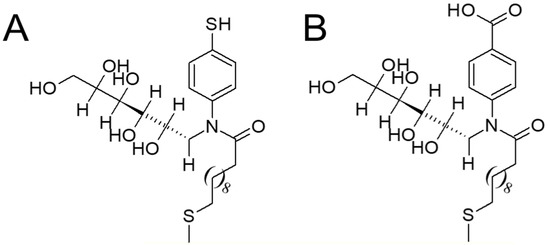
Scheme 1.
Schematic representation of immobilized MUA and mannose derivatives on gold quartz crystal. (A) 4-TNM (B) 4-NMBA.
2.5. Bacteria Sample Preparation
Tryptic soy broth (TSB) (30 g/L) was prepared by following the manufacturer’s instructions. E. coli were grown in TSB at 37 °C for 18 h. The bacteria cultures were centrifuged at 4000 rpm for 15 min, the supernatant was discarded, and the precipitates were dispersed in 0.1 M phosphate buffer (pH 7.02) [26]. This procedure was repeated to obtain a purified E. coli analyte. The bacteria concentration was adjusted with McFarland standards to achieve the desired concentration for optimal QCM detection. Subsequent serial dilution was performed to achieve the different concentrations of bacteria tested. Bacteria suspensions with a concentration of 103 to 106 CFU/mL were used as the samples.
2.6. Bacteria Detection Using QCM Immobilized Mannose Derivatives
E. coli on the QCM sensor surfaces was achieved via a micro-contact between the E. coli cells and the gold surfaces immobilized with mannose derivatives. The procedure entails pipetting an aliquot of 100 mL E. coli onto the modified gold crystal surface. The set-up was allowed to dry under nitrogen gas. The crystal was rinsed with ultrapure water to remove any unbound bacteria. The crystal was inserted into the cassette, and the change in frequency before and after the addition of the bacteria was measured (Scheme 2). The difference in mass was determined by using the Sauerbrey equation [22].
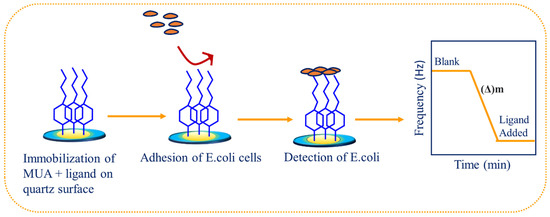
Scheme 2.
Schematic steps showing the detection of E. coli via mannose-derived QCM biosensor.
2.7. Statistical Analysis
Experiments were performed in three replicates (n = 3). The mean and standard deviations were calculated for each triplicate of masses. The differences between the mean were subjected to a one-way analysis of variance and t-test, and p < 0.05 was significant.
3. Result and Discussion
3.1. Synthesis of Mannose Derivatives
The synthesis of 4-NMBA was achieved by reacting para-aminobenzoic acid with mannose, while 4-TNM was formed from the reaction between mannose and 4-aminophenyl disulfide (6-AHP) following a revised protocol published elsewhere [8]. The choice of these ligands is based on the idea that hydrophobic (long-chain aliphatic groups) and phenyl rings attached to mannose enhance their affinity and selectivity towards FimH lectin. The resultant reaction products were white crystalline powders that were purified using suction filtration and characterized using analytical devices to confirm their morphology and structures. The aim of this study was mainly to develop a QCM biosensor that determines frequency changes when the mannose derivative binds to pili 1 FimH lectin of E. coli. The applied mass determines the frequency shift of the gold quartz on its surface according to the Sauerbrey relationship.
3.2. Mass Spectrometry Characterization
The synthesized ligands (4-NMBA and 4-TNM) were characterized by mass spectrometry (MS), as seen in Figure 1. MS with an ESI ion source was applied to determine the molecular weight of 4-NMBA and 4-TNM. In the positive ESI-MS/MS mode, the presence of an amino group causes the molecular weight to be observed as 302 Da. In addition, the sequential elimination of water residues and cleavage of the 4-PBA acid was revealed through a fragmentation pattern.
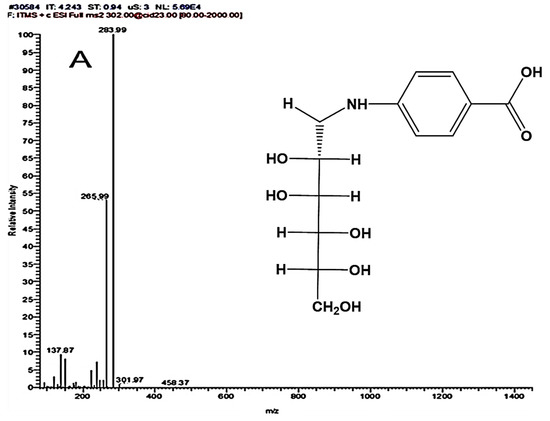
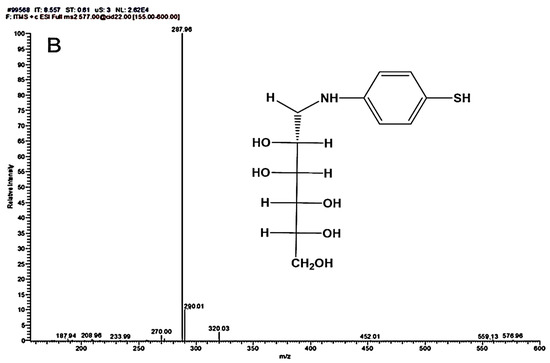
Figure 1.
MS/MS of mannose derivatives (A) 4-NMBA and (B) 4-TNM ligands showing the different fragmentation patterns. Inset: chemical structures of 4-NMBA and 4-TNM.
In the case of 4-TNM, dimerization of the molecule was unavoidable due to the solvent effect, and utilizing organic solvents did not provide clear tandem, despite eliminating dimerization. The 4-TNM dimer gives 572 Da under positive ESI conditions. However, 577 Da was obtained due to the presence of amino groups. ESI-MS/MS degradation pattern revealed cleavage of water residues, coalescence of degradation products, and peaks from the dimer as expected. Nevertheless, the molecular weights of the mannose derivatives were predicted from ChemDraw (Perkins Software). The MS/MS peaks revealed possible fragmentation that agrees with ChemDraw prediction. From Figure 1, the masses of 4-NMBA and 4-TNM are close to 265.99 m/z and 270.00 m/z, indicating the cleavage of the functional group of the mannose derivatives.
3.3. FTIR Characterizations
FTIR analysis was conducted to determine the functional groups present in mannose and to compare them to mannose derivatives (4-NMBA and 4-TNM). In Figure 2, the characteristic vibrations at 3500 cm−1—(OH group), 1760 cm−1 (C=O), and 1716 cm−1 (-COOH) belong to D-(+) mannose [27]. An amide bond is expected to form in the new mannose derivatives in addition to the carboxyl groups and thiol groups as the terminal functional groups of the derivatives. The vibration bands of the carboxyl (O-H) group at 3500–3200 cm−1 and C–O at 1320–1210 cm−1 appear in both 4-NMBA and 4-TNM; however, the peak for the amide bond at 2100 cm−1 was present in only derivatized mannose but was absent in mannose. This observation confirmed the formation of both 4-NMBA and 4-TNM. Furthermore, the peak of the thiol group was at 2600 cm−1. As seen in Figure 2, the distinct peaks of carboxylic acid and thiol groups are attributed to the 4-NMBA and 4-TNM mannose derivatives, respectively. It can be concluded that the mannose derivatives were successfully synthesized. Our results agree with reports on FTIR analysis of D-(+) mannose published elsewhere [27,28].
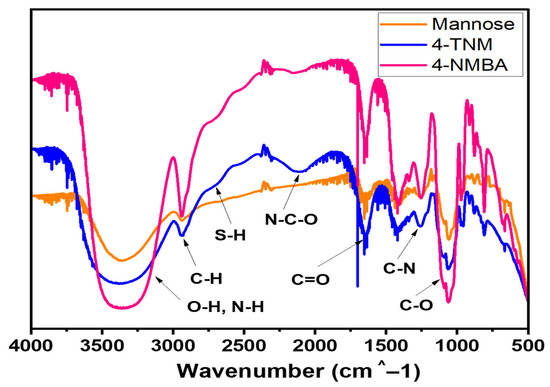
Figure 2.
FTIR analysis of mannose and mannose derivatives (4-NMBA and 4-TNM).
3.4. SEM Characterization of Mannose Derivatives
To determine the surface morphology of mannose derivatives for FimH lectin interaction, SEM characterizations were performed using JOEL 7001F SEM. The white crystal powder of the 4-NMBA and 4-TNM were deposited on a circular aluminum stub covered with double adhesive tape. The samples were then coated in a vacuum evaporator. The visualization was performed using an accelerating voltage of 5 kV [24]. SEM images of 4-NMBA show rod and spherical shapes(Figure 3A), whereas the 4-TNM were rod-shaped as seen in Figure 3B. The formation of these observable features of the 4-NMBA and 4-TNM could be attributed to the functional groups (-COOH and -SH) of the resultant product. Shape and function play an important role in cell–cell communications. However, it is worth stating that the 4-NMBA and 4-TNM facilitate the interaction with FimH lectin of the E. coli owing to the knowledge that aliphatic groups and aromatic rings attached to mannose enhance its selectivity and affinity to the FimH lectin.
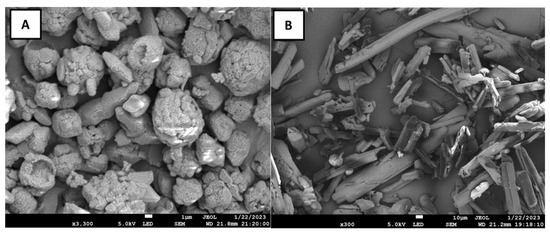
Figure 3.
SEM characterization of mannose derivatives. (A) 4-NMBA and (B) 4-TNM.3.5. NMR Characterization.
3.5. NMR Characterization
The NMR characterizations were performed to determine the amide bond formed after synthesizing the mannose derivatives. The 4-NMBA and 4-TNM showed a chemical shift of 6.7 and 7.9 attributed to the phenyl rings as compared to the shifts at 4.93 and 5.21 for only mannose. NMR data confirmed the successful synthesis of modified mannose, and the detailed characterizations are published in our work elsewhere [8].
3.6. Sensor Chemistry and Surface Design
The two modified mannose, 4-NMBA, and 4-TNM were synthesized by reductive amination and were applied as a sensor platform due to the interaction between mannose derivatives and the FimH lectin of type 1 pili of E. coli. The successful binding of E.coli to mannose derivatives on the surface of the quartz crystal has been demonstrated through changes in frequency and subsequent changes in mass determined by the Sauerbrey equation [22]. While other QCM-based bacteria sensors have been studied in the past, our approach is the first that uses novel mannose-derived ligands to detect E. coli. The sensor utilizes the 11-mecaptoundecanoic acid (MUA) linker due to its stability. Additionally, MUA is aliphatic and will interact with other aliphatic amino acids surrounding the carbohydrate-recognition domain of the FimH lectin. Furthermore, MUA was selected due to its simplified aliphatic structure with only one pKa value, and it provided good stability as a flexible linker [29]. Aliphatic groups, such as MUA, contribute to the increased affinity of mannose to FimH lectin [10]. The sensor was developed by following a stepwise modification approach. The modification of the gold crystal surface entails the following sequence. The addition of MUA is followed by the activation by the EDC/NHS, then the addition of the ligand. The addition of glycine removes the unbound ligand. Finally, the modified crystal then detects the E. coli (CFU/mL). It is worth noting that a baseline was established to determine and understand subsequent frequency changes upon adding the modified ligands and the bacteria during the modification and detection steps, respectively. Each modification step added mass to the crystal, which led to an altered frequency response [29]. The change in mass was determined by the Sauerbrey equation [22]. The final modification step entails the addition of mannose derivative to the gold crystal was applied to detect different concentrations of E.coli via FimH lectin interaction. The determined mass from the resultant frequency changes of the mannose derivatives and FimH lectin interaction have been summarized in Table 1.

Table 1.
Determined masses from each modification step of mannose-derived QCM biosensor to detect E. coli.
3.7. Detection of E. coli Using QCM Biosensor Immobilized with Mannose Derivatives
The detection of E. coli via carbohydrate and lectin interaction has been demonstrated with a mannose derivative immobilized QCM sensor. The fabrication of the QCM biosensor using 4-NMBA and 4-TNM was carefully achieved through a sequential modification. The purpose of each modification was to introduce aliphatic groups to the gold crystal surface before adding derivatized mannose. The aliphatic groups increase the selectivity of mannose derivatives to the FimH lectin. Figure 4 shows the stepwise changes in the frequency of the gold crystal dependent on time for each modification step and the detection of E.coli over the range of 1 × 10³ CFU/mL to 1 × 10⁶ CFU/mL. Each graph represents a different concentration of E. coli tested with 4-NMBA.
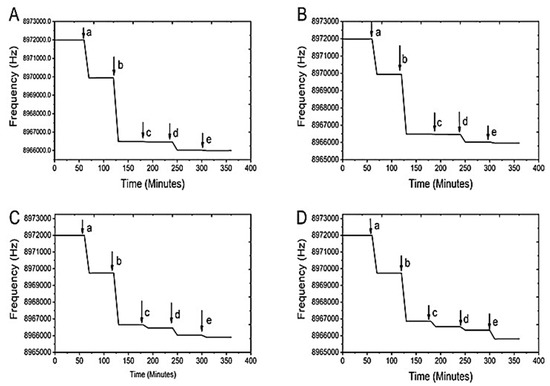
Figure 4.
Stepwise modifications of the crystal 4-NMBA. (A) Represents the experiment with an E. coli concentration of 1 × 10³ CFU/mL, (B) 1 × 10⁴ CFU/mL, (C) 1 × 10⁵ CFU/mL, and (D) 1 × 10⁶ CFU/mL. For each graph, (a) represents the addition of the linker molecule MUA, (b) is the activation of the carboxyl group by EDC/NHS, (c) is the addition of the ligand, (d) is the addition of glycine (remove unbound ligand), and (e) is the detection of the E. coli.
The detectable frequency for each modification step is represented by a letter at the end of each horizontal line. Specifically, (a) shows MUA addition to the ligands, (b) shows the EDC/NHS coupling, (c) shows the addition of the mannose derivative, (d) shows the addition of glycine, and (e) shows the addition of different concentration of E. coli. The frequencies from each modification were converted into masses using the Sauerbrey equation [17,21]. Further calculations were performed to quantify the E. coli cells attached to the crystal surface. Figure 5 shows the frequency response from the immobilization of 4-TNM ligands on the QCM gold quartz crystal and its successive modification steps for the detection of E.coli over the concentration range of 1 × 10³ CFU/mL to 1 × 10⁶ CFU/mL.
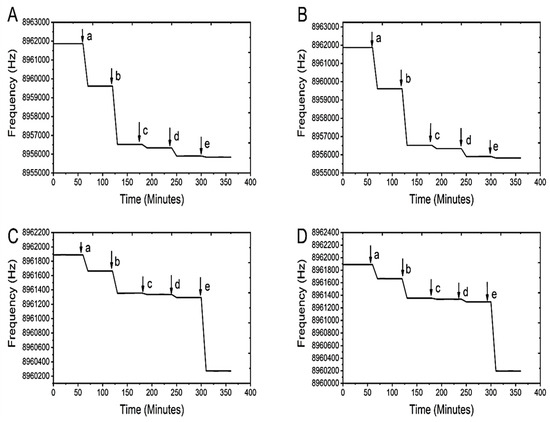
Figure 5.
Stepwise modifications of the crystal using 4-TNM. Each plot represents the experiment with an E. coli concentration of (A) 1 × 10³ CFU/mL, (B) 1 × 10⁴ CFU/mL, (C) 1 × 10⁵ CFU/mL, and (D) 1 × 10⁶ CFU/mL. For each graph, (a) represents the addition of the linker molecule MUA, (b) represents the activation of the carboxyl group by EDC/NHS, (c) is the addition of the ligand, (d) represents the addition of glycine, and (e) is the detection of the E. coli.
It is worth noting that there is an inverse trend between frequency and the added mass on the surface of the gold crystal. The increase in mass leads to a reduction of the crystal frequency. The difference in frequency of the quartz crystal is proportional to the mass on the surface of the crystal. After the modification steps, adding E. coli to the crystal resulted in a mass change of 3.796 ng for the 4-NMBA (Figure 4) and 314.2 ng for the 4-TNM (Figure 5). Assuming that one E. coli cell weighs 1 picogram, this equates to 3796 bacterial cells. The number of E. coli cells for the 4-TNM was significantly higher and can be attributed to the fact that 4-TNM has two primary amine groups [8].
The calibration plots for 4-NMBA and 4-TNM are shown in Figure 6. The changes in mass determined from the frequencies of the detected E. coli were plotted against the concentrations of each ligand. From these data, the sensitivity of the 4-NMBA ligand was determined to be 2.56 × 10⁻⁵ ngCFU/mL, and the sensitivity of the 4-TNM ligand was determined to be 8.99 × 10⁻⁵ ng/mL. From the results, the interaction between mannose derivatives and the FimH lectin yielded small changes in mass [8], hence increased sensitivity as compared to the individual modification steps shown in Table 1. However, the non-linearity of the 4-TNM could be attributed to factors including the functionality of the ligand, over-oversaturation, or less uniform coating during each modification step. Experiments were performed in triplicates, with standard deviations of 0.023 and 0.118, respectively. The limit of detection was calculated to be 3.7 CFU/mL for 4-NMBA and 6.6 CFU/mL for 4-TNM.
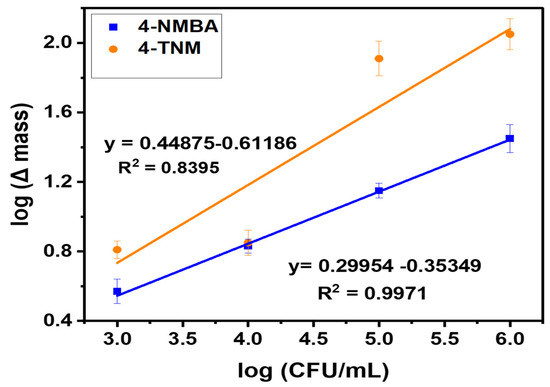
Figure 6.
Calibration curve for 4—NMBA ligand and 4—TNM ligand. N = 3 with standard deviations of 0.023 and 0.118, respectively.
Table 1 summarizes the changes in mass for adding each modifying molecule to the crystal to detect different concentrations of E. coli. Figure S1 (in Supplementary Materials) shows the mass difference obtained for the individual modification steps in developing the QCM Biosensor. Quartz crystal microbalance has recently been used in sensing applications due to the need for accurate and ultrasensitive detection methods. For a typical quartz crystal microbalance, 1 Hertz has a lower limit of 1 nanogram of detection [30]. If the weight of one bacterium is 1 picogram, then the latter relationship explains the lowest achievable limit of bacteria detection using a QCM biosensor [30,31].
3.8. Performance Analysis of QCM-Based Mannose Derivative to Other Sensors
Several sensors have been reported for the detection of E. coli. The results from these sensors show that the sensor’s performance is based on the choice of the ligand and the mechanism of detection. A comparative analysis of this work and recent developments in bacterial sensors has been illustrated in Table 2. The mannose derivatives (4-NMBA and 4-TNM) show a superior specificity and sensitivity compared to other sensors in Table 2 owing to the low detection limit.
Table 2.
Comparative analysis of mannose-derived QCM biosensor to other sensors.
3.9. Selectivity Sensitivity, Repeatability, and Reproducibility of Mannose Derivatives to E. coli
Carbohydrate–lectin interactions at the surface of the host and pathogen reveal a crucial role in determining infections [30]. The selectivity and specificity of the carbohydrate–lectin interactions are necessary for the design of a reliable and robust biosensor. The detection of E. coli using QCM immobilized mannose derivatives is highly specific and sensitive due to mannose interaction with the FimH lectin. This selectivity study was performed on E. coli (model organism), Staphylococcus epidermidis, and Bacillus subtilis [38]. The choice of microorganism was based on the difference in the gram(-) and gram (+) [30]. It is expected that the bacteria with FimH lectin will bind to the mannose derivative, and the absence of FimH will lead to a low binding affinity. In Figure 7, our results showed that the mannose derivative shows 100% high specificity and sensitivity to E. coli, (gram(-)) due to enhanced derivatized mannose interaction with E. coli as compared to S. epidermidis (20%) and B. subtilis (15%). Fimbriae are short projections on the bacterial surface. FimH is an adhesive type 1 fimbria protein composed of two domains, namely an N-terminal (mannose-binding lectin domain) and a C-terminal pilin domain. FimH is expressed in enterobacteria (gram-negative E.coli) [30,39]. The basis of the carbohydrate–lectin interactions has led to the design of several sensors for the detection of pathogenic bacteria [40].
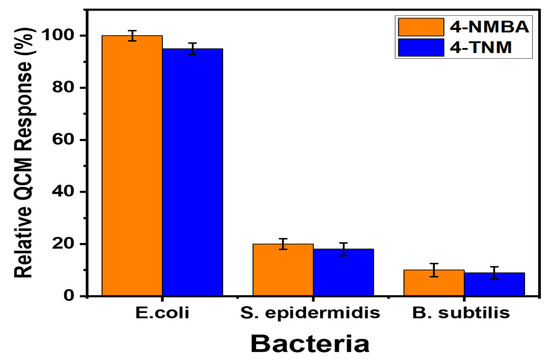
Figure 7.
Selectivity for E. coli compared to S. epidermidis and B. subtilis.
To promote the practical application of mannose-derivatized QCM biosensors, reproducibility, and repeatability experiments were performed following the protocol described in the experimental section above. The repeatability experiment was performed using the same gold crystal after seven successive experiments (n = 7). Briefly, the ligands (4-NMBA and 4-TNM) were successfully immobilized on the gold crystal along with the MUA linker molecule. The MUA was then activated by using EDC/NHS. The unbound ligand was removed by the addition of glycine. Finally, the prepared gold crystal was applied to detect E. coli. The results from the repeatability studies gave a standard deviation (SD) of 0.033 and 0.215 for 4-NMBA and 4-TNM, respectively. The reproducibility experiments (n = 7) were performed following a similar protocol and showed an SD of 0.023 (R2 = 0.9964) and 0.118 (R2 = 0.852) for 4-NMBA and 4-TNM, respectively. These results show the suitable application of the QCM biosensor for the detection of bacteria that express FimH lectins.
4. Conclusions
We have successfully designed and tested a new method for detecting E. coli by quartz crystal microbalance immobilized with mannose derivative via the high-affinity interaction between mannose and the FimH lectin. Two mannose derivatives (4-NMBA and 4-TNM) were synthesized via reductive amination and applied in the QCM biosensor fabrication. After the QCM experimentation, the 4-NMBA yielded a mass of 3.796 ng when it adhered to E. coli on a modified crystal. The 4-TNM ligand was synthesized from 4-aminophenyl disulfide and mannose, resulting in a mass of 314.2 ng when it interacted with E. coli. The sensitivity of the 4-NMBA ligand was determined to be 2.56 × 10⁻⁵ ng/mL, and the sensitivity of the 4-TNM ligand was determined to be 8.99 × 10⁻⁵ ng/mL. This study shows the suitability of the QCM biosensors to detect pathogenic bacteria as demonstrated in several reports.
Supplementary Materials
The following supporting information can be downloaded at: https://www.mdpi.com/article/10.3390/bios13030337/s1, Figure S1: Individual mass changes for each modification step and detection of the pathogen for 4-PBAligand. (A) shows the addition of MUA, (B) shows the addition of EDC/NHS, (C) shows the addition of the ligand, (D) shows the addition of glycine, and (E) shows the addition of 1 × 10³ CFU/mL E. coli; Figure S2: Individual mass changes for each modification step and detection of the pathogen for 4-PBA ligand. (A) shows the addition of MUA, (B) shows the addition of EDC/NHS, (C) shows the addition of the ligand, (D) shows the addition of glycine, and (E) shows the addition of 1 × 10⁴ CFU/mL E. coli; Figure S3: Individual mass changes for each modification step and detection of pathogen for 4-PBA ligand. (A) shows the addition of MUA, (B) shows the addition of EDC/NHS, (C) shows the addition of the ligand, (D) shows the addition of glycine, and (E) shows the addition of 1 × 10⁵ CFU/mL E. coli; Figure S4: Individual mass changes for each modification step and detection of pathogen for 4-PBA ligand. (A) shows the addition of MUA, (B) shows the addition of EDC/NHS, (C) shows the addition of the ligand, (D) shows the addition of glycine, and (E) shows the addition of 1 × 10⁶ CFU/mL E. coli; Figure S5: Individual mass changes for each modification step and detection of pathogen for 6-AHPligand. (A) shows the addition of MUA, (B) shows the addition of EDC/NHS, (C) shows the addition of the ligand, (D) shows the addition of glycine, and (E) shows the addition of 1 × 10³ CFU/mL E. coli; Figure S6: Individual mass changes for each modification step and detection of pathogen for 6-AHP ligand. (A) shows the addition of MUA, (B) shows the addition of EDC/NHS, (C) shows the addition of the ligand, (D) shows the addition of glycine, and (E) shows the addition of 1 × 10⁴ CFU/mL E. coli; Figure S7: Individual mass changes for each modification step and detection of pathogen for 6-AHP (A) shows the addition of MUA, (B) shows the addition of EDC/NHS, (C) shows the addition of the ligand, (D) shows the addition of glycine, and (E) shows the addition of 1 × 10⁵ CFU/mL E. coli; Figure S8: Individual mass changes for each modification step and detection of pathogen for 6-AHP ligand. (A) shows the addition of MUA, (B) shows the addition of EDC/NHS, (C) shows the addition of the ligand, (D) shows the addition of glycine, and (E) shows the addition of 1 × 10⁶ CFU/mL E. coli.
Author Contributions
Conceptualization, O.A.S.; methodology, O.A.S.; validation, G.B.E., H.A.C. and I.Y.; formal analysis, H.A.C. and G.B.E.; investigation, L.C.; resources, O.A.S.; data curation, G.B.E., H.A.C. and L.C.; writing—original draft preparation, O.A.S., H.A.C. and G.B.E.; writing—review and editing, O.A.S., H.A.C. and G.B.E.; visualization, L.C.; supervision, O.A.S.; project administration, O.A.S.; funding acquisition, O.A.S. All authors have read and agreed to the published version of the manuscript.
Funding
The authors acknowledge the National Science Foundation Grant #IOS-1543944, NJIT Start-Ups, and the Bill & Melinda Gates Foundation for funding.
Institutional Review Board Statement
Not Applicable.
Informed Consent Statement
Not Applicable.
Data Availability Statement
Not Applicable.
Conflicts of Interest
The authors declare no conflict of interest. The funders had no role in the design of this study; in the collection, analyses, or interpretation of data; in the writing of the manuscript; or in the decision to publish the results.
References
- Fang, H.; Li, D.; Kang, J.; Jiang, P.; Sun, J.; Zhang, D. Metabolic engineering of Escherichia coli for de novo biosynthesis of vitamin B12. Nat. Commun. 2018, 9, 4917. [Google Scholar] [CrossRef]
- Bruyand, M.; Mariani-Kurkdjian, P.; Gouali, M.; de Valk, H.; King, L.; Le Hello, S.; Bonacorsi, S.; Loirat, C. Hemolytic uremic syndrome due to Shiga toxin-producing Escherichia coli infection. Med. Mal. Infect. 2018, 48, 167–174. [Google Scholar] [CrossRef]
- Thomas, D.E.; Elliott, E.J. Interventions for preventing diarrhea-associated hemolytic uremic syndrome: Systematic review. BMC Public Heal. 2013, 13, 799. [Google Scholar] [CrossRef] [PubMed]
- Bielaszewska, M.; Mellmann, A.; Zhang, W.; Köck, R.; Fruth, A.; Bauwens, A.; Peters, G.; Karch, H. Characterisation of the Escherichia coli strain associated with an outbreak of haemolytic uraemic syndrome in Germany, 2011: A microbiological study. Lancet Infect. Dis. 2011, 11, 671–676. [Google Scholar] [CrossRef]
- Scallan, E.; Hoekstra, R.M.; Mahon, B.E.; Jones, T.F.; Griffin, P.M. An assessment of the human health impact of seven leading foodborne pathogens in the United States using disability adjusted life years. Epidemiol. Infect. 2015, 143, 2795–2804. [Google Scholar] [CrossRef] [PubMed]
- Zhang, Y.; Xu, C.-Q.; Guo, T.; Hong, L. An automated bacterial concentration and recovery system for pre-enrichment required in rapid Escherichia coli detection. Sci. Rep. 2018, 8, 1–8. [Google Scholar] [CrossRef] [PubMed]
- Semchenko, E.A.; Everest-Dass, A.V.; Jen, F.E.-C.; Mubaiwa, T.D.; Day, C.J.; Seib, K.L. Glycointeractome of Neisseria gonorrhoeae: Identification of Host Glycans Targeted by the Gonococcus To Facilitate Adherence to Cervical and Urethral Epithelial Cells. Mbio 2019, 10, e01339-19. [Google Scholar] [CrossRef]
- Yazgan, I.; Noah, N.M.; Toure, O.; Zhang, S.; Sadik, O.A. Biosensor for selective detection of E. coli in spinach using the strong affinity of derivatized mannose with fimbrial lectin. Biosens. Bioelectron. 2014, 61, 266–273. [Google Scholar] [CrossRef] [PubMed]
- Ielasi, F.S.; Alioscha-Perez, M.; Donohue, D.; Claes, S.; Sahli, H.; Schols, D.; Willaert, R.G. Lectin-Glycan Interaction Network-Based Identification of Host Receptors of Microbial Pathogenic Adhesins. Mbio 2016, 7, e00584-16. [Google Scholar] [CrossRef]
- Disney, M.D.; Seeberger, P.H. The Use of Carbohydrate Microarrays to Study Carbohydrate-Cell Interactions and to Detect Pathogens. Chem. Biol. 2004, 11, 1701–1707. [Google Scholar] [CrossRef]
- Cheng, C.; Yang, L.; Zhong, M.; Deng, W.; Tan, Y.; Xie, Q.; Yao, S. Au nanocluster-embedded chitosan nanocapsules as labels for the ultrasensitive fluorescence immunoassay of Escherichia coli O157:H7. Analyst 2018, 143, 4067–4073. [Google Scholar] [CrossRef]
- Pang, B.; Zhao, C.; Li, L.; Song, X.; Xu, K.; Wang, J.; Liu, Y.; Fu, K.; Bao, H.; Song, D.; et al. Development of a low-cost paper-based ELISA method for rapid Escherichia coli O157:H7 detection. Anal. Biochem. 2018, 542, 58–62. [Google Scholar] [CrossRef]
- Giovanni, M.; Setyawati, M.I.; Tay, C.Y.; Qian, H.; Kuan, W.S.; Leong, D.T. Electrochemical quantification of Escherichia coli with DNA nanostructure. Adv. Funct. Mater. 2015, 25, 3840–3846. [Google Scholar] [CrossRef]
- Hu, R.-R.; Yin, Z.-Z.; Zeng, Y.-B.; Zhang, J.; Liu, H.-Q.; Shao, Y.; Ren, S.-B.; Li, L. A novel biosensor for Escherichia coli O157:H7 based on fluorescein-releasable biolabels. Biosens. Bioelectron. 2016, 78, 31–36. [Google Scholar] [CrossRef]
- Jiang, X.; Wang, R.; Wang, Y.; Su, X.; Ying, Y.; Wang, J.; Li, Y. Evaluation of different micro/nanobeads used as amplifiers in QCM immunosensor for more sensitive detection of E. coli O157:H7. Biosens. Bioelectron. 2011, 29, 23–28. [Google Scholar] [CrossRef] [PubMed]
- Pohanka, M. QCM immunosensor for the determination of Staphylococcus aureus antigen. Chem. Pap. 2019, 74, 451–458. [Google Scholar] [CrossRef]
- Yilmaz, E.; Majidi, D.; Ozgur, E.; Denizli, A. Whole cell imprinting based Escherichia coli sensors: A study for SPR and QCM. Sens. Actuators B Chem. 2015, 209, 714–721. [Google Scholar] [CrossRef]
- Yu, X.; Chen, F.; Wang, R.; Li, Y. Whole-bacterium SELEX of DNA aptamers for rapid detection of E.coli O157:H7 using a QCM sensor. J. Biotechnol. 2018, 266, 39–49. [Google Scholar] [CrossRef]
- Mao, X.; Yang, L.; Su, X.-L.; Li, Y. A nanoparticle amplification based quartz crystal microbalance DNA sensor for detection of Escherichia coli O157:H7. Biosens. Bioelectron. 2006, 21, 1178–1185. [Google Scholar] [CrossRef]
- Wang, L.; Wei, Q.; Wu, C.; Hu, Z.; Ji, J.; Wang, P. The Escherichia coli O157:H7 DNA detection on a gold nanoparticle-enhanced piezoelectric biosensor. Sci. Bull. 2008, 53, 1175–1184. [Google Scholar] [CrossRef]
- Kankare, J. Sauerbrey Equation of Quartz Crystal Microbalance in Liquid Medium. Langmuir 2002, 18, 7092–7094. [Google Scholar] [CrossRef]
- Sohna, J.E.S.; Cooper, M.A. Does the Sauerbrey equation hold true for binding of peptides and globular proteins to a QCM?: A systematic study of mass dependence of peptide and protein binding with a piezoelectric sensor. Sens. Bio-Sens. Res. 2016, 11, 71–77. [Google Scholar] [CrossRef]
- Wang, J.; Zhao, J.; Nie, S.; Xie, M.; Li, S. Mass spectrometry for structural elucidation and sequencing of carbohydrates. TrAC Trends Anal. Chem. 2021, 144, 116436. [Google Scholar] [CrossRef]
- Ejaz, S.; Ihsan, A.; Noor, T.; Shabbir, S.; Imran, M. Mannose functionalized chitosan nanosystems for enhanced antimicrobial activity against multidrug resistant pathogens. Polym. Test. 2020, 91, 106814. [Google Scholar] [CrossRef]
- Yang, H.; Zhou, H.; Hao, H.; Gong, Q.; Nie, K. Detection of Escherichia coli with a label-free impedimetric biosensor based on lectin functionalized mixed self-assembled monolayer. Sens. Actuators B Chem. 2016, 229, 297–304. [Google Scholar] [CrossRef]
- Osonga, F.J.; Akgul, A.; Yazgan, I.; Akgul, A.; Ontman, R.; Kariuki, V.M.; Eshun, G.B.; Sadik, O.A. Flavonoid-derived anisotropic silver nanoparticles inhibit growth and change the expression of virulence genes in Escherichia coli SM10. RSC Adv. 2018, 8, 4649–4661. [Google Scholar] [CrossRef]
- Pawde, D.M.; Viswanadh, M.K.; Mehata, A.K.; Sonkar, R.; Narendra; Poddar, S.; Burande, A.S.; Jha, A.; Vajanthri, K.Y.; Mahto, S.K.; et al. Mannose receptor targeted bioadhesive chitosan nanoparticles of clofazimine for effective therapy of tuberculosis. Saudi Pharm. J. 2020, 28, 1616–1625. [Google Scholar] [CrossRef]
- Kumar, R.; Kratzer, D.; Cheng, K.; Prisby, J.; Sugai, J.; Giannobile, W.V.; Lahann, J. Carbohydrate-Based Polymer Brushes Prevent Viral Adsorption on Electrostatically Heterogeneous Interfaces. Macromol. Rapid Commun. 2018, 40, e1800530. [Google Scholar] [CrossRef]
- Ertekin; Öztürk, S.; Öztürk, Z.Z. Label Free QCM Immunobiosensor for AFB1 Detection Using Monoclonal IgA Antibody as Recognition Element. Sensors 2016, 16, 1274. [Google Scholar] [CrossRef]
- Bouckaert, J.; Berglund, J.; Schembri, M.; De Genst, E.; Cools, L.; Wuhrer, M.; Hung, C.-S.; Pinkner, J.; Slättegård, R.; Zavialov, A.; et al. Receptor Binding Studies Disclose a Novel Class of High-Affinity Inhibitors of the Escherichia Coli FimH Adhesin. Mol. Microbiol. 2004, 55, 441–455. [Google Scholar] [CrossRef]
- March, C.; García, J.V.; Sánchez; Arnau, A.; Jiménez, Y.; García, P.; Manclús, J.J.; Montoya, Á. High-frequency phase shift measurement greatly enhances the sensitivity of QCM immunosensors. Biosens. Bioelectron. 2015, 65, 1–8. [Google Scholar] [CrossRef]
- Lin, D.; Pillai, R.G.; Lee, W.E.; Jemere, A.B. An impedimetric biosensor for E. coli O157: H7 based on the use of self-assembled gold nanoparticles and protein G. Microchim. Acta 2019, 186, 1–9. [Google Scholar] [CrossRef]
- Peng, H.; Chen, I.A. Rapid Colorimetric Detection of Bacterial Species through the Capture of Gold Nanoparticles by Chimeric Phages. ACS Nano 2019, 13, 1244–1252. [Google Scholar] [CrossRef]
- Zhang, J.; Jiang, Y.; Xia, X.; Wu, J.; Almeida, R.; Eda, S.; Qi, H. An on-site, highly specific immunosensor for Escherichia coli detection in field milk samples from mastitis-affected dairy cattle. Biosens. Bioelectron. 2020, 165, 112366. [Google Scholar] [CrossRef]
- Wandermur, G.; Rodrigues, D.; Allil, R.; Queiroz, V.; Peixoto, R.; Werneck, M.; Miguel, M. Plastic optical fiber-based biosensor platform for rapid cell detection. Biosens. Bioelectron. 2014, 54, 661–666. [Google Scholar] [CrossRef] [PubMed]
- Yaghubi, F.; Zeinoddini, M.; Saeedinia, A.R.; Azizi, A.; Nemati, A.S. Design of Localized Surface Plasmon Resonance (LSPR) Biosensor for Immunodiagnostic of E. coli O157:H7 Using Gold Nanoparticles Conjugated to the Chicken Antibody. Plasmonics 2020, 15, 1481–1487. [Google Scholar] [CrossRef]
- Suaifan, G.A.; Alhogail, S.; Zourob, M. Paper-based magnetic nanoparticle-peptide probe for rapid and quantitative colorimetric detection of Escherichia coli O157:H7. Biosens. Bioelectron. 2017, 92, 702–708. [Google Scholar] [CrossRef] [PubMed]
- Weaver, W.M.; Dharmaraja, S.; Milisavljevic, V.; Di Carlo, D. The effects of shear stress on isolated receptor–ligand interactions of Staphylococcus epidermidis and human plasma fibrinogen using molecularly patterned microfluidics. Lab Chip 2011, 11, 883–889. [Google Scholar] [CrossRef]
- Sarshar, M.; Behzadi, P.; Ambrosi, C.; Zagaglia, C.; Palamara, A.T.; Scribano, D. FimH and Anti-Adhesive Therapeutics: A Disarming Strategy Against Uropathogens. Antibiotics 2020, 9, 397. [Google Scholar] [CrossRef]
- Di Maio, A.; Cioce, A.; Achilli, S.; Thépaut, M.; Vivès, C.; Fieschi, F.; Rojo, J.; Reichardt, N.-C. Controlled density glycodendron microarrays for studying carbohydrate–lectin interactions. Org. Biomol. Chem. 2021, 19, 7357–7362. [Google Scholar] [CrossRef]
Disclaimer/Publisher’s Note: The statements, opinions and data contained in all publications are solely those of the individual author(s) and contributor(s) and not of MDPI and/or the editor(s). MDPI and/or the editor(s) disclaim responsibility for any injury to people or property resulting from any ideas, methods, instructions or products referred to in the content. |
© 2023 by the authors. Licensee MDPI, Basel, Switzerland. This article is an open access article distributed under the terms and conditions of the Creative Commons Attribution (CC BY) license (https://creativecommons.org/licenses/by/4.0/).