Non-Invasive Microwave-Based Imaging System for Early Detection of Breast Tumours

 , ,
, ,  ,
,  ,
,  ,
,  ,
,  and
and 
Abstract
1. Introduction
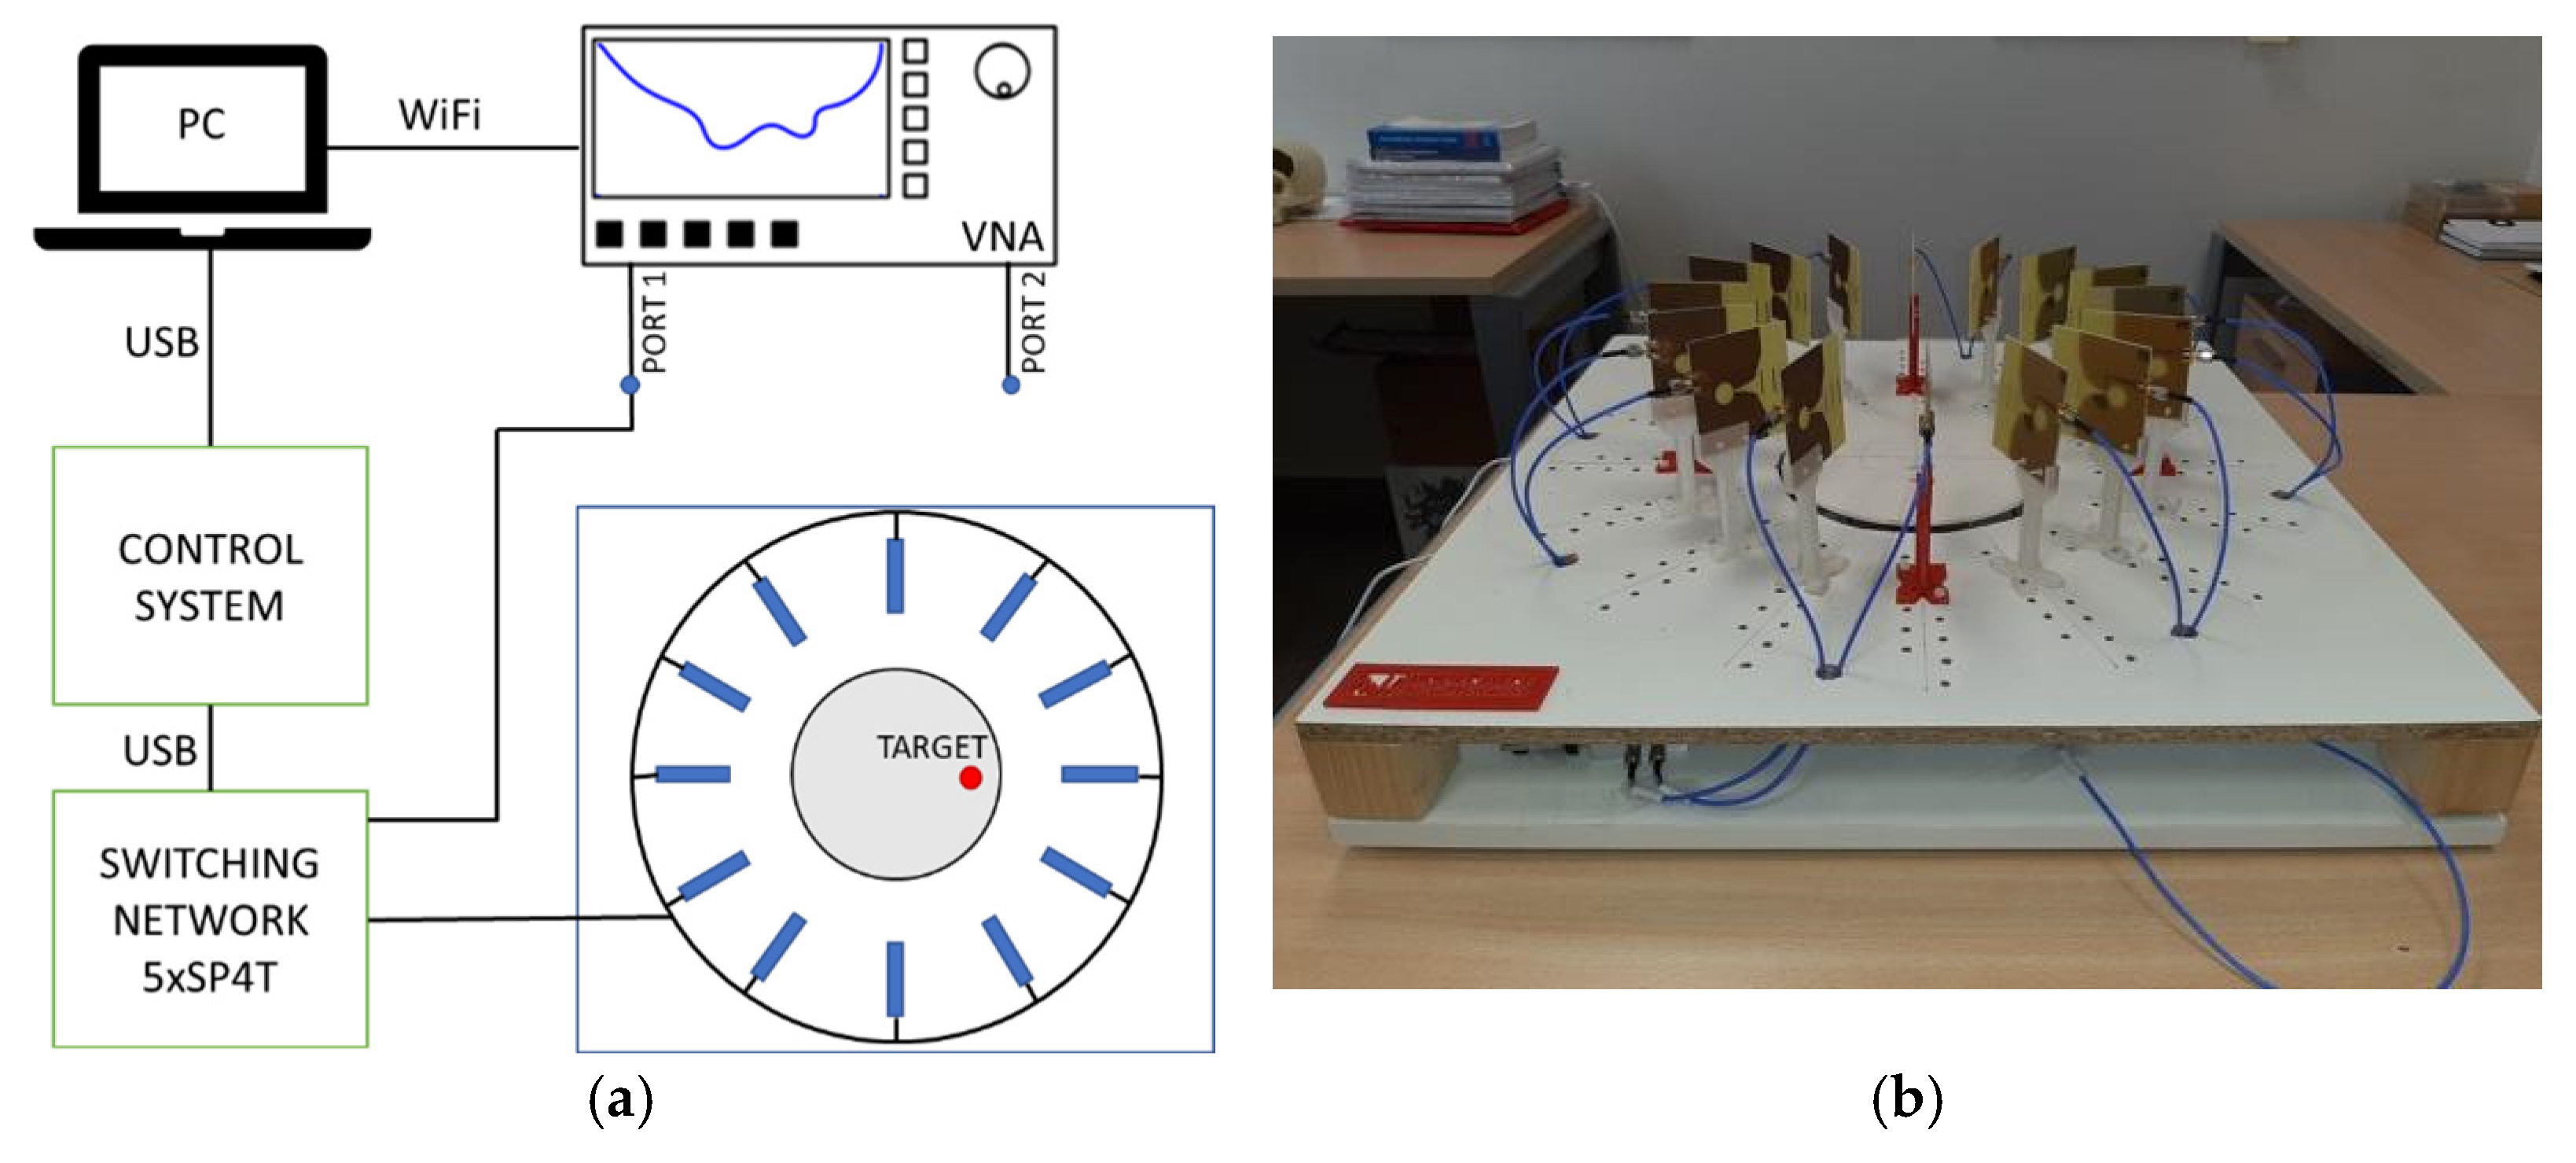
2. Microwave System for Early Detection of Breast Tumours
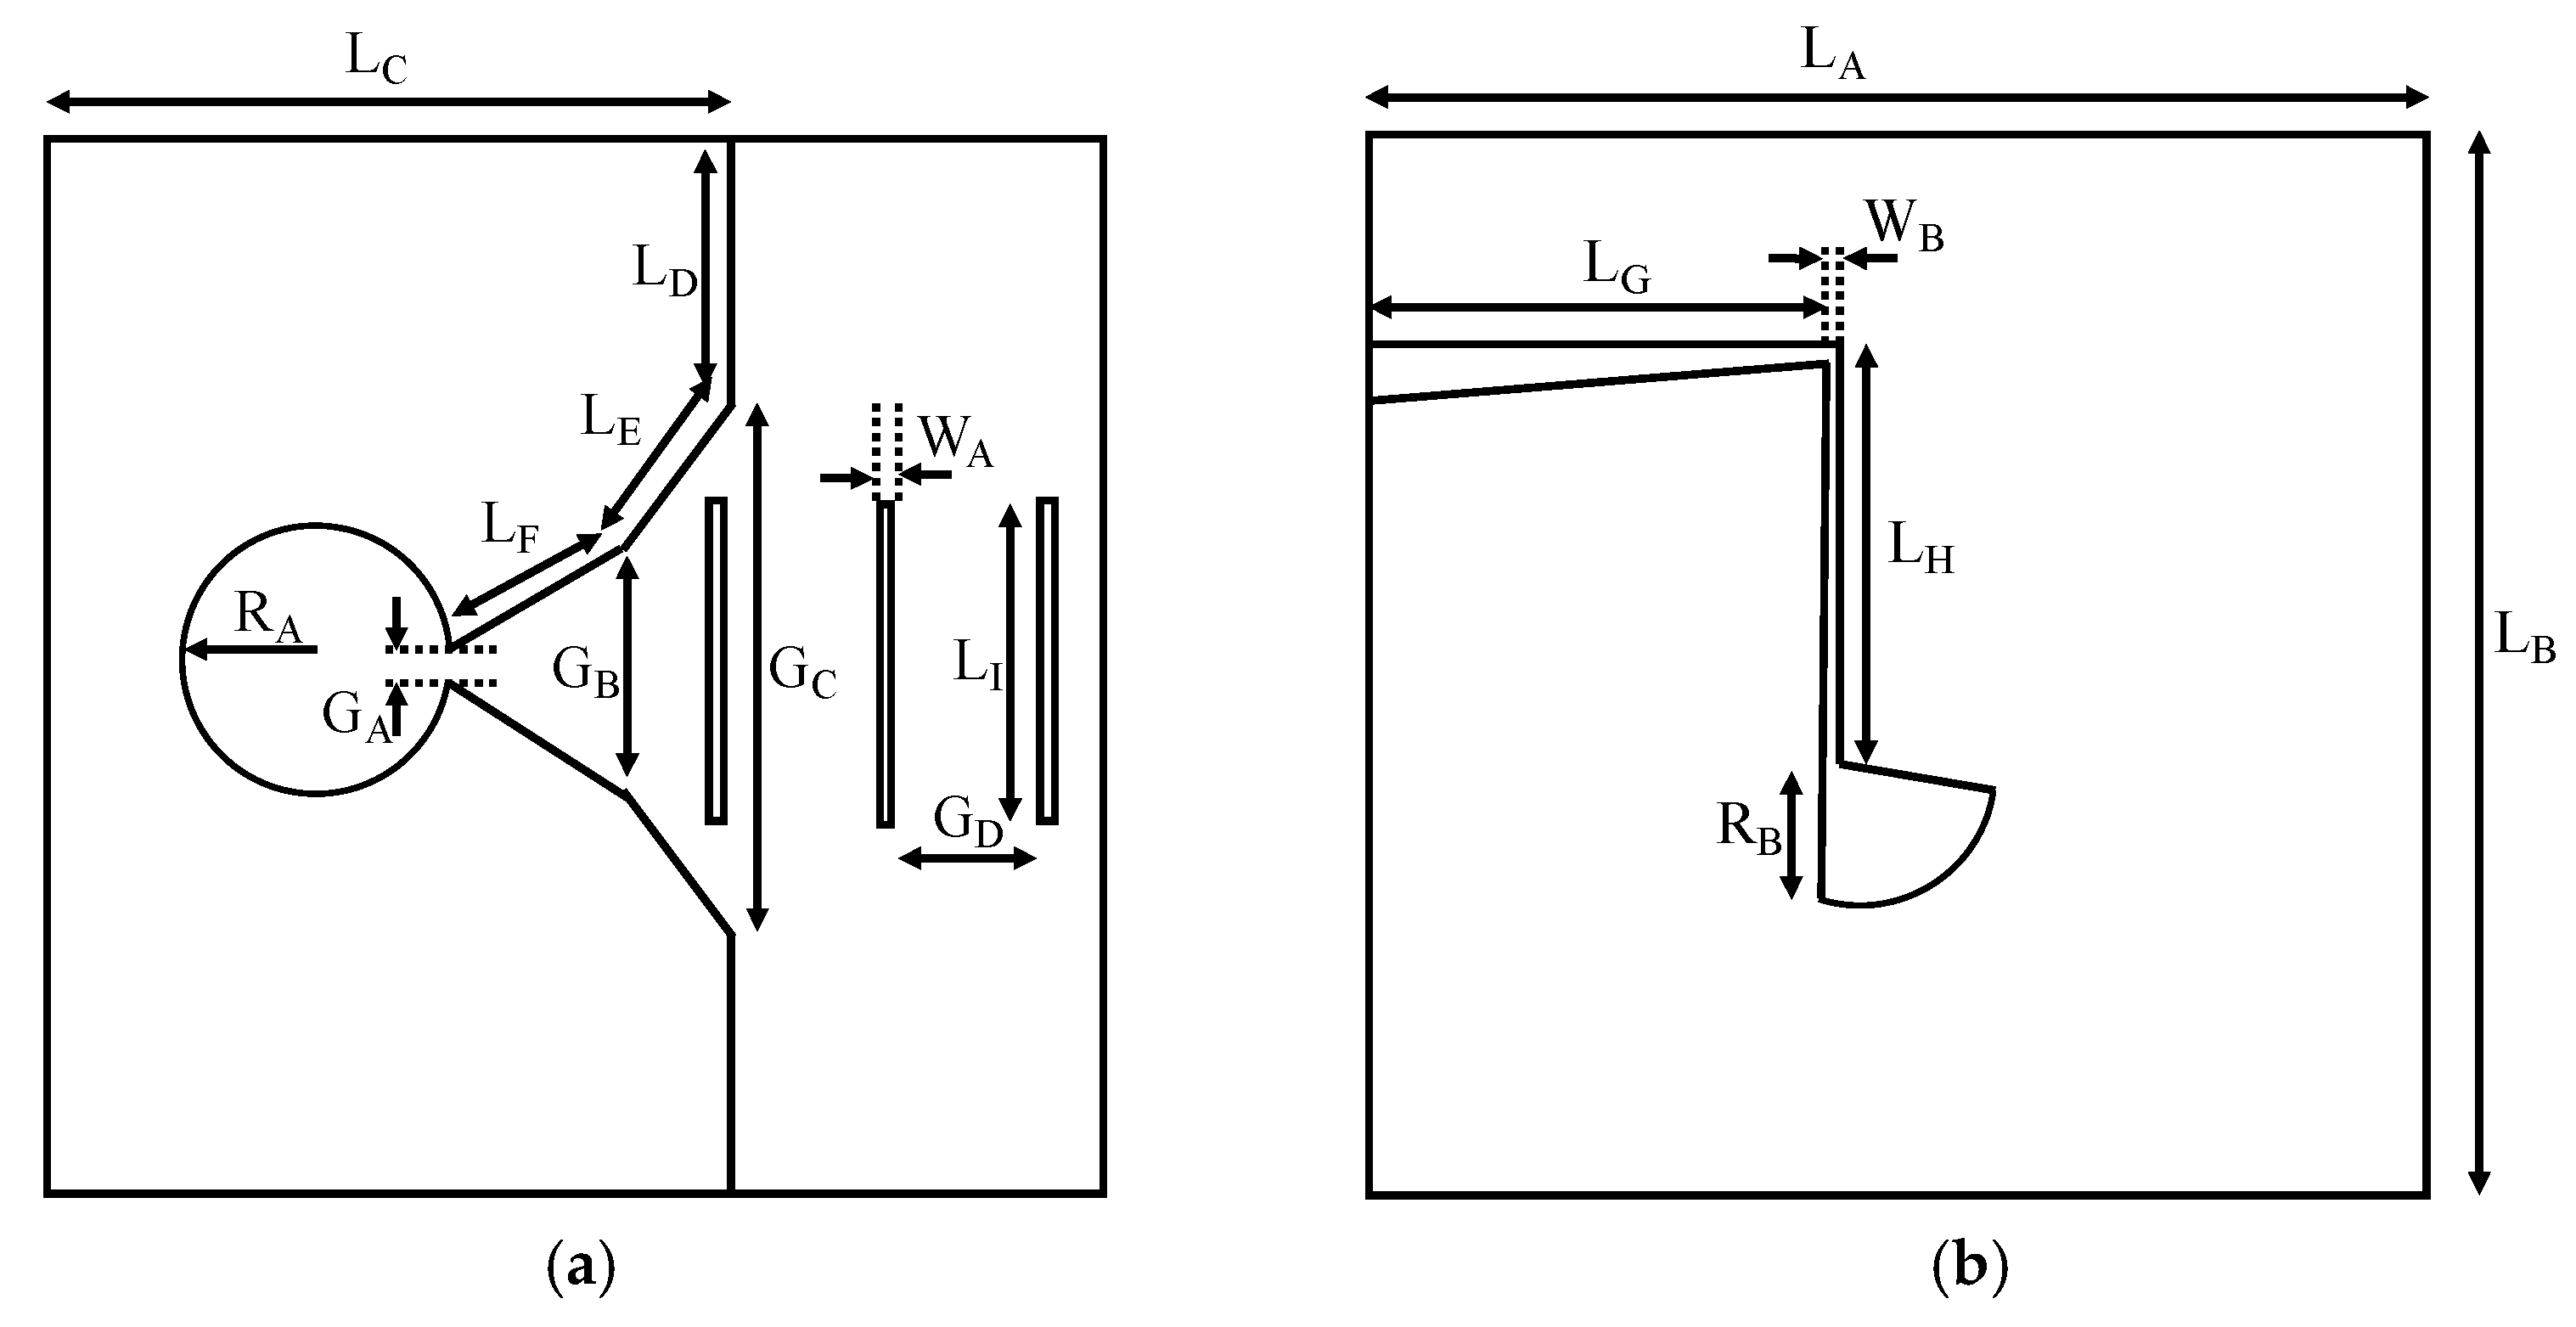
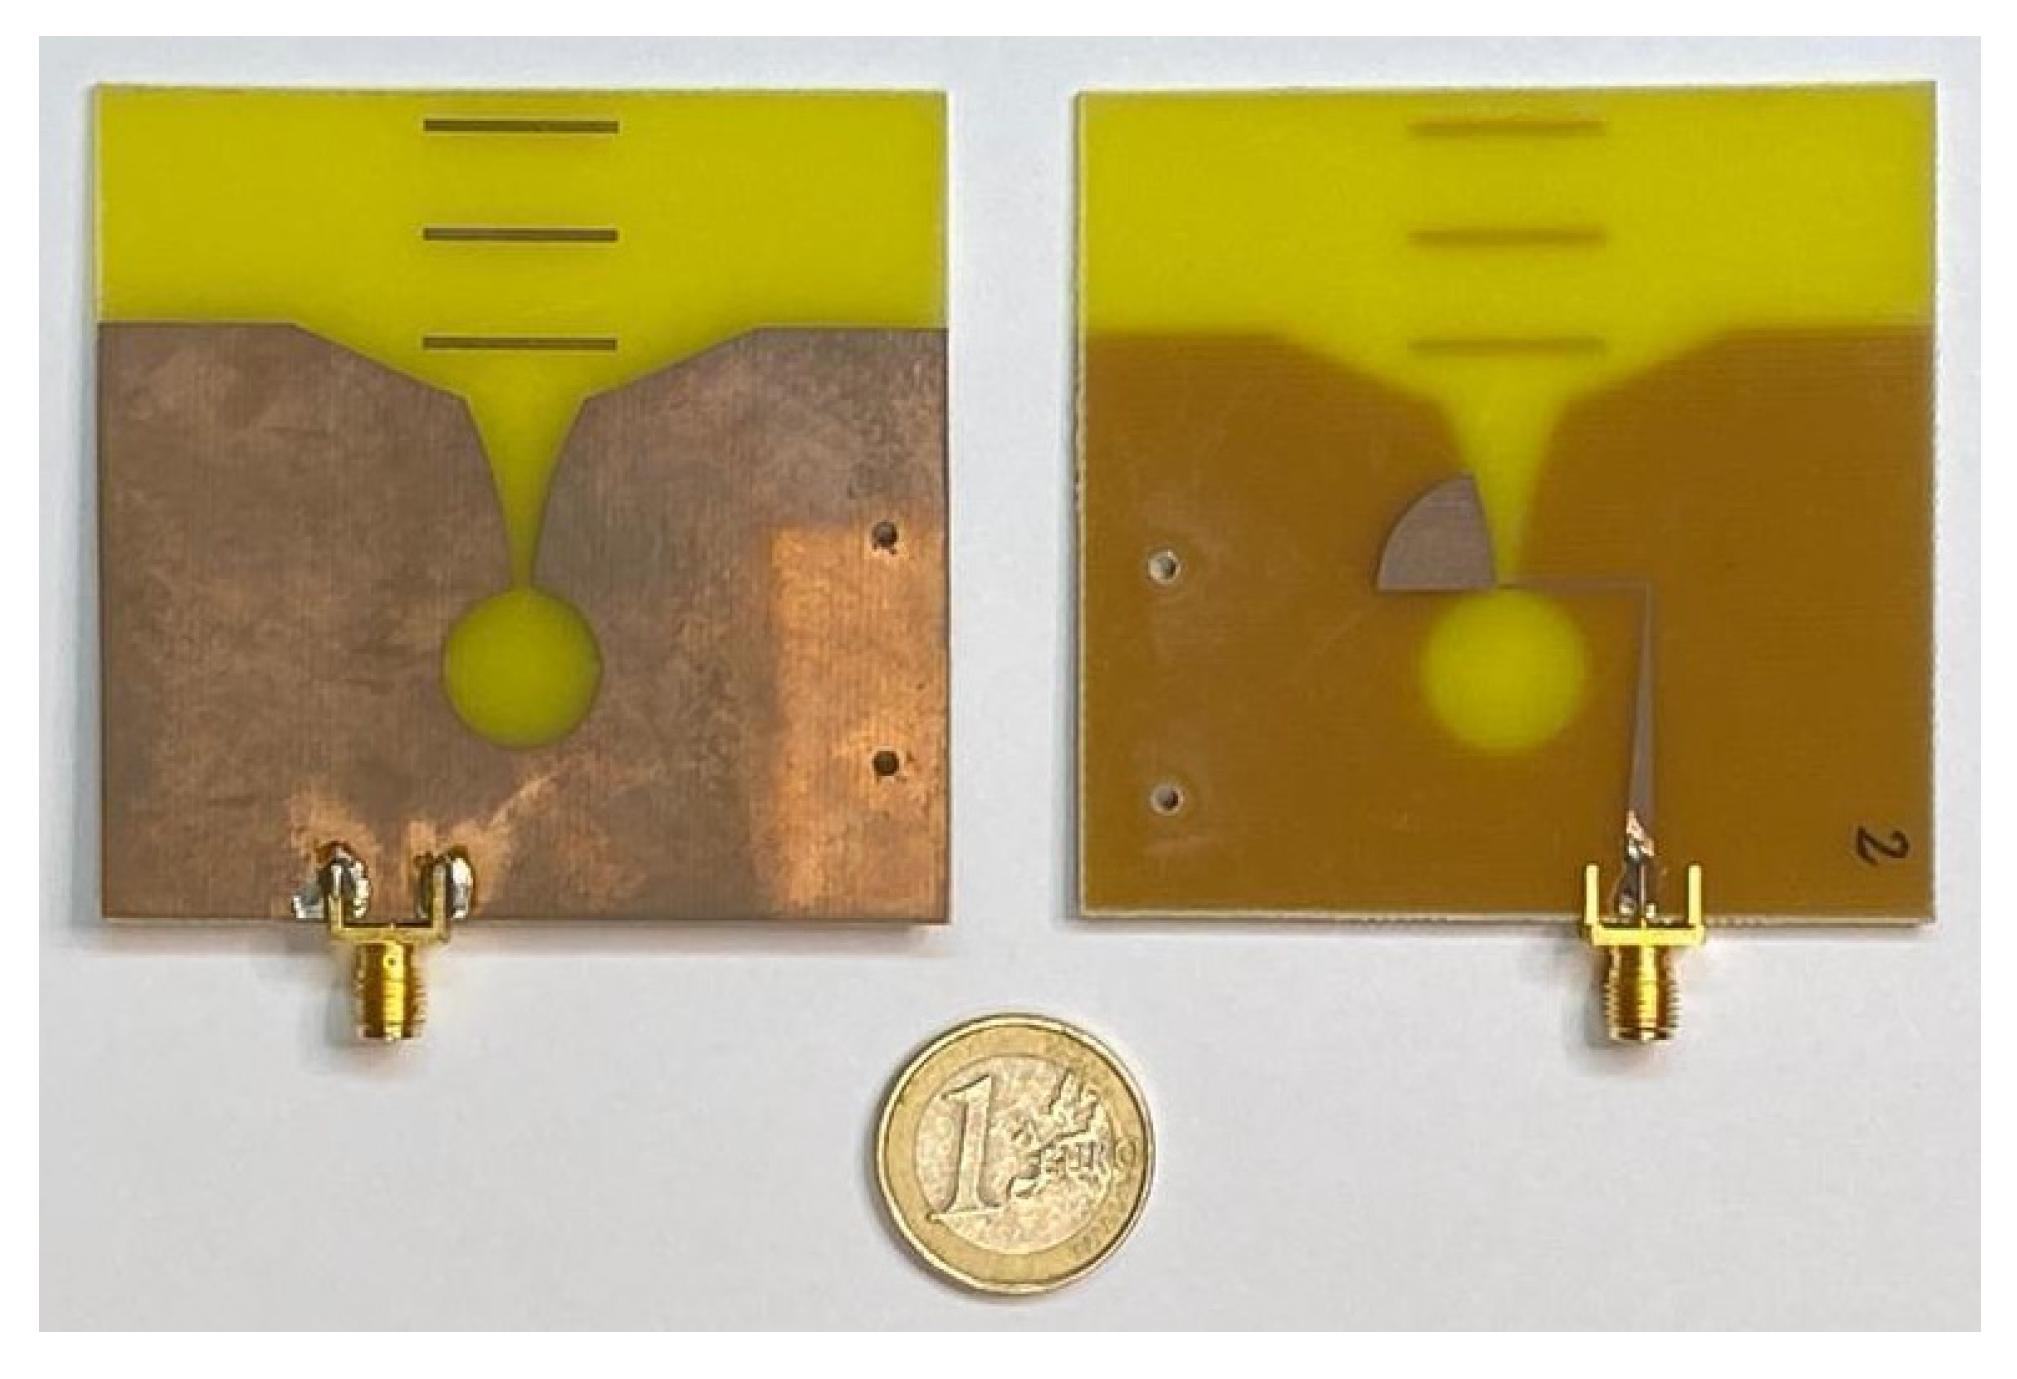
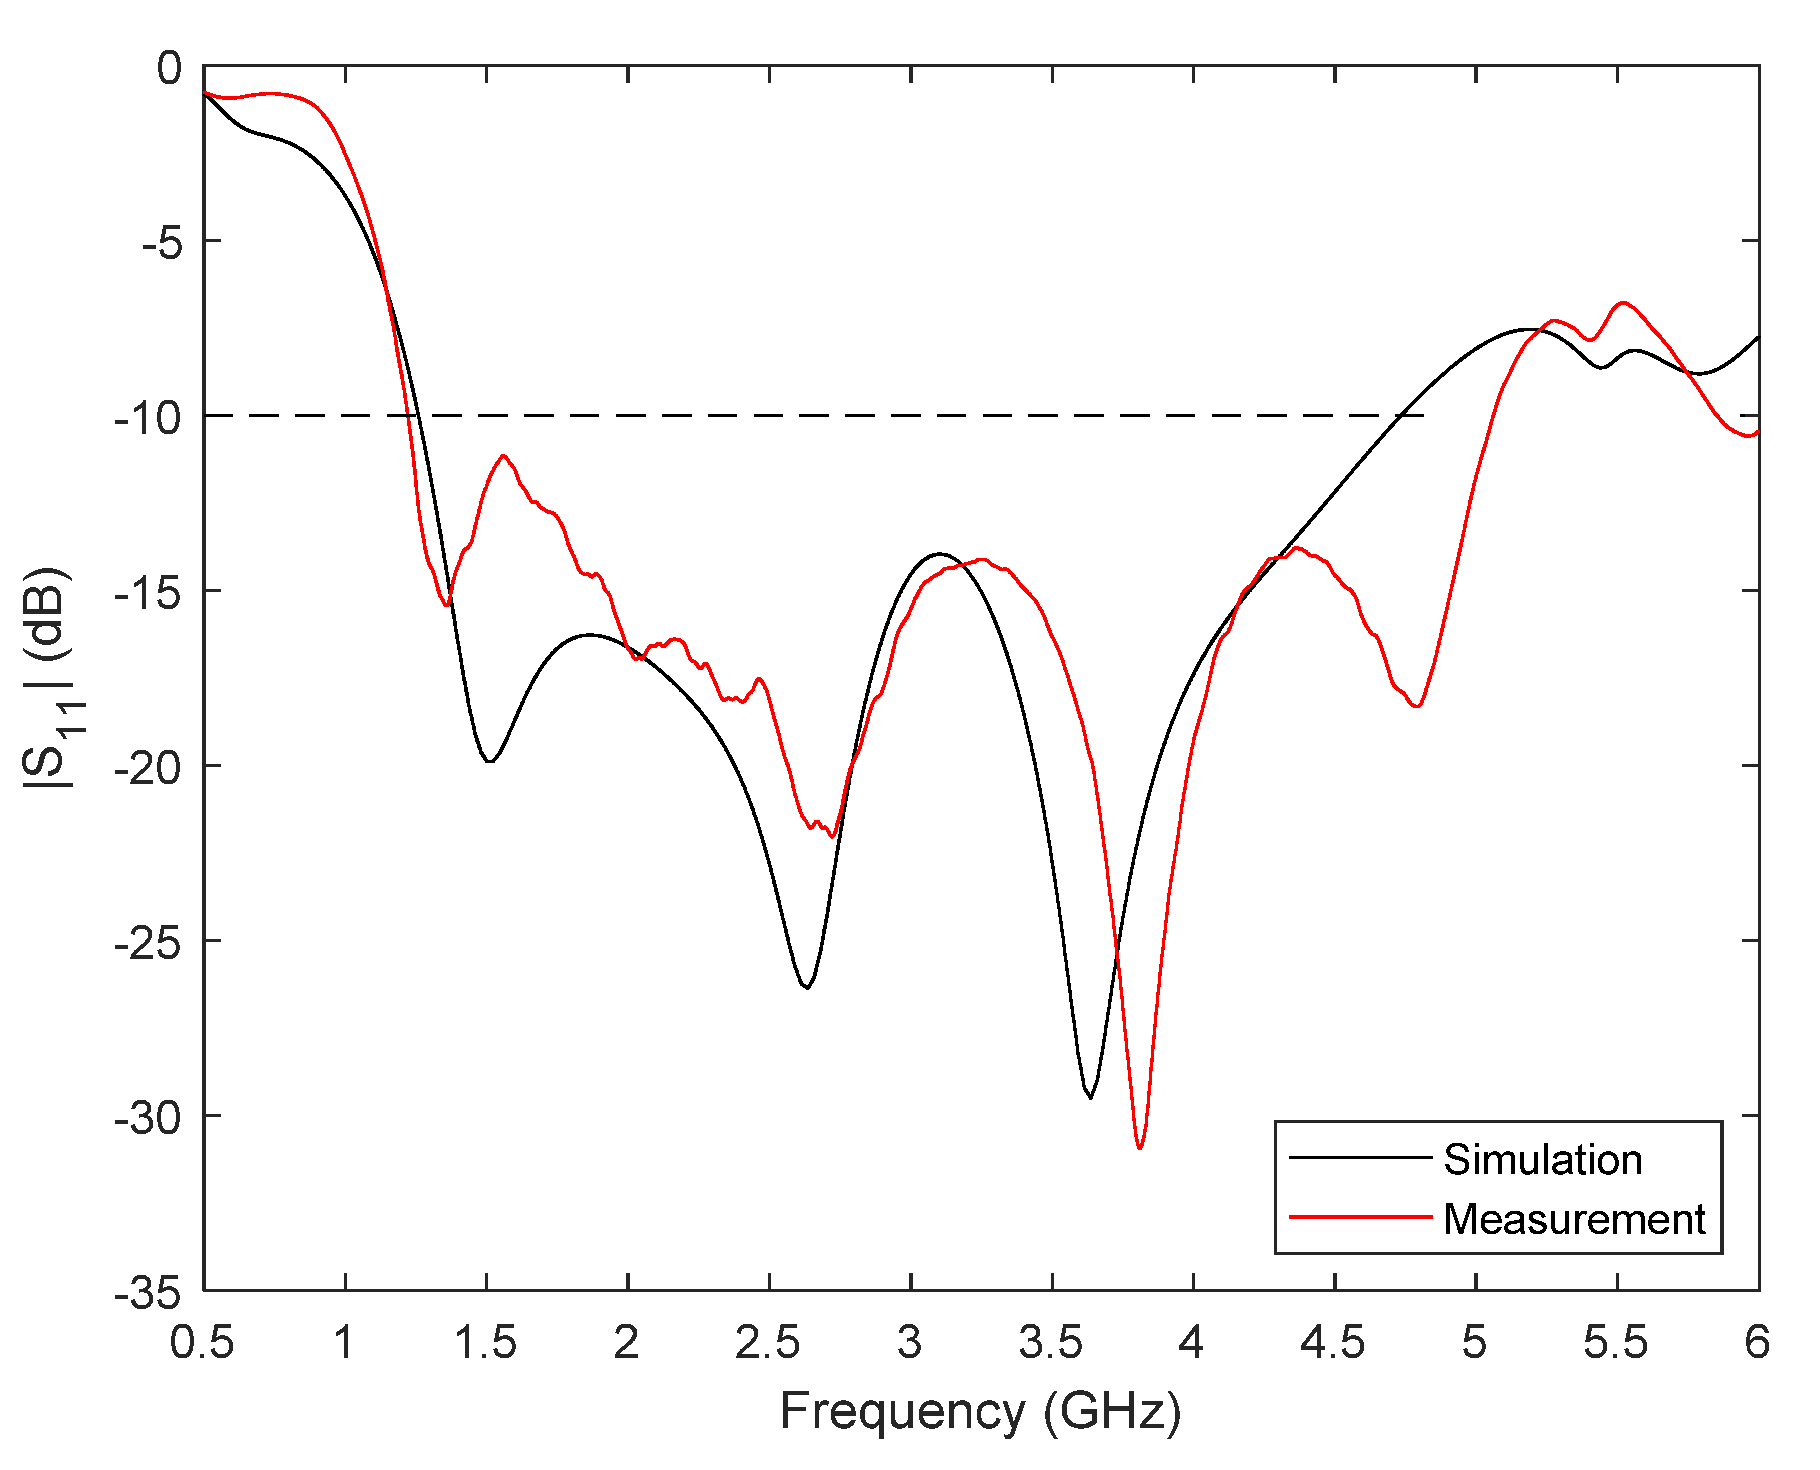
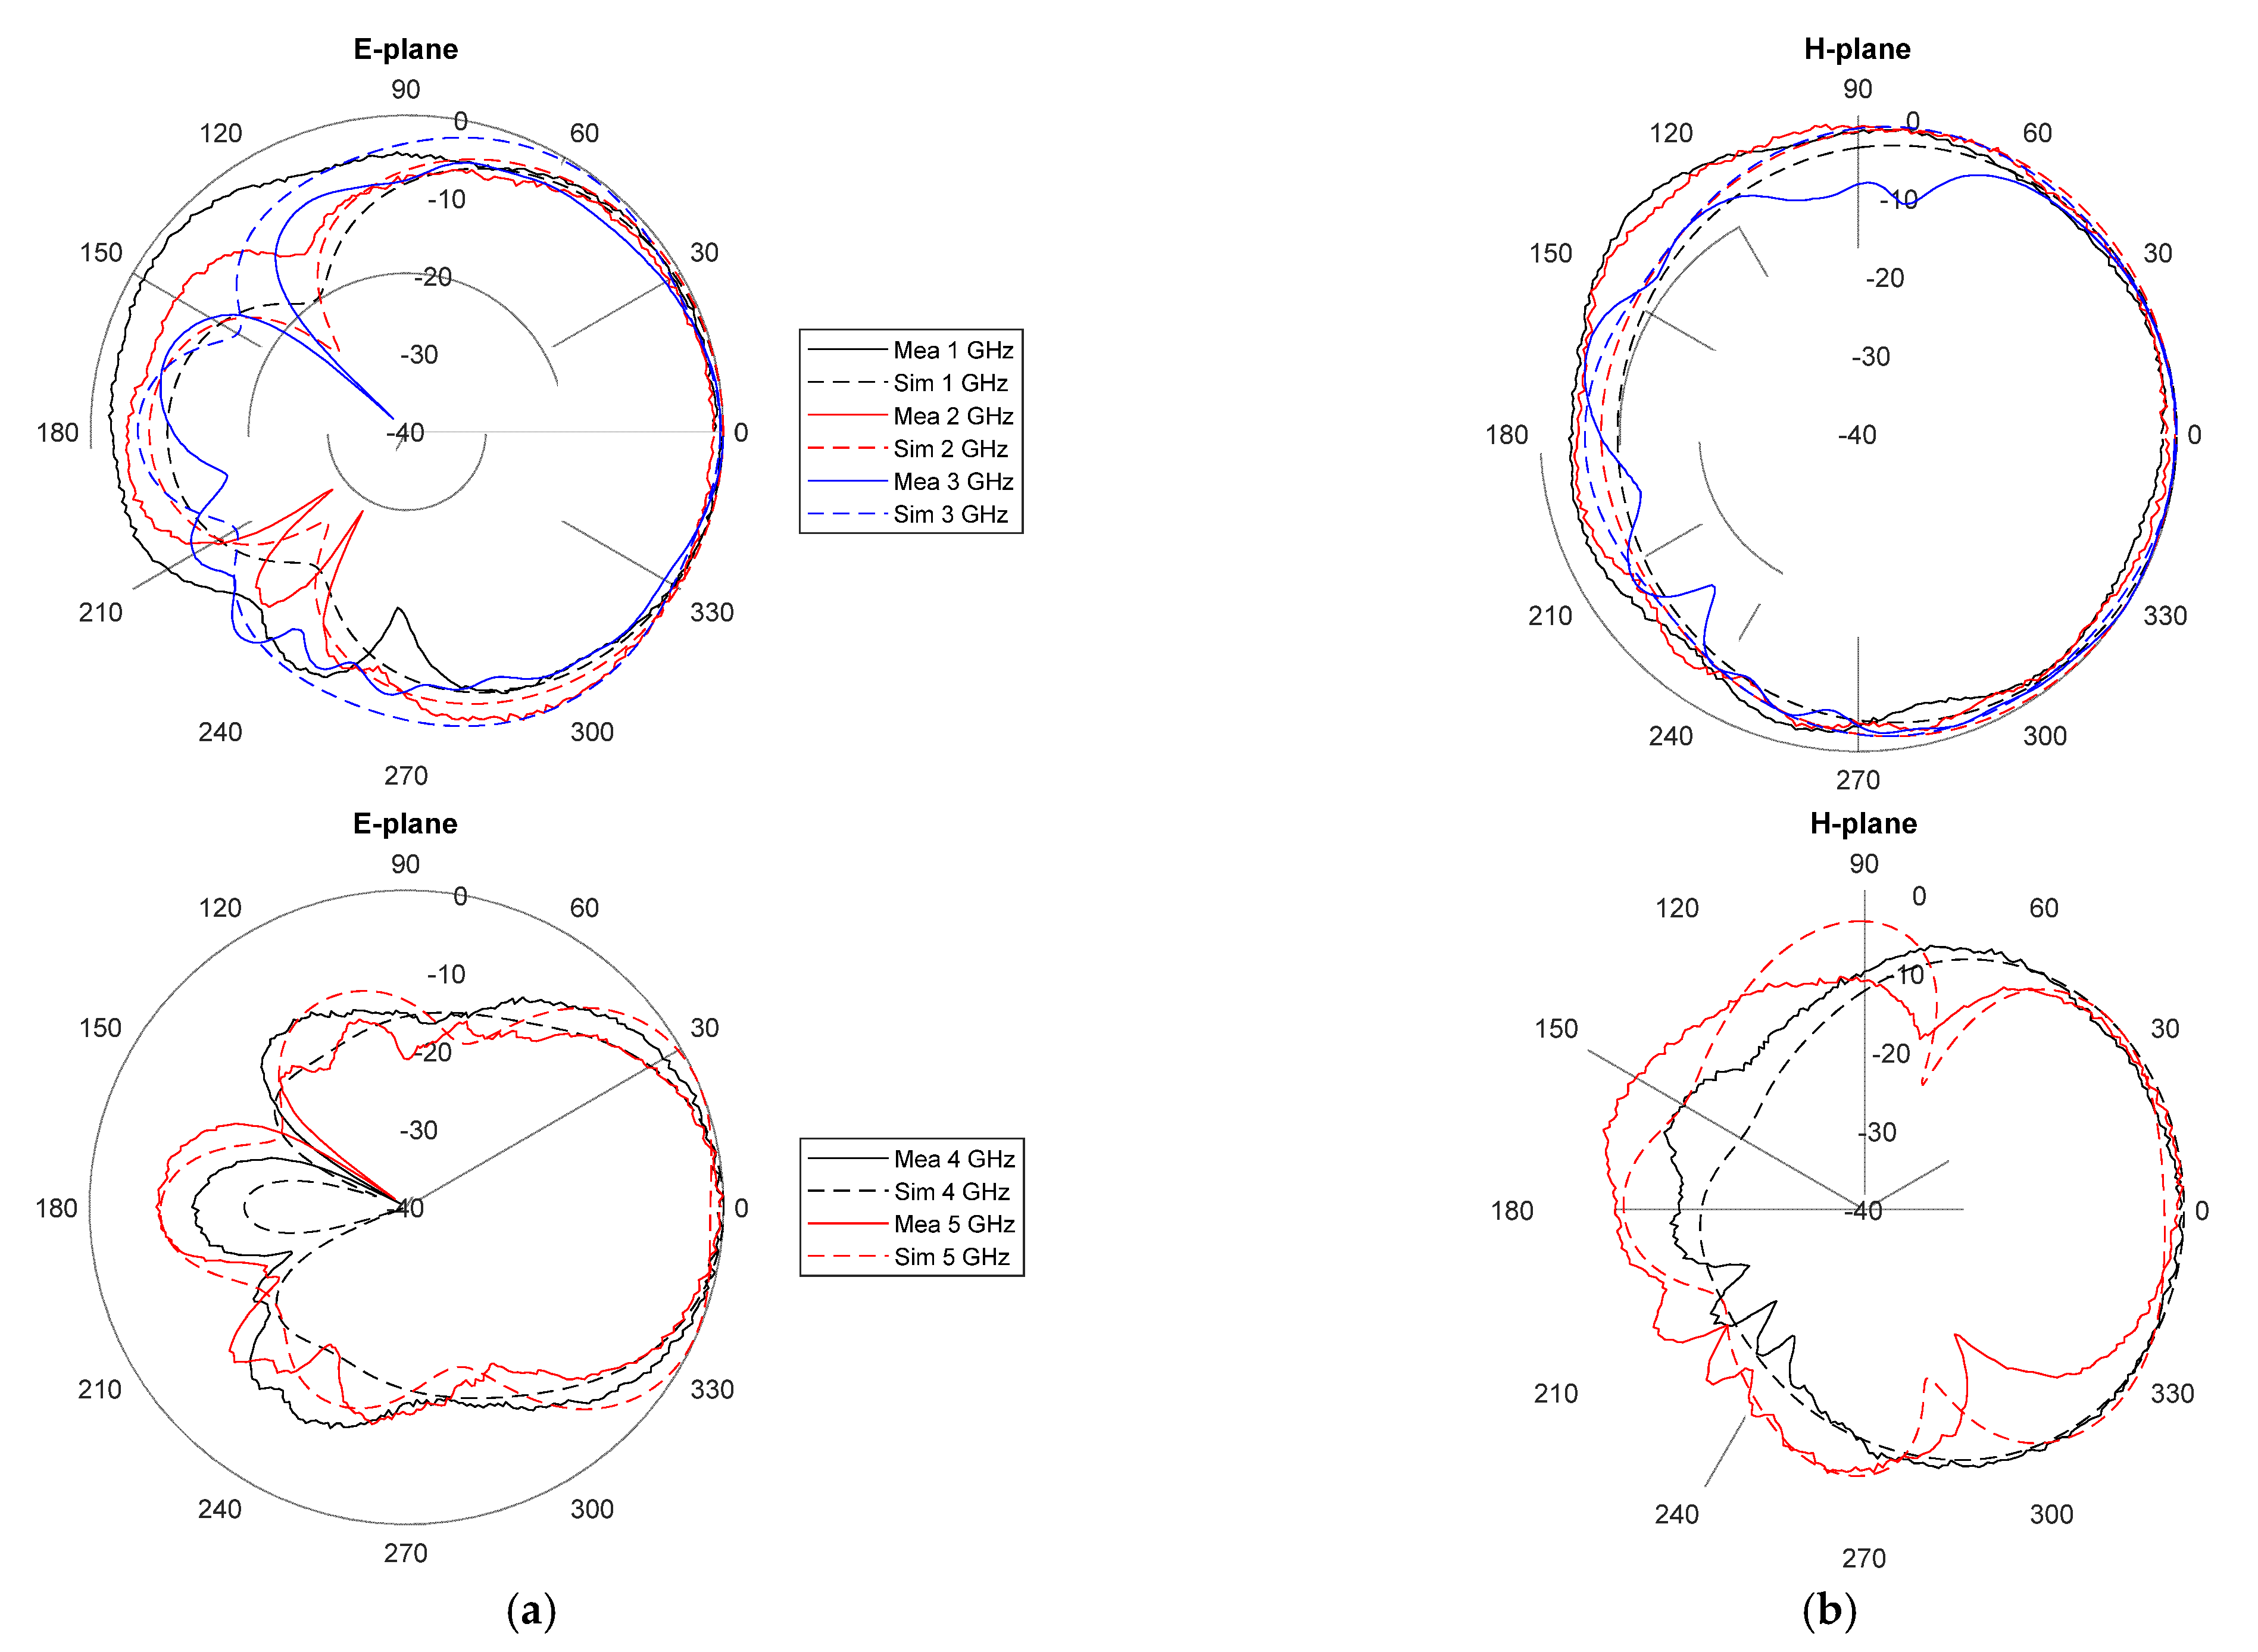
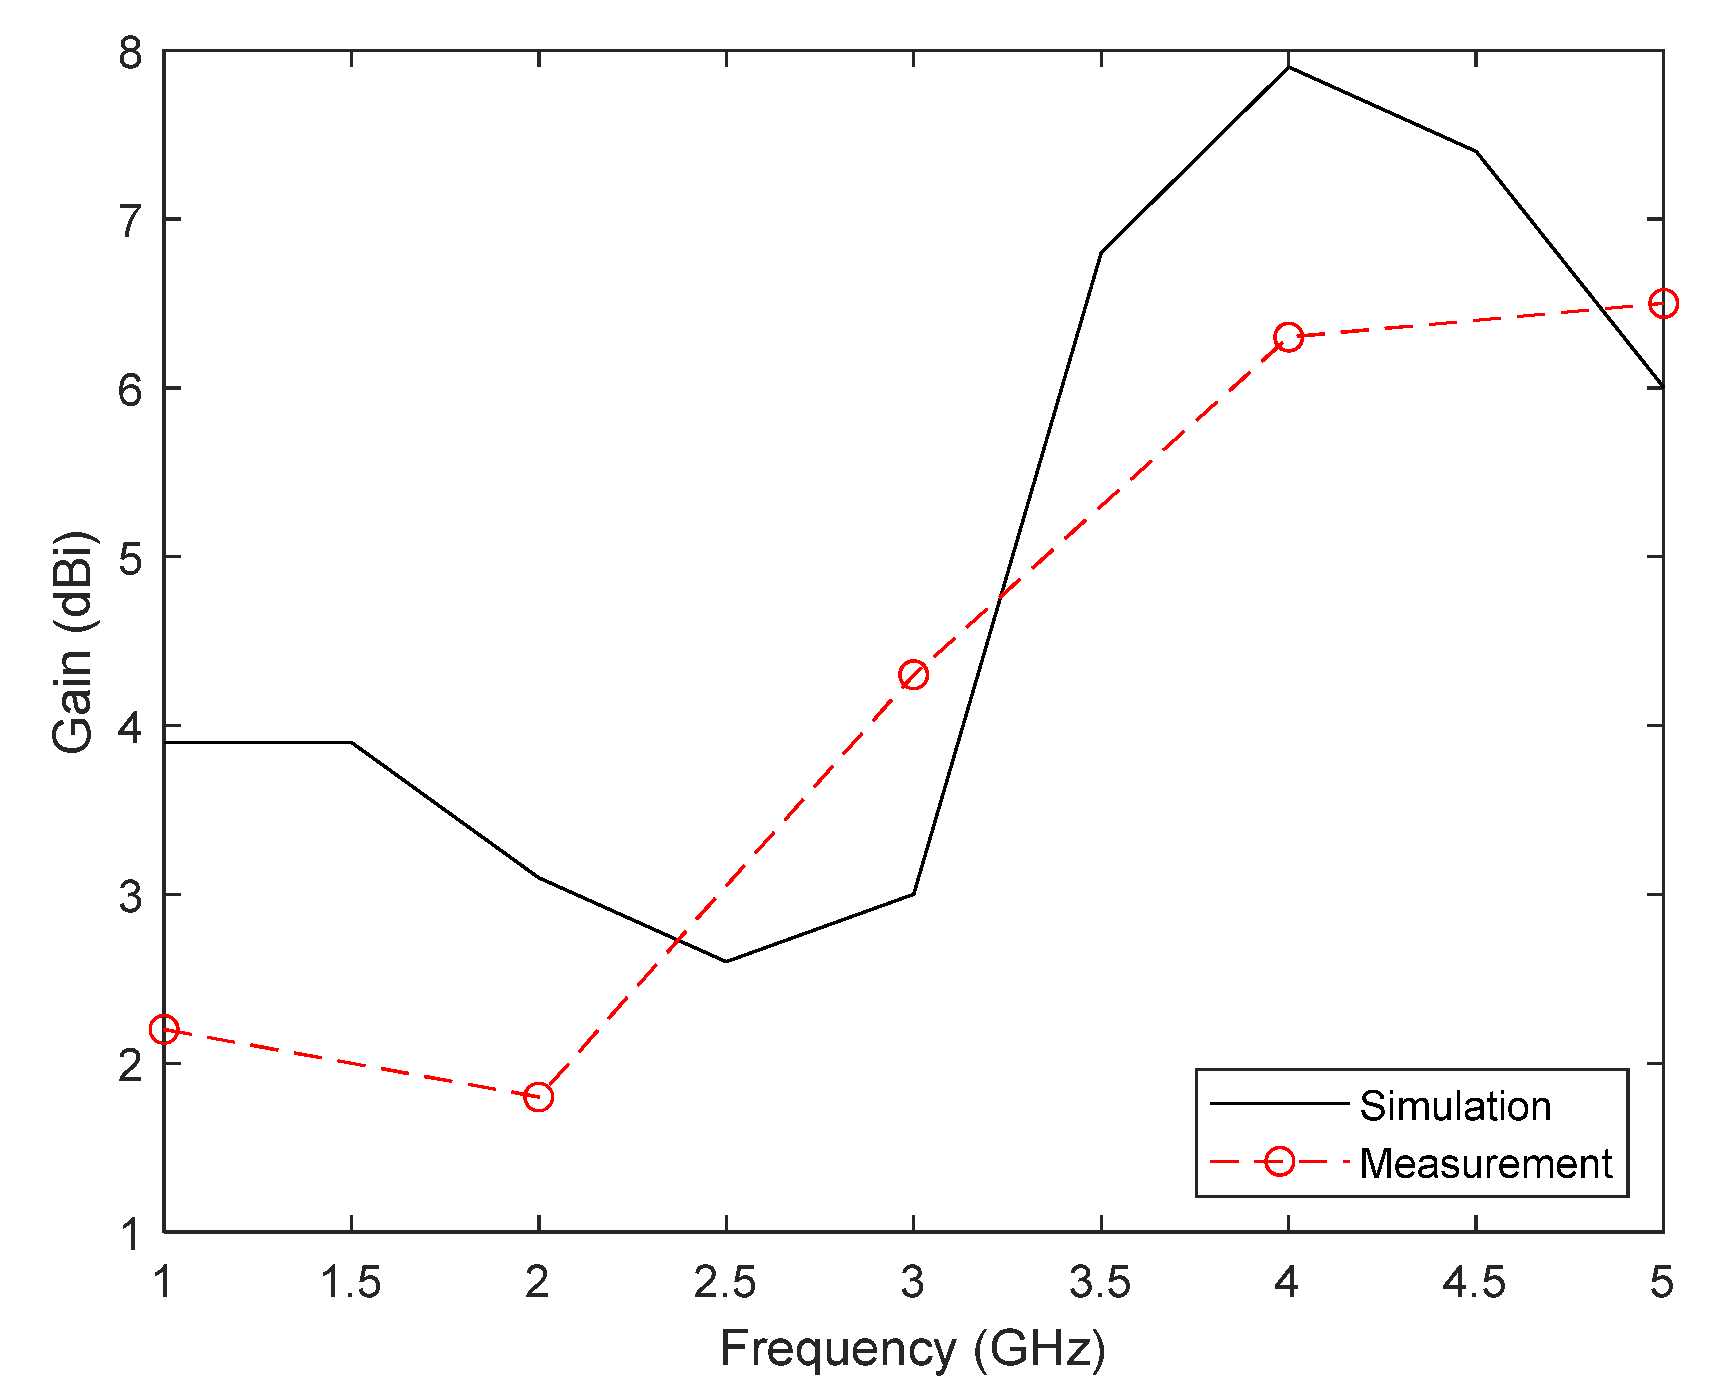
2.1. Broadband Printed Antenna
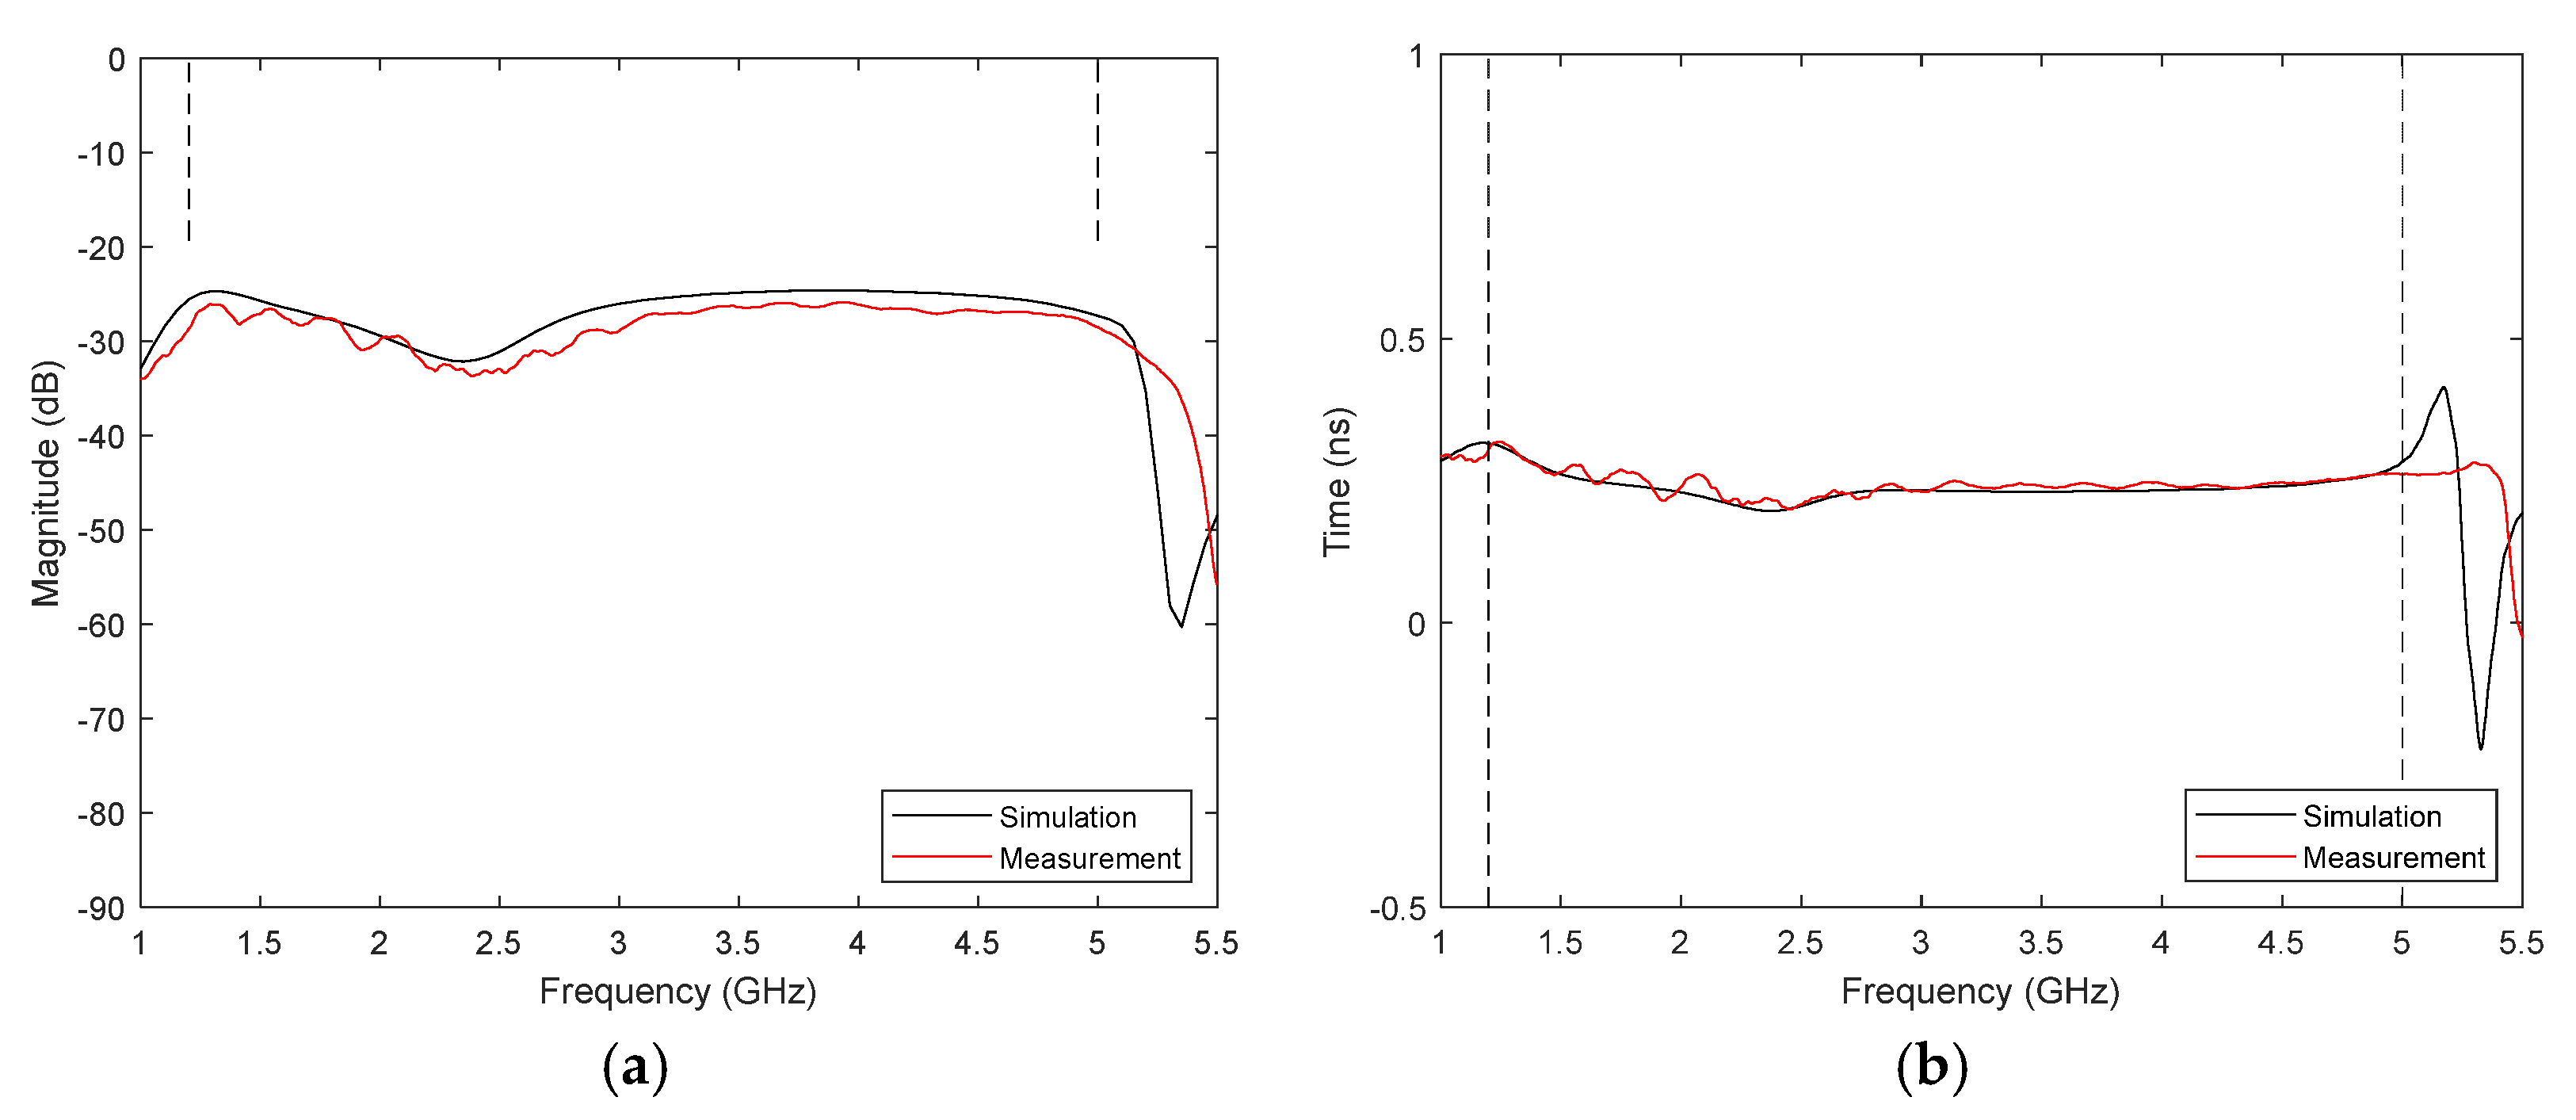
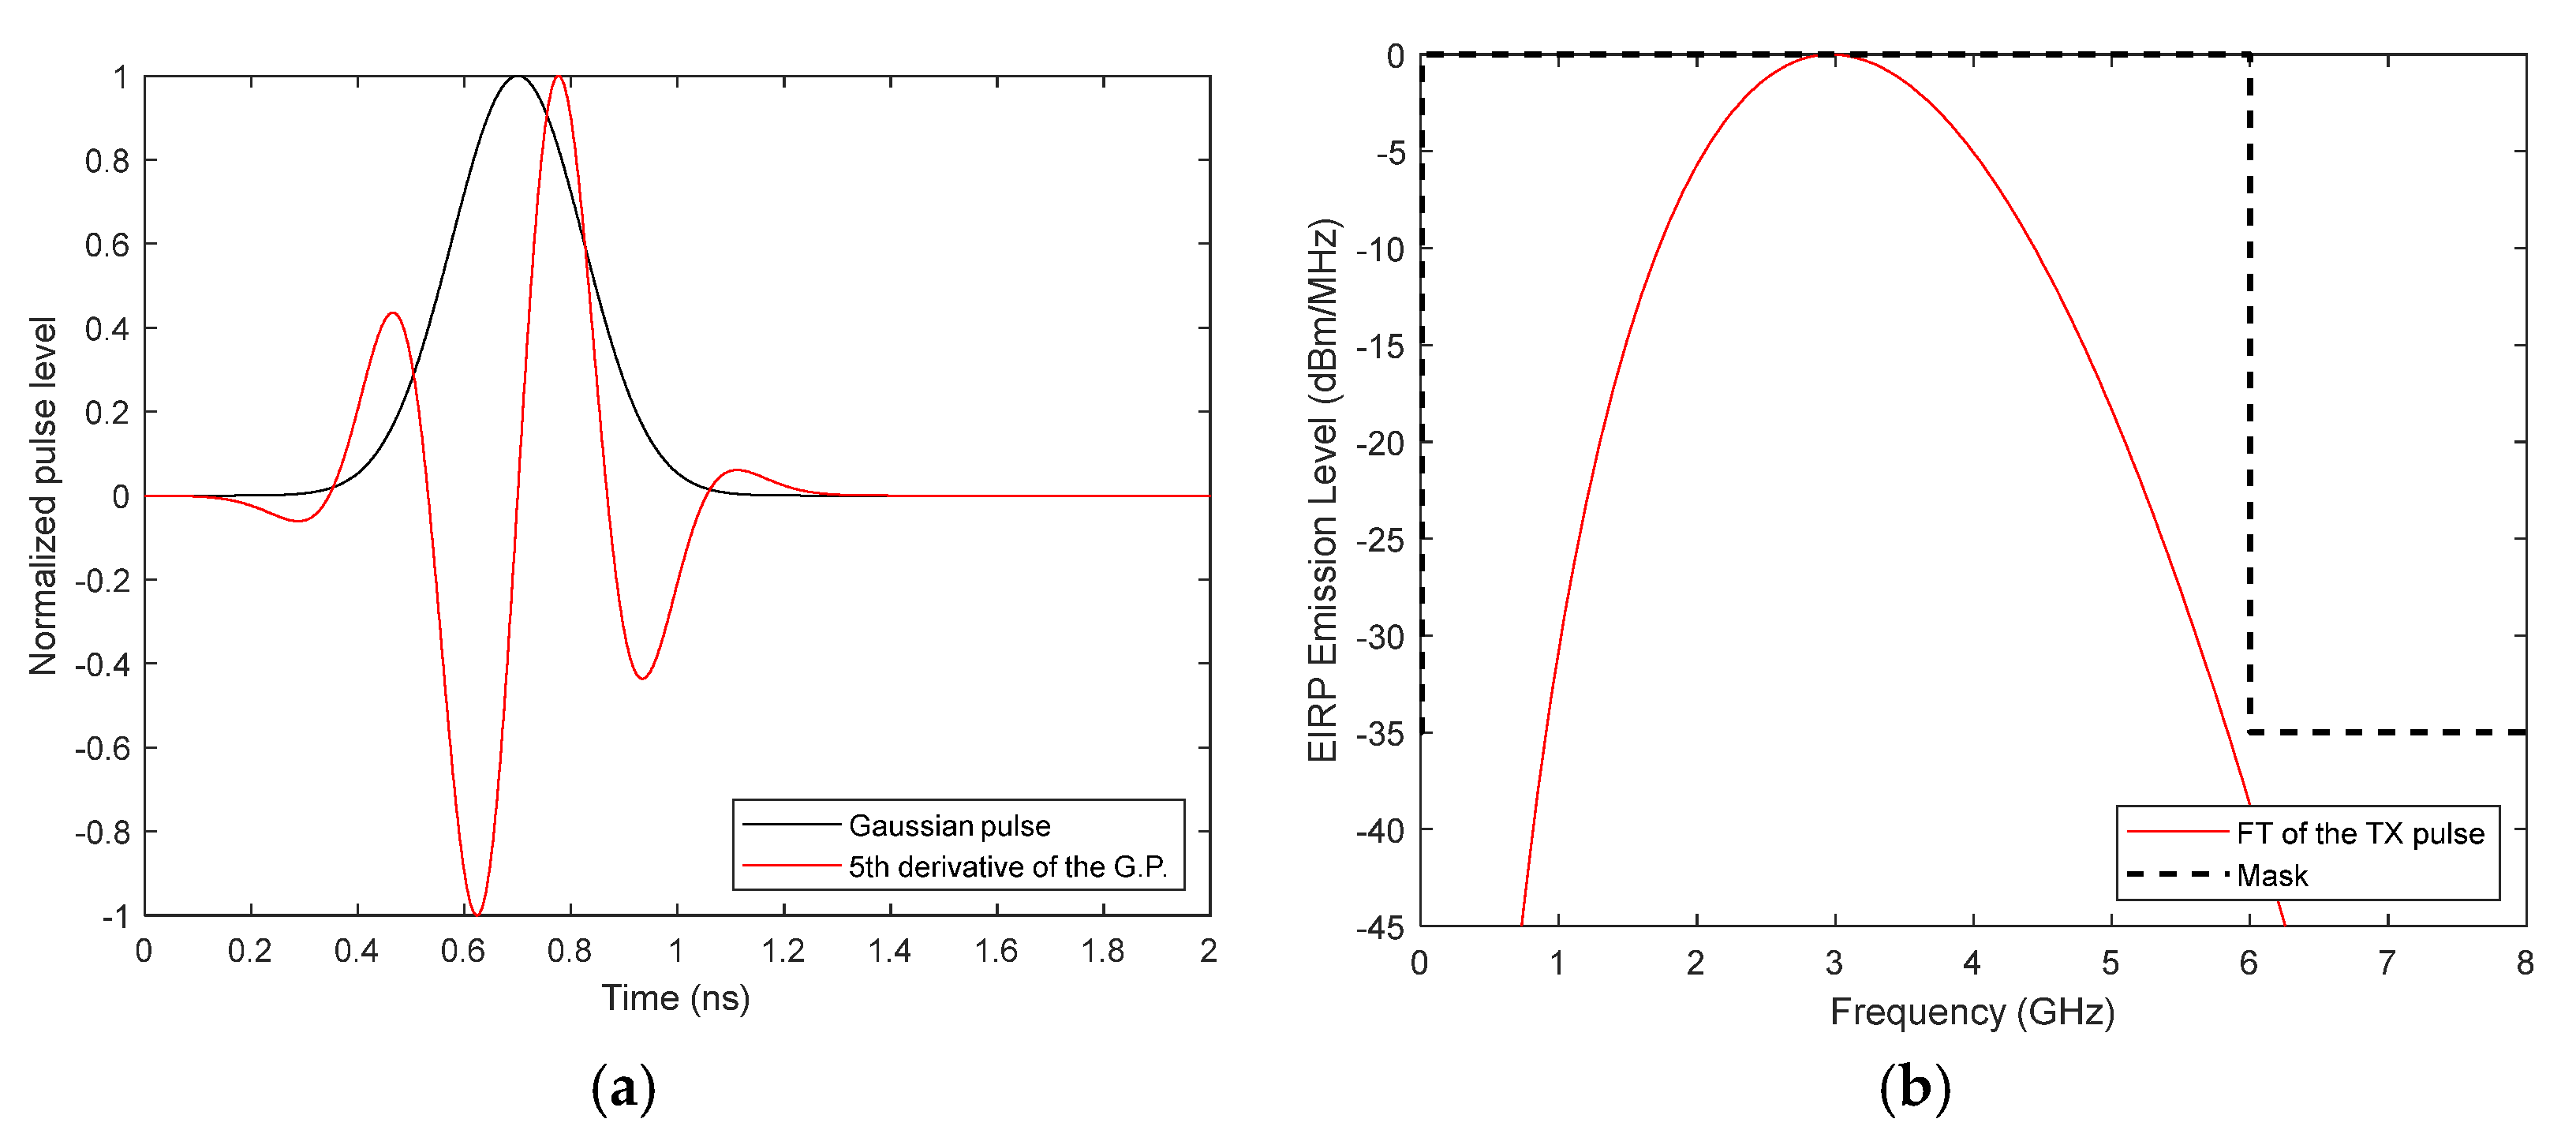
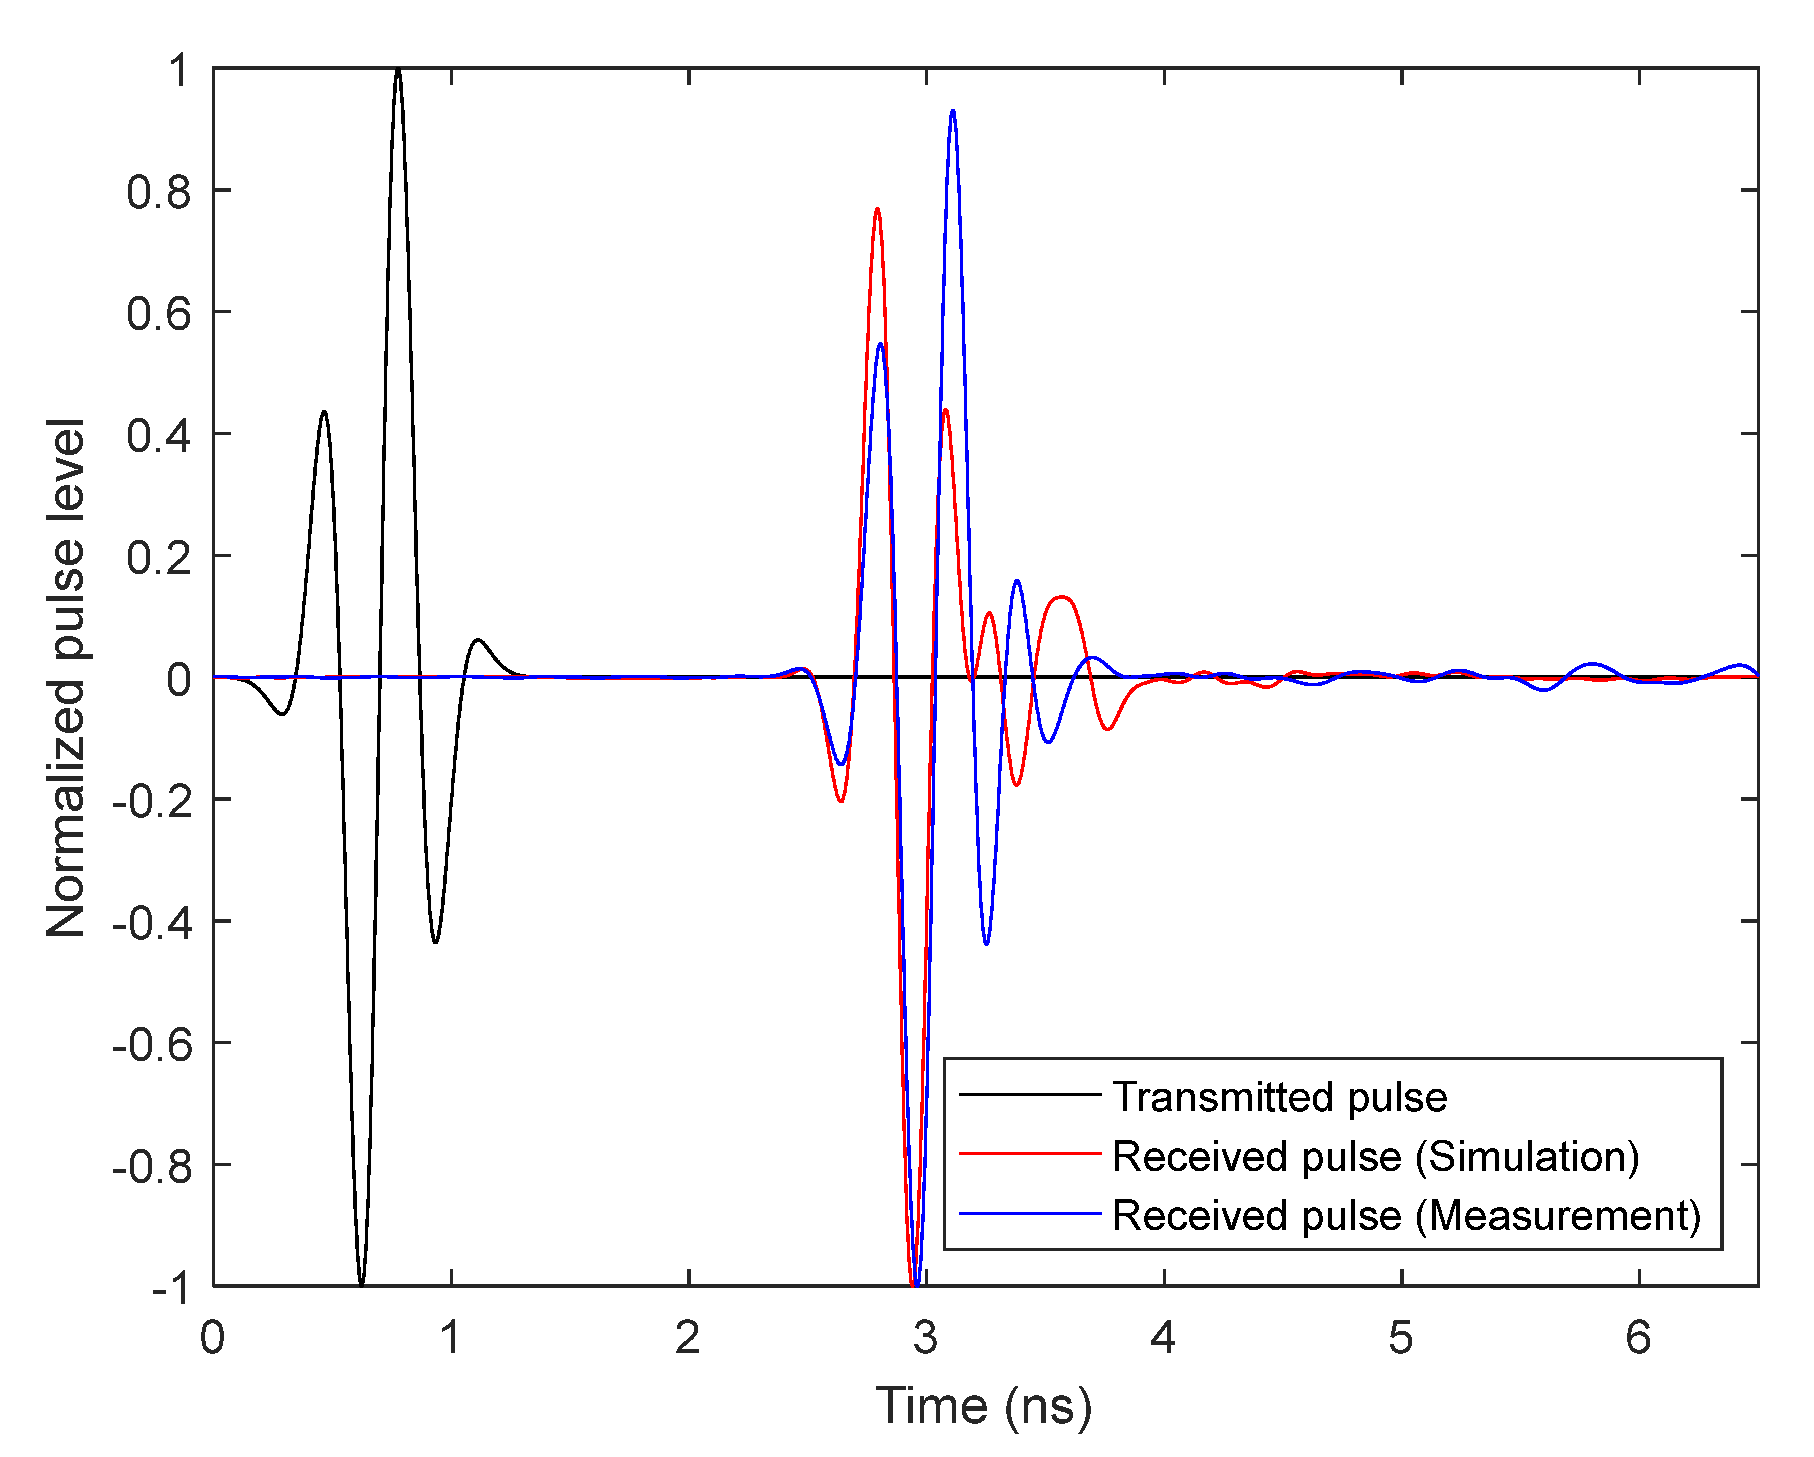
Broadband Antenna Time-Domain Analysis
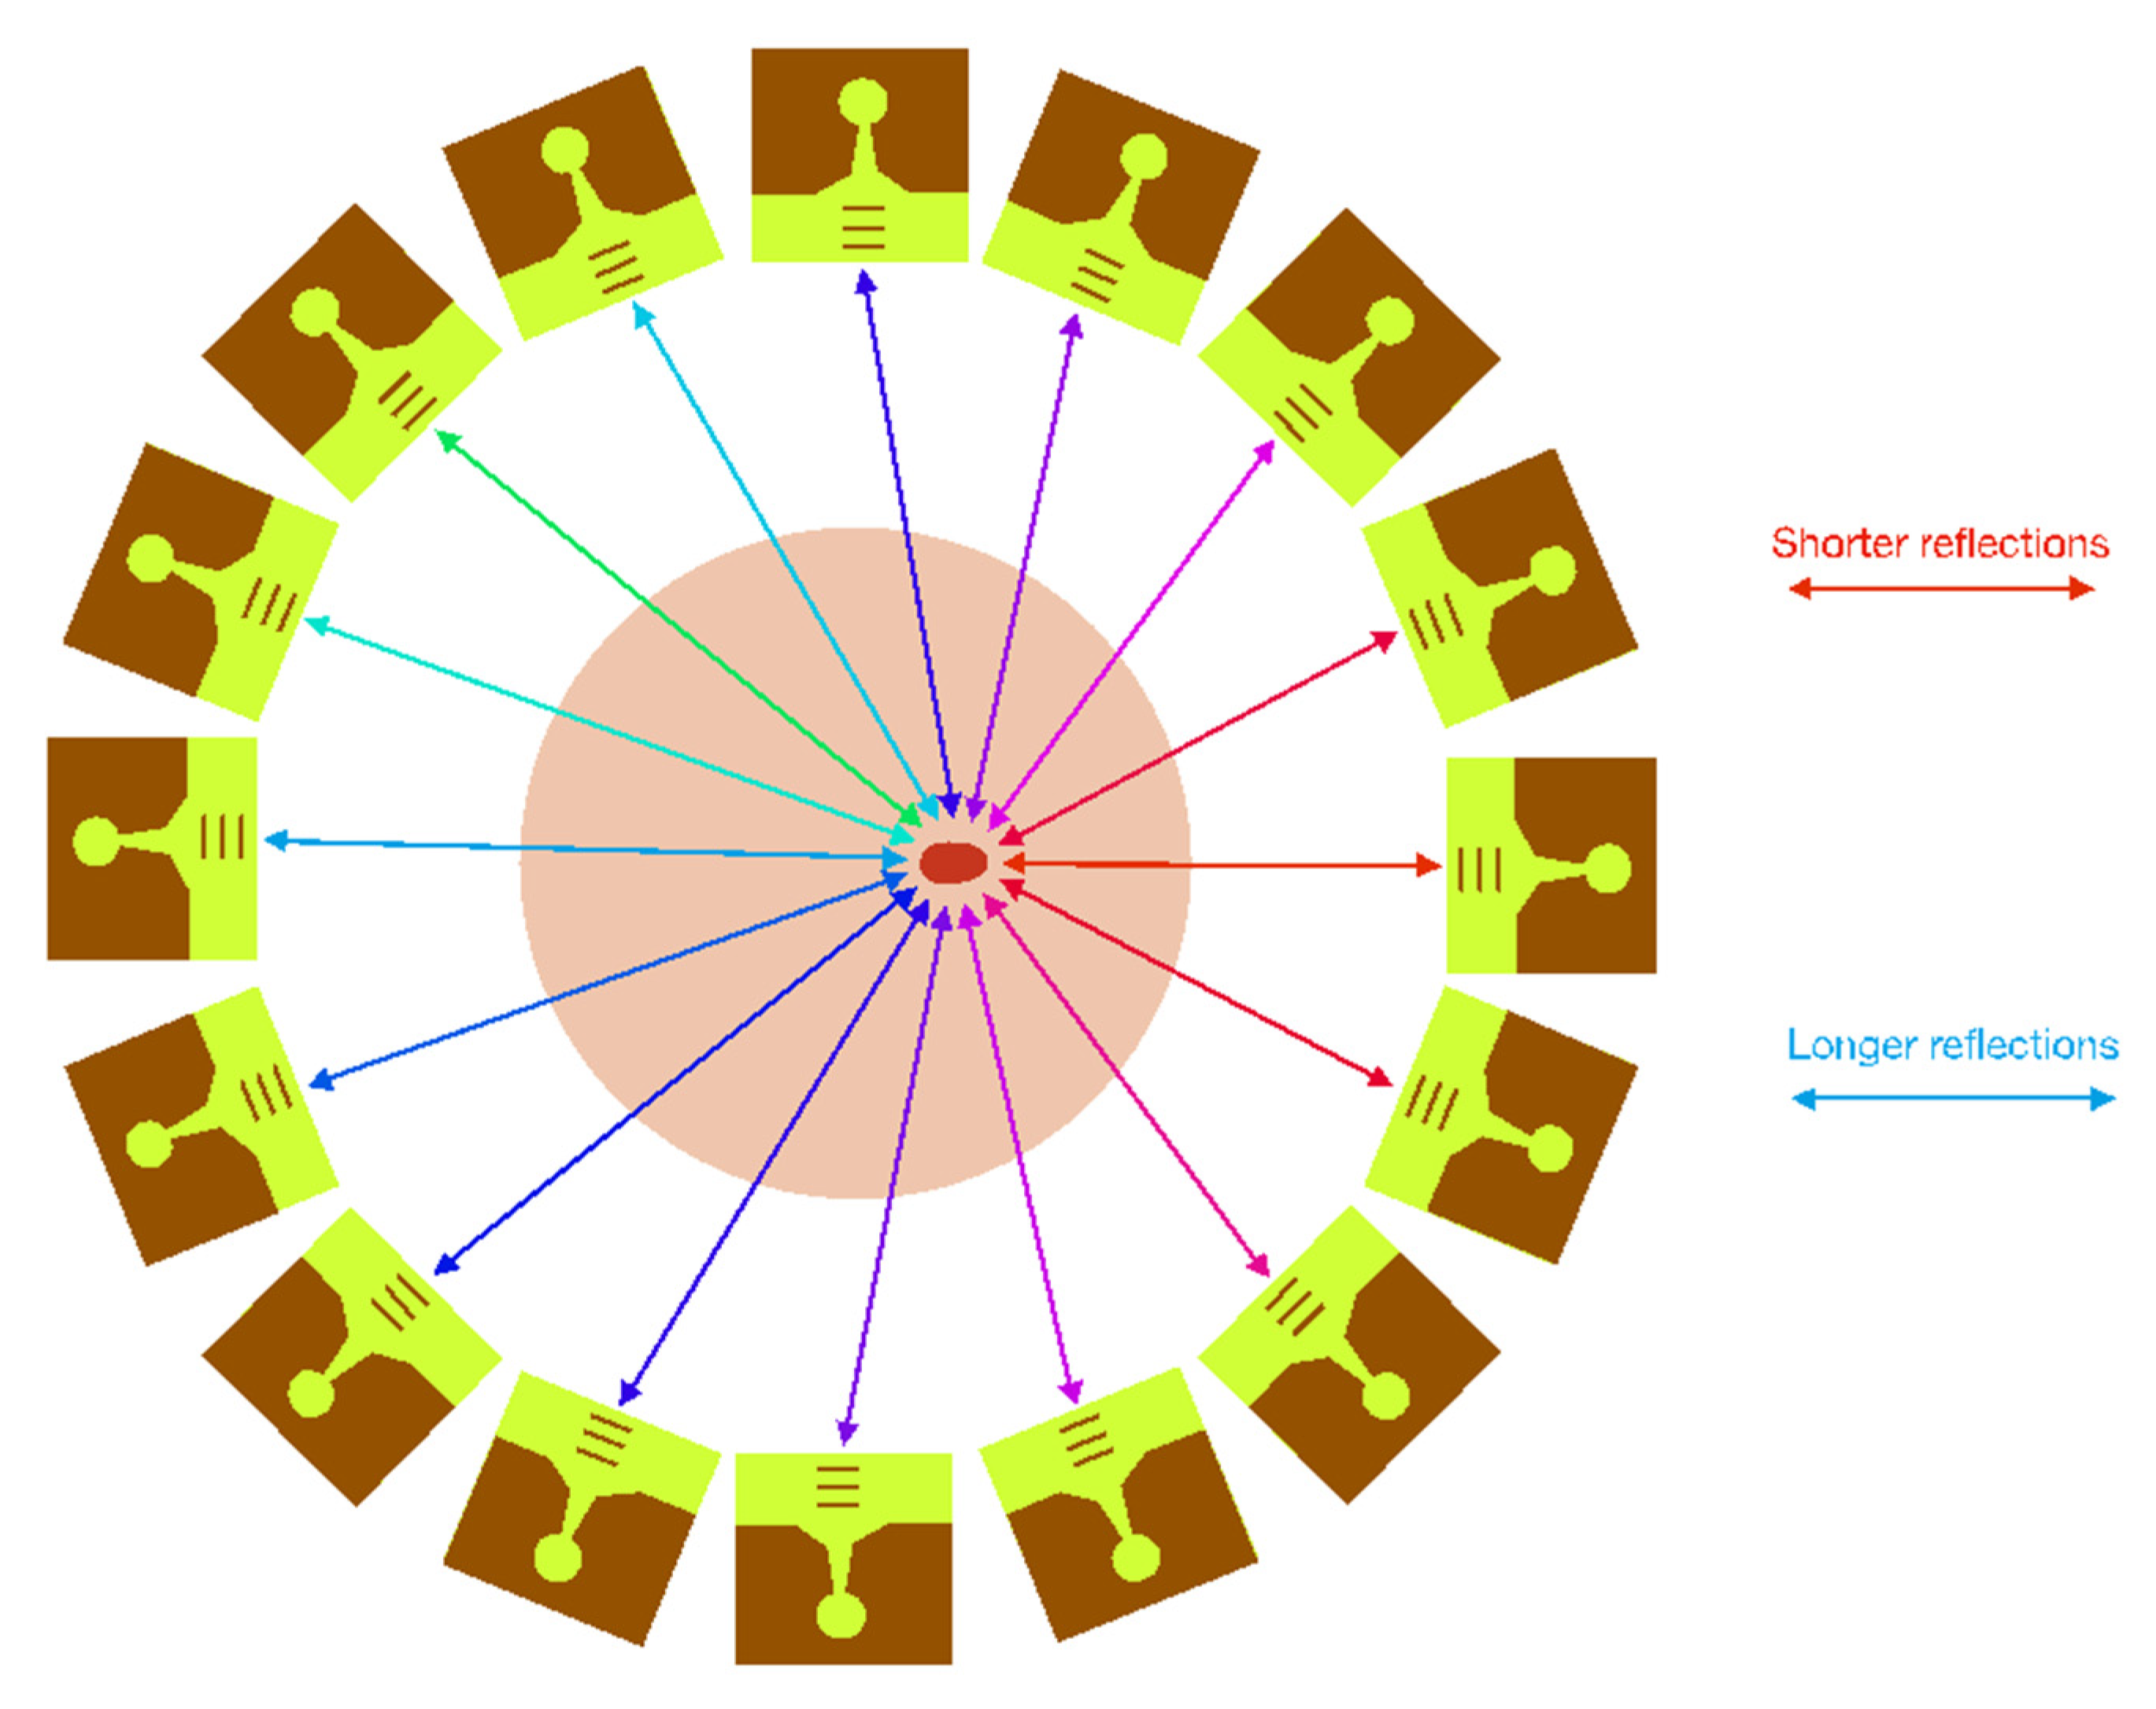
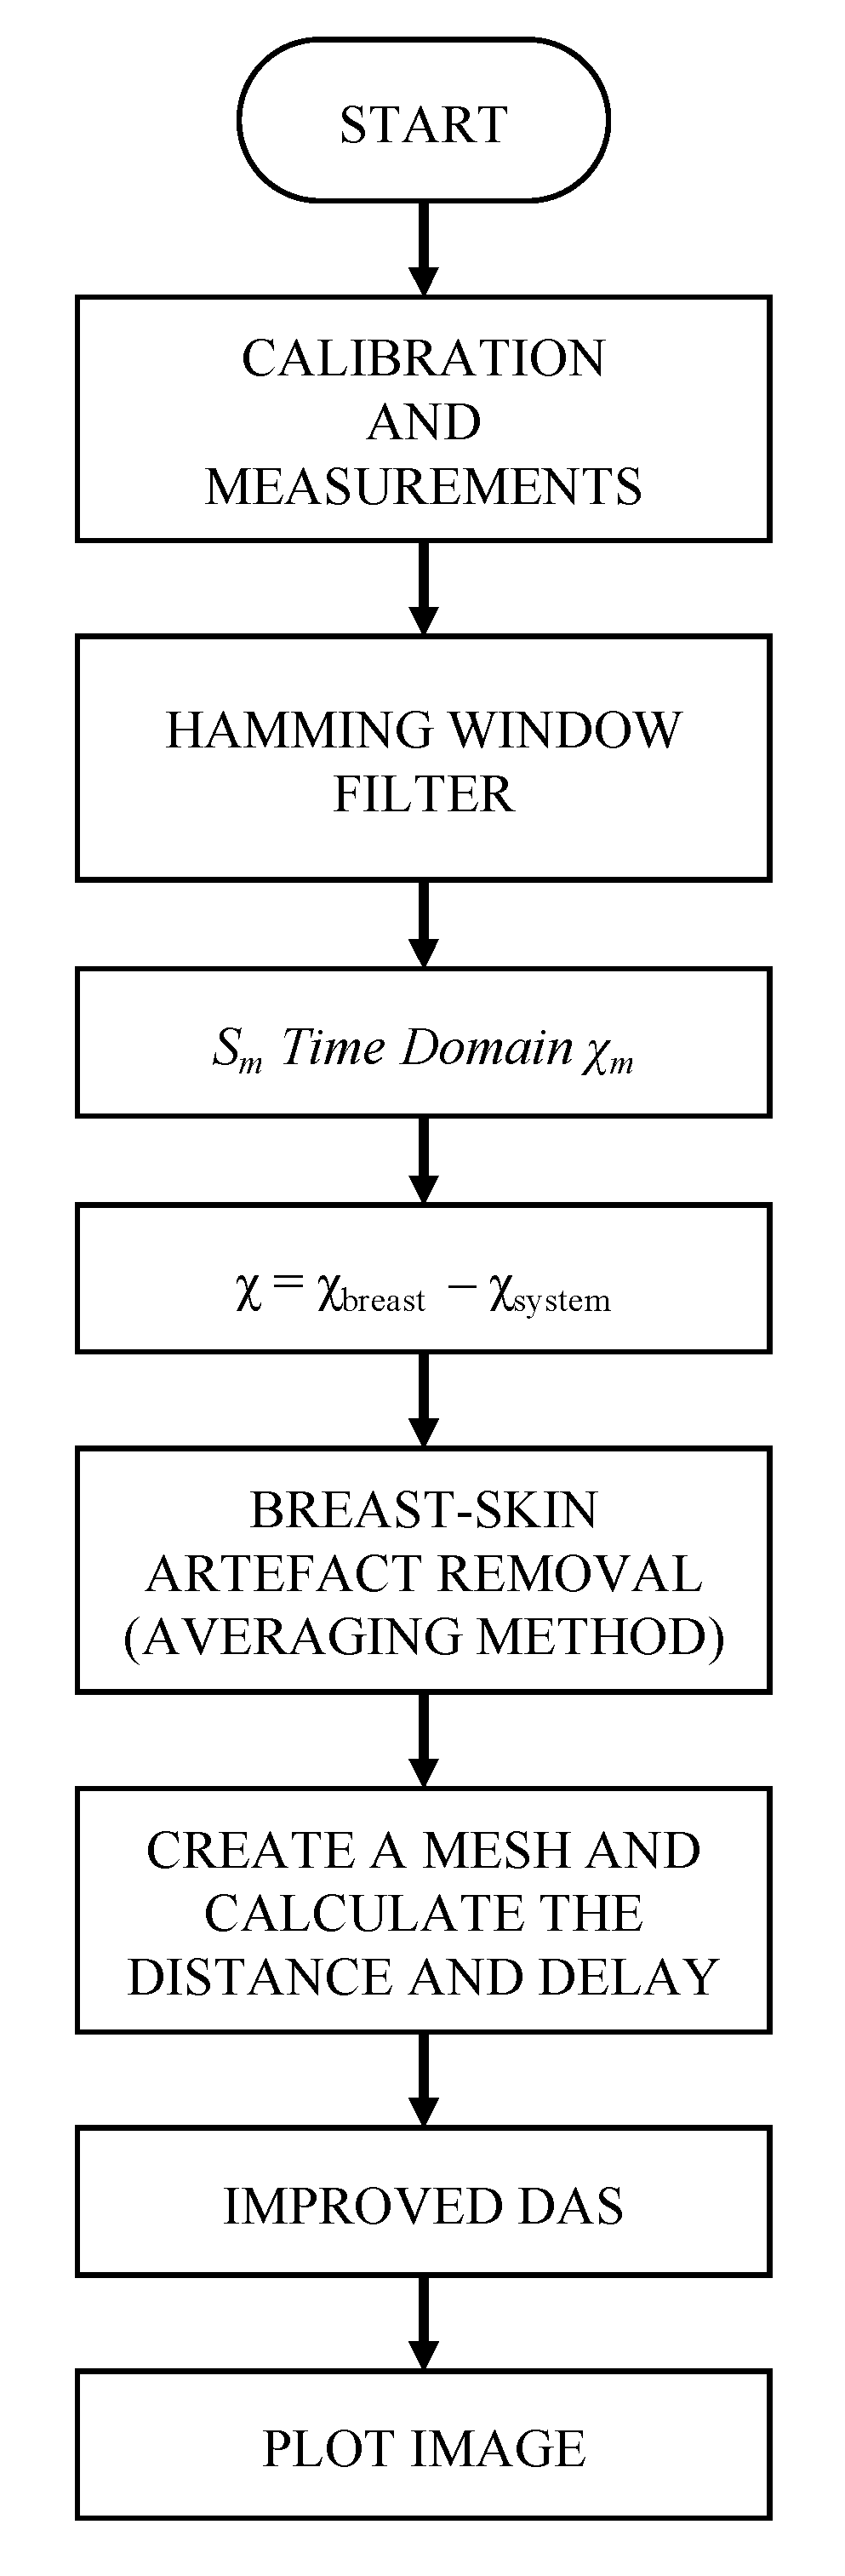
2.2. Medical Imaging Generation
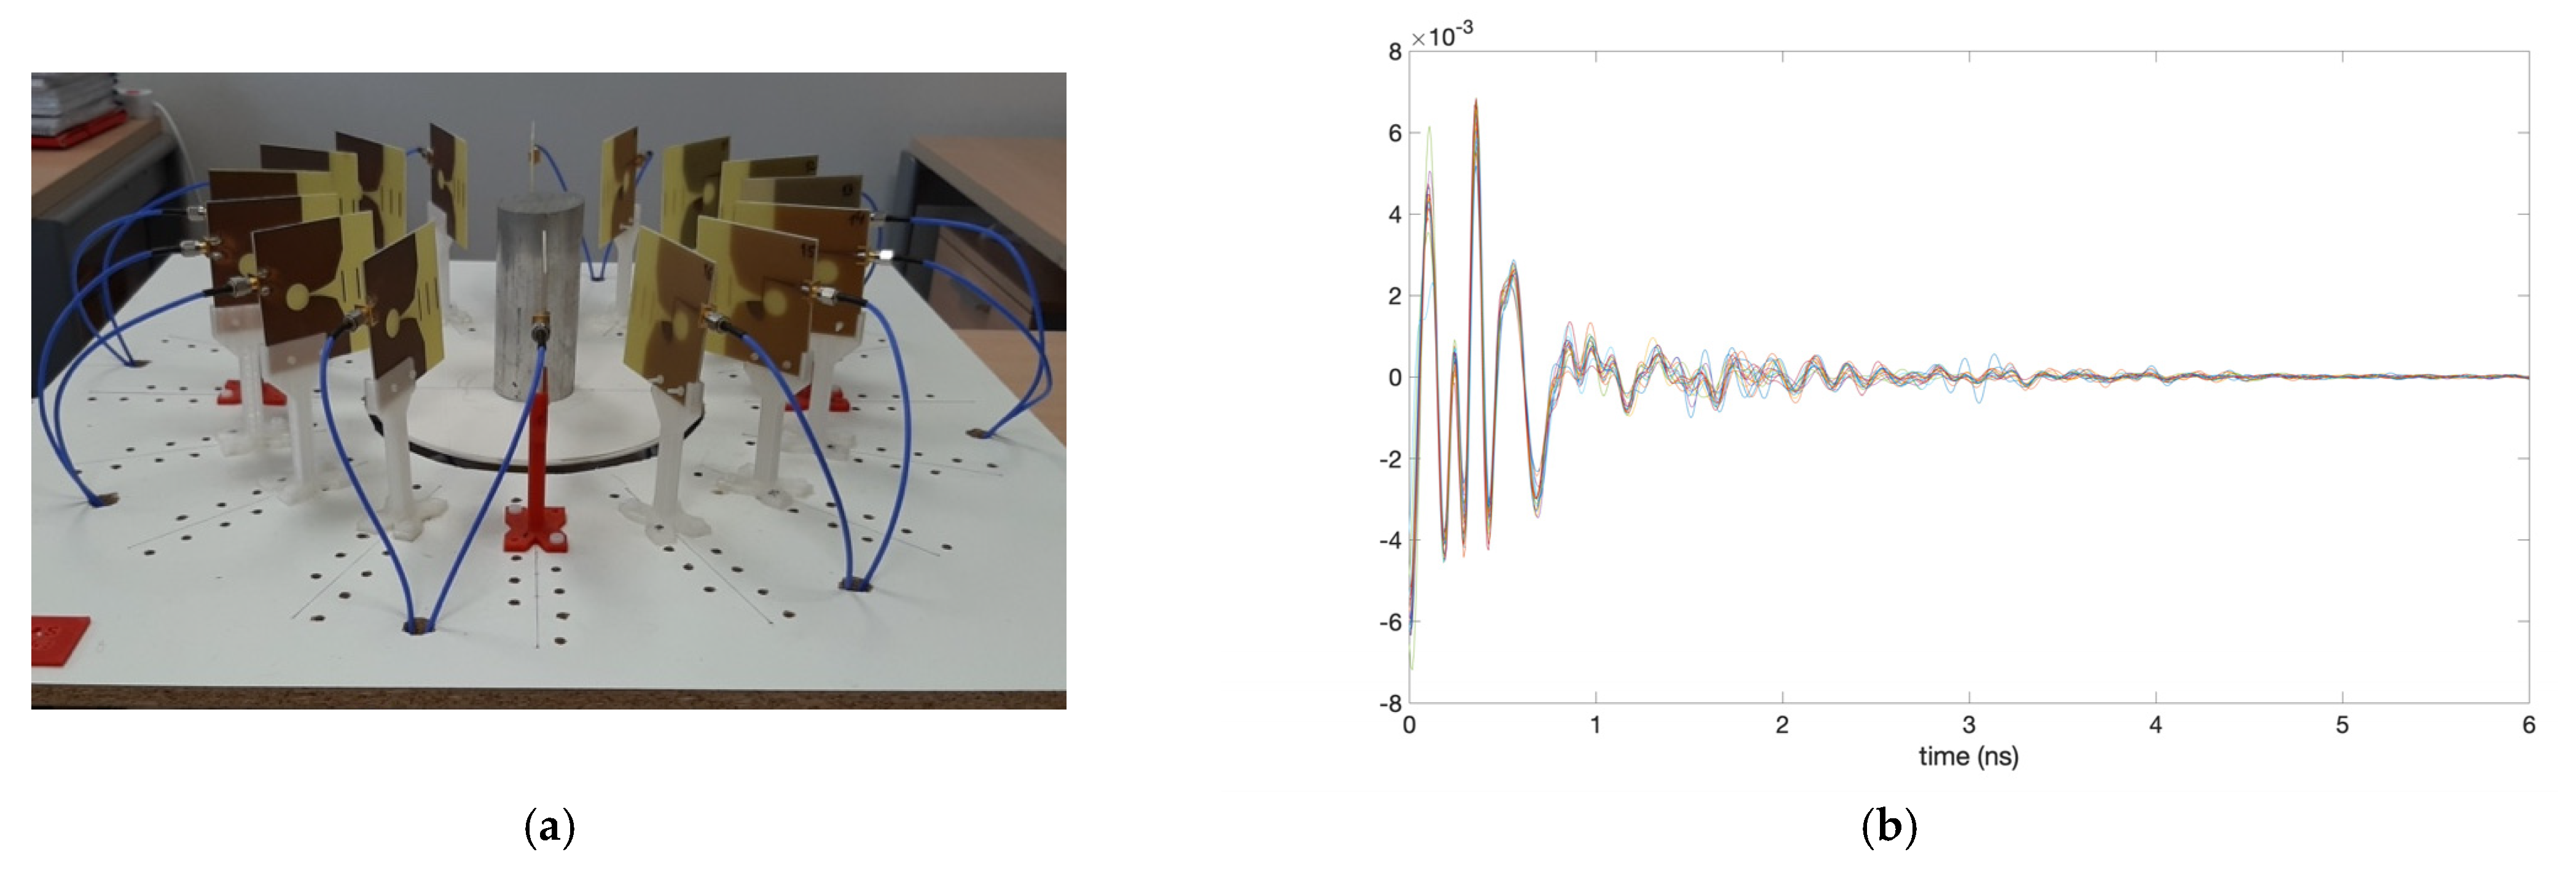
3. Calibration and Start-Up of the System
4. Results and Discussion
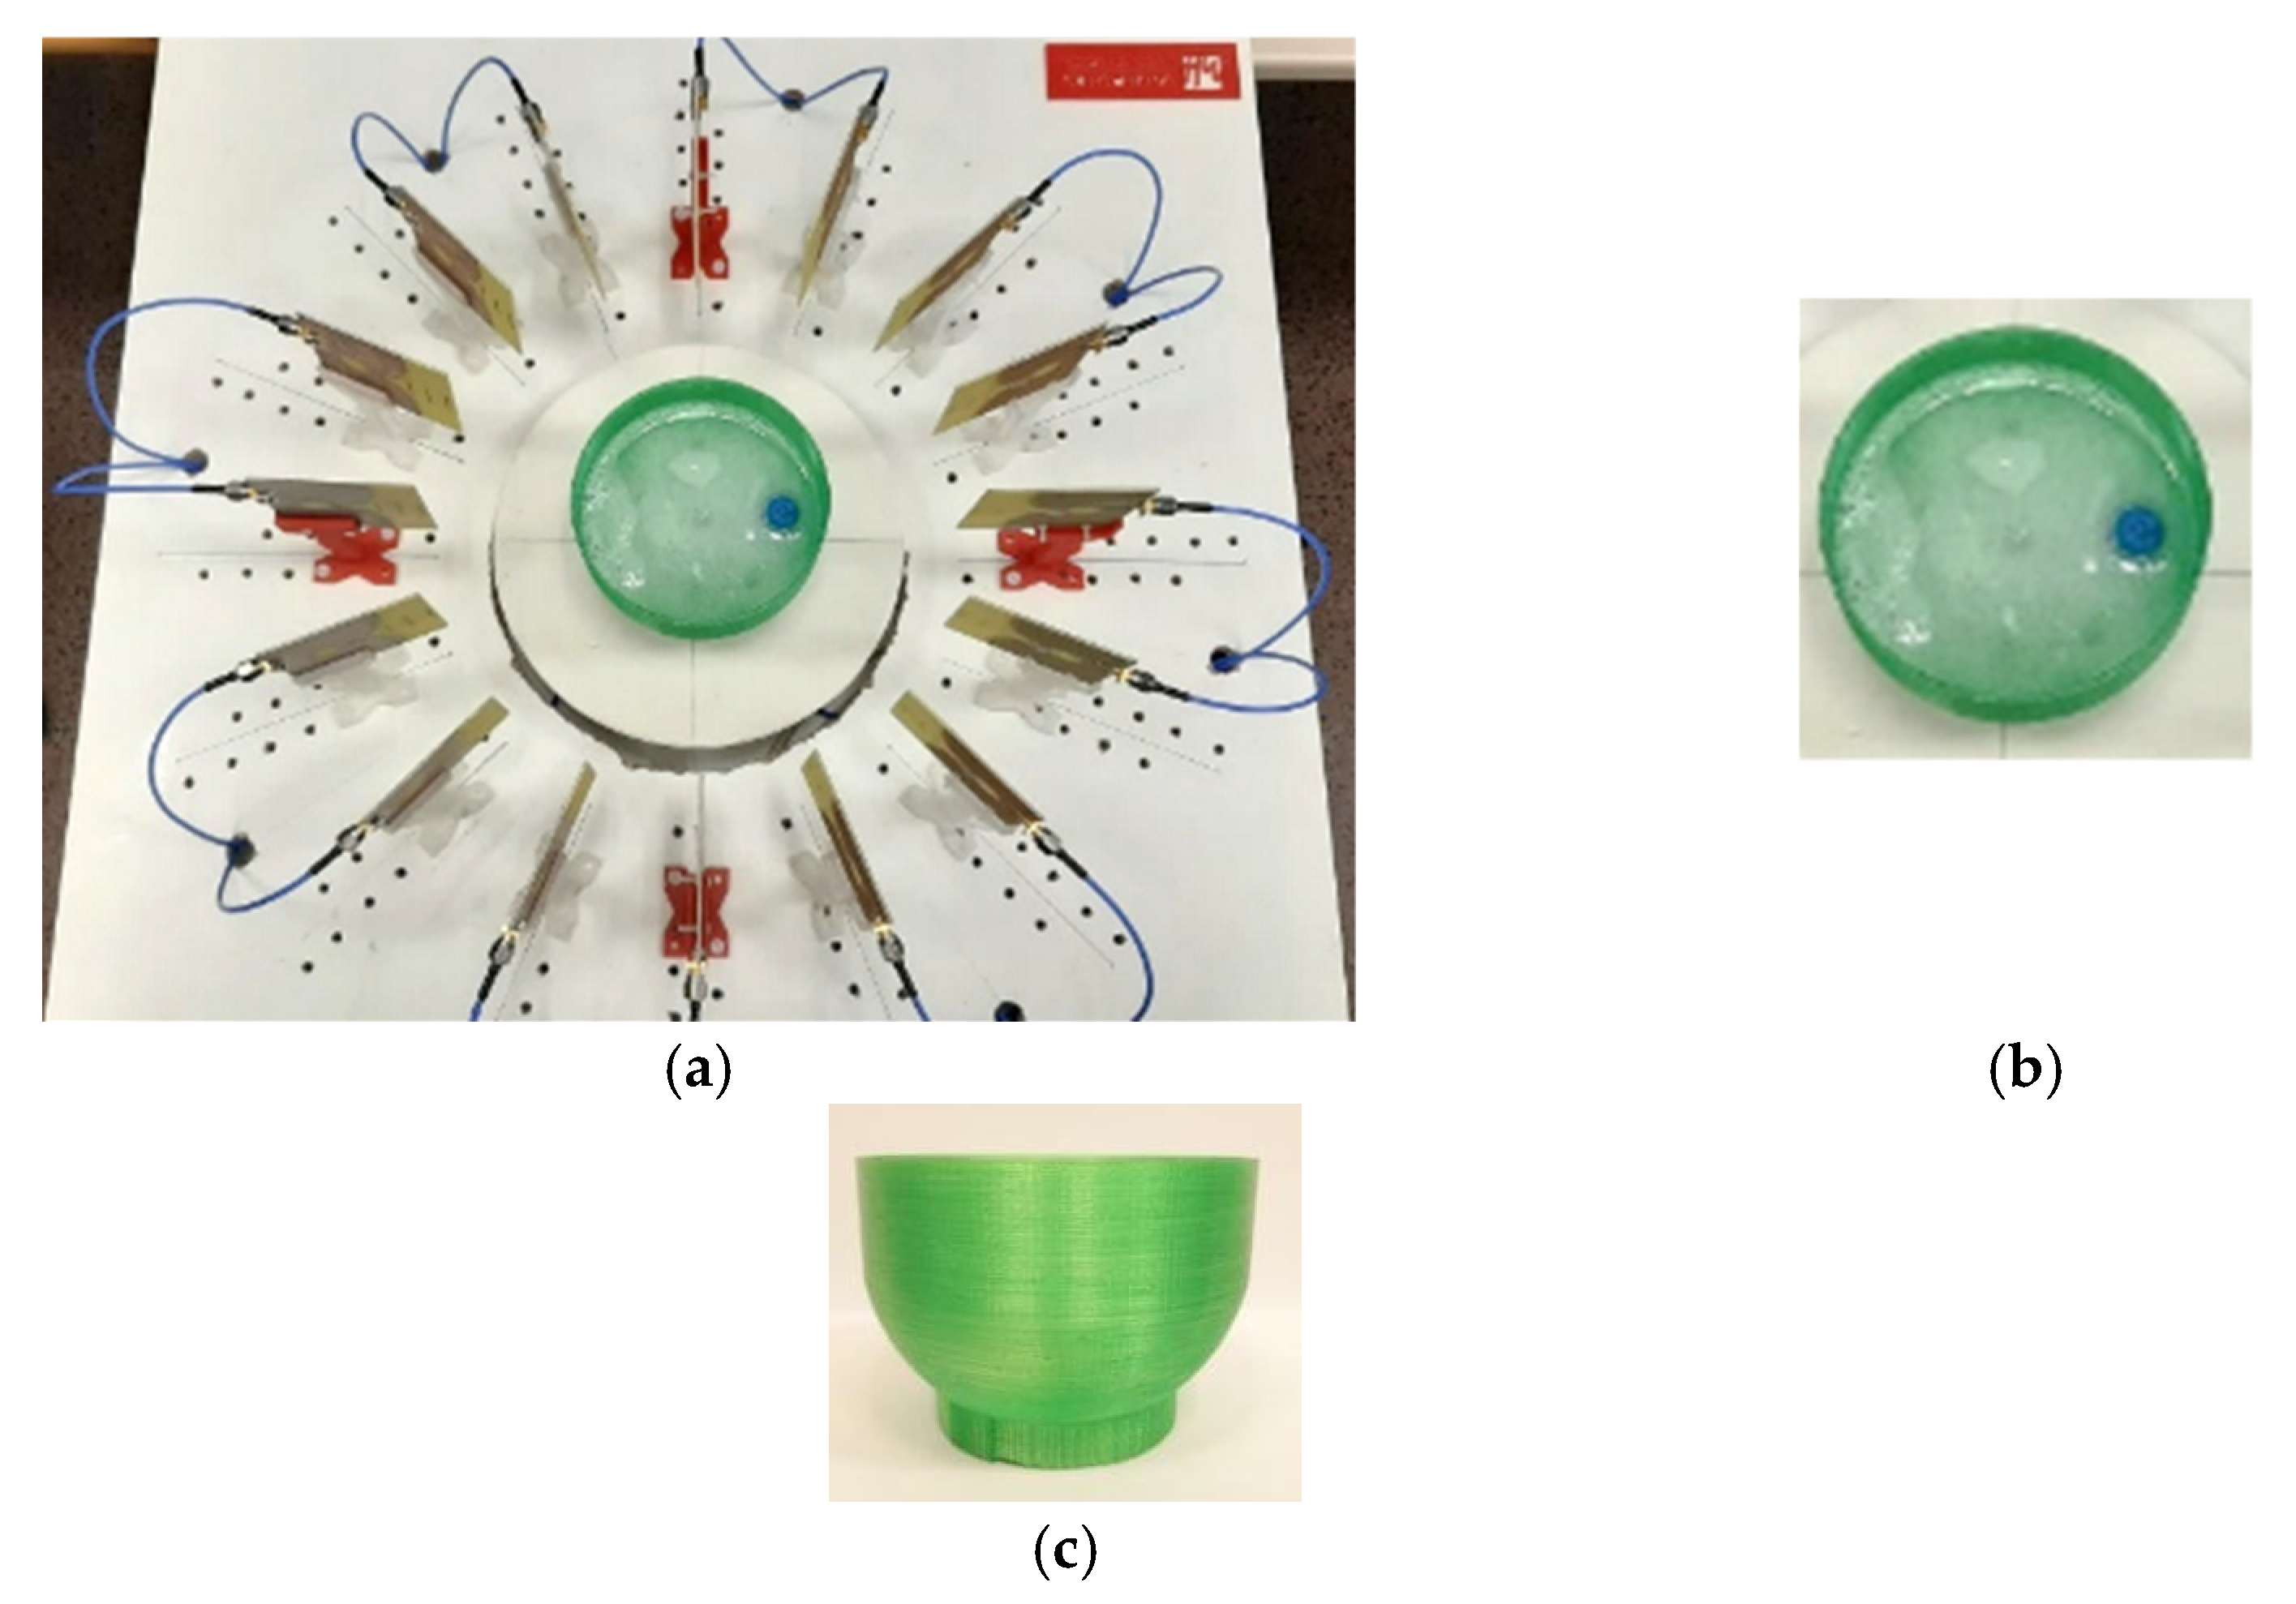
4.1. Breast and Tumour Phantoms
4.2. Detection of Different Tumour Phantoms
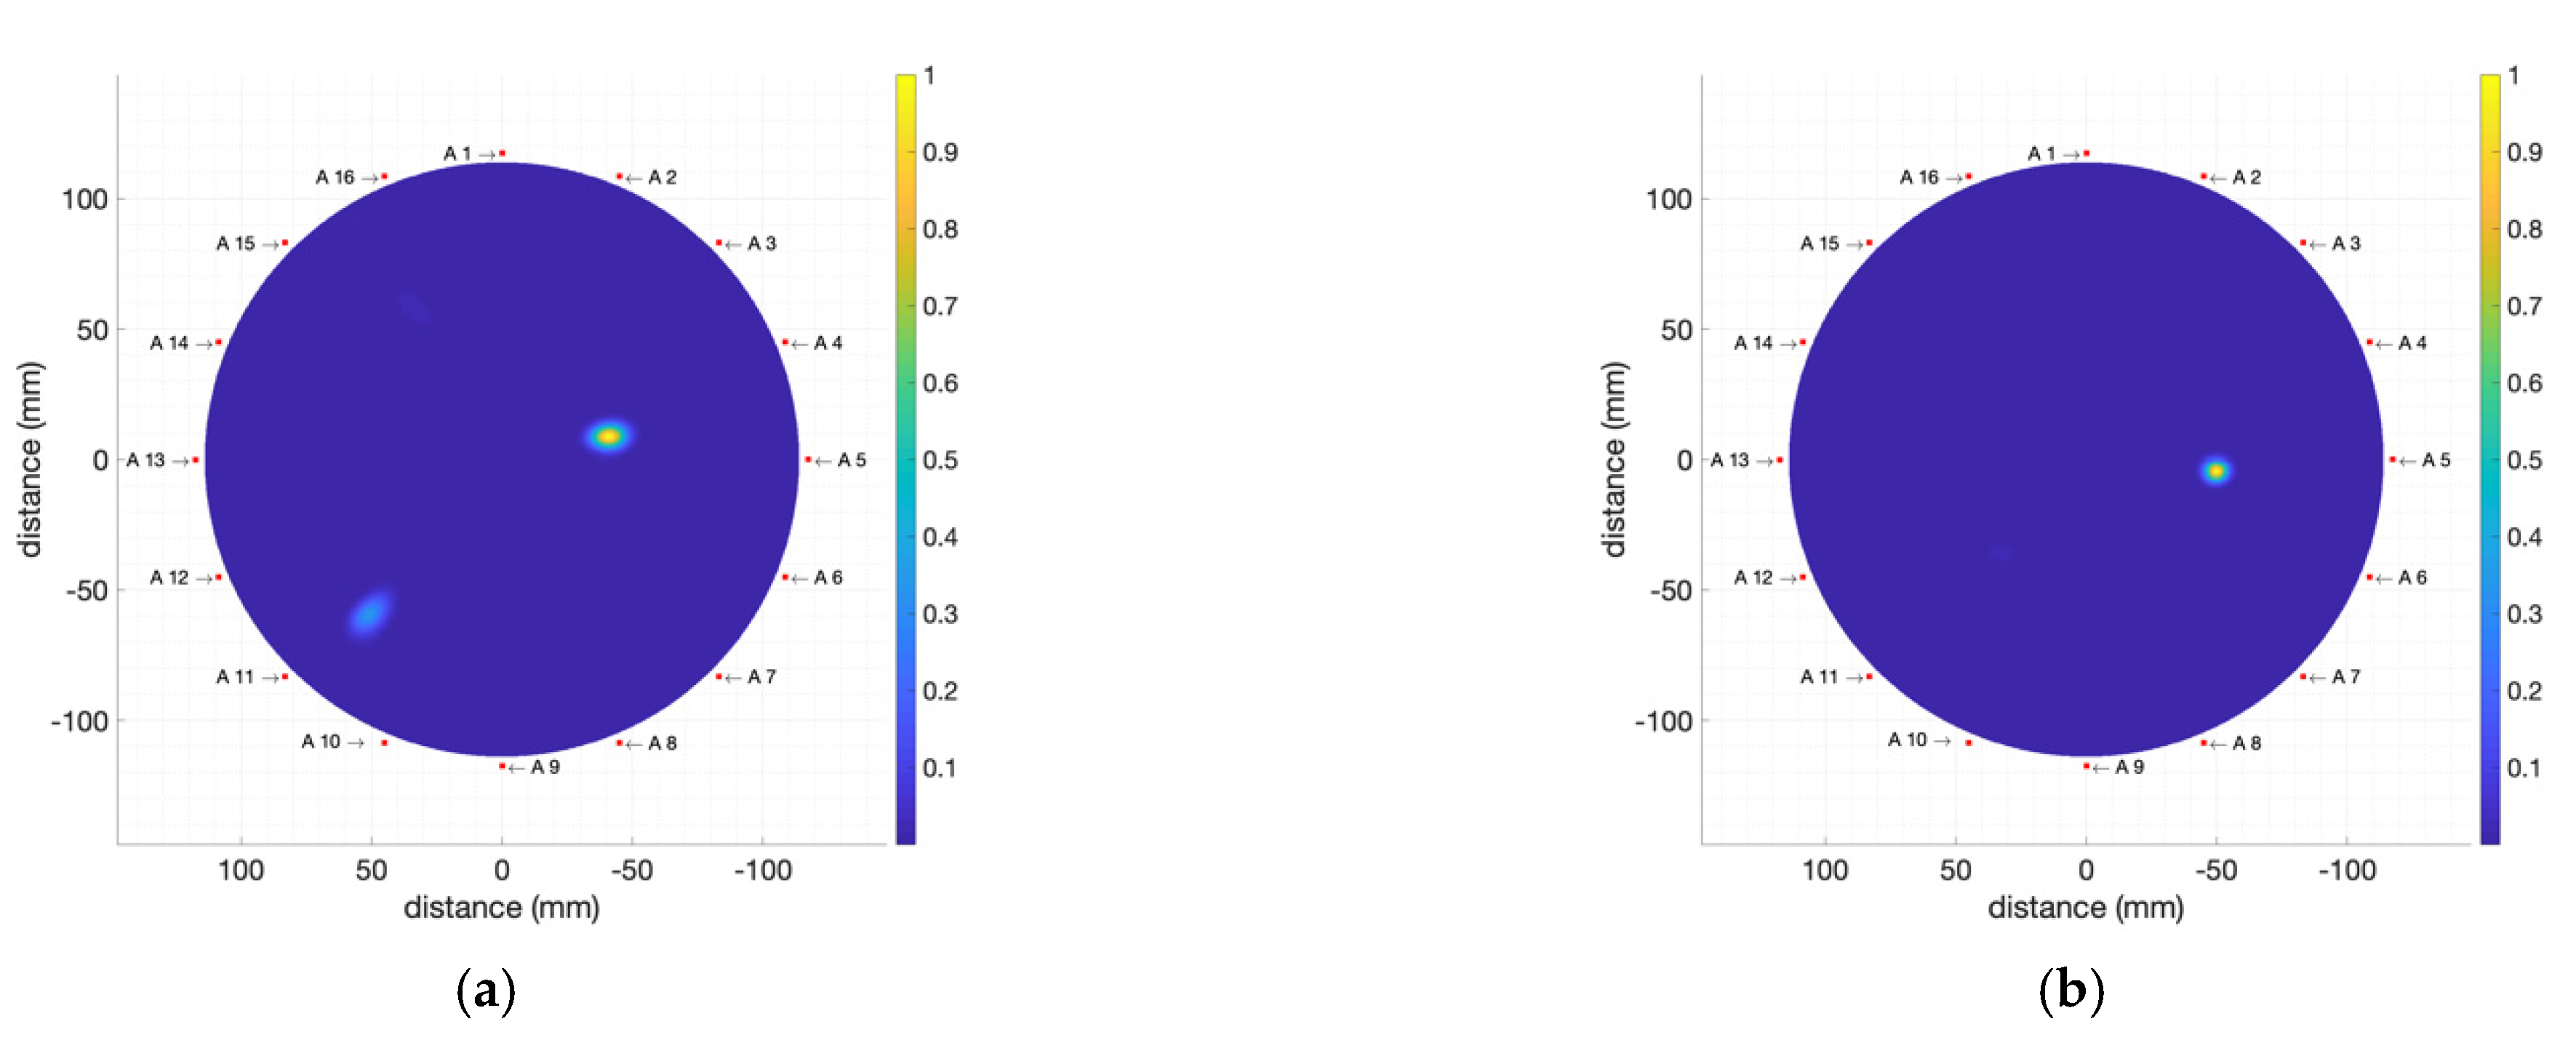
4.2.1. High-Electromagnetic-Absorption Tumour Phantoms
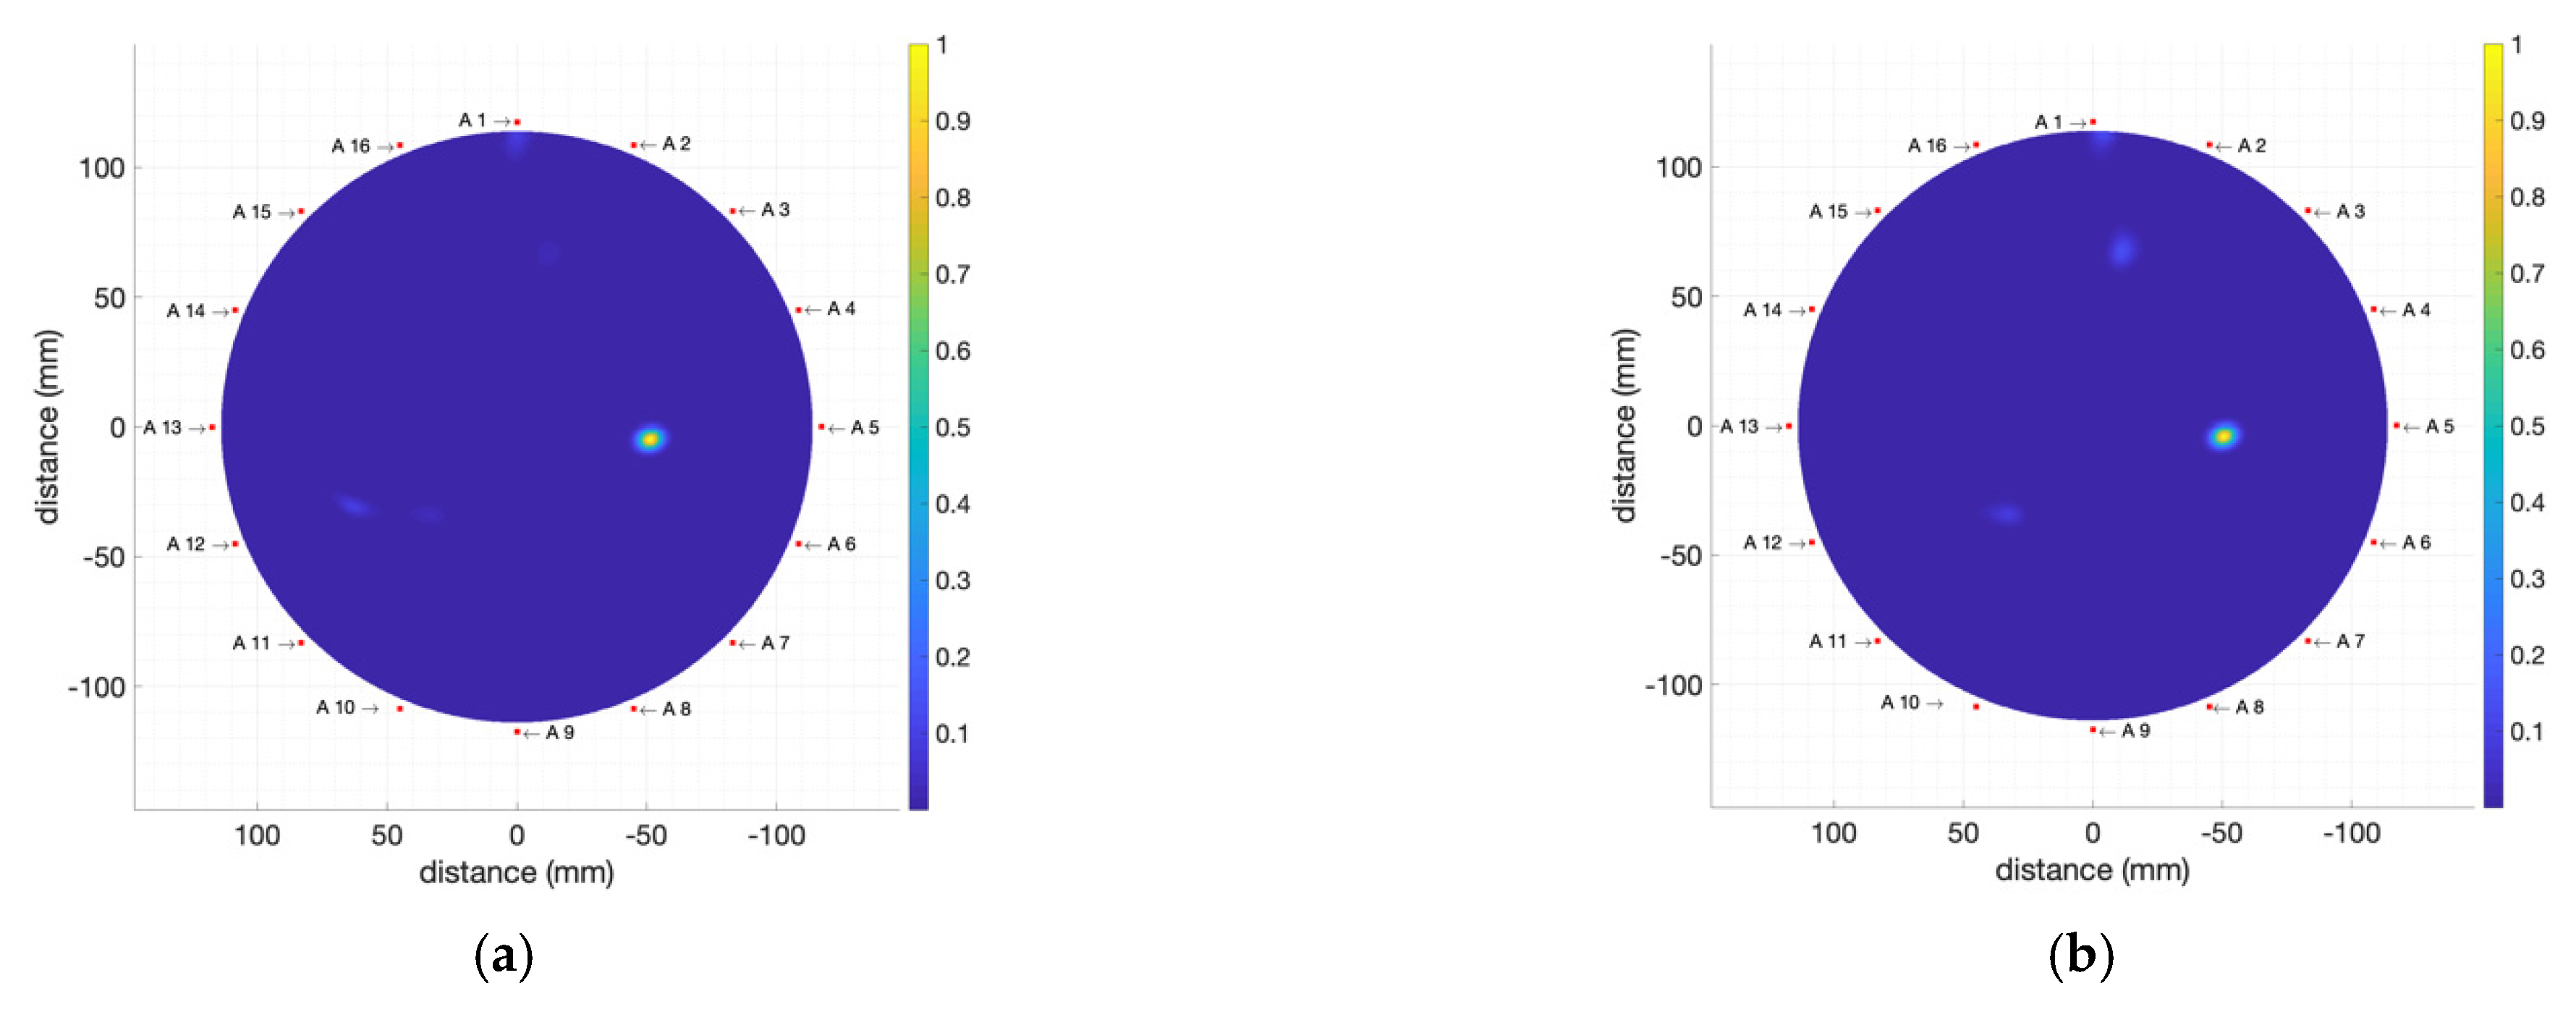
4.2.2. Moderate-Electromagnetic-Absorption Tumour Phantoms
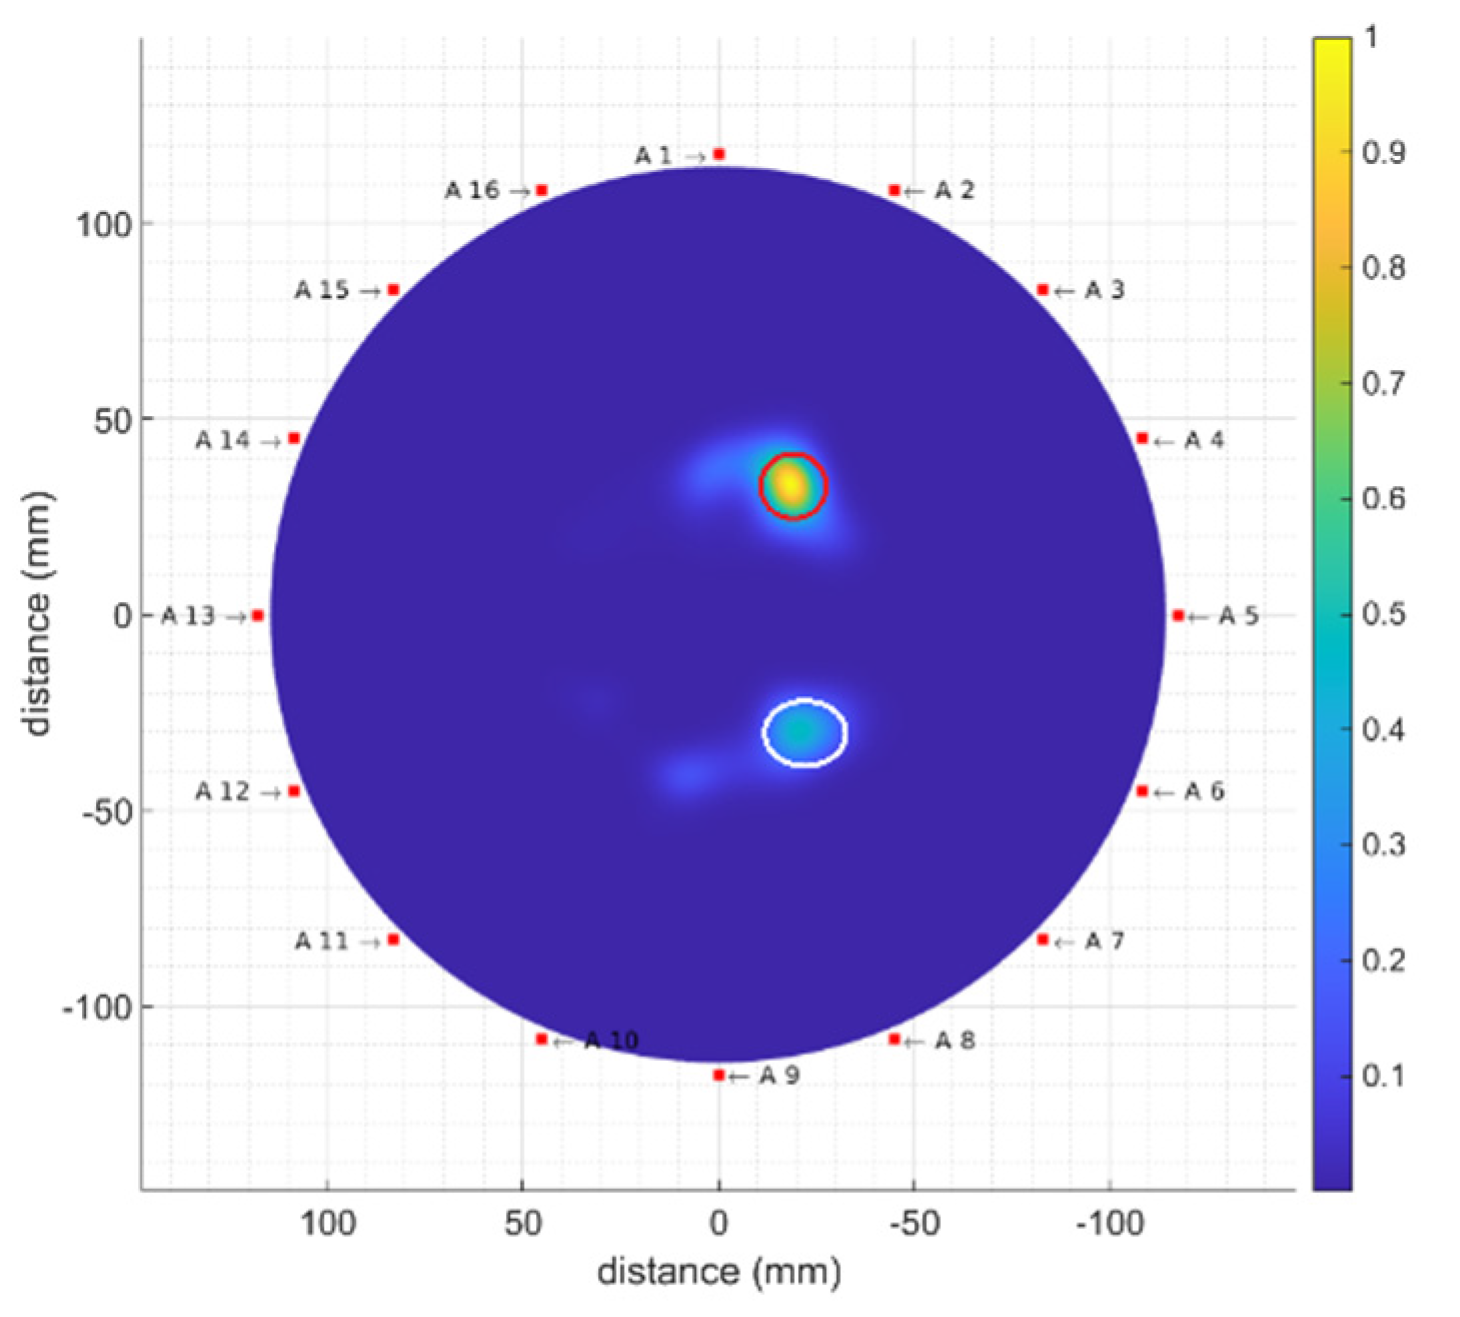
4.2.3. Multiple Tumour Detection
5. Conclusions
Author Contributions
Funding
Institutional Review Board Statement
Informed Consent Statement
Data Availability Statement
Conflicts of Interest
References
- World Health Organization. WHO Report on Cancer: Setting Priorities, Investing Wisely and Providing Care for All. 2020. Available online: https://apps.who.int/iris/handle/10665/330745 (accessed on 28 July 2022).
- Roslidar, R.; Rahman, A.; Muharar, R.; Syahputra, M.R.; Arnia, F.; Syukri, M.; Prahdan, B.; Munadi, K. A review on recent progress in thermal imaging and deep learning approaches for breast cancer detection. IEEE Access 2020, 8, 116176–116194. [Google Scholar] [CrossRef]
- Martínez-Lozano, A.; Blanco-Angulo, C.; García-Martínez, H.; Gutiérrez-Mazón, R.; Torregrosa-Penalva, G.; Ávila-Navarro, E.; Sabater-Navarro, J.M. UWB-printed rectangular-based monopole antenna for biological tissue analysis. Electronics 2021, 10, 304. [Google Scholar] [CrossRef]
- Kwon, S.; Lee, S. Recent advances in microwave imaging for breast cancer detection. Int. J. Biomed. Imaging 2016, 2016, 5054912. [Google Scholar] [CrossRef] [PubMed]
- Jiang, H. Diffuse Optical Tomography: Principles and Applications, 1st ed.; CRC Press: Boca Raton, FL, USA, 2010. [Google Scholar] [CrossRef]
- Lee, K. Optical mammography: Diffuse optical imaging of breast cancer. World J. Clin. Oncol. 2011, 2, 64–72. [Google Scholar] [CrossRef] [PubMed]
- Manohar, S.; Dantuma, M. Current and future trends in photoacoustic breast imaging. Photoacoustics 2019, 16, 100134. [Google Scholar] [CrossRef]
- AlSawaftah, N.; El-Abed, S.; Dhou, S.; Zakaria, A. Microwave imaging for early breast cancer detection: Current state, challenges, and future directions. J. Imaging 2022, 8, 123. [Google Scholar] [CrossRef]
- Ašmontas, S.; Kiprijanovič, O.; Levitas, B.; Matuzas, J.; Naidionova, I. Microwave radiation imaging using inverse synthetic aperture radar technique. Elektron. Elektrotech. 2015, 21, 33–36. [Google Scholar] [CrossRef][Green Version]
- Kučera, O.; Cifra, M. Radiofrequency and microwave interactions between biomolecular systems. J. Biol. Phys. 2016, 42, 1–8. [Google Scholar] [CrossRef]
- Diraco, G.; Leone, A.; Siciliano, P. A radar-based smart sensor for unobtrusive elderly monitoring in ambient assisted living applications. Biosensors 2017, 7, 55. [Google Scholar] [CrossRef]
- Kaatze, U.; Feldman, Y.; Ben Ishai, P.; Greenbaum, A.; Raicu, V. Experimental methods. In Dielectric Relaxation in Biological Systems: Physical Principles, Methods, and Application; Raicu, V., Feldman, Y., Eds.; Oxford University Press: Oxford, UK, 2015; pp. 109–139. [Google Scholar] [CrossRef]
- Gabriel, S.; Lau, R.W.; Gabriel, C. The dielectric properties of biological tissues: III. Parametric models for the dielectric spectrum of tissues. Phys. Med. Biol. 1996, 41, 2271–2293. [Google Scholar] [CrossRef]
- Lazebnik, M.; Popovic, D.; McCartney, L.; Watkins, C.B.; Lindstrom, M.J.; Harter, J.; Sewall, S.; Ogilvie, T.; Magliocco, A.; Breslin, T.M.; et al. A large-scale study of the ultrawideband microwave dielectric properties of normal, benign and malignant breast tissues obtained from cancer surgeries. Phys. Med. Biol. 2007, 52, 6093–6115. [Google Scholar] [CrossRef] [PubMed]
- Gartshore, A.; Kidd, M.; Joshi, L.T. Applications of microwave energy in medicine. Biosensors 2021, 11, 96. [Google Scholar] [CrossRef] [PubMed]
- Porter, E.; Bahrami, H.; Santorelli, A.; Gosselin, B.; Rusch, L.A.; Popović, M. A wearable microwave antenna array for time-domain breast tumor screening. IEEE Trans. Med. Imaging 2016, 35, 1501–1509. [Google Scholar] [CrossRef]
- Oloumi, D.; Winter, R.S.C.; Kordzadeh, A.; Boulanger, P.; Rambabu, K. Microwave imaging of breast tumor using time-domain UWB circular-SAR technique. IEEE Trans. Med. Imaging 2020, 39, 934–943. [Google Scholar] [CrossRef]
- Mohammed, B.J.; Abbosh, A.M.; Mustafa, S.; Ireland, D. Microwave system for head imaging. IEEE Trans. Instrum. Meas. 2014, 63, 117–123. [Google Scholar] [CrossRef]
- Meaney, P.M.; Fanning, M.W.; Li, D.; Poplack, S.P.; Paulsen, K.D. A clinical prototype for active microwave imaging of the breast. IEEE Trans. Microw. Theory Tech. 2000, 48, 1841–1853. [Google Scholar] [CrossRef]
- Grzegorczyk, T.M.; Meaney, P.M.; Kaufman, P.A.; diFlorio-Alexander, R.M.; Paulsen, K.D. Fast 3-D tomographic microwave imaging for breast cancer detection. IEEE Trans. Med. Imaging 2012, 31, 1584–1592. [Google Scholar] [CrossRef] [PubMed]
- Wang, L. Early diagnosis of breast cancer. Sensors 2017, 17, 1572. [Google Scholar] [CrossRef]
- Henriksson, T. Contribution to Quantitative Microwave Imaging Techniques for Biomedical Applications. Ph.D. Thesis, School of Innovation, Design and Engineering, Mälardalen University, Västerås, Sweden, 2009. [Google Scholar]
- Joachimowicz, N.; Conessa, C.; Henriksson, T.; Duchêne, B. Breast phantoms for microwave imaging. IEEE Antennas Wirel. Propag. Lett. 2014, 13, 1333–1336. [Google Scholar] [CrossRef]
- Di Meo, S.; Pasotti, L.; Iliopoulos, I.; Pasian, M.; Ettorre, M.; Zhadobov, M.; Matrone, G. Tissue-mimicking materials for breast phantoms up to 50 GHz. Phys. Med. Biol. 2019, 64, 055006. [Google Scholar] [CrossRef]
- Yang, Y.; Wang, Y.; Fathy, A. Design of compact Vivaldi antenna arrays for UWB see through wall applications. Prog. Electromagn. Res. 2008, 82, 401–418. [Google Scholar] [CrossRef]
- Guruswamy, S.; Chinniah, R.; Thangavelu, K. A printed compact UWB Vivaldi antenna with hemi cylindrical slots and directors for microwave imaging applications. AEU-Int. J. Electron. Commun. 2019, 110, 152870. [Google Scholar] [CrossRef]
- Chiappe, M.; Gragnani, G.L. Vivaldi antennas for microwave imaging: Theoretical analysis and design considerations. IEEE Trans. Instrum. Meas. 2006, 55, 1885–1891. [Google Scholar] [CrossRef]
- Liu, Z.; Zhu, Y.; Zhou, J. Improved design of Vivaldi antenna with loading resistance for wideband applications. In Proceedings of the IEEE International Conference on Microwave and Millimeter Wave Technology (ICMMT), Beijing, China, 5–8 June 2016; pp. 286–289. [Google Scholar] [CrossRef]
- Quintero, G.; Zurcher, J.-F.; Skrivervik, A.K. System Fidelity Factor: A new method for comparing UWB antennas. IEEE Trans. Antennas Propag. 2011, 59, 2502–2512. [Google Scholar] [CrossRef]
- Li, X.; Hagness, S.C. A confocal microwave imaging algorithm for breast cancer detection. IEEE Microw. Wirel. Compon. Lett. 2001, 11, 130–132. [Google Scholar] [CrossRef]
- Lim, H.B.; Nhung, N.T.T.; Li, E.-P.; Thang, N.D. Confocal microwave imaging for breast cancer detection: Delay-Multiply-and-Sum image reconstruction algorithm. IEEE Trans. Biomed. Eng. 2008, 55, 1697–1704. [Google Scholar] [CrossRef]
- Klemm, M.; Leendertz, J.A.; Gibbins, D.; Craddock, I.J.; Preece, A.; Benjamin, R. Microwave radar-based breast cancer detection: Imaging in inhomogeneous breast phantoms. IEEE Antennas Wirel. Propag. Lett. 2009, 8, 1349–1352. [Google Scholar] [CrossRef]
- Fear, E.C.; Li, X.; Hagness, S.C.; Stuchly, M.A. Confocal microwave imaging for breast cancer detection: Localization of tumors in three dimensions. IEEE Trans. Biomed. Eng. 2002, 49, 812–822. [Google Scholar] [CrossRef]
- Mashal, A.; Gao, F.; Hagness, S.C. Heterogeneous anthropomorphic phantoms with realistic dielectric properties for microwave breast imaging experiments. Microw. Opt. Technol. Lett. 2011, 53, 1896–1902. [Google Scholar] [CrossRef]
- Salvador, S.M.; Vecchi, G. Experimental tests of microwave breast cancer detection on phantoms. IEEE Trans. Antennas Propag. 2009, 57, 1705–1712. [Google Scholar] [CrossRef]
- Fear, E.C.; Meaney, P.M.; Stuchly, M.A. Microwaves for breast cancer detection? IEEE Potentials 2003, 22, 12–18. [Google Scholar] [CrossRef]
- Romeo, S.; Di Donato, L.; Bucci, O.M.; Catapano, I.; Crocco, L.; Scarfì, M.R.; Massa, R. Dielectric characterization study of liquid-based materials for mimicking breast tissues. Microw. Opt. Technol. Lett. 2011, 53, 1276–1280. [Google Scholar] [CrossRef]
- Joachimowicz, N.; Duchêne, B.; Conessa, C.; Meyer, O. Anthropomorphic breast and head phantoms for microwave imaging. Diagnostics 2018, 8, 85. [Google Scholar] [CrossRef] [PubMed]
- Eldamak, A.R.; Thorson, S.; Fear, E.C. Study of the dielectric properties of artificial sweat mixtures at microwave frequencies. Biosensors 2020, 10, 62. [Google Scholar] [CrossRef]
- Costanzo, S.; Cioffi, V.; Qureshi, A.M.; Borgia, A. Gel-like human mimicking phantoms: Realization procedure, dielectric characterization and experimental validations on microwave wearable body sensors. Biosensors 2021, 11, 111. [Google Scholar] [CrossRef]
- Sugitani, T.; Kubota, S.-I.; Kuroki, S.-I.; Sogo, K.; Arihiro, K.; Okada, M.; Kadoya, T.; Hide, M.; Oda, M.; Kikkawa, T. Complex permittivities of breast tumor tissues obtained from cancer surgeries. Appl. Phys. Lett. 2014, 104, 253702. [Google Scholar] [CrossRef]
- Ellison, W.; Balana, A.; Delbos, G.; Lamkaouchi, K.; Eymard, L.; Guillou, C.; Prigent, C. New permittivity measurements of seawater. Radio Sci. 1998, 33, 639–648. [Google Scholar] [CrossRef]
- Di Meo, S.; Espin-Lopez, P.F.; Martellosio, A.; Pasian, M.; Bozzi, M.; Perregrini, L.; Mazzanti, A.; Svelto, A.; Summers, P.E.; Renne, G.; et al. Dielectric properties of breast tissues: Experimental results up to 50 GHz. In Proceedings of the 12th European Conference on Antennas and Propagation (EuCAP 2018), London, UK, 9–13 April 2018. [Google Scholar] [CrossRef]
- Martellosio, A.; Pasian, M.; Bozzi, M.; Perregrini, L.; Mazzanti, A.; Svelto, F.; Summers, P.E.; Renne, G.; Preda, L.; Bellomi, M. Dielectric properties characterization from 0.5 to 50 GHz of breast cancer tissues. IEEE Trans. Microw. Theory Tech. 2017, 65, 998–1011. [Google Scholar] [CrossRef]
- García-Martínez, H.; Ávila-Navarro, E.; Torregrosa-Penalva, G.; Rodríguez-Martínez, A.; Blanco-Angulo, C.; de la Casa-Lillo, M.Á. Low-cost additive manufacturing techniques applied to the design of planar microwave circuits by fused deposition modelling. Polymers 2020, 12, 1946. [Google Scholar] [CrossRef]
- Marinov, O. Noise partition in S-parameter measurement. In Proceedings of the 22nd International Conference on Noise and Fluctuations (ICNF 2013), Montpellier, France, 24–28 June 2013. [Google Scholar] [CrossRef]
- Gu, D.; Jargon, J.A.; Ryan, M.J.; Hubrechsen, A. Influence of noise on scattering-parameter measurements. IEEE Trans. Microw. Theory Tech. 2020, 68, 4925–4939. [Google Scholar] [CrossRef]


| Dimension | Value | Dimension | Value | Dimension | Value |
|---|---|---|---|---|---|
| LA | 68.0 mm | LG | 27.7 mm | GB | 9.9 mm |
| LB | 70.0 mm | LH | 12.8 mm | GC | 38.0 mm |
| LC | 49.0 mm | LI | 16.0 mm | GD | 8.0 mm |
| LD | 16.0 mm | WA | 1.0 mm | RA | 7.0 mm |
| LE | 15.2 mm | WB | 0.6 mm | RB | 9.4 mm |
| LF | 34.2 mm | GA | 1.3 mm |
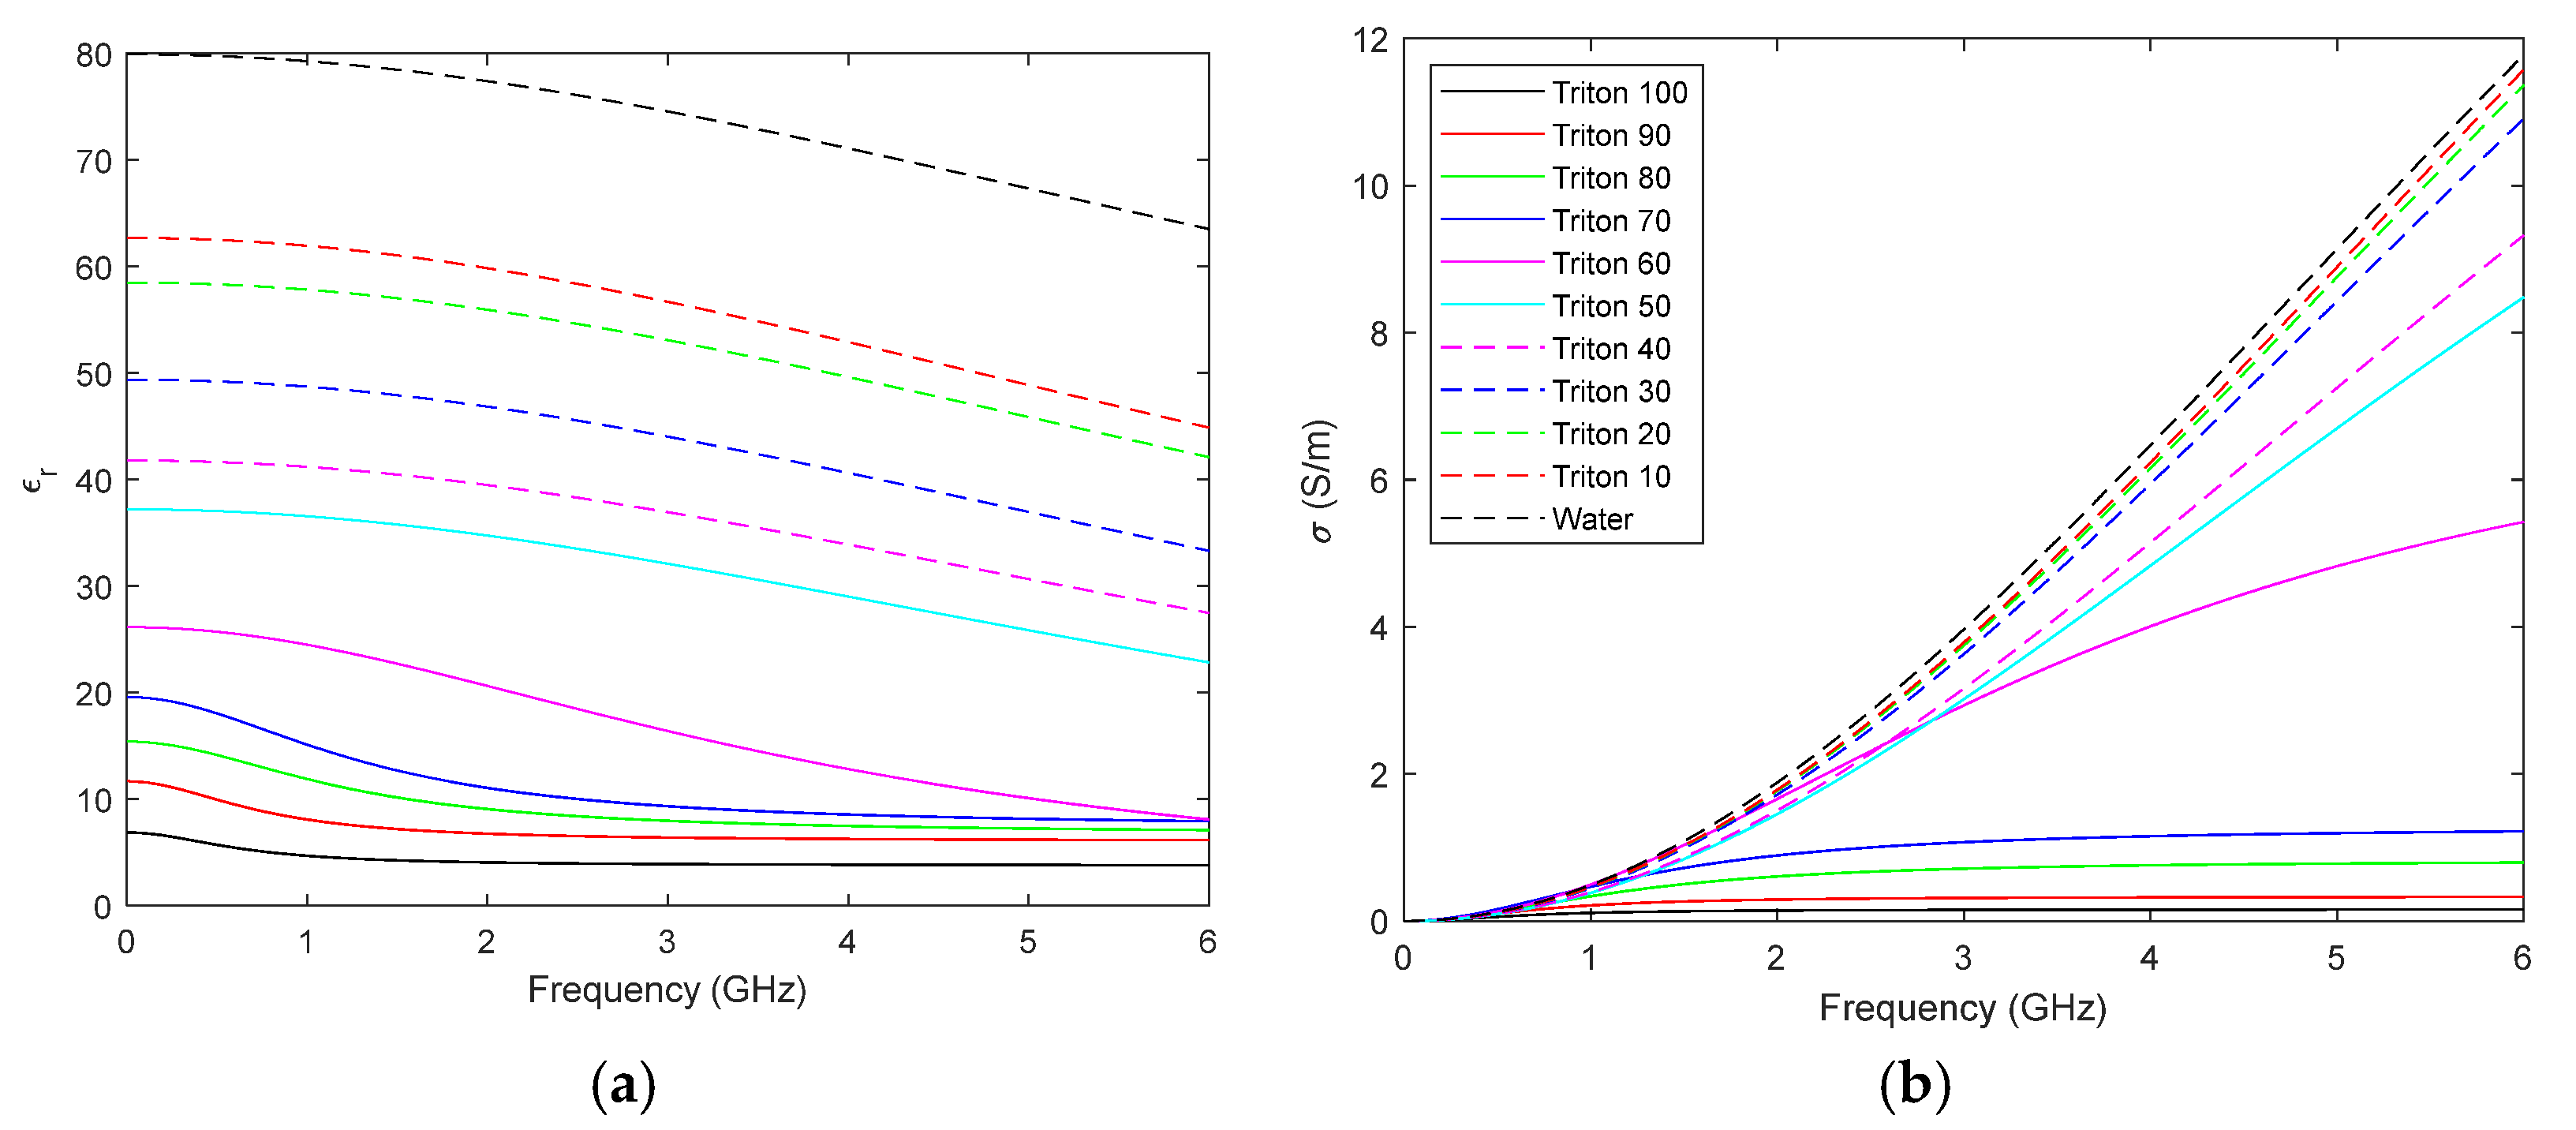
| Phantom | % TRITON X-100 | % Distilled Water | % Seawater | εr @ 3 GHz | σ [S/m] @ 3 GHz |
|---|---|---|---|---|---|
| Breast | 50 | 50 | 0 | 32 | 3.02 |
| Tumour 1 (T1) | 0 | 0 | 100 | 70 | 7.09 [42] |
| Tumour 2 (T2) | 10 | 90 | 0 | 57 | 3.79 |
| Tumour 3 (T3) | 20 | 80 | 0 | 53 | 3.75 |
| Tumour 4 (T4) | 30 | 70 | 0 | 44 | 3.63 |
Publisher’s Note: MDPI stays neutral with regard to jurisdictional claims in published maps and institutional affiliations. |
© 2022 by the authors. Licensee MDPI, Basel, Switzerland. This article is an open access article distributed under the terms and conditions of the Creative Commons Attribution (CC BY) license (https://creativecommons.org/licenses/by/4.0/).
Share and Cite
Blanco-Angulo, C.; Martínez-Lozano, A.; Gutiérrez-Mazón, R.; Juan, C.G.; García-Martínez, H.; Arias-Rodríguez, J.; Sabater-Navarro, J.M.; Ávila-Navarro, E. Non-Invasive Microwave-Based Imaging System for Early Detection of Breast Tumours. Biosensors 2022, 12, 752. https://doi.org/10.3390/bios12090752
Blanco-Angulo C, Martínez-Lozano A, Gutiérrez-Mazón R, Juan CG, García-Martínez H, Arias-Rodríguez J, Sabater-Navarro JM, Ávila-Navarro E. Non-Invasive Microwave-Based Imaging System for Early Detection of Breast Tumours. Biosensors. 2022; 12(9):752. https://doi.org/10.3390/bios12090752
Chicago/Turabian StyleBlanco-Angulo, Carolina, Andrea Martínez-Lozano, Roberto Gutiérrez-Mazón, Carlos G. Juan, Héctor García-Martínez, Julia Arias-Rodríguez, José M. Sabater-Navarro, and Ernesto Ávila-Navarro. 2022. "Non-Invasive Microwave-Based Imaging System for Early Detection of Breast Tumours" Biosensors 12, no. 9: 752. https://doi.org/10.3390/bios12090752
APA StyleBlanco-Angulo, C., Martínez-Lozano, A., Gutiérrez-Mazón, R., Juan, C. G., García-Martínez, H., Arias-Rodríguez, J., Sabater-Navarro, J. M., & Ávila-Navarro, E. (2022). Non-Invasive Microwave-Based Imaging System for Early Detection of Breast Tumours. Biosensors, 12(9), 752. https://doi.org/10.3390/bios12090752