Real-Time Cuffless Continuous Blood Pressure Estimation Using 1D Squeeze U-Net Model: A Progress toward mHealth


Abstract
:1. Introduction
- Real-time BP values are estimated by using a single-channel raw PPG signal as the input of the mobile application-friendly modified 1D Squeeze U-net model.
- This study is a novel approach to implementing a DL 1D Squeeze U-net model in an mHealth application, using PPG signals without any feature selection to generate BP values with high accuracy and at no cost.
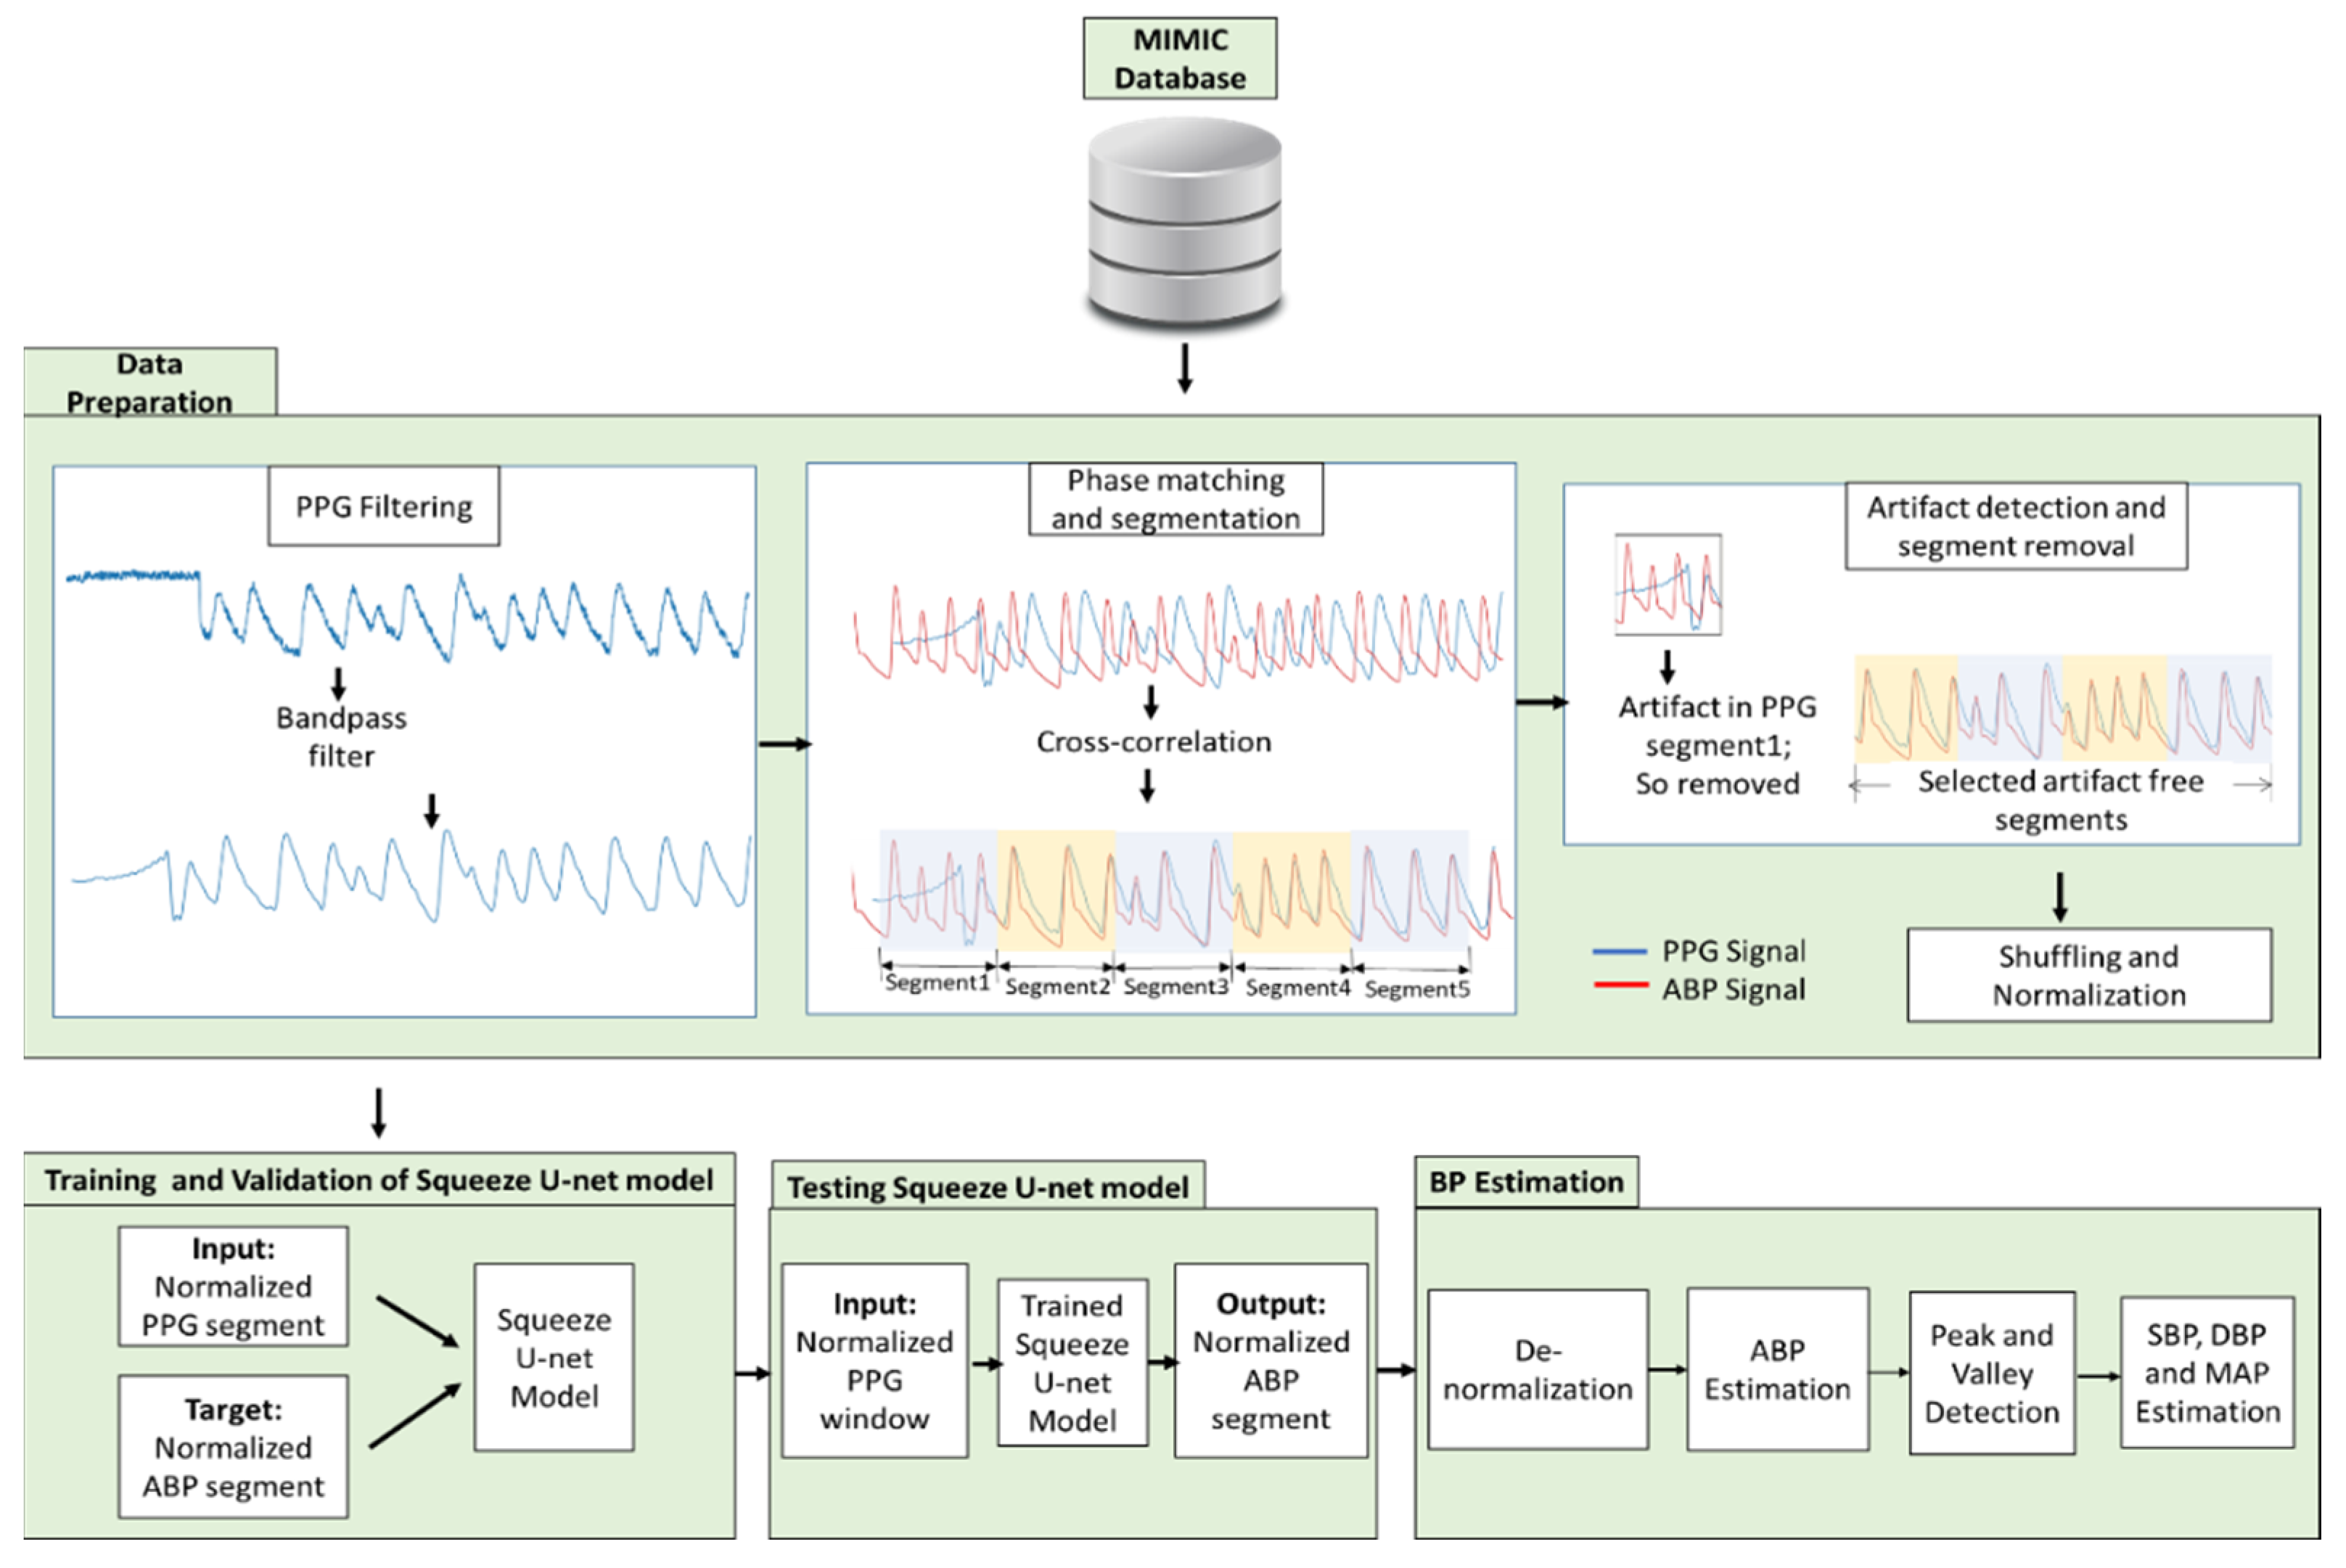
2. Materials and Methods
2.1. Data Acquisition
- Multiparameter Intelligent Monitoring in Intensive Care (MIMIC) database [29].
2.2. Data Preparation
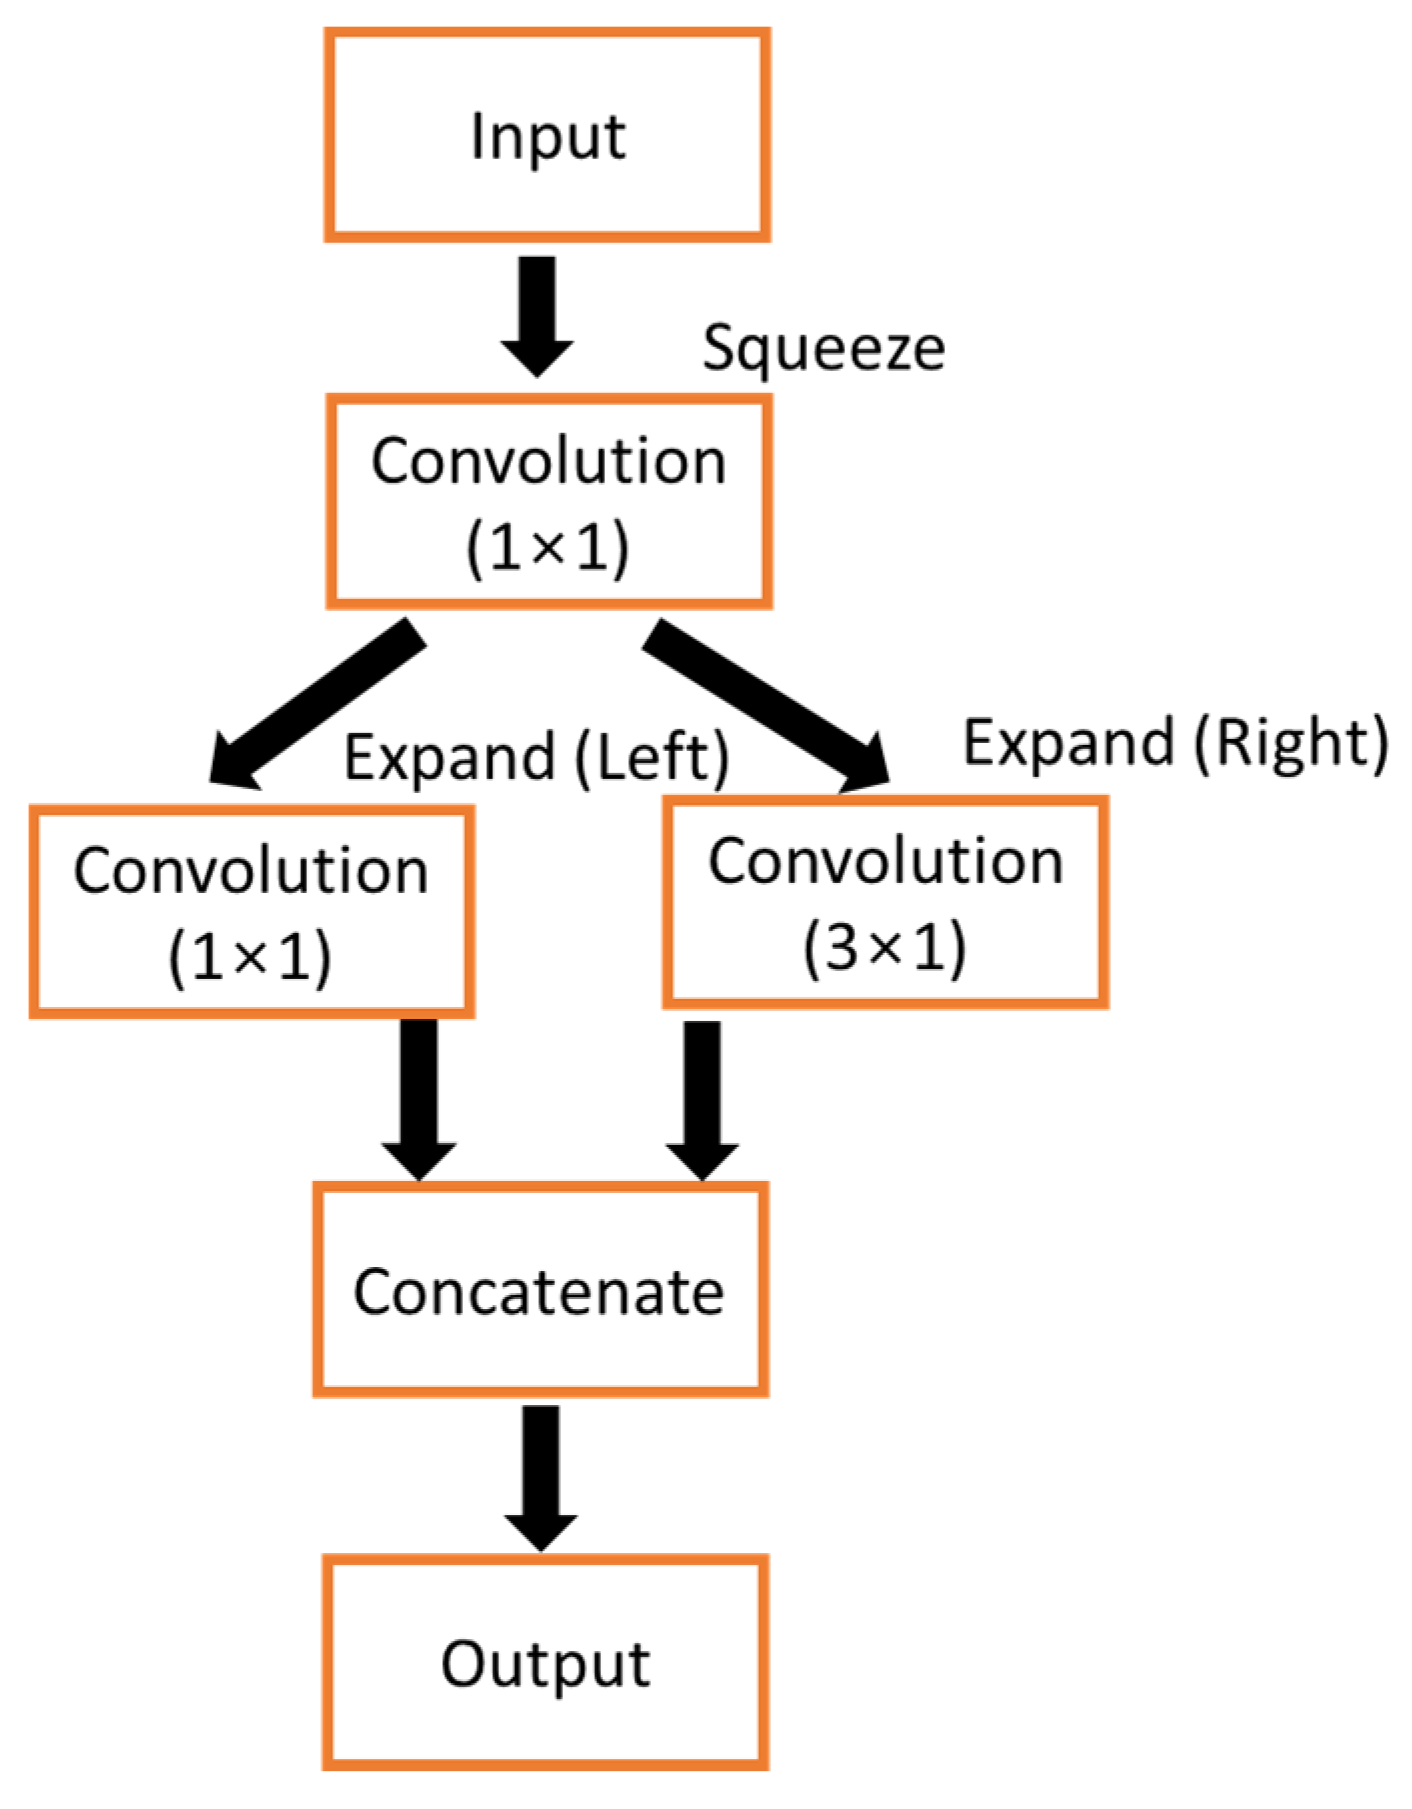
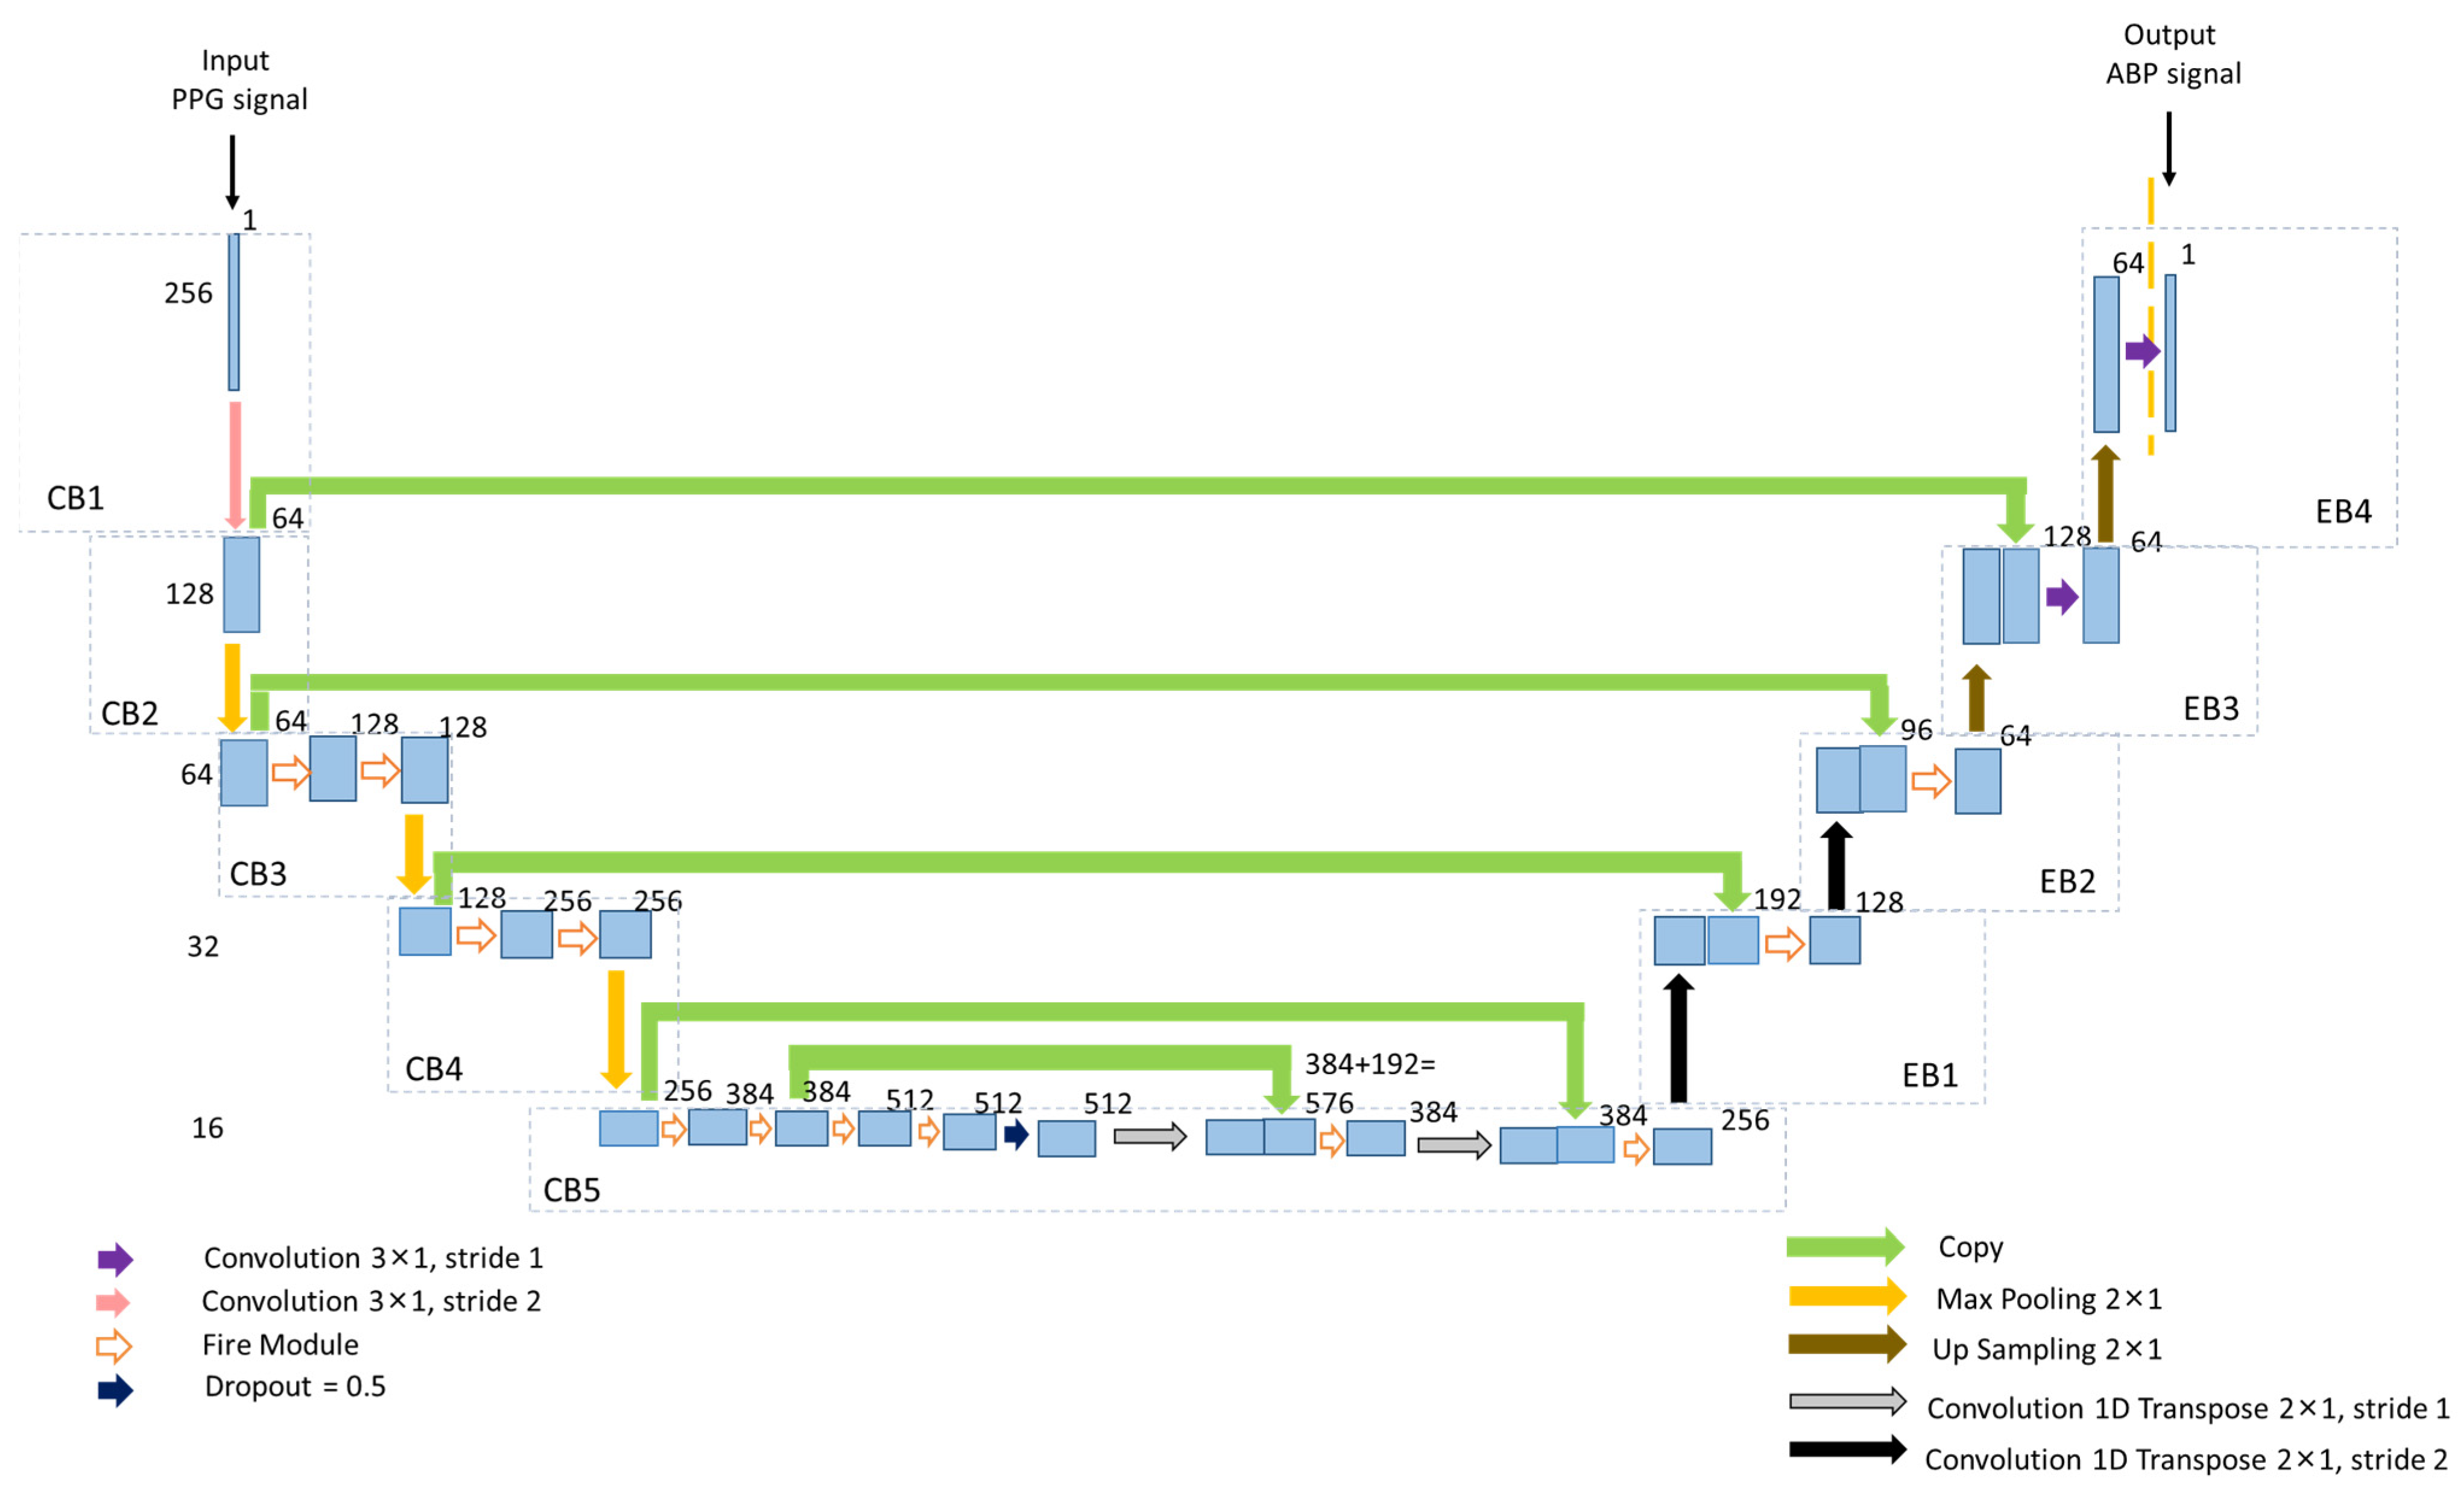
2.3. Proposed Architecture of Squeeze U-Net Model
2.3.1. Contracting Path
2.3.2. Expansion Path
2.4. Training and Testing of Squeeze U-Net Model
2.5. BP Estimation
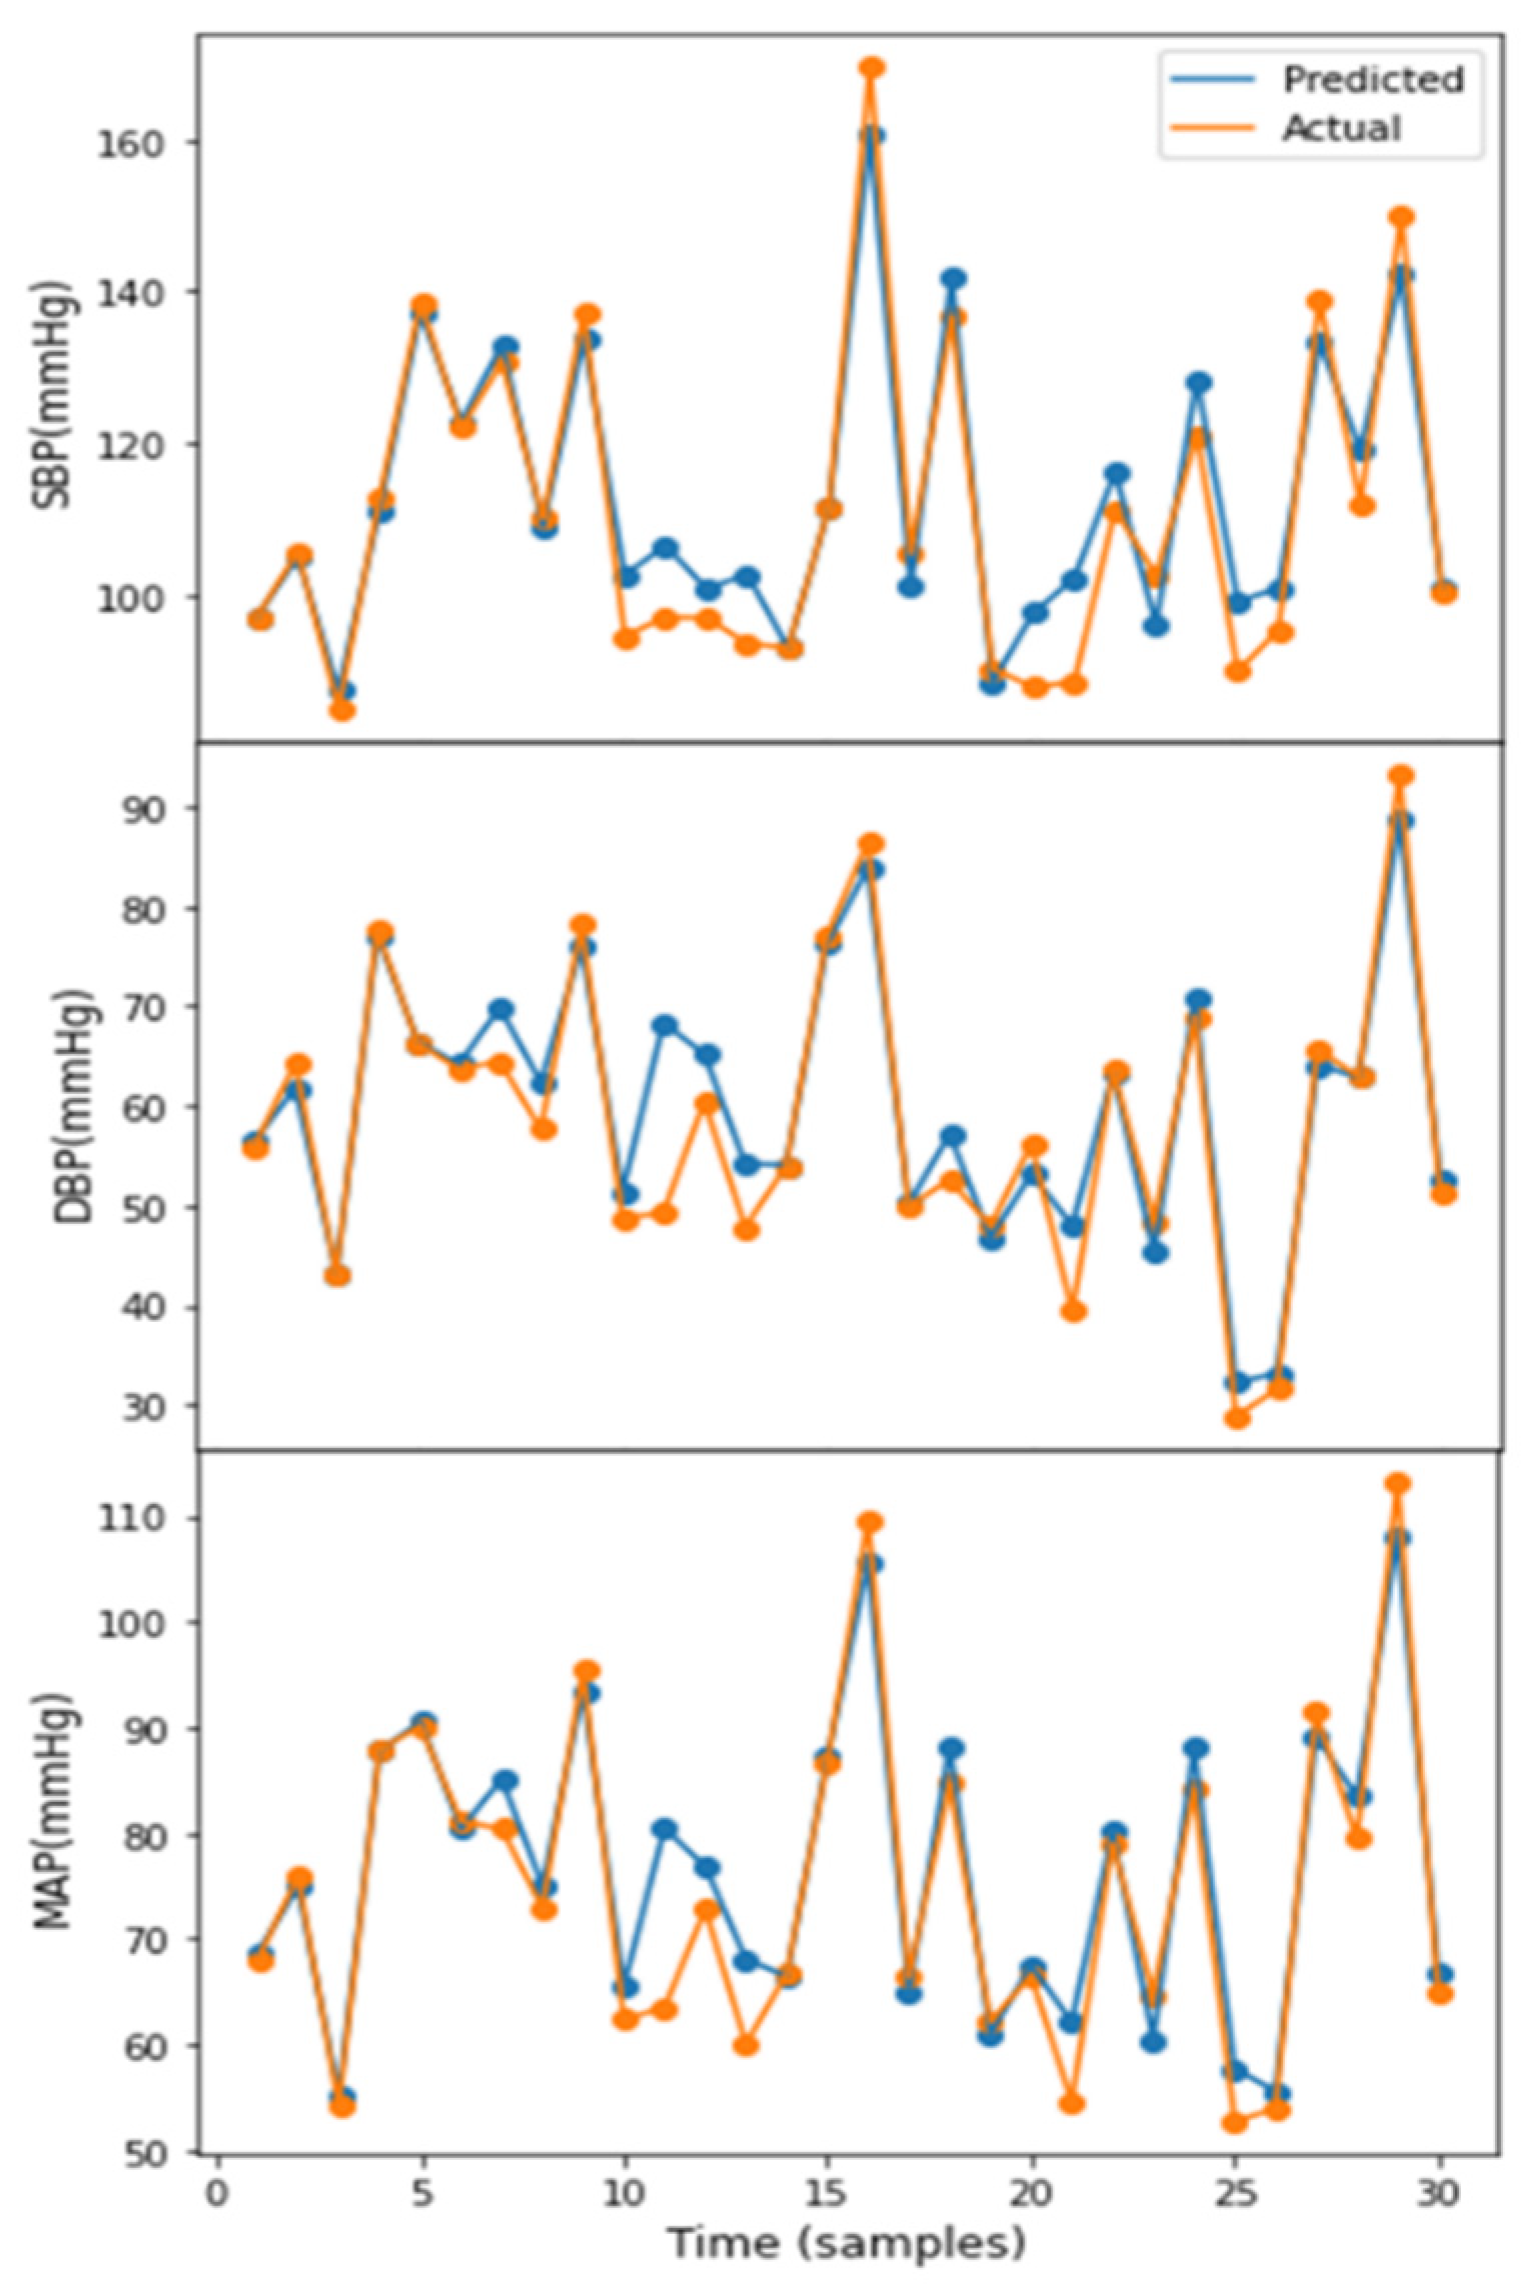
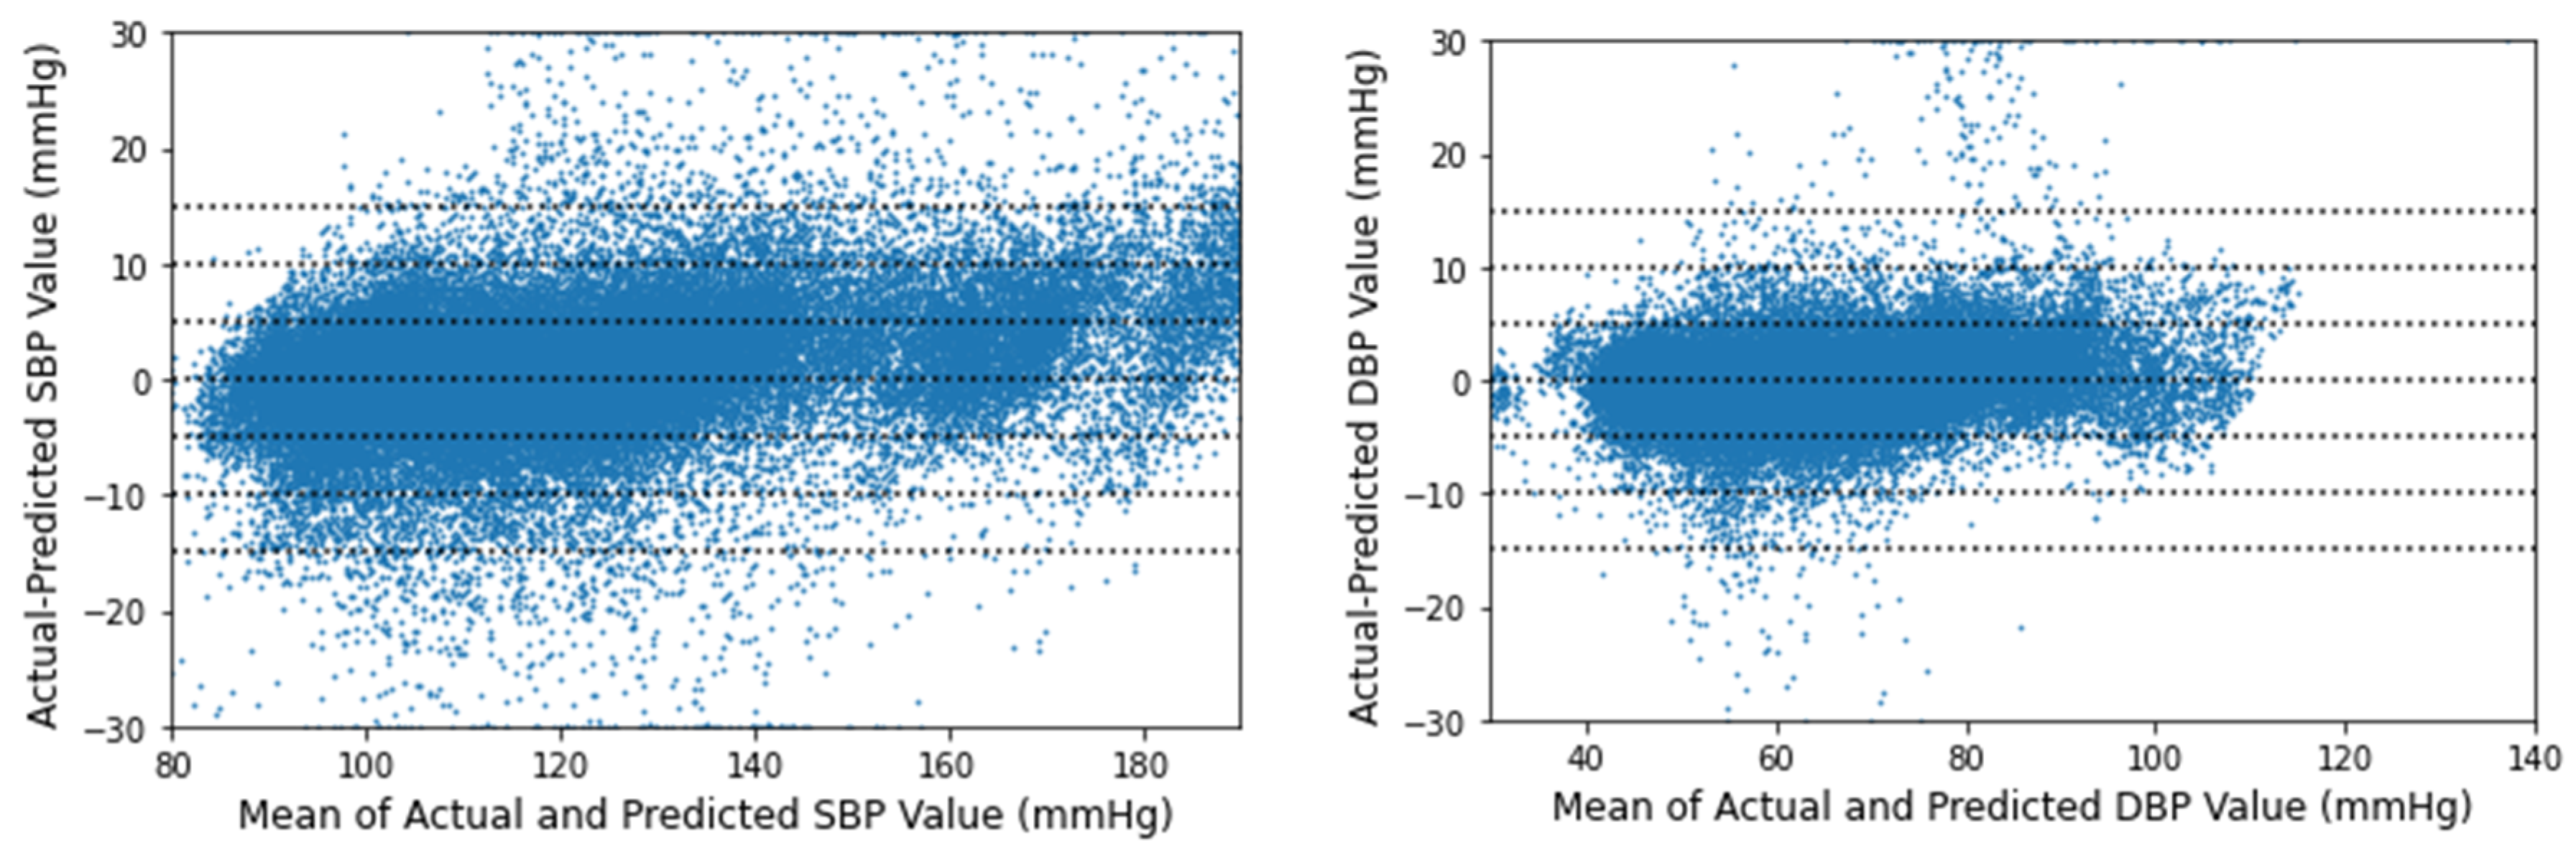
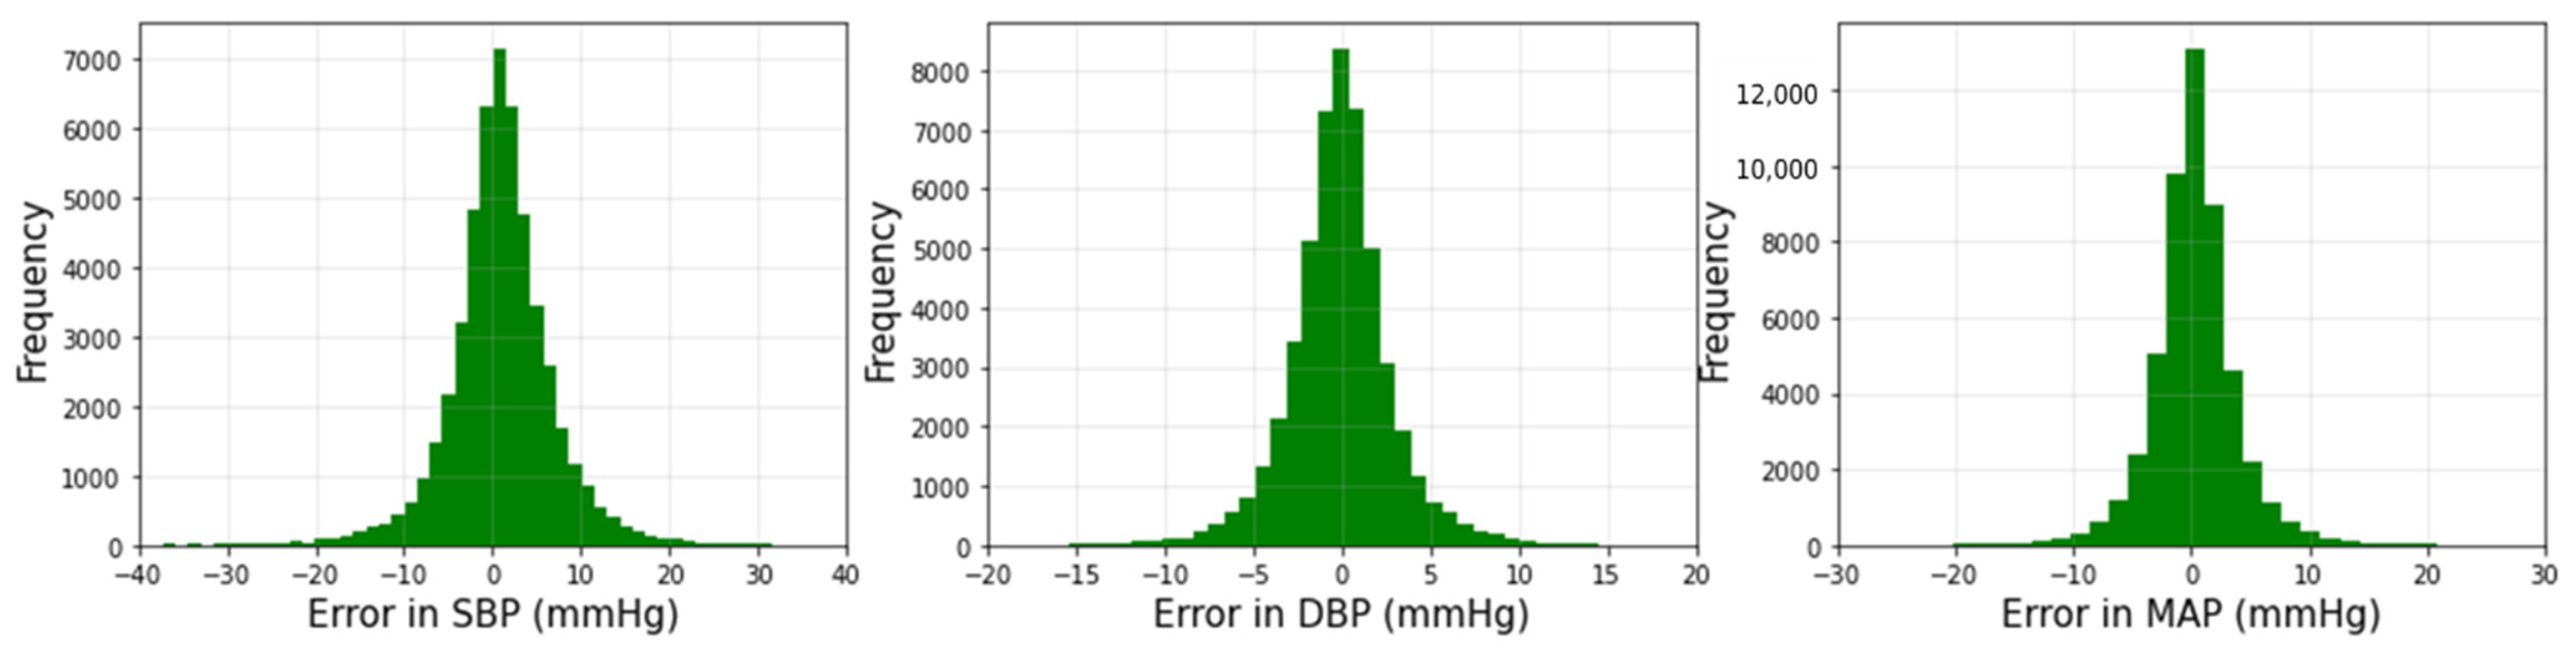
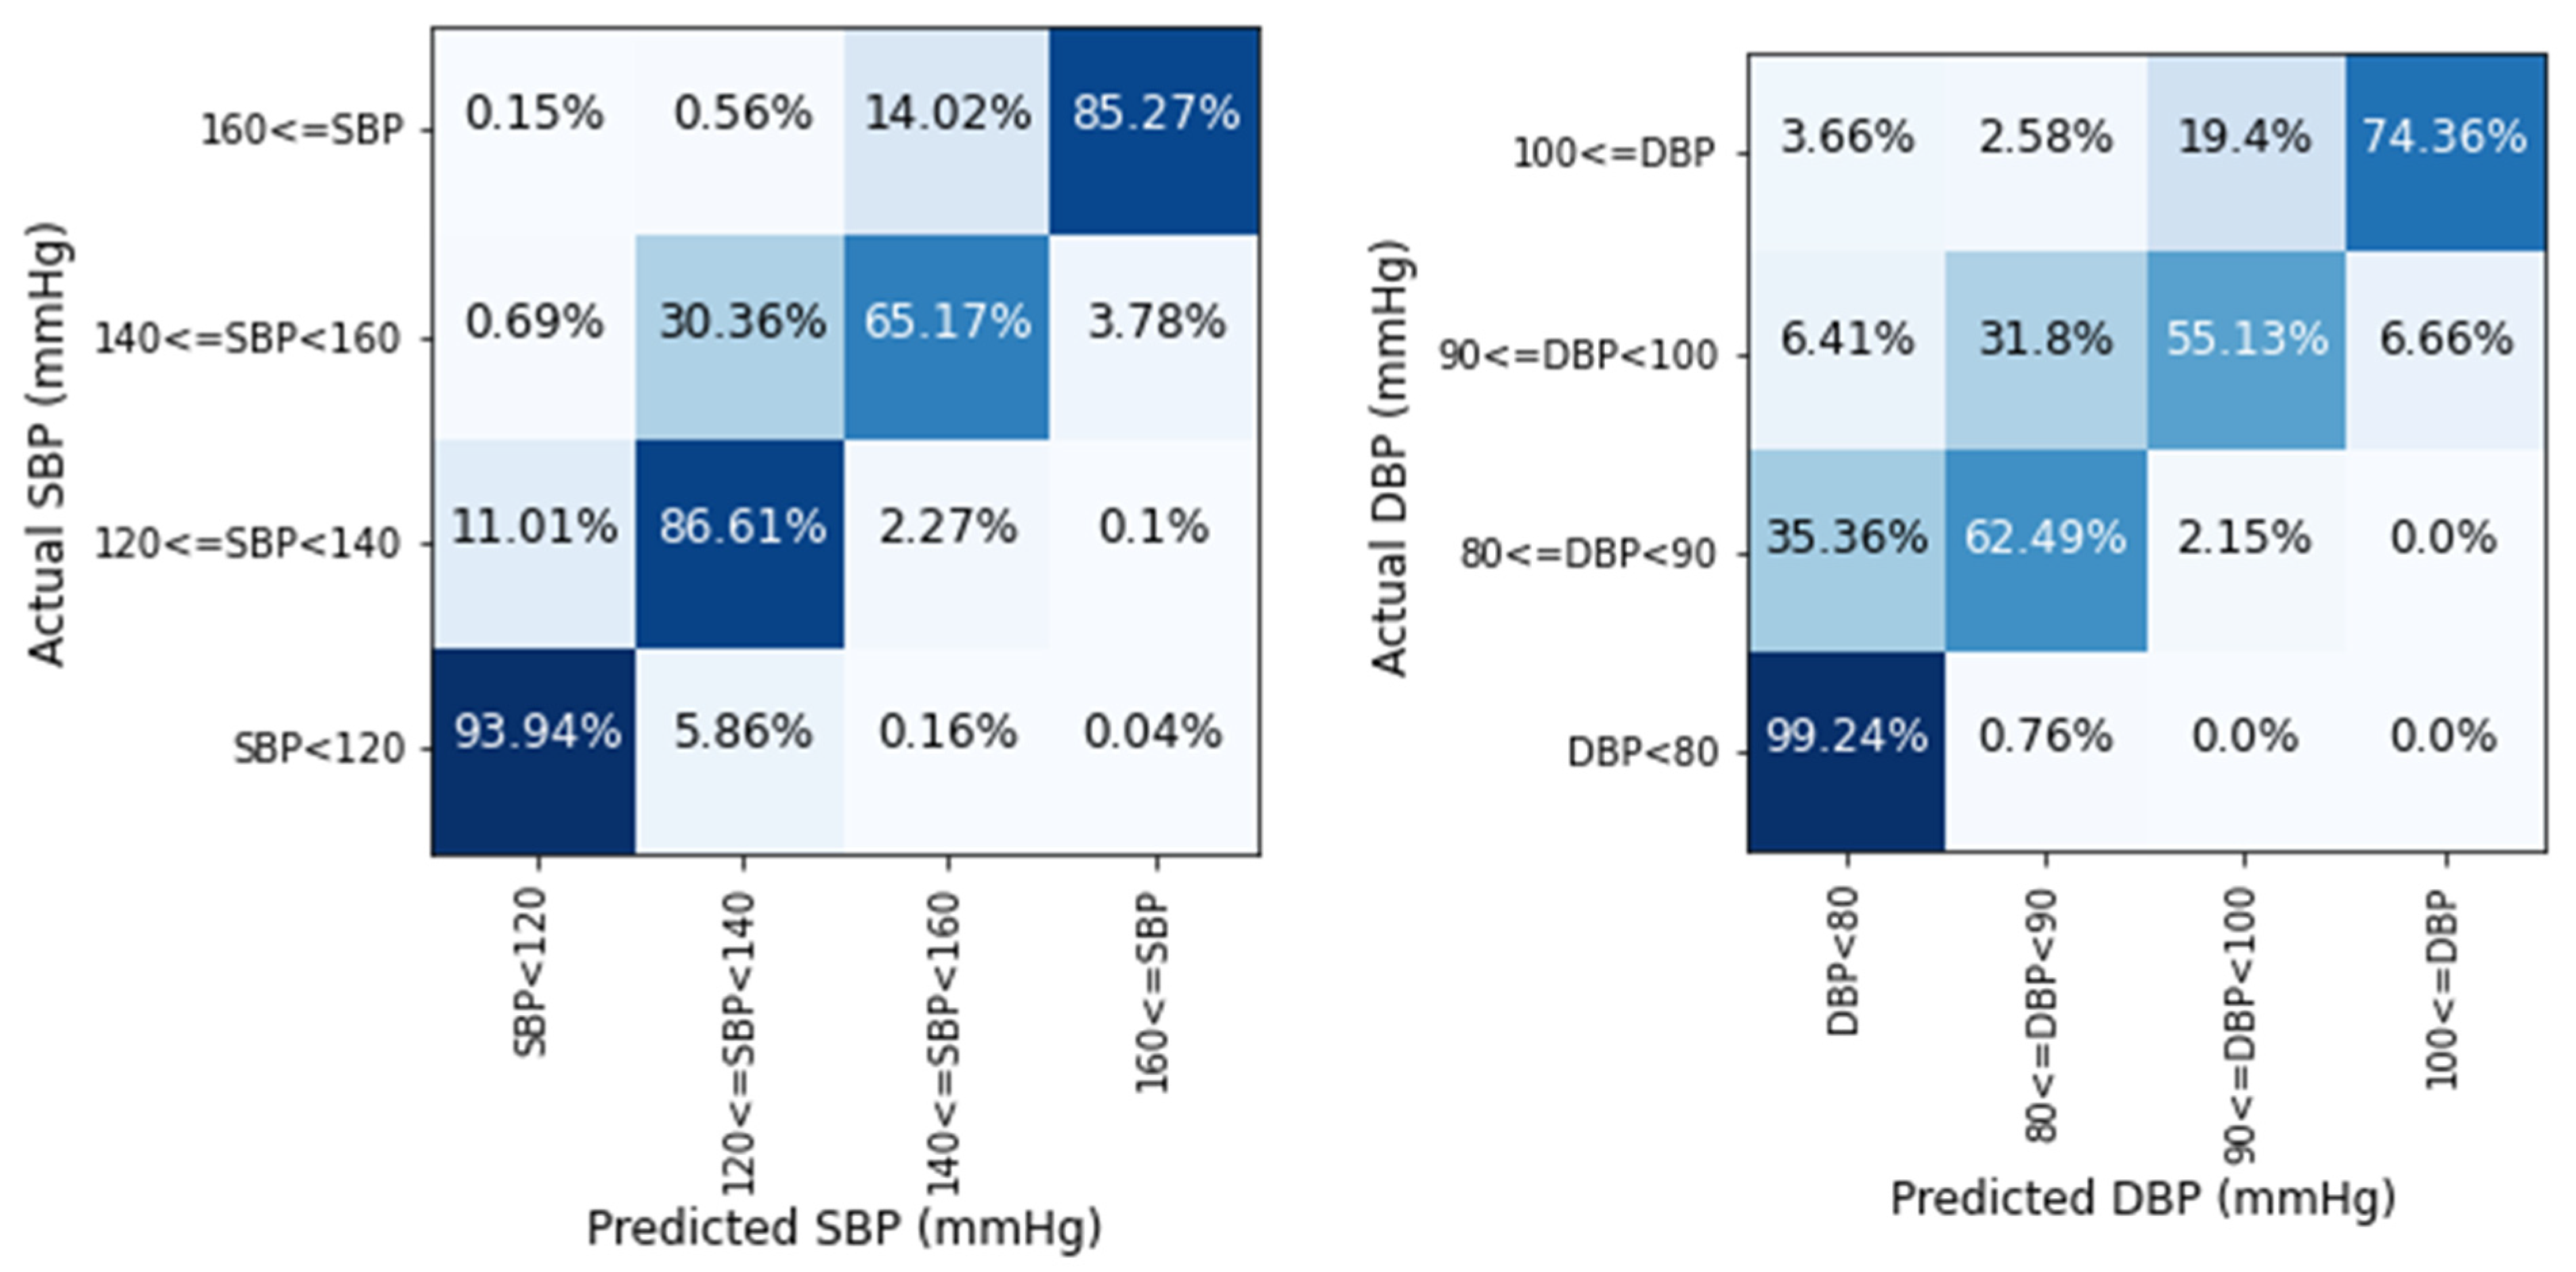
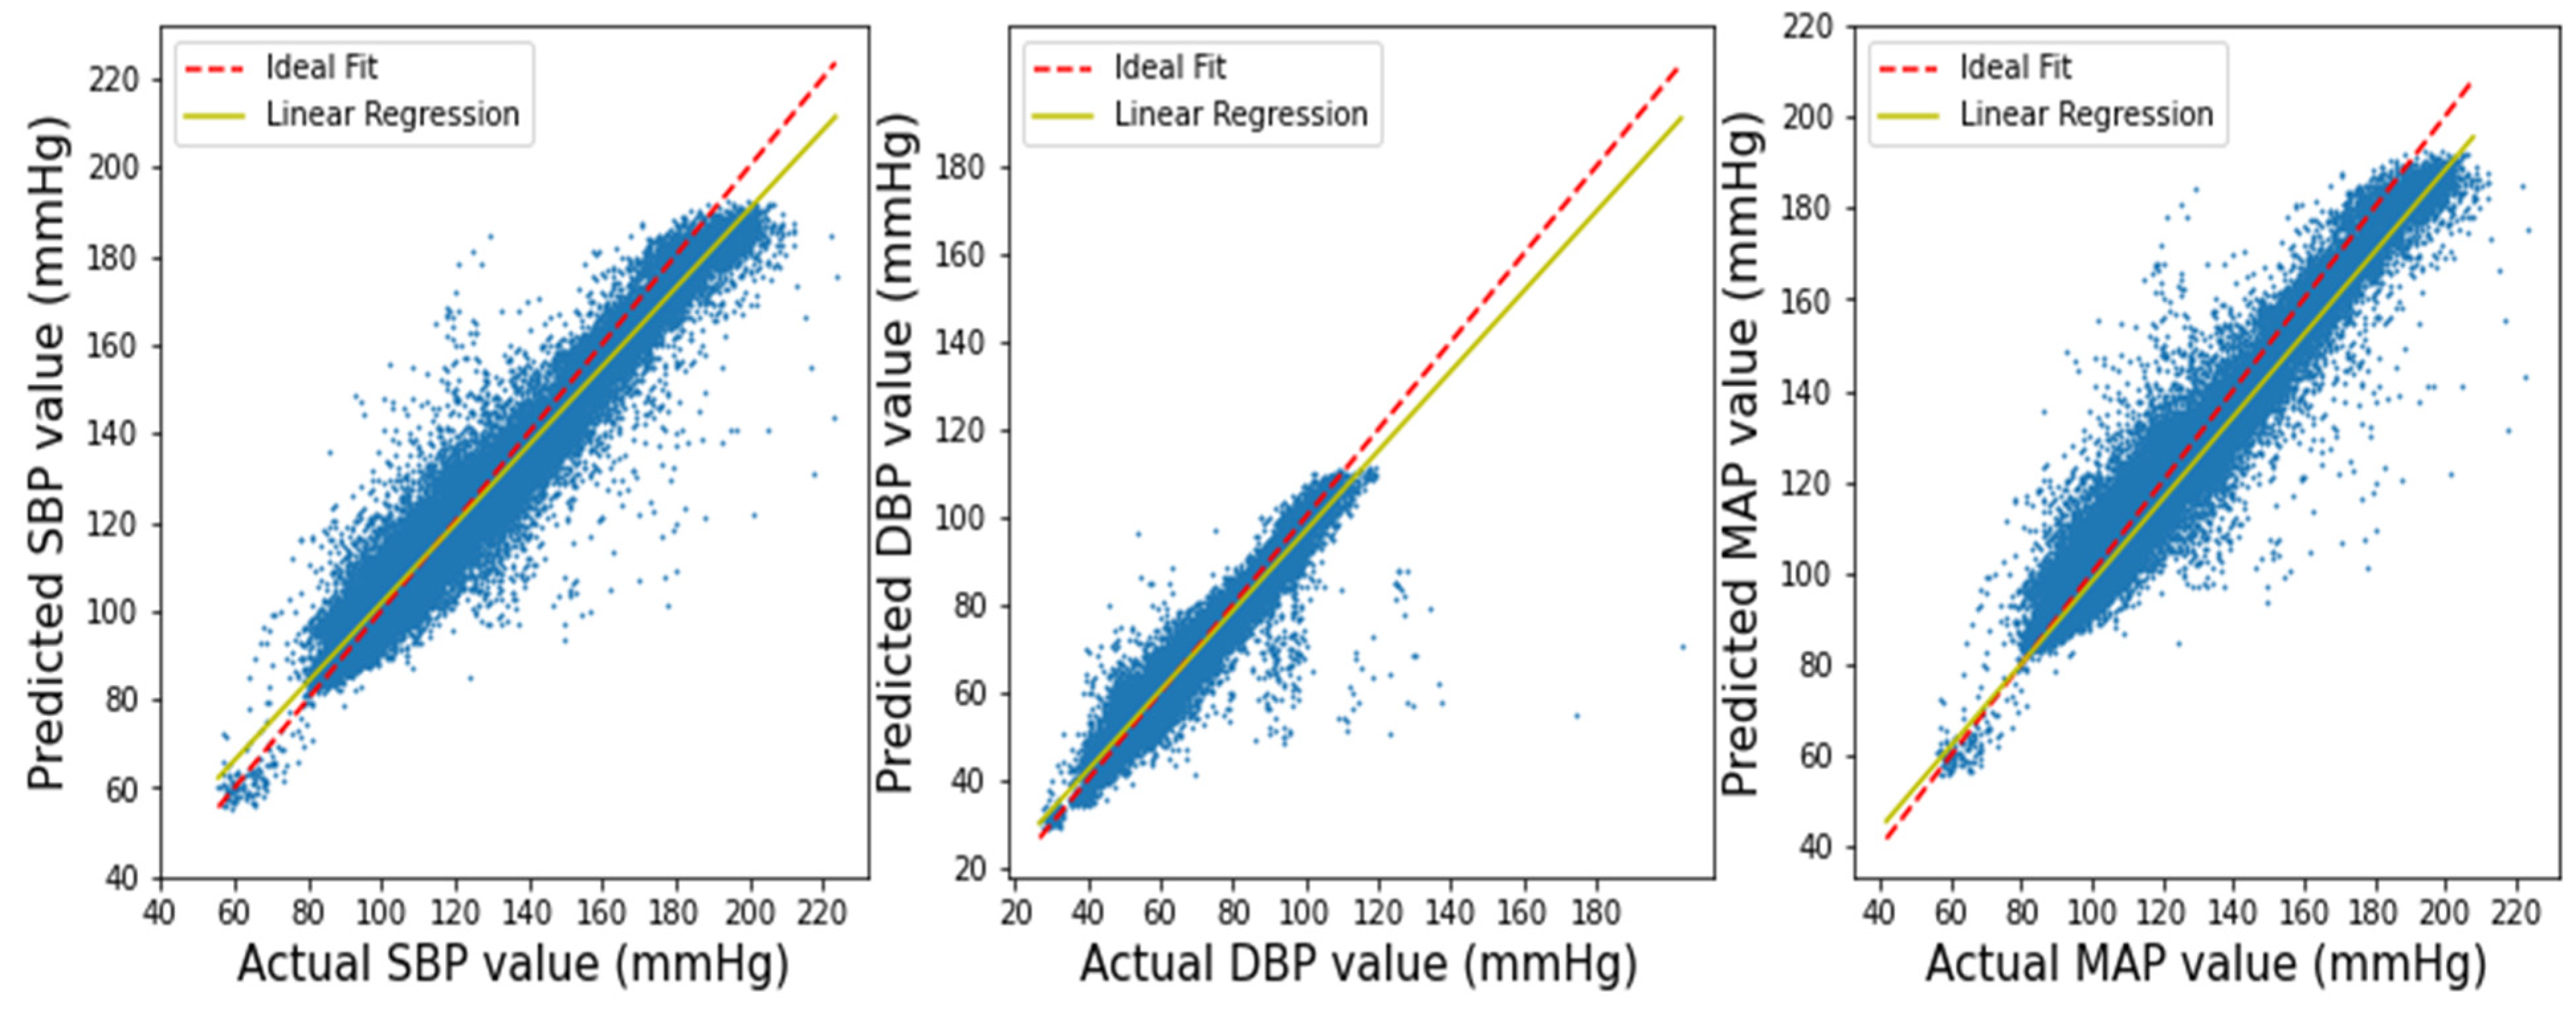
3. Results
3.1. Performance of Squeeze U-Net Model
3.2. Result Evaluation and Comparison
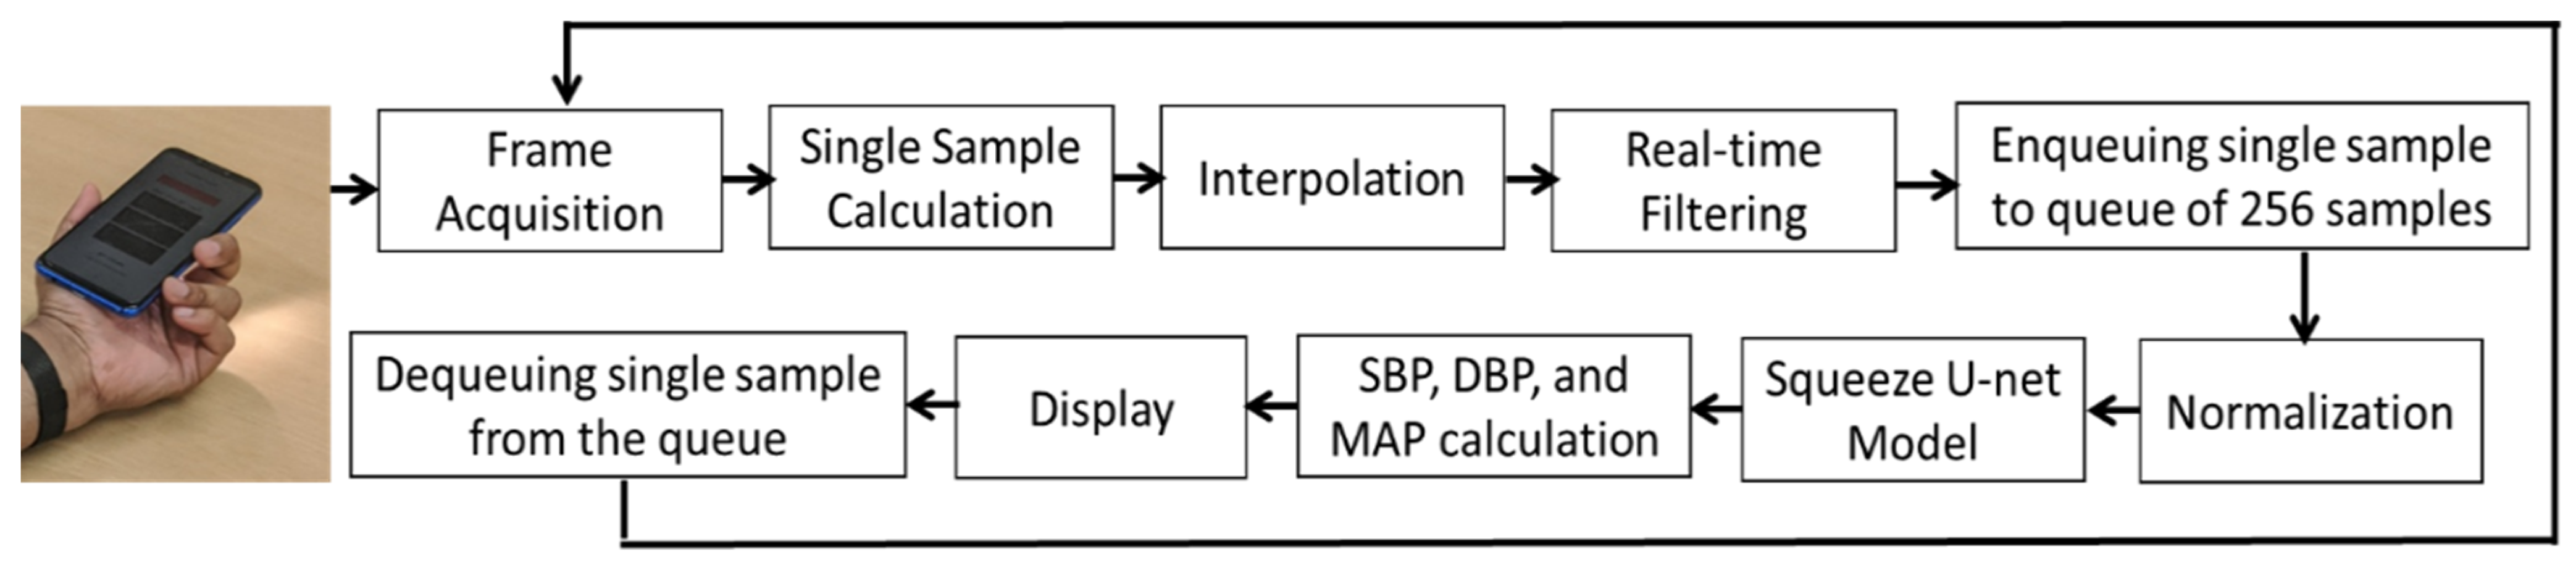
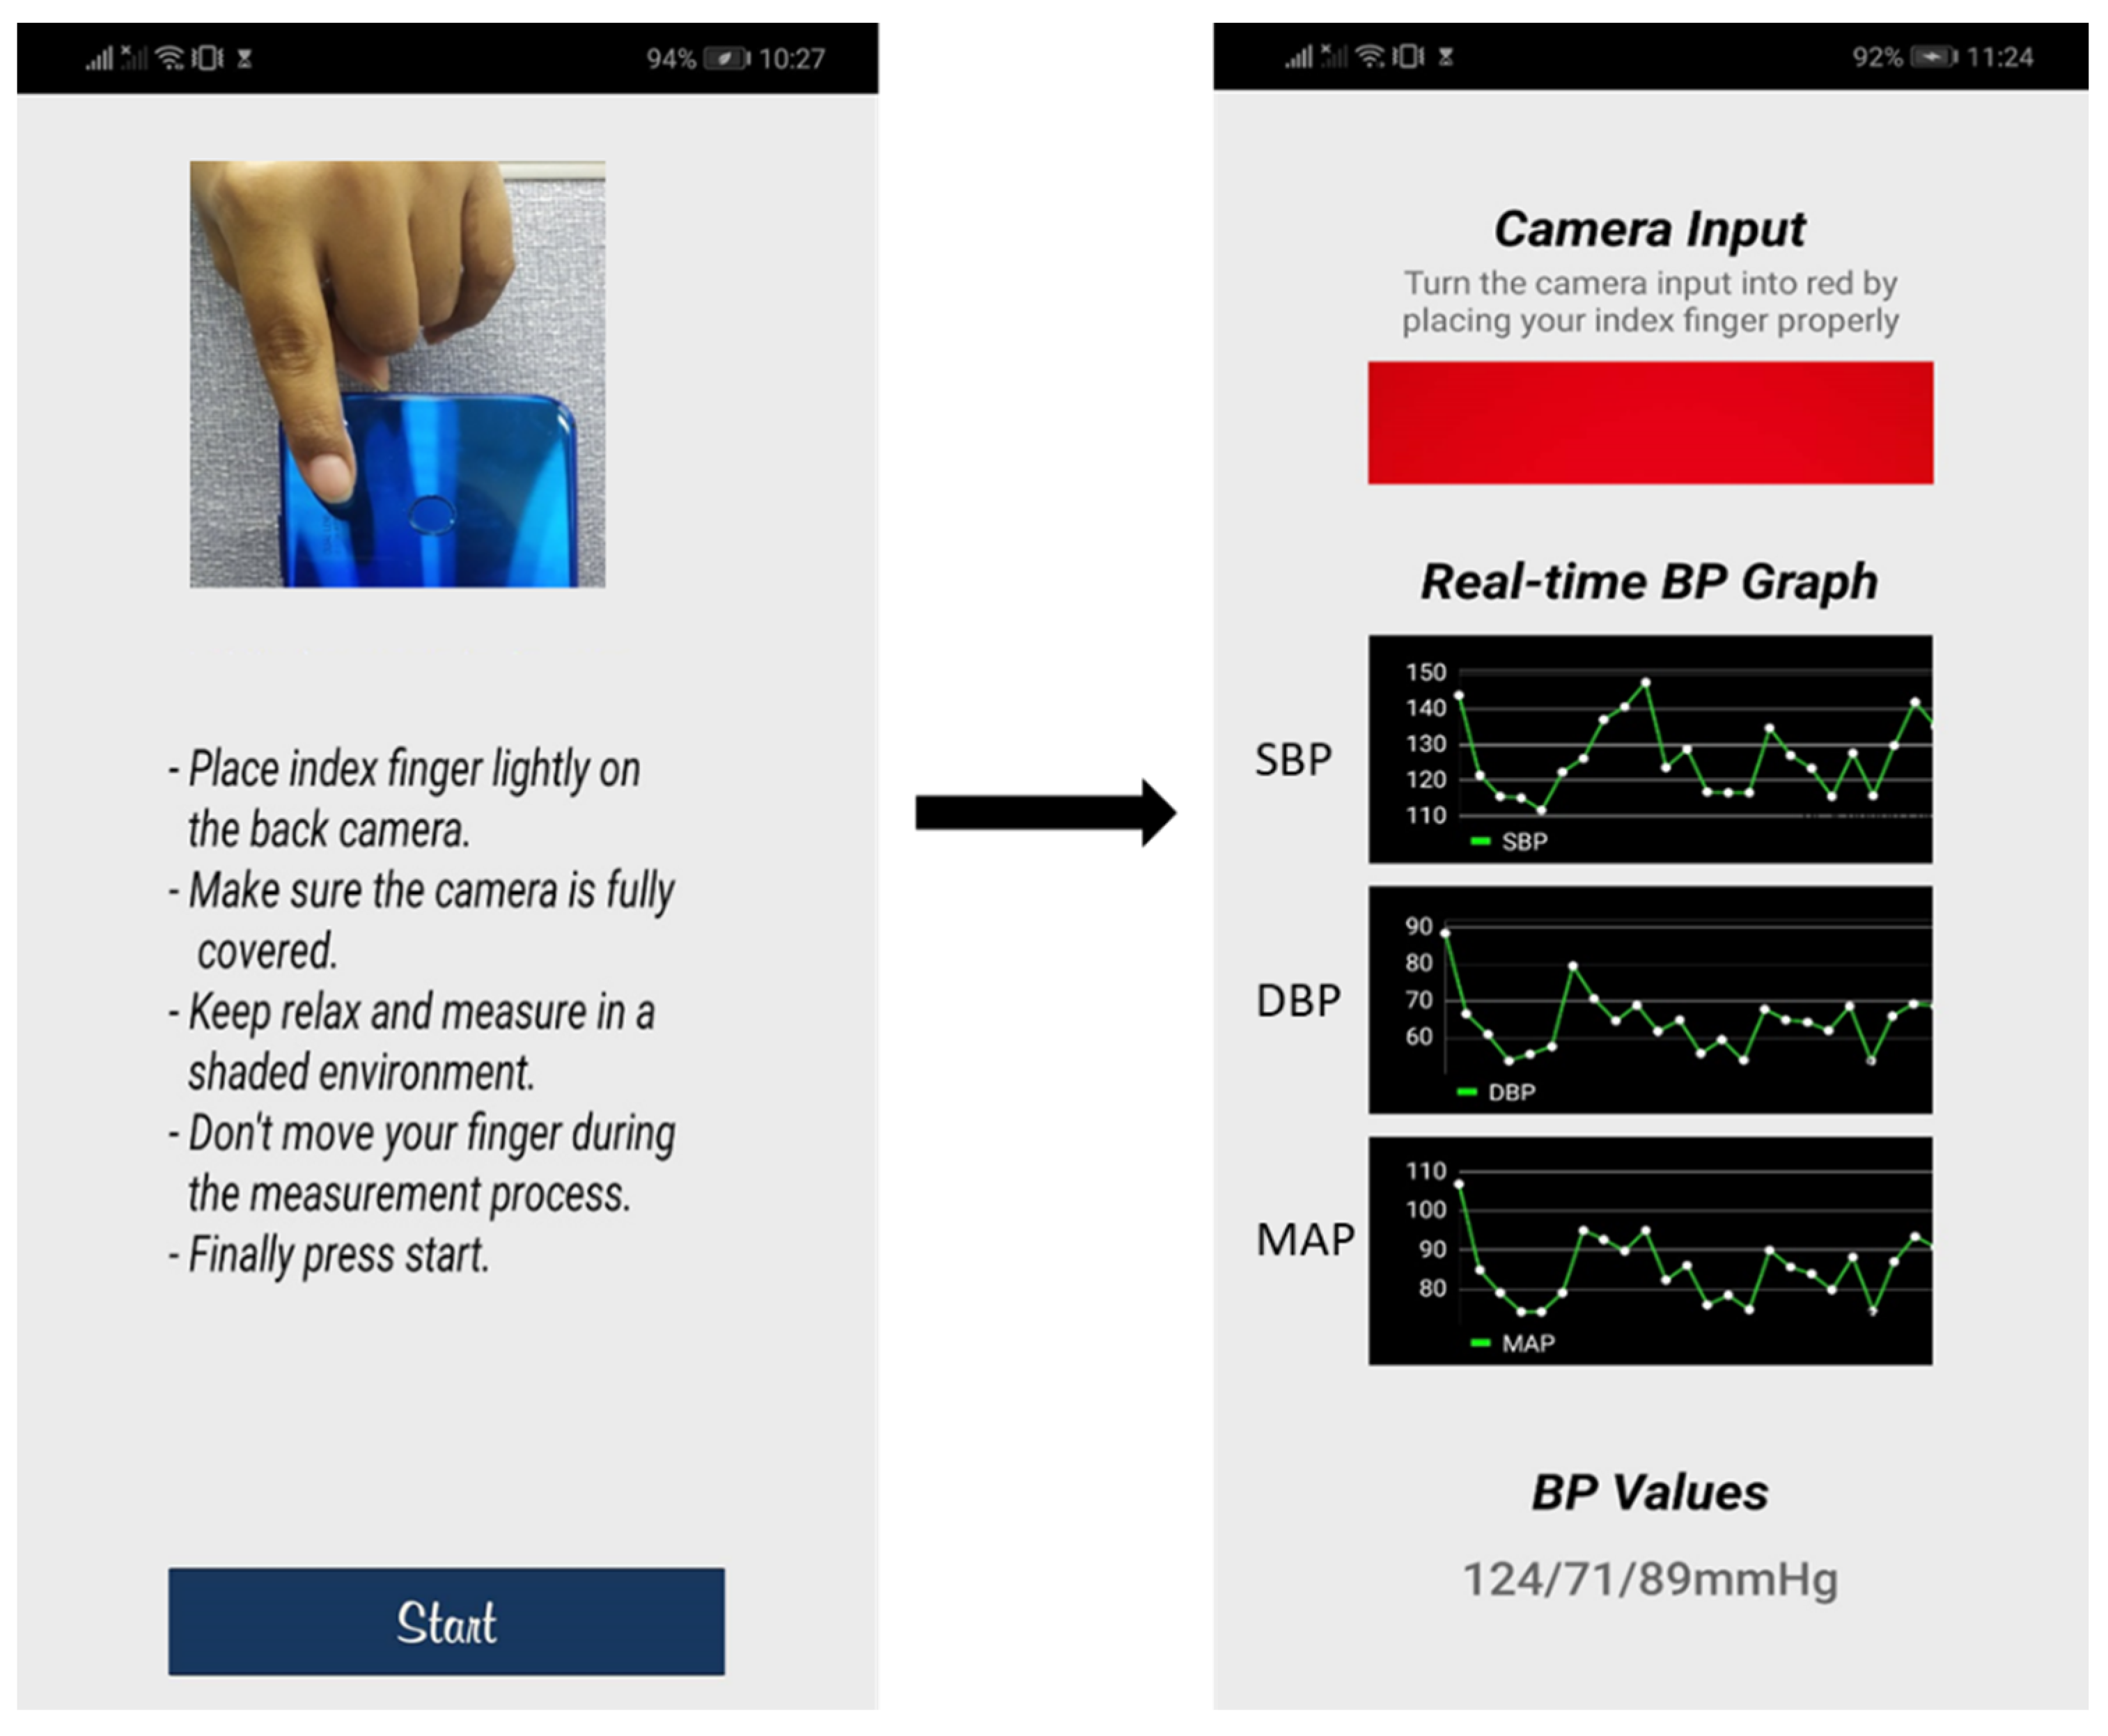
3.3. mHealth Application
4. Discussion
5. Conclusions
Author Contributions
Funding
Data Availability Statement
Conflicts of Interest
References
- Irigoyen, M.-C.; de Angelis, K.; Santos, F.d.; Dartora, D.R.; Rodrigues, B.; Consolim-Colombo, F.M. Hypertension, Blood Pressure Variability, and Target Organ Lesion. Curr. Hypertens. Rep. 2016, 18, 31. [Google Scholar] [CrossRef] [PubMed]
- Schoettker, P.; Degott, J.; Hofmann, G.; Proença, M.; Bonnier, G.; Lemkaddem, A.; Lemay, M.; Schorer, R.; Christen, U.; Knebel, J.-F.; et al. Blood pressure measurements with the OptiBP smartphone app validated against reference auscultatory measurements. Sci. Rep. 2020, 10, 17827. [Google Scholar] [CrossRef] [PubMed]
- Hypertension, World Heart Federation. (n.d.). Available online: https://world-heart-federation.org/what-we-do/hypertension/ (accessed on 23 November 2021).
- Siu, A.L. Screening for High Blood Pressure in Adults: U.S. Preventive Services Task Force Recommendation Statement. Ann. Intern. Med. 2015, 163, 778. [Google Scholar] [CrossRef]
- Mills, K.T.; Bundy, J.D.; Kelly, T.N.; Reed, J.E.; Kearney, P.M.; Reynolds, K.; Chen, J.; He, J. Global Disparities of Hypertension Prevalence and Control. Circulation 2016, 134, 441–450. [Google Scholar] [CrossRef]
- NCD Risk Factor Collaboration (NCD-RisC). Long-term and recent trends in hypertension awareness, treatment, and control in 12 high-income countries: An analysis of 123 nationally representative surveys. Lancet 2019, 394, 639–651. [Google Scholar] [CrossRef]
- Siaron, K.B.; Cortes, M.X.; Stutzman, S.E.; Venkatachalam, A.; Ahmed, K.M.; Olson, D.M. Blood Pressure measurements are site dependent in a cohort of patients with neurological illness. Sci. Rep. 2020, 10, 3382. [Google Scholar] [CrossRef]
- Li, P.; Laleg-Kirati, T.-M. Central Blood Pressure Estimation From Distal PPG Measurement Using Semiclassical Signal Analysis Features. IEEE Access 2021, 9, 44963–44973. [Google Scholar] [CrossRef]
- İlhan, İ.; Yıldız, İ.; Kayrak, M. Development of a wireless blood pressure measuring device with smart mobile device. Comput. Methods Programs Biomed. 2016, 125, 94–102. [Google Scholar] [CrossRef]
- Zakrzewski, A.M.; Huang, A.Y.; Zubajlo, R.; Anthony, B.W. Real-Time Blood Pressure Estimation From Force-Measured Ultrasound. IEEE Trans. Biomed. Eng. 2018, 65, 2405–2416. [Google Scholar] [CrossRef]
- Ding, X.-R.; Zhang, Y.-T.; Liu, J.; Dai, W.-X.; Tsang, H.K. Continuous Cuffless Blood Pressure Estimation Using Pulse Transit Time and Photoplethysmogram Intensity Ratio. IEEE Trans. Biomed. Eng. 2016, 63, 964–972. [Google Scholar] [CrossRef]
- Ding, X.; Zhang, Y.; Tsang, H.K. Impact of heart disease and calibration interval on accuracy of pulse transit time-based blood pressure estimation. Physiol. Meas. 2016, 37, 227–237. [Google Scholar] [CrossRef] [PubMed]
- Zheng, Y.-L.; Yan, B.P.; Zhang, Y.-T.; Poon, C.C.Y. An Armband Wearable Device for Overnight and Cuff-Less Blood Pressure Measurement. IEEE Trans. Biomed. Eng. 2014, 61, 2179–2186. [Google Scholar] [CrossRef]
- Ding, X.-R.; Zhao, N.; Yang, G.-Z.; Pettigrew, R.I.; Lo, B.; Miao, F.; Li, Y.; Liu, J.; Zhang, Y.-T. Continuous Blood Pressure Measurement From Invasive to Unobtrusive: Celebration of 200th Birth Anniversary of Carl Ludwig. IEEE J. Biomed. Health Inform. 2016, 20, 1455–1465. [Google Scholar] [CrossRef] [PubMed]
- Mukkamala, R.; Hahn, J.-O.; Inan, O.T.; Mestha, L.K.; Kim, C.-S.; Töreyin, H.; Kyal, S. Toward Ubiquitous Blood Pressure Monitoring via Pulse Transit Time: Theory and Practice. IEEE Trans. Biomed. Eng. 2015, 62, 1879–1901. [Google Scholar] [CrossRef]
- He, R.; Huang, Z.-P.; Ji, L.-Y.; Wu, J.-K.; Li, H.; Zhang, Z.-Q. Beat-to-beat ambulatory blood pressure estimation based on random forest. In Proceedings of the 2016 IEEE 13th International Conference on Wearable and Implantable Body Sensor Networks (BSN), San Francisco, CA, USA, 14–17 June 2016; pp. 194–198. [Google Scholar] [CrossRef]
- Li, Y.-H.; Harfiya, L.N.; Purwandari, K.; Lin, Y.-D. Real-Time Cuffless Continuous Blood Pressure Estimation Using Deep Learning Mode. Sensors 2020, 20, 5606. [Google Scholar] [CrossRef]
- Miao, F.; Wen, B.; Hu, Z.; Fortino, G.; Wang, X.-P.; Liu, Z.-D.; Tang, M.; Li, Y. Continuous blood pressure measurement from one-channel electrocardiogram signal using deep-learning techniques. Artif. Intell. Med. 2020, 108, 101919. [Google Scholar] [CrossRef]
- Miao, F.; Liu, Z.-D.; Liu, J.-K.; Wen, B.; He, Q.-Y.; Li, Y. Multi-Sensor Fusion Approach for Cuff-Less Blood Pressure Measurement. IEEE J. Biomed. Health Inform. 2020, 24, 79–91. [Google Scholar] [CrossRef]
- Pitson, D.J.; Sandell, A.; van den Hout, R.; Stradling. Use of pulse transit time as a measure of inspiratory effort in patients with obstructive sleep apnoea. Eur. Respir. J. 1995, 8, 1669–1674. [Google Scholar] [CrossRef]
- Mejía-Mejía, E.; May, J.M.; Elgendi, M.; Kyriacou, P.A. Classification of blood pressure in critically ill patients using photoplethysmography and machine learning. Comput. Methods Programs Biomed. 2021, 208, 106222. [Google Scholar] [CrossRef]
- Lin, W.-H.; Wang, H.; Samuel, O.W.; Liu, G.; Huang, Z.; Li, G. New photoplethysmogram indicators for improving cuffless and continuous blood pressure estimation accuracy. Physiol. Meas. 2018, 39, 025005. [Google Scholar] [CrossRef]
- Qin, K.; Huang, W.; Zhang, T. Deep generative model with domain adversarial training for predicting arterial blood pressure waveform from photoplethysmogram signal. Biomed. Signal Processing Control. 2021, 70, 102972. [Google Scholar] [CrossRef]
- Huang, J.-C.; Tsai, Y.-C.; Wu, P.-Y.; Lien, Y.-H.; Chien, C.-Y.; Kuo, C.-F.; Hung, J.-F.; Chen, S.-C.; Kuo, C.-H. Predictive modeling of blood pressure during hemodialysis: A comparison of linear model, random forest, support vector regression, XGBoost, LASSO regression and ensemble method. Comput. Methods Programs Biomed. 2020, 195, 105536. [Google Scholar] [CrossRef]
- Baker, S.; Xiang, W.; Atkinson, I. A hybrid neural network for continuous and non-invasive estimation of blood pressure from raw electrocardiogram and photoplethysmogram waveforms. Comput. Methods Programs Biomed. 2021, 207, 106191. [Google Scholar] [CrossRef]
- Slapničar, G.; Mlakar, N.; Luštrek, M. Blood Pressure Estimation from Photoplethysmogram Using a Spectro-Temporal Deep Neural Network. Sensors 2019, 19, 3420. [Google Scholar] [CrossRef]
- Athaya, T.; Choi, S. An Estimation Method of Continuous Non-Invasive Arterial Blood Pressure Waveform Using Photoplethysmography: A U-Net Architecture-Based Approach. Sensors 2021, 21, 1867. [Google Scholar] [CrossRef]
- Elgendi, M.; Fletcher, R.; Liang, Y.; Howard, N.; Lovell, N.H.; Abbott, D.; Lim, K.; Ward, R. The use of photoplethysmography for assessing hypertension. Npj Digit. Med. 2019, 2, 1–11. [Google Scholar] [CrossRef]
- Moody, G.B.; Mark, R.G. A database to support development and evaluation of intelligent intensive care monitoring. In Proceedings of the Computers in Cardiology, Indianapolis, IN, USA, 8–11 September 1996; 65, pp. 7–660. [Google Scholar] [CrossRef]
- Johnson, A.E.W.; Pollard, T.J.; Shen, L.H.; Lehman, L.H.; Feng, M.; Ghassemi, M.; Moody, B.; Szolovits, P.; Anthony Celi, L.; Mark, R.G. MIMIC-III, a freely accessible critical care database. Sci. Data 2016, 3, 160035. [Google Scholar] [CrossRef]
- Goldberger, A.L.; Amaral, L.A.N.; Glass, L.; Hausdorff, J.M.; Ivanov, P.C.; Mark, R.G.; Mietus, J.E.; Moody, G.B.; Peng, C.-K.; Stanley, H.E. PhysioBank, PhysioToolkit, and PhysioNet. Circulation 2000, 101, e215–e220. [Google Scholar] [CrossRef]
- Athaya, T.; Choi, S. An Efficient Fingertip Photoplethysmographic Signal Artifact Detection Method: A Machine Learning Approach. J. Sens. 2021, 2021, e9925033. [Google Scholar] [CrossRef]
- Fan, X.; Wang, H.; Xu, F.; Zhao, Y.; Tsui, K.-L. Homecare-Oriented Intelligent Long-Term Monitoring of Blood Pressure Using Electrocardiogram Signals. IEEE Trans. Ind. Inform. 2020, 16, 7150–7158. [Google Scholar] [CrossRef]
- Beheshti, N.; Johnsson, L. Squeeze U-Net: A Memory and Energy Efficient Image Segmentation Network. In Proceedings of the 2020 IEEE/CVF Conference on Computer Vision and Pattern Recognition Workshops (CVPRW), Seattle, WA, USA, 14–19 June 2020; pp. 1495–1504. [Google Scholar] [CrossRef]
- Iandola, F.N.; Han, S.; Moskewicz, M.W.; Ashraf, K.; Dally, W.J.; Keutzer, K. SqueezeNet: AlexNet-level accuracy with 50× fewer parameters and <0.5 MB model size. arXiv 2016, arXiv:1602.07360. [Google Scholar]
- Saadatifard, L.; Mobiny, A.; Govyadinov, P.; Nguyen, H.; Mayerich, D. DVNet: A Memory-Efficient Three-Dimensional CNN for Large-Scale Neurovascular Reconstruction. arXiv 2020, arXiv:2002.0156. [Google Scholar]
- Elgendi, M.; Norton, I.; Brearley, M.; Abbott, D.; Schuurmans, D. Systolic Peak Detection in Acceleration Photoplethysmograms Measured from Emergency Responders in Tropical Conditions. PLoS ONE 2013, 8, e76585. [Google Scholar] [CrossRef] [PubMed]
- Papaioannou, T.G.; Protogerou, A.D.; Vrachatis, D.; Konstantonis, G.; Aissopou, E.; Argyris, A.; Nasothimiou, E.; Gialafos, E.J.; Karamanou, M.; Tousoulis, D.; et al. Mean arterial pressure values calculated using seven different methods and their associations with target organ deterioration in a single-center study of 1878 individuals. Hypertens. Res. 2016, 39, 640–647. [Google Scholar] [CrossRef]
- Botchkarev, A. A New Typology Design of Performance Metrics to Measure Errors in Machine Learning Regression Algorithms. Interdiscip. J. Inf. Knowl. Manag. 2019, 14, 45–76. [Google Scholar] [CrossRef]
- Chobanian, A.V.; Bakris, G.L.; Black, H.R.; Cushman, W.C.; Green, L.A.; Joseph, J.; Izzo, L.; Jones, D.W.; Materson, B.J.; Oparil, S.; et al. The Seventh Report of the Joint National Committee on Prevention, Detection, Evaluation, and Treatment of High Blood Pressure: The JNC 7 Report. JAMA 2003, 289, 2560–2571. [Google Scholar] [CrossRef]
- Stergiou, G.; Alpert, B.; Mieke, S.; Asmar, R.; Atkins, N.; Eckert, S.; Frick, G.; Friedman, B.; Graßl, T.; Ichikawa, T.; et al. A Universal Standard for the Validation of Blood Pressure Measuring Devices: Association for the Advancement of Medical Instrumentation/European Society of Hypertension/International Organization for Standardization (AAMI/ESH/ISO) Collaboration Statement. J. Hypertens. 2018, 36, 472–478. [Google Scholar] [CrossRef]
- White, W.B.; Berson, A.S.; Robbins, C.; Jamieson, M.J.; Prisant, L.M.; Roccella, E.; Sheps, S.G. National standard for measurement of resting and ambulatory blood pressures with automated sphygmomanometers. Hypertension 1993, 21, 504–509. [Google Scholar] [CrossRef]
- O’Brien, E.; Petrie, J.; Littler, W.A.; De Swiet, M.; Padfield, P.L.; Altman, D.; Bland, M.; Coats, A.; Atkins, N. The British Hypertension Society protocol for the evaluation of blood pressure measuring devices. J. Hypertens. 1993, 11, S43–S62. [Google Scholar]
- Athaya, T.; Choi, S. A Review of Noninvasive Methodologies to Estimate the Blood Pressure Waveform. Sensors 2022, 22, 3953. [Google Scholar] [CrossRef]
- TensorFlow Lite|ML for Mobile and Edge Devices, TensorFlow. (n.d.). Available online: https://www.tensorflow.org/lite (accessed on 26 October 2021).
- Yuan, Y.; Zhang, C.; Wang, Y.; Liu, C.; Ji, J.; Feng, C. Linear interpolation process and its influence on the secondary equipment in substations. In Proceedings of the 2017 China International Electrical and Energy Conference (CIEEC), Beijing, China, 25–27 October 2017; pp. 205–209. [Google Scholar] [CrossRef]
- Hossain, S.; Gupta, S.S.; Kwon, T.-H.; Kim, K.-D. Derivation and validation of gray-box models to estimate noninvasive in-vivo percentage glycated hemoglobin using digital volume pulse waveform. Sci. Rep. 2021, 11, 12169. [Google Scholar] [CrossRef] [PubMed]


| BP Values | Min (mmHg) | Max (mmHg) | Mean (mmHg) | STD (mmHg) |
|---|---|---|---|---|
| SBP | 75.69 | 192.24 | 130.05 | 23.79 |
| DBP | 50.33 | 111.23 | 64.66 | 13.28 |
| MAP | 62.69 | 130.74 | 84.08 | 15.61 |
| BP Values | ME (mmHg) | MAE (mmHg) | STD (mmHg) | RMSE (mmHg) | r |
|---|---|---|---|---|---|
| SBP | −1.002 | 4.42 | 4.78 | 6.50 | 0.970 |
| DBP | 0.019 | 2.25 | 2.98 | 3.73 | 0.964 |
| MAP | −0.315 | 2.56 | 3.21 | 4.10 | 0.971 |
| Works | BP Values | MAE | ME | STD | Result |
|---|---|---|---|---|---|
| AAMI [42] | BP | ≤5 | ≤8 | Passed | |
| [17] | SBP | 6.726 | 4.638 | 14.505 | Failed |
| DBP | 2.516 | 3.155 | 6.442 | Passed | |
| MAP | - | - | - | - | |
| [18] | SBP | 7.10 | −0.11 | 9.99 | Failed |
| DBP | 4.61 | −0.03 | 6.36 | Passed | |
| MAP | 4.66 | −0.01 | 6.29 | Passed | |
| [19] | SBP | 6.13 | 1.62 | 7.76 | Failed |
| DBP | 4.54 | 1.49 | 5.52 | Passed | |
| MAP | 4.81 | 1.53 | 6.03 | Passed | |
| [25] | SBP | 4.41 | - | 6.11 | Failed |
| DBP | 2.91 | - | 4.23 | - | |
| MAP | 2.77 | - | 3.88 | - | |
| [23] | SBP | 7.945 | 1.447 | 10.375 | Failed |
| DBP | 4.114 | −0.417 | 5.504 | Passed | |
| MAP | 3.834 | 0.204 | 5.130 | Passed | |
| [27] | SBP | 3.68 | - | 4.42 | - |
| DBP | 1.97 | - | 2.92 | - | |
| MAP | 2.17 | - | 3.06 | - | |
| This work | SBP | 4.42 | −1.002 | 4.78 | Passed |
| DBP | 2.25 | 0.019 | 2.98 | Passed | |
| MAP | 2.56 | −0.315 | 3.21 | Passed |
| Works | BP Values | Cumulative Error (%) | Grade | ||
|---|---|---|---|---|---|
| BHS standard | - | 60.00% | 85.00% | 95.00% | A |
| - | 50.00% | 75.00% | 90.00% | B | |
| - | 40.00% | 65% | 85% | C | |
| [17] | SBP | 59.46% | 79.97% | 88.85% | B |
| DBP | 76.95% | 95.72% | 99.97% | A | |
| MAP | - | - | - | - | |
| [18] | SBP | 50.07% | 76.40% | 90.39% | B |
| DBP | 65.66% | 89.77% | 96.63% | A | |
| MAP | 65.14% | 89.58% | 96.61% | A | |
| [19] | SBP | 51.00% | 81.00% | 94.00% | B |
| DBP | 62.00% | 92.00% | 99.00% | A | |
| MAP | 60.00% | 90.00% | 98.00% | A | |
| [25] | SBP | 67.66% | 89.82% | 96.82% | A |
| DBP | 82.79% | 96.12% | 99.09% | A | |
| MAP | 84.21% | 97.38% | 99.58% | A | |
| [23] | SBP | 46.30% | 72.10% | 85.20% | C |
| DBP | 73.20% | 91.90% | 97.00% | A | |
| MAP | 76.00% | 92.30% | 96.90% | A | |
| [27] | SBP | 76.21% | 93.66% | 97.71% | A |
| DBP | 93.51% | 98.70% | 99.46% | A | |
| MAP | - | - | - | - | |
| This work | SBP | 64.20% | 87.85% | 95.26% | A |
| DBP | 95.58% | 99.35% | 99.67% | A | |
| MAP | 90.80% | 98.61% | 99.51% | A | |
| Works | Method | Database | Input | RMSE | Pearson r | Real Time | Device Demonstration |
|---|---|---|---|---|---|---|---|
| [17] | BiLSTM | MIMIC-II | ECG, PPG (Features) | SBP: 8.051 DBP: 3.998 MAP: N/A | - | Yes | Yes |
| [18] | ResLSTM | MIMIC-III | ECG (Features) | - | SBP: 0.88 DBP: 0.71 MAP: 0.85 | Yes | No |
| [19] | Multi-instance regression algorithm | Self-made | ECG, PPG (Features) | - | SBP: 0.90 DBP: 0.84 MAP: 0.88 | Yes | Yes |
| [25] | CNN–LSTM | MIMIC-III | ECG, PPG (Raw) | - | SBP: 0.80 DBP: 0.85 MAP: 0.86 | No | No |
| [23] | RDAE | MIMIC-II | PPG | - | - | No | No |
| [27] | U-net | MIMIC-I and MIMIC-III | PPG (Raw) | SBP: 5.75 DBP: 3.52 MAP: 3.75 | SBP: 0.97 DBP: 0.96 MAP: N/A | No | No |
| This work | 1D Squeeze U-net | MIMIC-I and MIMIC-III | PPG (Raw) | SBP: 6.50 DBP: 3.73 MAP: 4.10 | SBP: 0.97 DBP: 0.96 MAP: 97 | Yes | Yes |
| Model | #Parameters | Size (MB) | #Float Operations | Time/Prediction (ms) |
|---|---|---|---|---|
| U-net [27] | 10,812,682 | 126.91 | 162,176,642 | 2.00 |
| Squeeze U-net | 819,921 | 101.44 | 1,637,678 | 0.32 |
| Reduction Factor |
Publisher’s Note: MDPI stays neutral with regard to jurisdictional claims in published maps and institutional affiliations. |
© 2022 by the authors. Licensee MDPI, Basel, Switzerland. This article is an open access article distributed under the terms and conditions of the Creative Commons Attribution (CC BY) license (https://creativecommons.org/licenses/by/4.0/).
Share and Cite
Athaya, T.; Choi, S. Real-Time Cuffless Continuous Blood Pressure Estimation Using 1D Squeeze U-Net Model: A Progress toward mHealth. Biosensors 2022, 12, 655. https://doi.org/10.3390/bios12080655
Athaya T, Choi S. Real-Time Cuffless Continuous Blood Pressure Estimation Using 1D Squeeze U-Net Model: A Progress toward mHealth. Biosensors. 2022; 12(8):655. https://doi.org/10.3390/bios12080655
Chicago/Turabian StyleAthaya, Tasbiraha, and Sunwoong Choi. 2022. "Real-Time Cuffless Continuous Blood Pressure Estimation Using 1D Squeeze U-Net Model: A Progress toward mHealth" Biosensors 12, no. 8: 655. https://doi.org/10.3390/bios12080655
APA StyleAthaya, T., & Choi, S. (2022). Real-Time Cuffless Continuous Blood Pressure Estimation Using 1D Squeeze U-Net Model: A Progress toward mHealth. Biosensors, 12(8), 655. https://doi.org/10.3390/bios12080655