Article

Copper–Ruthenium Composite as Perspective Material for Bioelectrodes: Laser-Assisted Synthesis, Biocompatibility Study, and an Impedance-Based Cellular Biosensor as Proof of Concept

by
Daniil D. Stupin
1,*,
Anna A. Abelit
1,
Andrey S. Mereshchenko
2,
Maxim S. Panov
2,3 and
Mikhail N. Ryazantsev
1,2,*
1
Nanotechnology Research and Education Centre RAS, Saint Petersburg Academic University, 8/3 Khlopina Street, 194021 St. Petersburg, Russia
2
Institute of Chemistry, Saint Petersburg State University, 7/9 Universitetskaya nab., 199034 St. Petersburg, Russia
3
Center for Biophysical Studies, St. Petersburg State Chemical Pharmaceutical University, Professor Popov Str., 14, Lit. A, 197022 St. Petersburg, Russia
*
Authors to whom correspondence should be addressed.
Biosensors 2022, 12(7), 527; https://doi.org/10.3390/bios12070527
Submission received: 6 June 2022 / Revised: 3 July 2022 / Accepted: 6 July 2022 / Published: 14 July 2022
(This article belongs to the Section Biosensor and Bioelectronic Devices)

Abstract

:
Copper is an inexpensive material that has found wide application in electronics due to its remarkable electric properties. However, the high toxicity of both copper and copper oxide imposes restrictions on the application of this metal as a material for bioelectronics. One way to increase the biocompatibility of pure copper while keeping its remarkable properties is to use copper-based composites. In the present study, we explored a new copper–ruthenium composite as a potential biocompatible material for bioelectrodes. Sample electrodes were obtained by subsequent laser deposition of copper and ruthenium on glass plates from a solution containing salts of these metals. The fabricated Cu–Ru electrodes exhibit high effective area and their impedance properties can be described by simple R-CPE equivalent circuits that make them perspective for sensing applications. Finally, we designed a simple impedance cell-based biosensor using this material that allows us to distinguish between dead and alive HeLa cells.

1. Introduction

Nowadays, bioelectronics is actively involved in many areas of bioscience and biotechnology, such as biosensing [1,2,3,4,5,6,7,8,9,10,11,12,13,14], vision, hear, bone prosthetic care [15,16,17,18,19,20,21,22,23,24,25,26,27], artificial cardiac pacemakers development [28,29], medical diagnostics [30,31,32,33], neuroscience [34,35,36], etc. Such great achievements became possible both due to the emergence of well-developed semiconductor microelectronics technologies in the second half of the 20th century [37,38,39,40], and due to the intensive development of biotechnologies, e.g., cytotechnologies, in the 20th and 21st centuries [41,42,43,44]. The further progress in this field will in large part depend on the development of new bioelectrodes that serve as an interface for transferring information between living matter and semiconductor microelectronics and for the electrical stimulation of cells and tissues.
At present, precious metals or their alloys are the most common materials used for fabrication of bioelectrodes (see ref. [2] p. 70 and refs. [45,46,47]). Despite the remarkable electrochemical properties and biocompatibility of the noble metals, there are also disadvantages such as their expensiveness and difficulties in processing [40]. Copper is an inexpensive material that is widely used in electrical engineering due to its remarkable electrical properties. Copper electrodes are often used to manufacture electrochemical sensing devices [48,49,50,51] (e.g., glucose sensors) and as a base for skin electrodes [52,53,54]. However, due to the high toxicity of copper and copper oxide [55,56,57], copper electrodes can not replace expensive noble metal electrodes in many important fields of bioelectronics such as impedance-based in vitro and in vivo cell and tissue studies (for example, using the ECIS method [6]), neuronal electrophysiological investigation with multi-electrode arrays [34], etc.
As it was demonstrated in several recent studies, the modification with biocompatible substances can significantly improve biocompatibility of copper. Among the modified Cu-based materials with good biocompatibility are Ti–Cu–Zr alloys [58], steel–copper composites [59], Ti–Cu alloys [60], Fe–Cu compounds [61], copper with polymerized coating [62], and Cu–Al–Zn–Ni–Mn alloys [63]. Following this line of thought, we applied the technique of laser-induced metal deposition from solution [64] to synthesize bimetallic electrode materials containing copper and such a biocompatible metal as ruthenium [65]. A pure Cu electrode was also synthesized as a control sample. The obtained Cu-based electrodes are promising candidates for sensing applications, because they exhibit high effective area and can describe impedance properties by a simple R-CPE equivalent circuit. In addition, the Cu–Ru electrode has proved to be highly biocompatible in contrast to pure the Cu electrode. Further, the Cu–Ru electrode was used to design a simple impedance-based biosensor allowing us to distinguish between dead and alive HeLa cells.

2. Materials and Methods

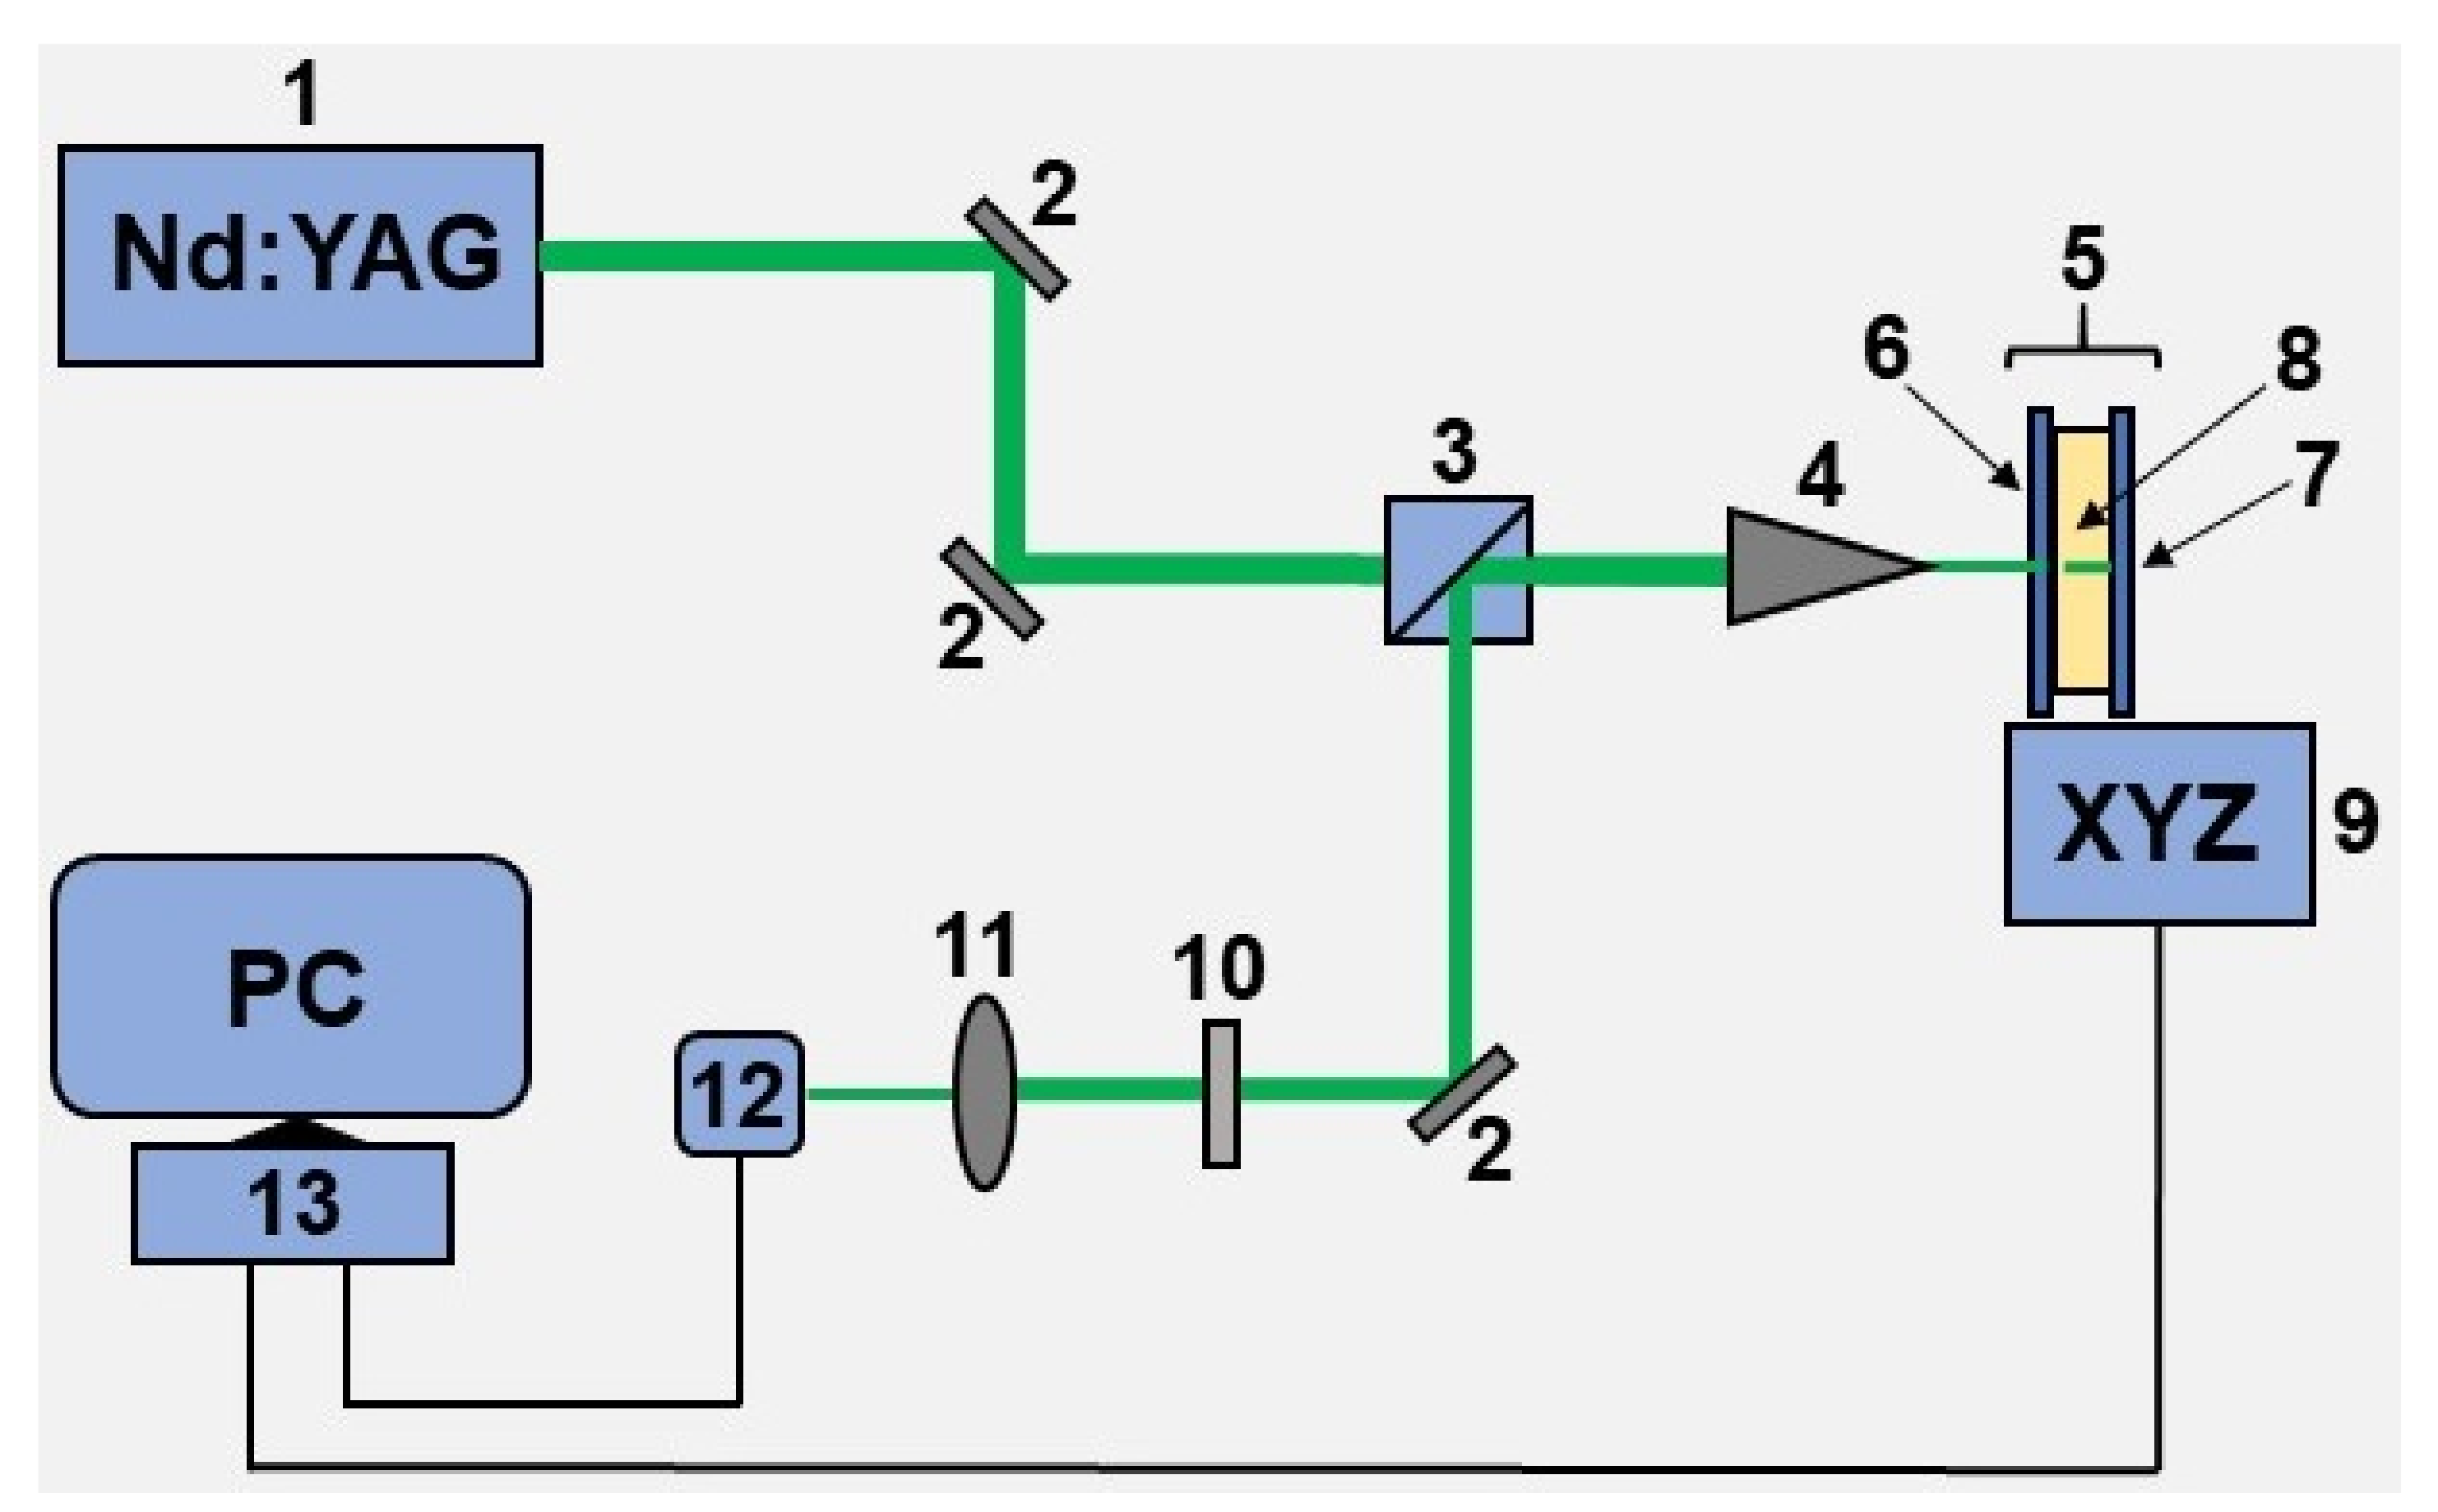
2.1. Synthesis of Cu-Based Electrodes

All chemicals used in the current work were analytically graded and were purchased from Sigma Aldrich (St. Louis, MO, USA). The solution compositions utilized for synthesis of the electrode materials are shown in Table 1.
Laser-assisted fabrication of Cu microstructures (electrodes) and their further modification with Ru was performed using a simple and cheap approach that was successfully applied for similar purposes in our previous works. This approach is based on the method of laser-induced metal deposition from solution (LCLD) [64,66,67,68,69,70]. In general, LCLD deals with the reactions of metal reduction and its subsequent deposition on the surface of different dielectrics (glass, glass-ceramics, etc.) that occurs in a local volume of a solution within the focus of the laser beam.
The detailed description of the experimental setup used for the fabrication of Cu-based electrodes can be found elsewhere [64]. Briefly, the 532 nm output from a diode-pumped continuous-wave solid-state Nd:YAG laser (Changchun, China) was used as a light source (Figure 1). After passing through two Al mirrors and an optical separation cube, the laser output was focused on (5 µm laser spot) the experimental cell, i.e., between a solution and a dielectric substrate (glass) using a standard microscope objective (15 mm focus length). In order to produce electrodes of various geometry, this cell can be translated into three dimensions using a computer-controlled XYZ-motorized stage. In turn, the 532 nm light was partially reflected back by the cell surface toward an optical separation cube with subsequent redirection to another Al mirror. Further, the redirected beam light traveled to a web camera that was used for monitoring and regulating the metal deposition process. In order to avoid optical damage to the web camera, the intensity of the reflected laser output was attenuated by a neutral density filter (fractional transmittance 25%).
In this study, we performed a two-stage synthesis of Cu-based electrodes on the surface of the glass. In the first stage, we fabricated copper microstructures (electrodes) of 10 mm length and ∼150 µm width at a laser power density of ∼51 mW/µm2 and at a scanning speed of 5 µm/s. In the second stage, the presynthesized Cu structures were modified by laser deposition of Ru on their surface at the same scanning speed and at laser power density of 66 mW/µm2. The difference in laser power densities for the first and second stages of synthesis was caused by the different initiation thresholds of the reduction reactions of copper and ruthenium.

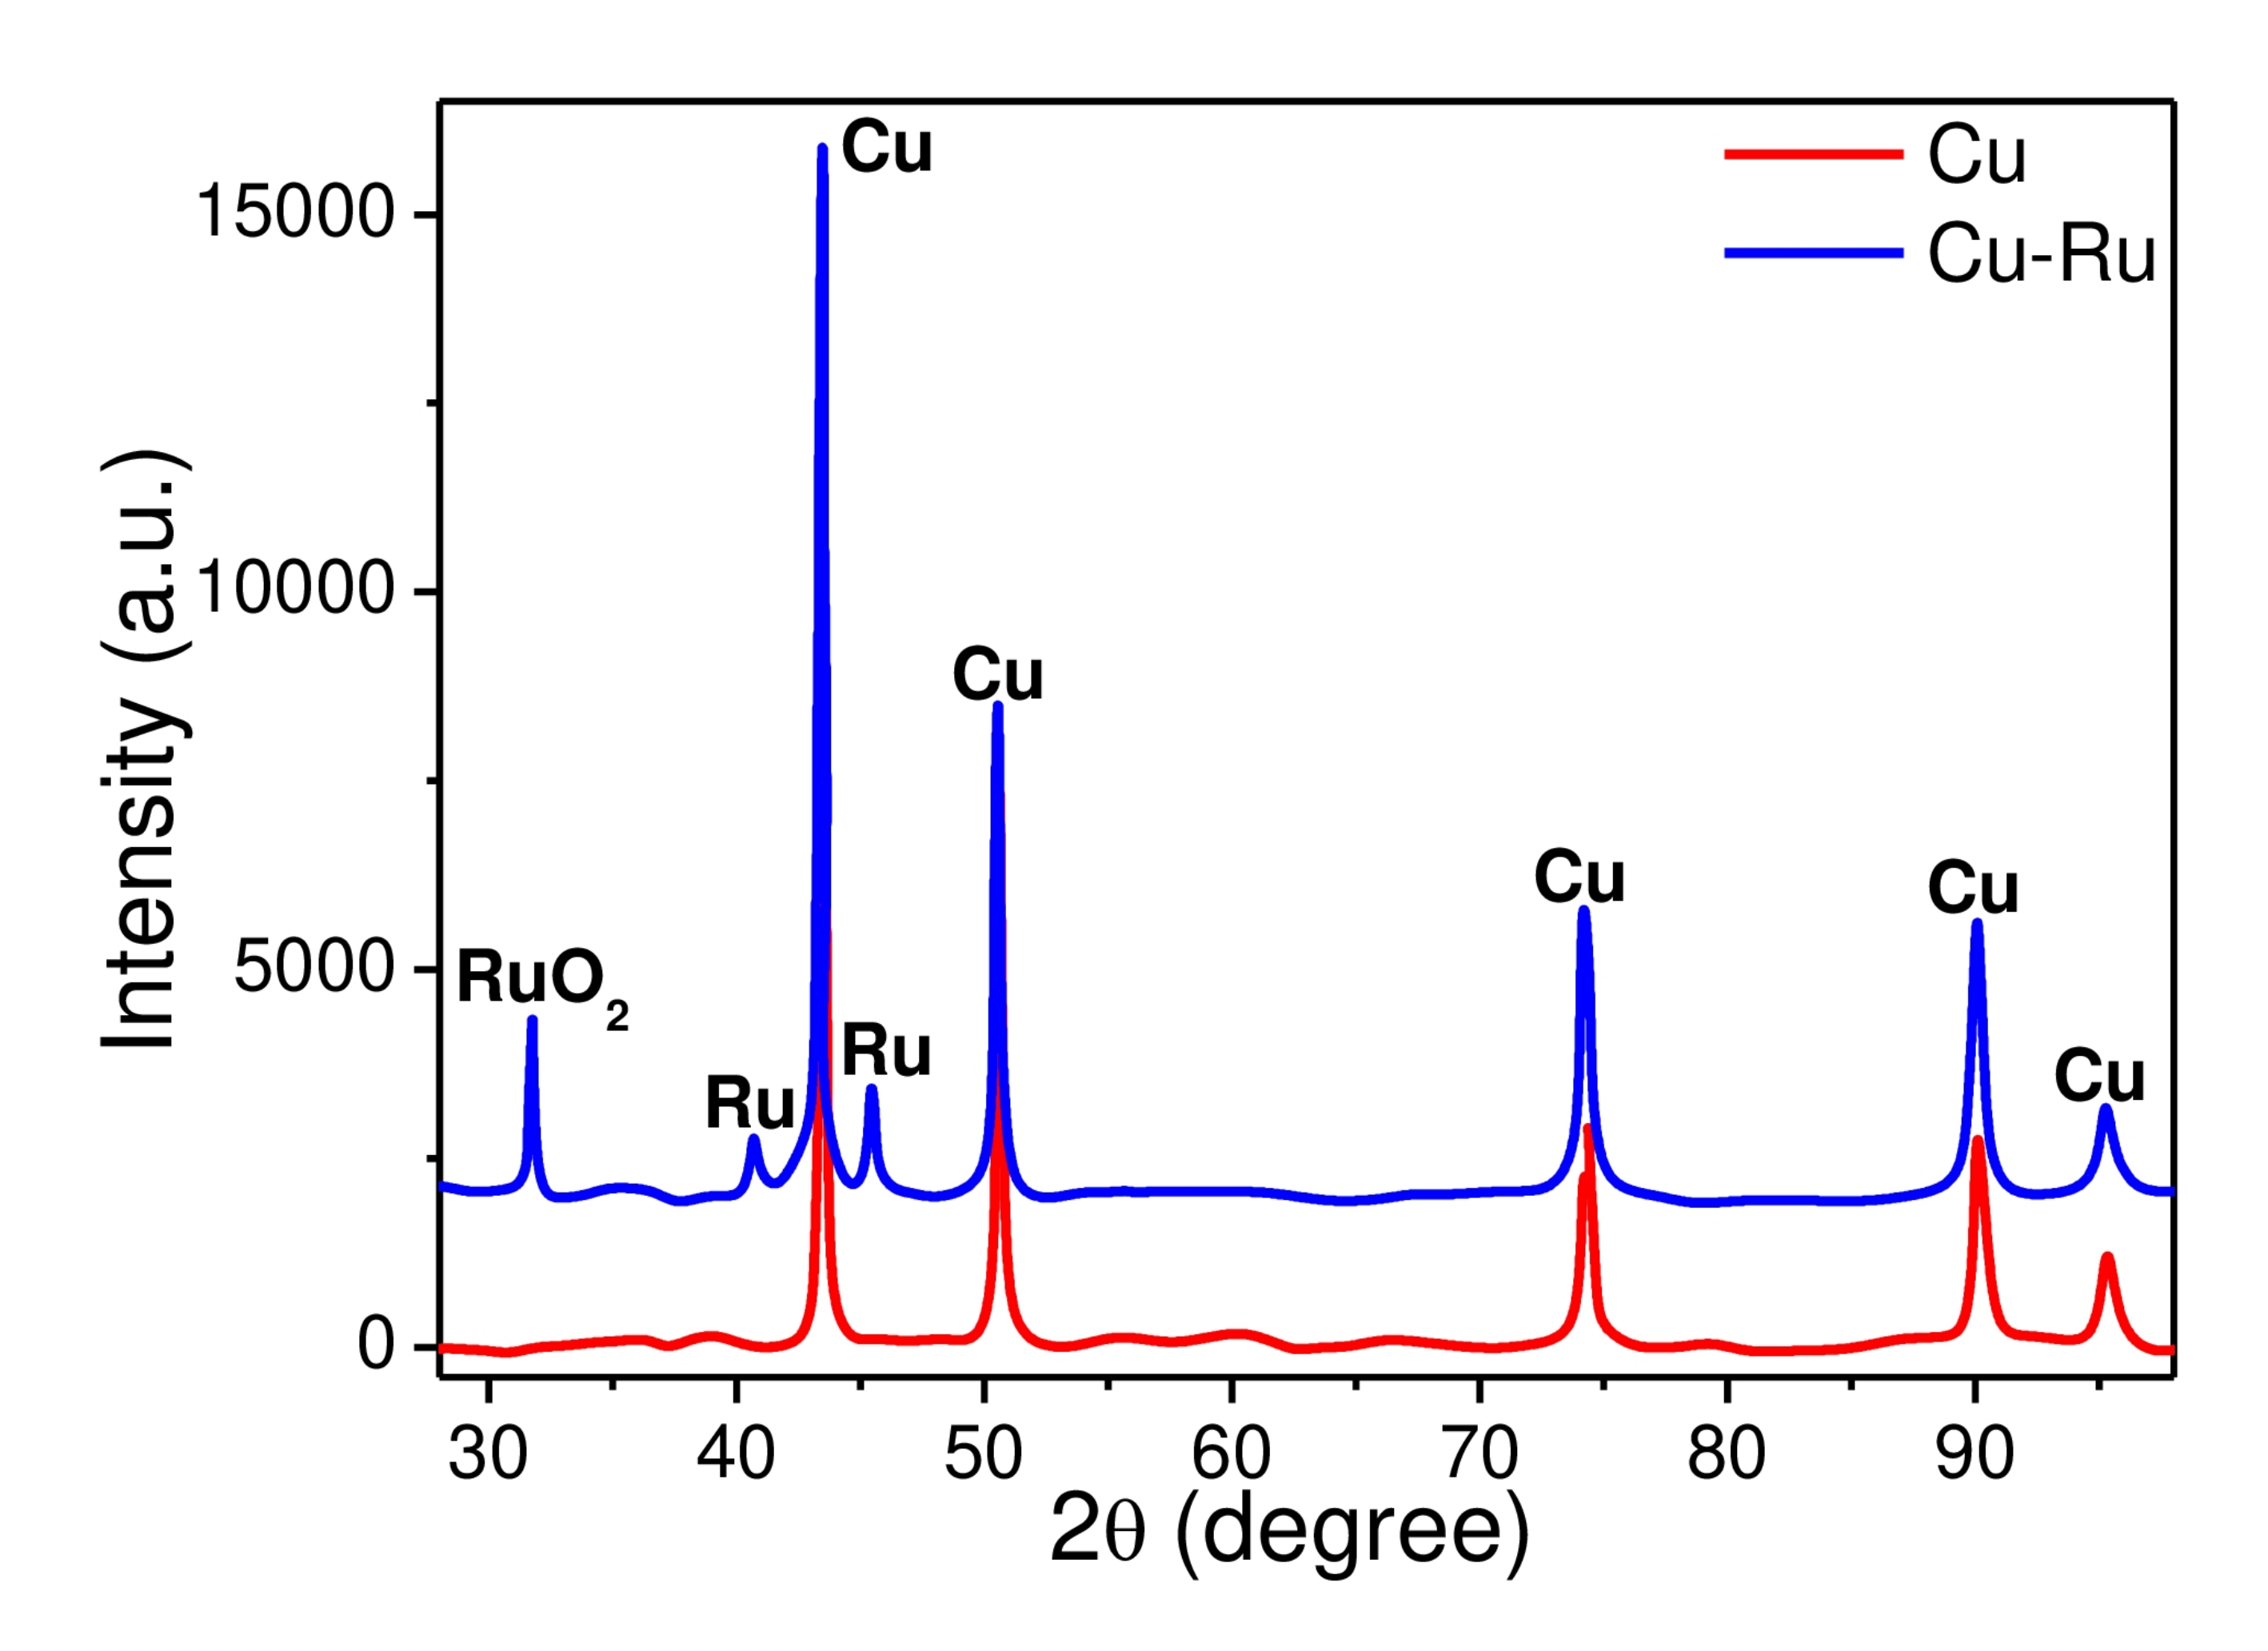
2.2. SEM and XRD Diagnostics

The morphology of Cu-based electrodes was studied using a Zeiss Supra 40 VP scanning electron microscope (Oberkochen, Germany) coupled with an INCA X-Act EDX analyzer (Oxford Instruments, UK) for characterization of their atomic composition. The X-ray diffraction analysis (XRD) of Cu-based electrodes was carried out on a Bruker D2 Phaser diffractometer equipped with a LynxEye detector (Karlsruhe, Germany) using Cu K α (1.542 Å) radiation in the 2 θ angle range of 0–100°.

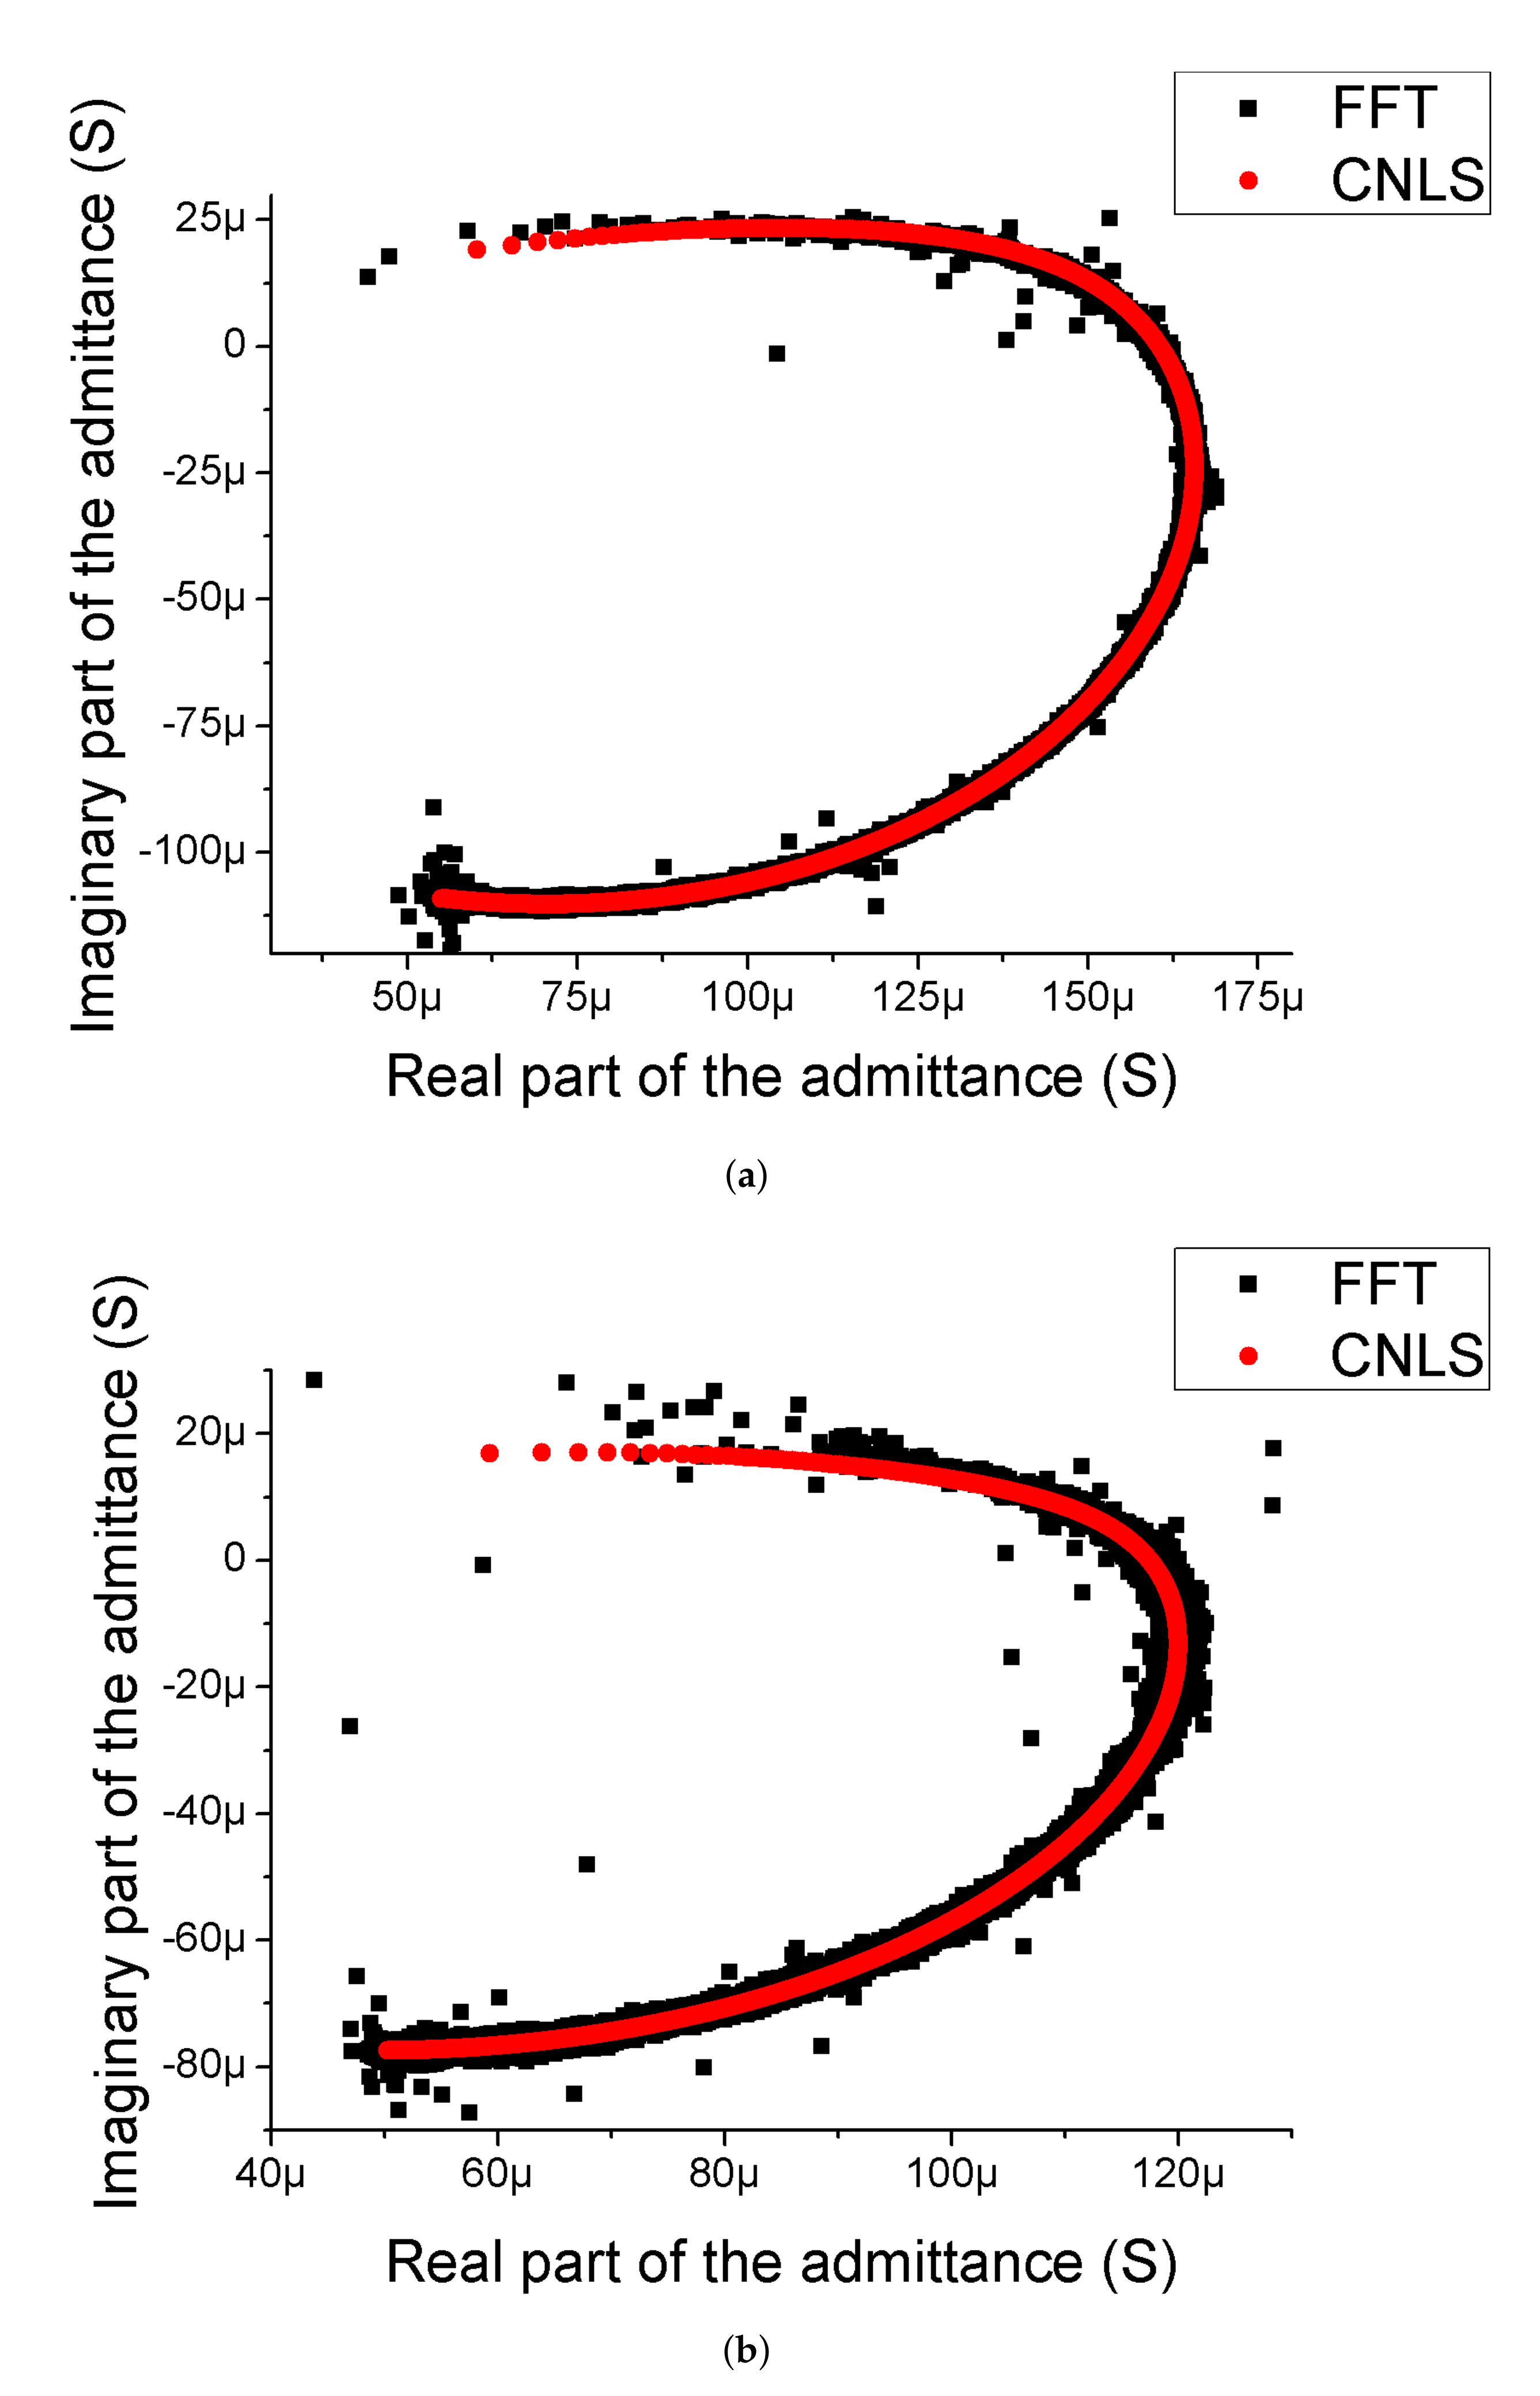
2.3. Admittance Measurement

The admittance spectra were obtained using the Fourier immittance spectroscopy method (FFT-EIS) [4,71,72]. The measurements were performed on a homemade setup discussed in ref. [73]. The AKIP 3413/3 generator (AKIP, Russia) was used as an excitation voltage source switched in the sine-sweep regime. These experiments were conducted in the frequency range between 2 Hz and 40 kHz with a 2 Hz resolution and at excitation voltage with a 15 mV amplitude. The glass filled with PBS solution (phosphate-buffered saline, Biolot, Russia) was used as an electrochemical cell, in which the investigated electrode and reference platinum electrode with a large area were embedded. EIS measurements were started after the disappearance of the faradaic current.
The admittance spectra were analyzed using complex non-linear least squares (CNLS) method [74] in the NELM package for MatLab [73] (can be obtained by request). The scheme presented in Figure 2 was used for CNLS spectra analysis. Here, CPE is constant phase element [75] with impedance equal to
Z = 1 W ( i ω ) α ,
where α is non-ideality parameter, which is also called the constant phase element exponent, and W is pseudo-capacitance with dimension of S · s α .
For taking into account the delay between excitation voltage and current response measurements by ADC [76], the parameter Δ t was introduced into the model as follows:
Y m = Y s × e i ω Δ t ,
where Y m is a model, which was used for CNLS approximation, Y s is admittance of the scheme Figure 2, and ω is an angular frequency. The measurements were repeated 5 times to calculate 99% confidence intervals.

2.4. Biocompatibility Study

We used the following experimental scheme to study the biocompatibility of the fabricated Cu-based electrodes. On the day before the experiment, the HeLa cells [43] obtained from the Bank of Cell Cultures of the Institute of Cytology of the Russian Academy of Sciences were seeded on the surface of these electrodes. Then, they were incubated for 24 h in a CO2 incubator at 37 °C and 5% CO2 in DMEM medium (Sigma-Aldrich, MO, USA), containing 5% fetal bovine serum and 0.1% gentamicin.
Further, each electrode was washed three times with PBS and treated first with DiBAC dye (visualization of the membrane, Thermo Fisher Scientific, MA, USA) and then with propidium iodide dye (PI, visualization of dead cell nuclei, Thermo Fisher Scientific, MA, USA). Each dye was diluted by 1000 times with PBS. All electrodes were treated with each diluted dye for 1 min. Next, they were placed into a Petri dish with PBS and examined using a Leica 4000 DM fluorescence microscope (Leica Microsystems GmbH, Germany). Consequently, we have used the “I3” cube to obtain DiBAC fluorescence, and the “N21” cube to obtain propidium iodide fluorescence.
The recorded microscopic photographs were further processed using the MatLab package to create combined pseudo-color images. The monochrome, green, and red channels correspond to the image in the transfer-light, the DiBAC, and PI fluorescence, respectively.

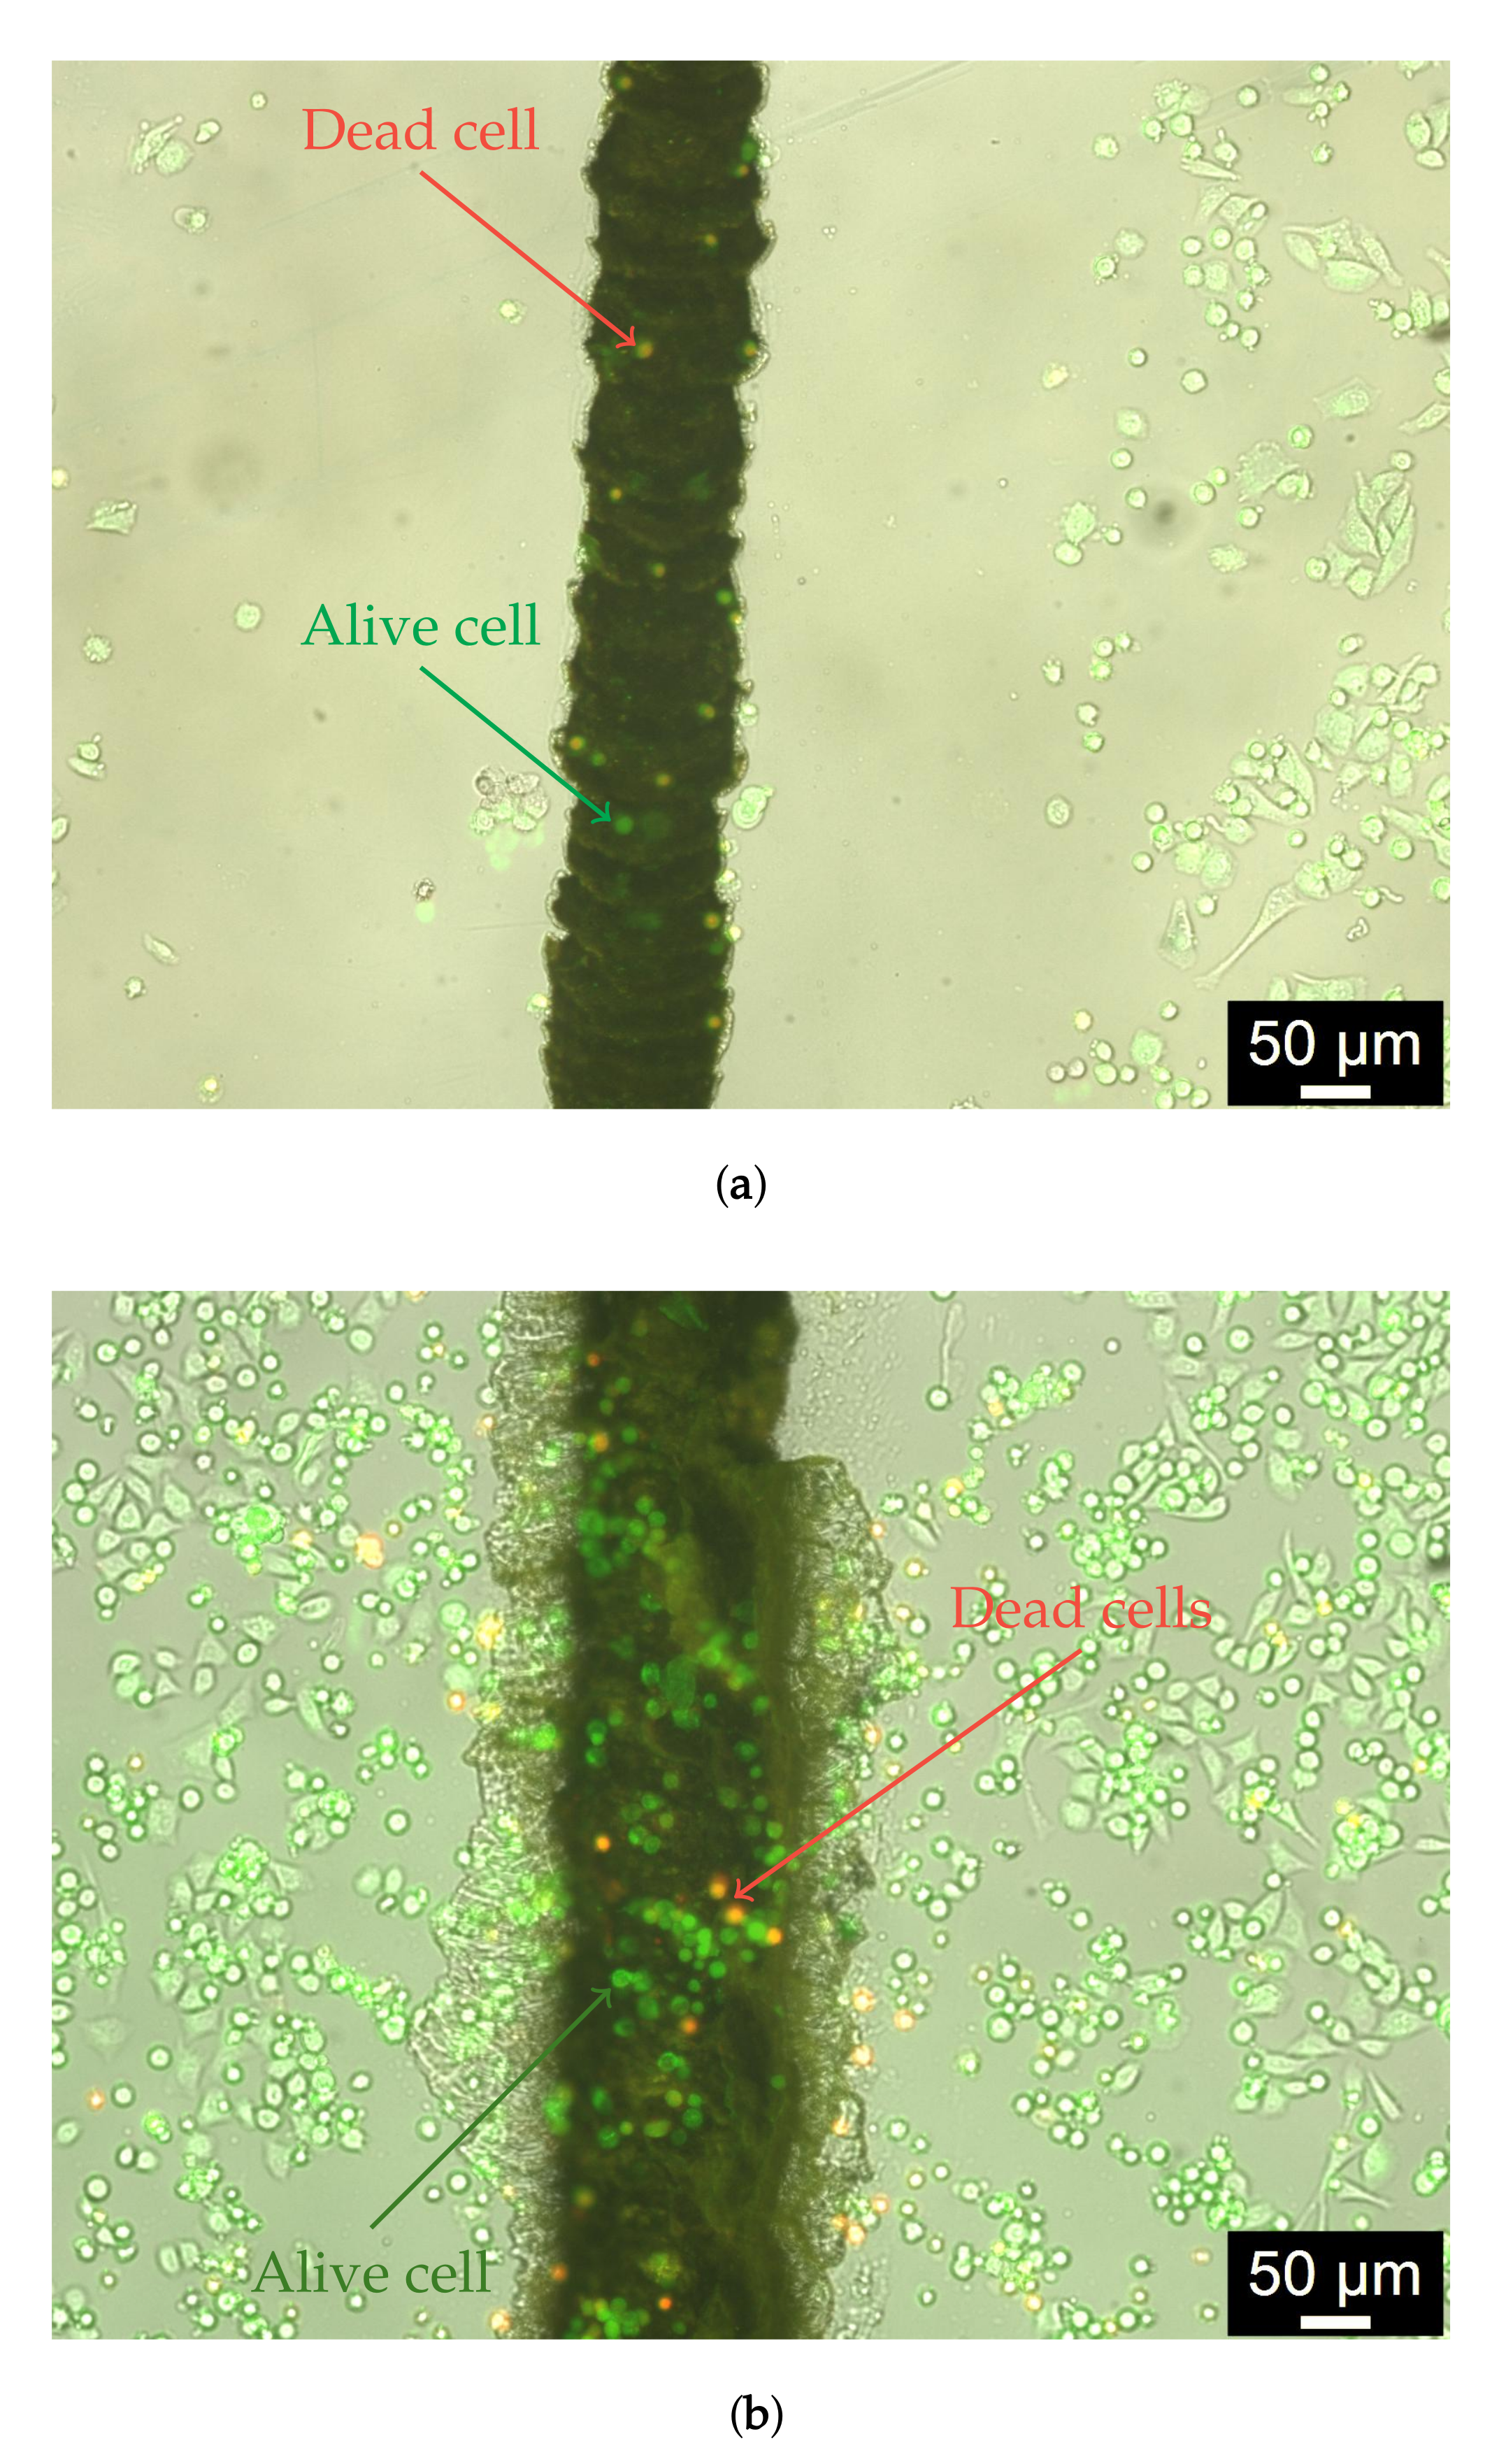
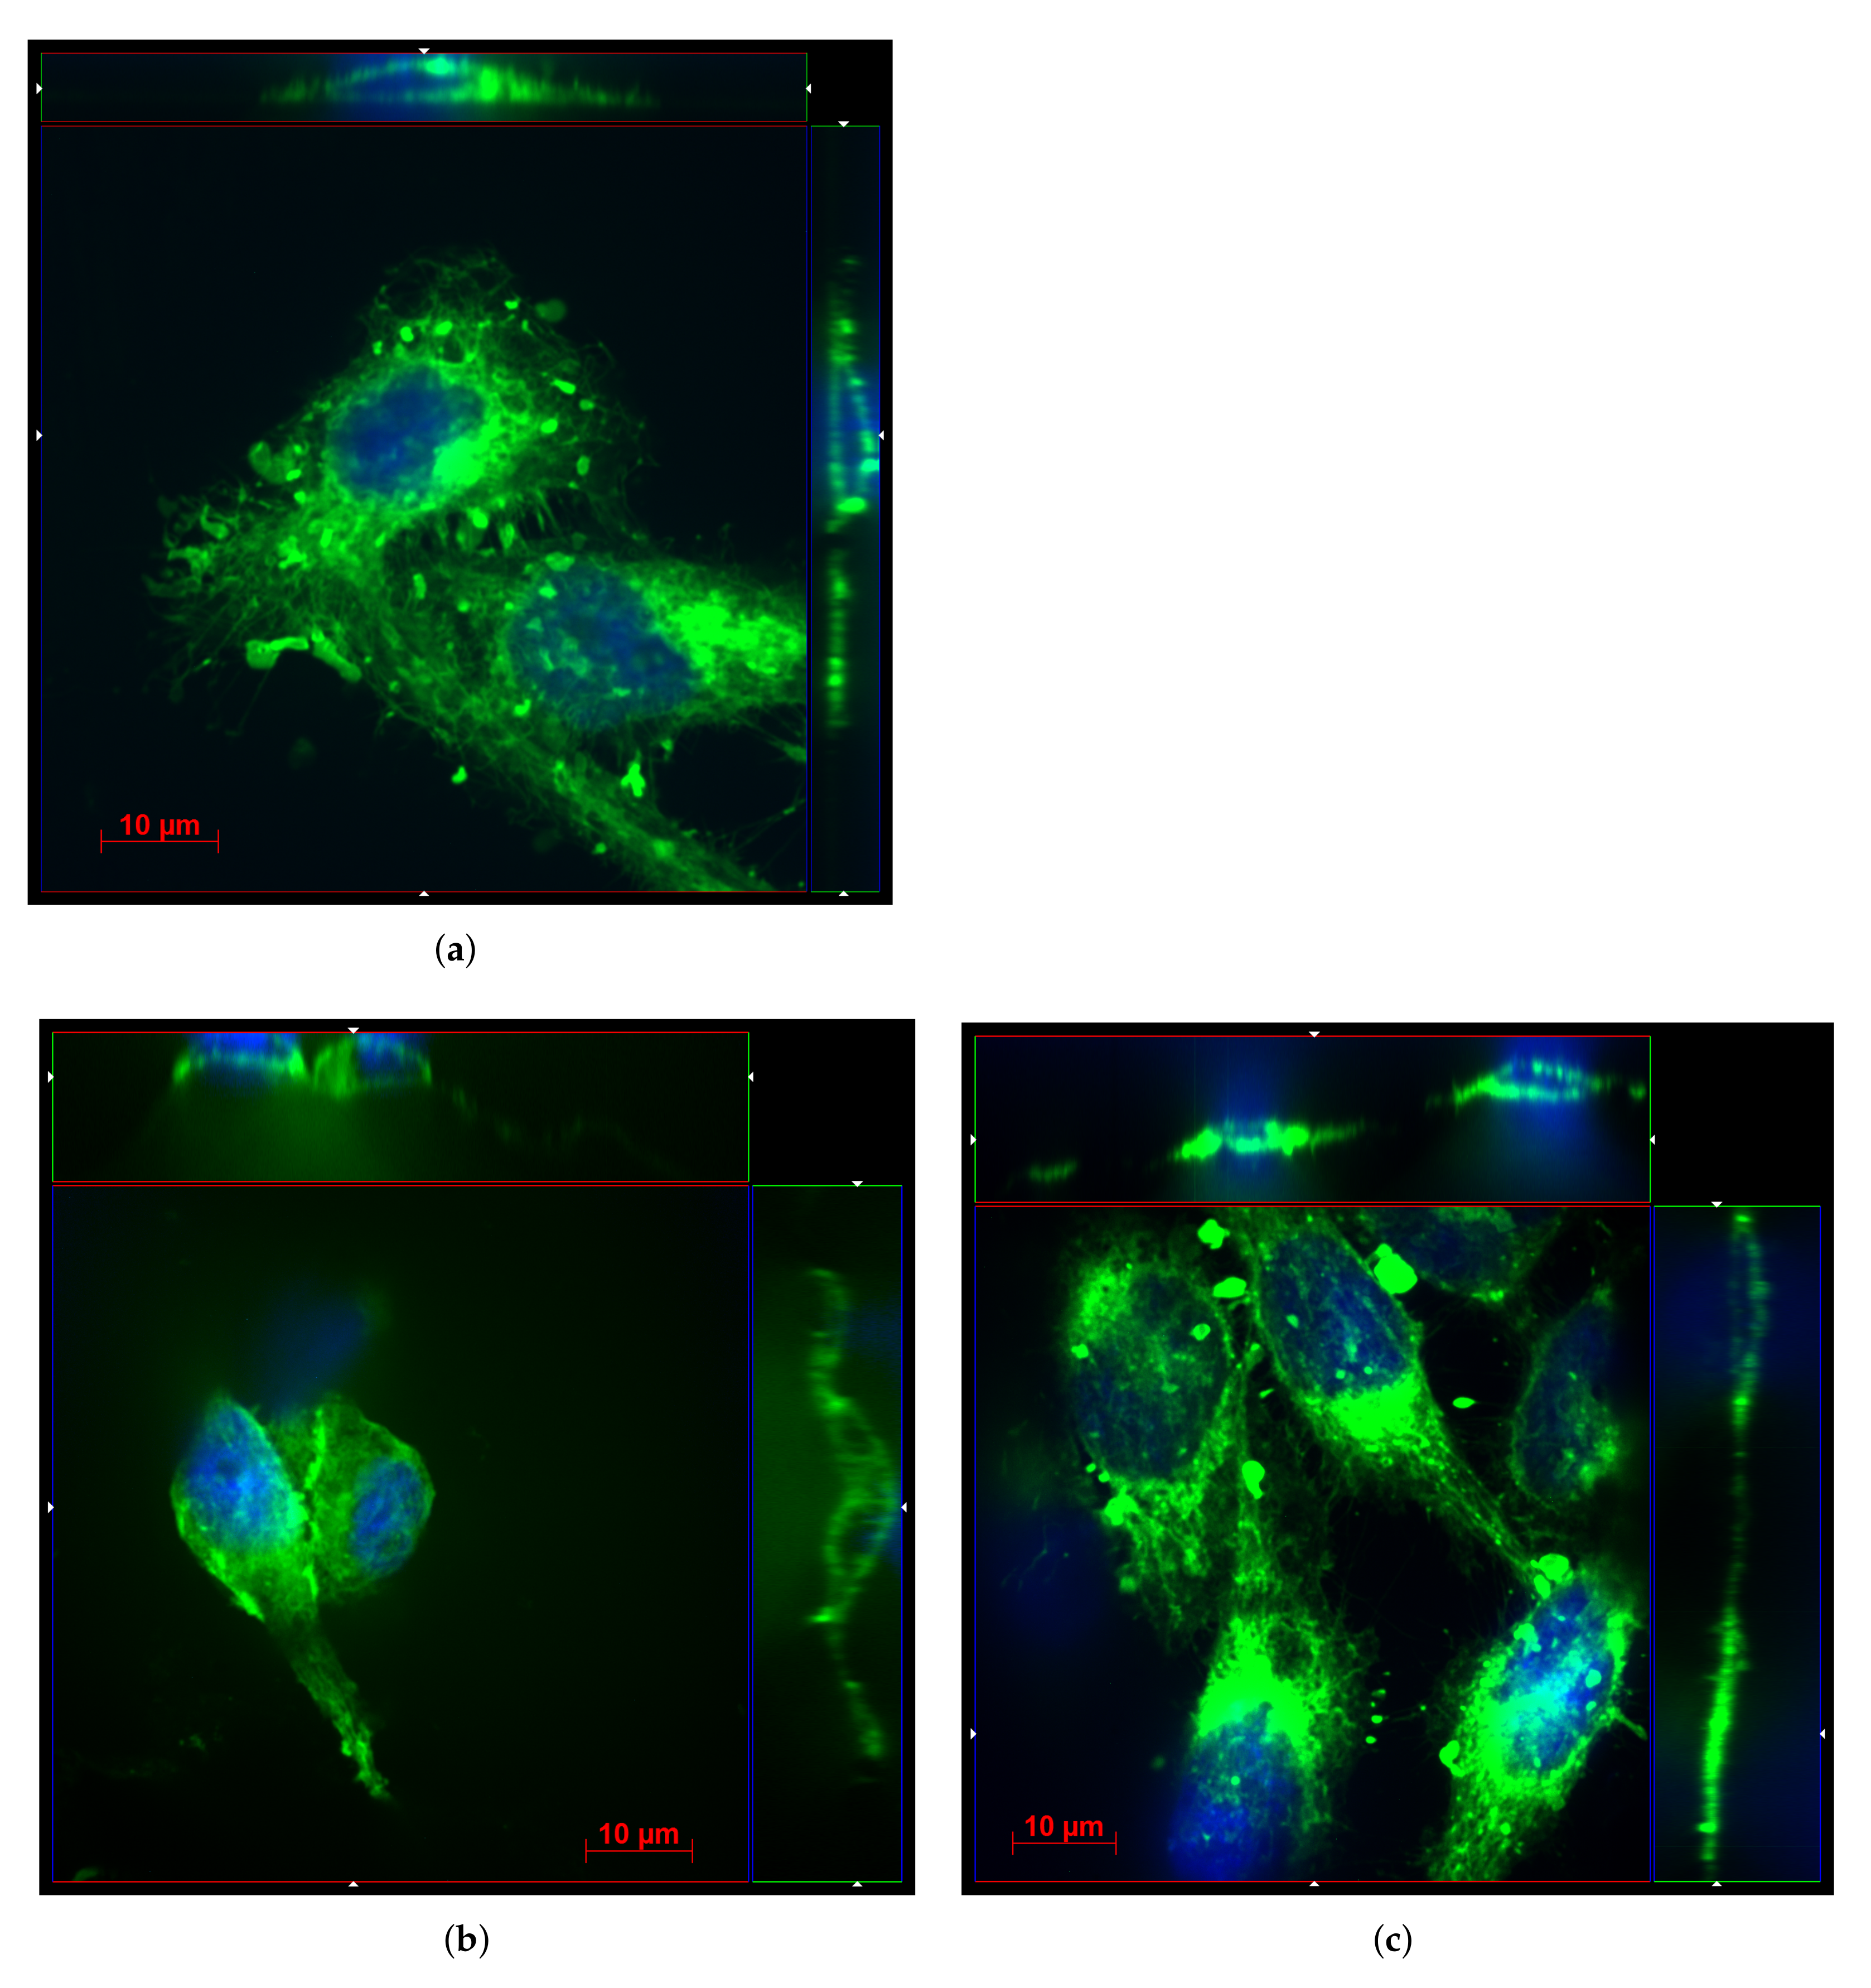
2.5. Cell Adhesion Study

To study the adhesion of the HeLa cells to Cu-based electrodes, we examined them on a Zeiss Observer.Z1 confocal microscope (Carl Zeiss Microscopy GmbH, Germany) [77] using the following protocol. The day before the experiment, the cells were seeded on the electrode surface and incubated under the same conditions as described in the subsection “Biocompatibility study”. Then, the samples were washed three times with PBS and stained with PI diluted by 1000 times. After this procedure, the cells were stained with the Deep Red Cell Mask dye (membrane visualization, Thermofisher Scientific, USA) and fixed with 3.7% paraformaldehyde. Finally, the cells were treated by Fluoroshield with DAPI dye (cell nuclei visualization, Sigma Aldrich, St Louis, MO, USA) and covered with a coverslip that was later glued to the samples by nail polish. In order to obtain high-resolution images of the studied samples, immersion oil was placed between the 100× objective and the coverslip. For analysis, we selected the cells that did not exhibit PI fluorescence and, therefore, were alive before paraformaldehyde treatment.

3. Results

Cu and Cu–Ru electrodes were synthesized using the experimental setup (Figure 1) and methodology described in the section “Materials and methods”. In the context of biosensing applications in general and applications such as bioelectrodes for impedance-based spectroscopy in particular, the following physical and biological properties of an electrode are desirable: for higher sensitivity of analytical measurement electrode surface has to be developed, the admittance spectra of the electrodes should allow fitting by the simple equivalent scheme, the electrode must be biocompatible, and adhesion of a cell on the electrode surface has to be as good as possible. Investigation of all these properties both for Cu and Cu–Ru electrodes are given below in this section.

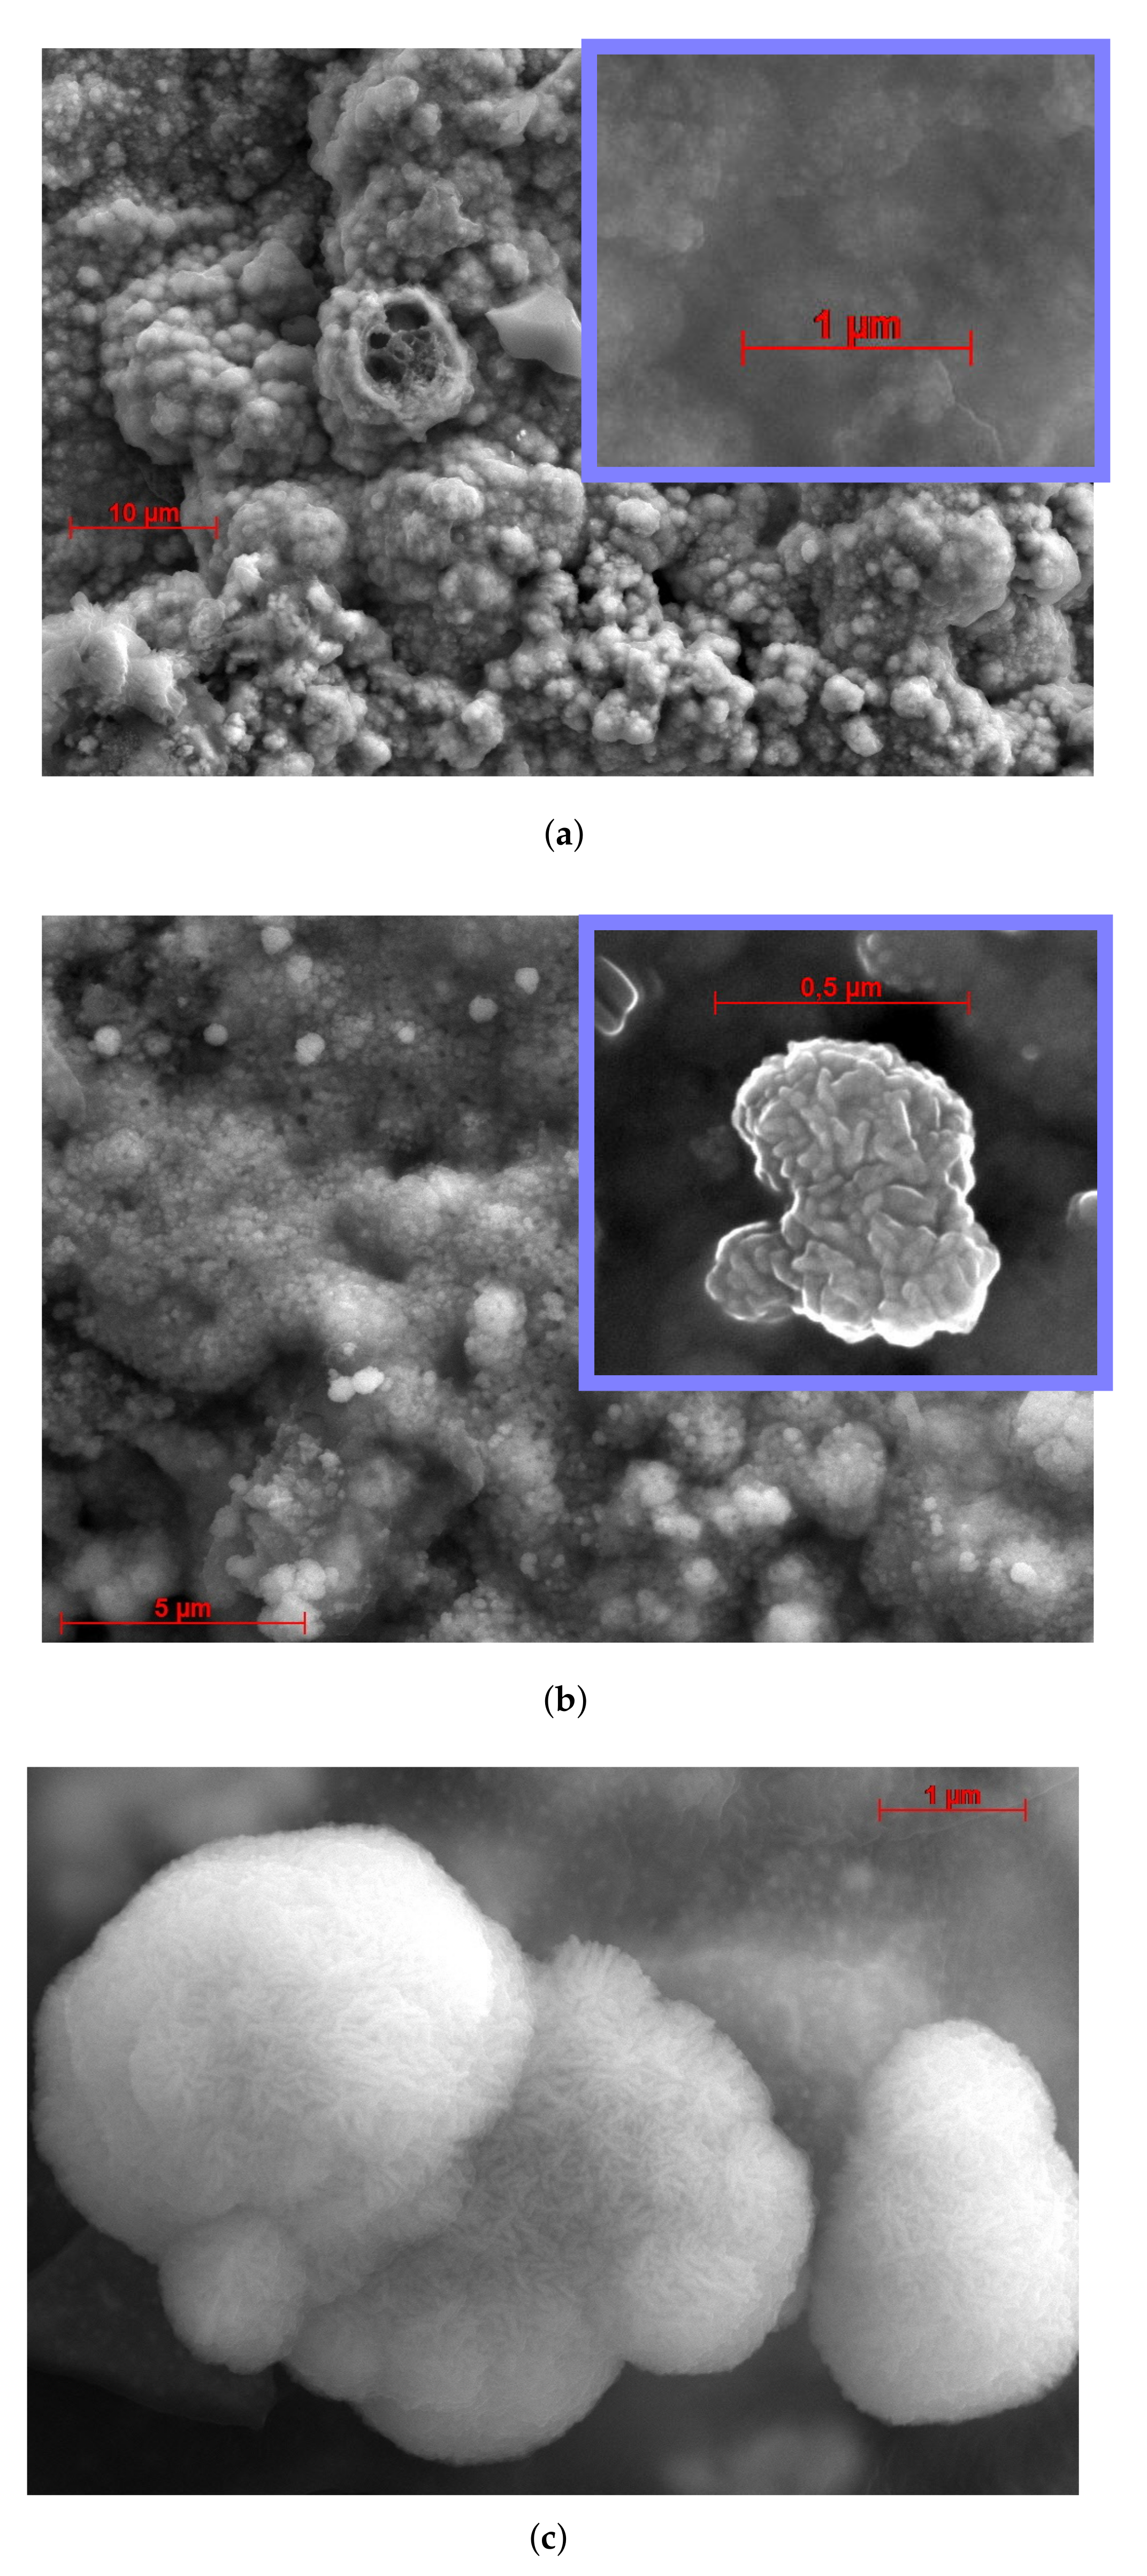
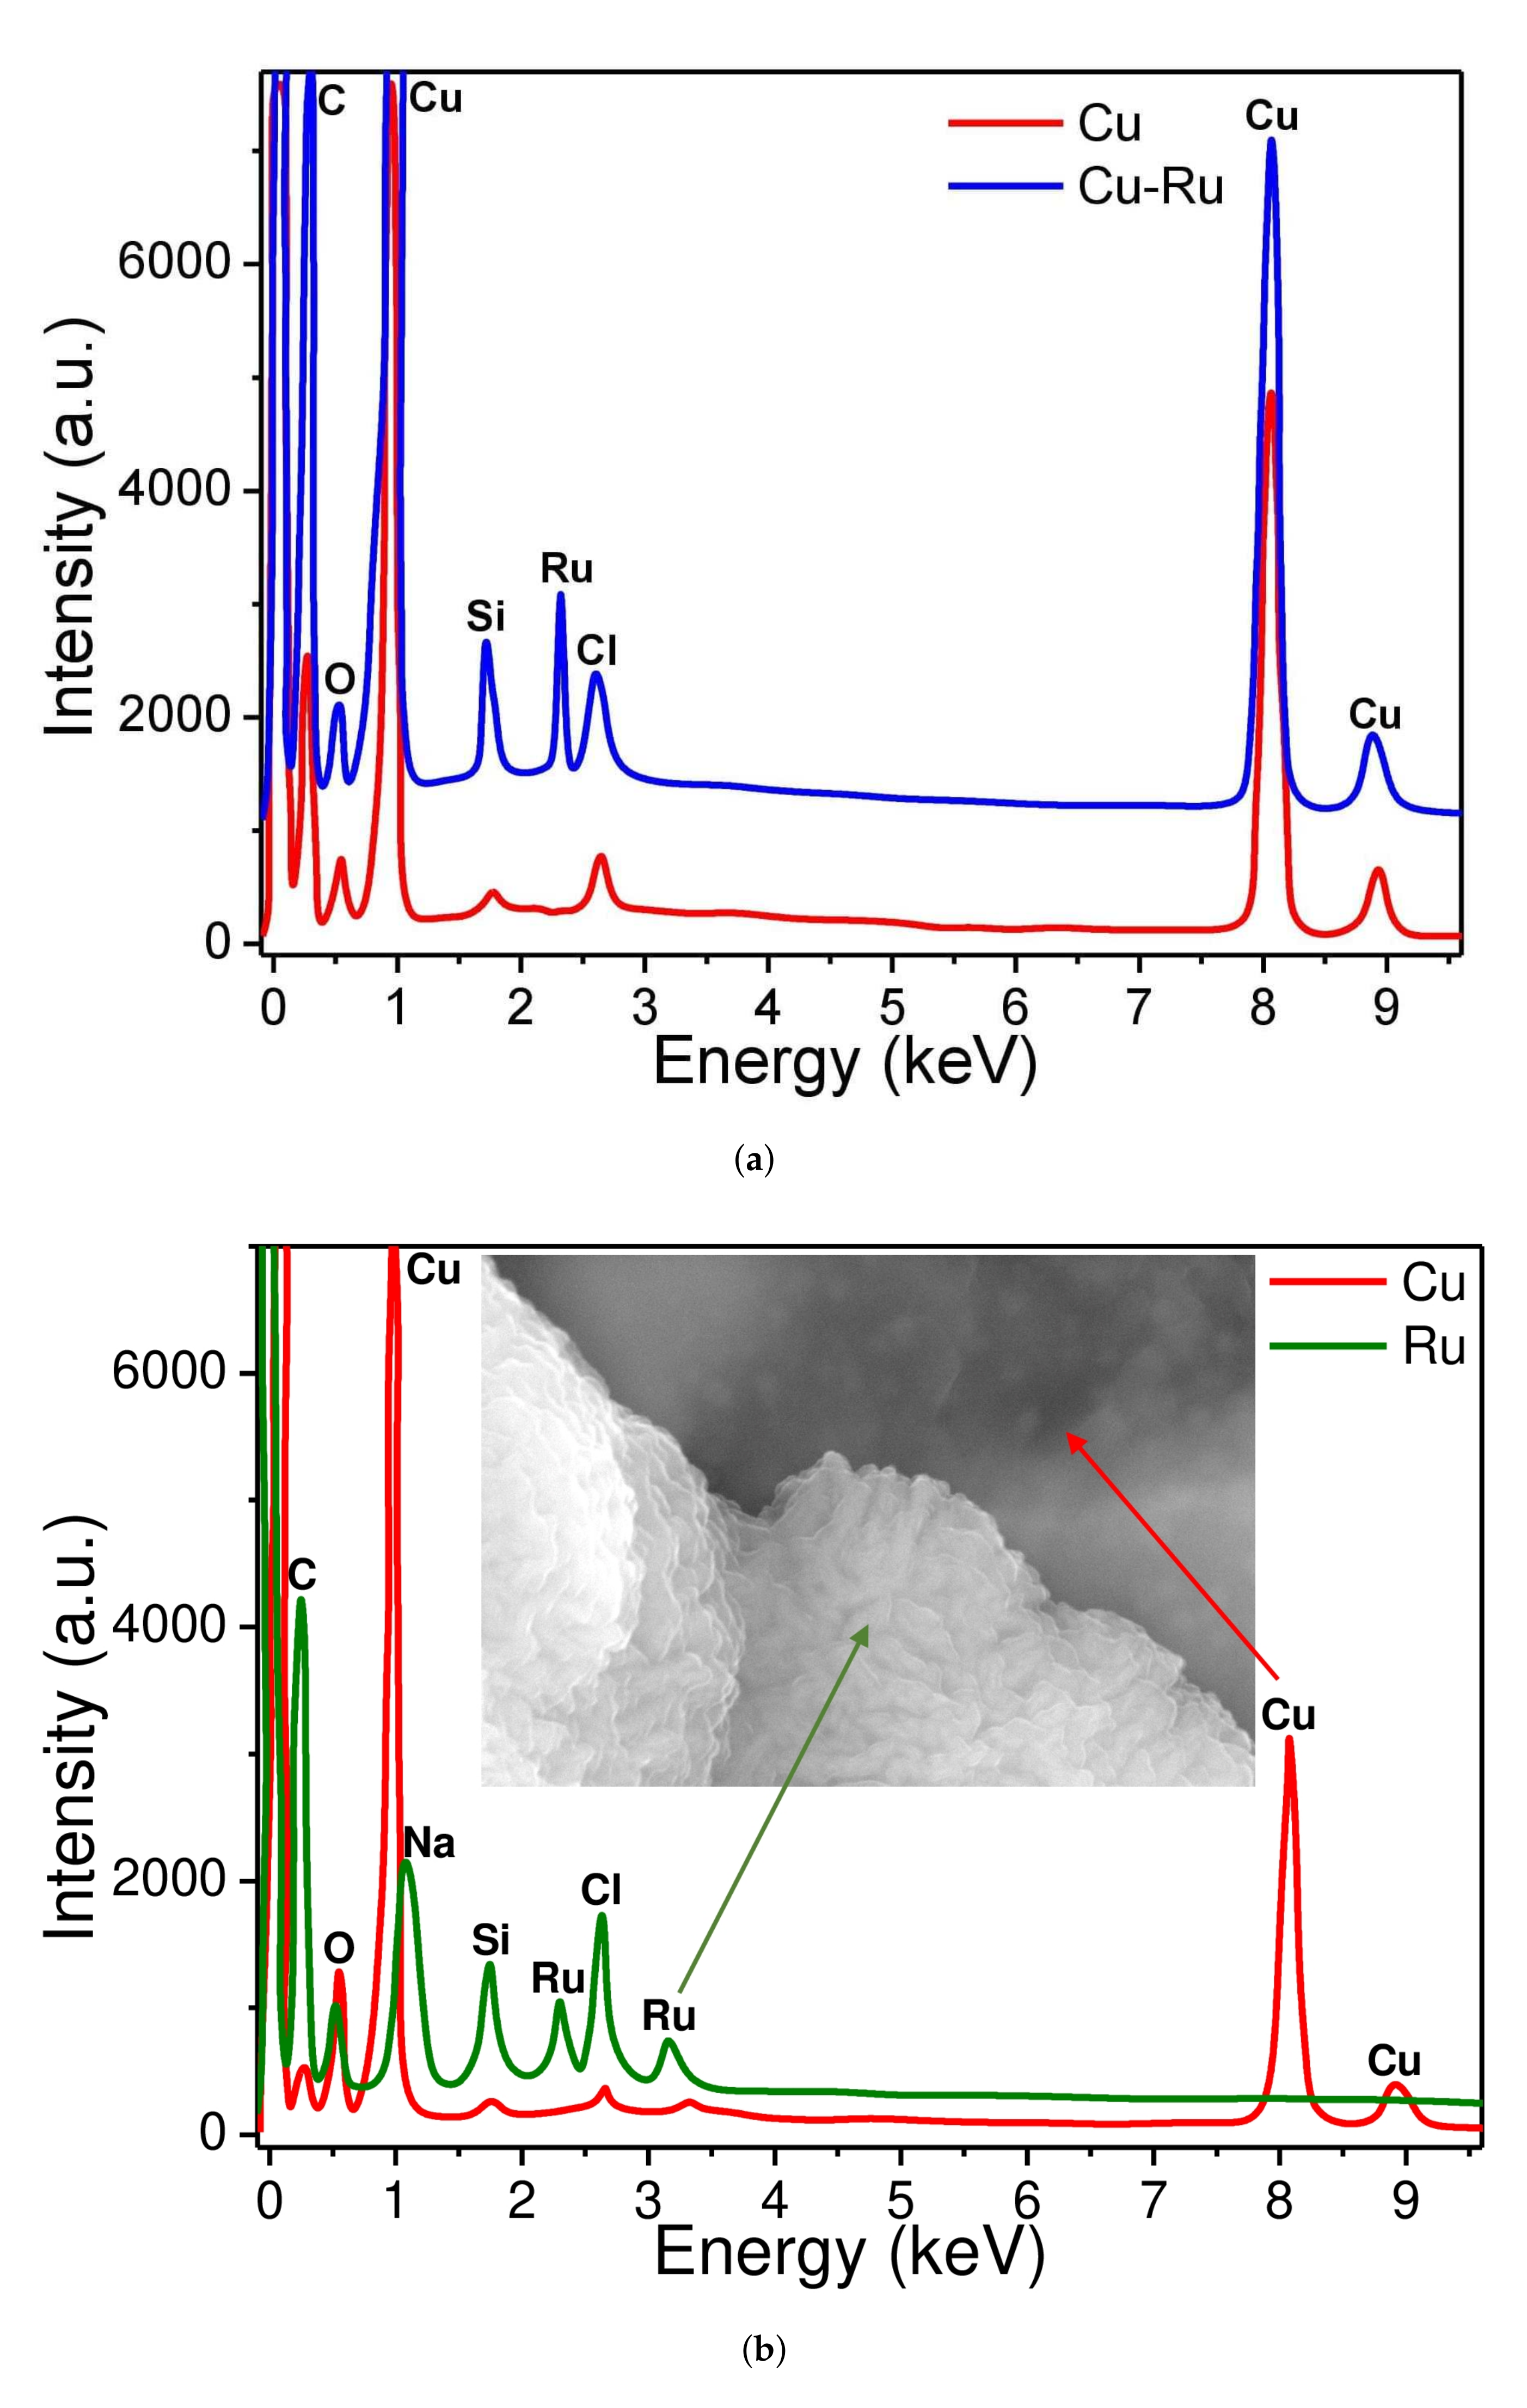
3.1. Surface Characterization and Elemental Composition

The results of the SEM studies are presented in Figure 3. Both electrodes have porous and developed morphology. Their surfaces exhibit hierarchic structure, i.e., they contain large pores composed of smaller irregularities. The modification of Cu electrode with Ru does not qualitatively change their hierarchical structure. However, this process naturally reduces the pore size because of the growth of Ru particles inside the Cu pores. Such a hierarchical organization effectively increases the surface of the electrodes without compromising their linear dimensions. It is important for biological applications, including the determination of the cell impedance and measurement of neuroactivity. The obtained results agreed well with the impedance measurements discussed in Section 3.2. From manual pore size measurements (Figure 3), we found that the average pore sizes for Cu and Cu–Ru electrodes are 1.4(1) and 0.50(7) µm, respectively. Analogically, we measured the pore density D from Figure 3. It was found that D equals 50/100 and 300/100 µm−2 for Cu and Cu–Ru electrodes, respectively. Using these values, we were able to estimate the increase in effective area with respect to the area of the planar electrodes as 97% for Cu and 90% for Cu–Ru (see Appendix B).
The elemental composition of Cu-based electrodes and their crystalline structure investigation are presented in Figure 4. According to these data, all electrode materials are very pure and polycrystalline. The surface of the Cu–Ru electrode deserves special attention. It consists of ruthenium islands, which are located on the pure copper layer (see Figure 3c and Figure 4b). It should be noted that these islands have zigzag nanopores resembling those seen in Ru-based electrode fabricated in our previous work [64]. The contents of copper and ruthenium observed in the Cu–Ru electrode according to EDX (Figure 4) were 71% and 12%, respectively. The EDX analysis also showed the presence of oxygen, sodium, chlorine, silicon, and carbon in the sample, which can be attributed to the substrate material (glass). The X-ray phase analysis (XRD) was performed to determine the phase composition of the obtained Cu-based electrode materials. The obtained data showed the presence of a polyphase multicomponent system containing metallic and oxide phases (Figure 5). For both samples, the metallic phase is copper, whereas ruthenium is an additional metal phase in the Cu–Ru electrode. In addition, the low-intensity reflexes of RuO2 were observed for Cu–Ru. It should be mentioned that the results of the XRD analysis of Cu-based electrodes are consistent with EDX data.

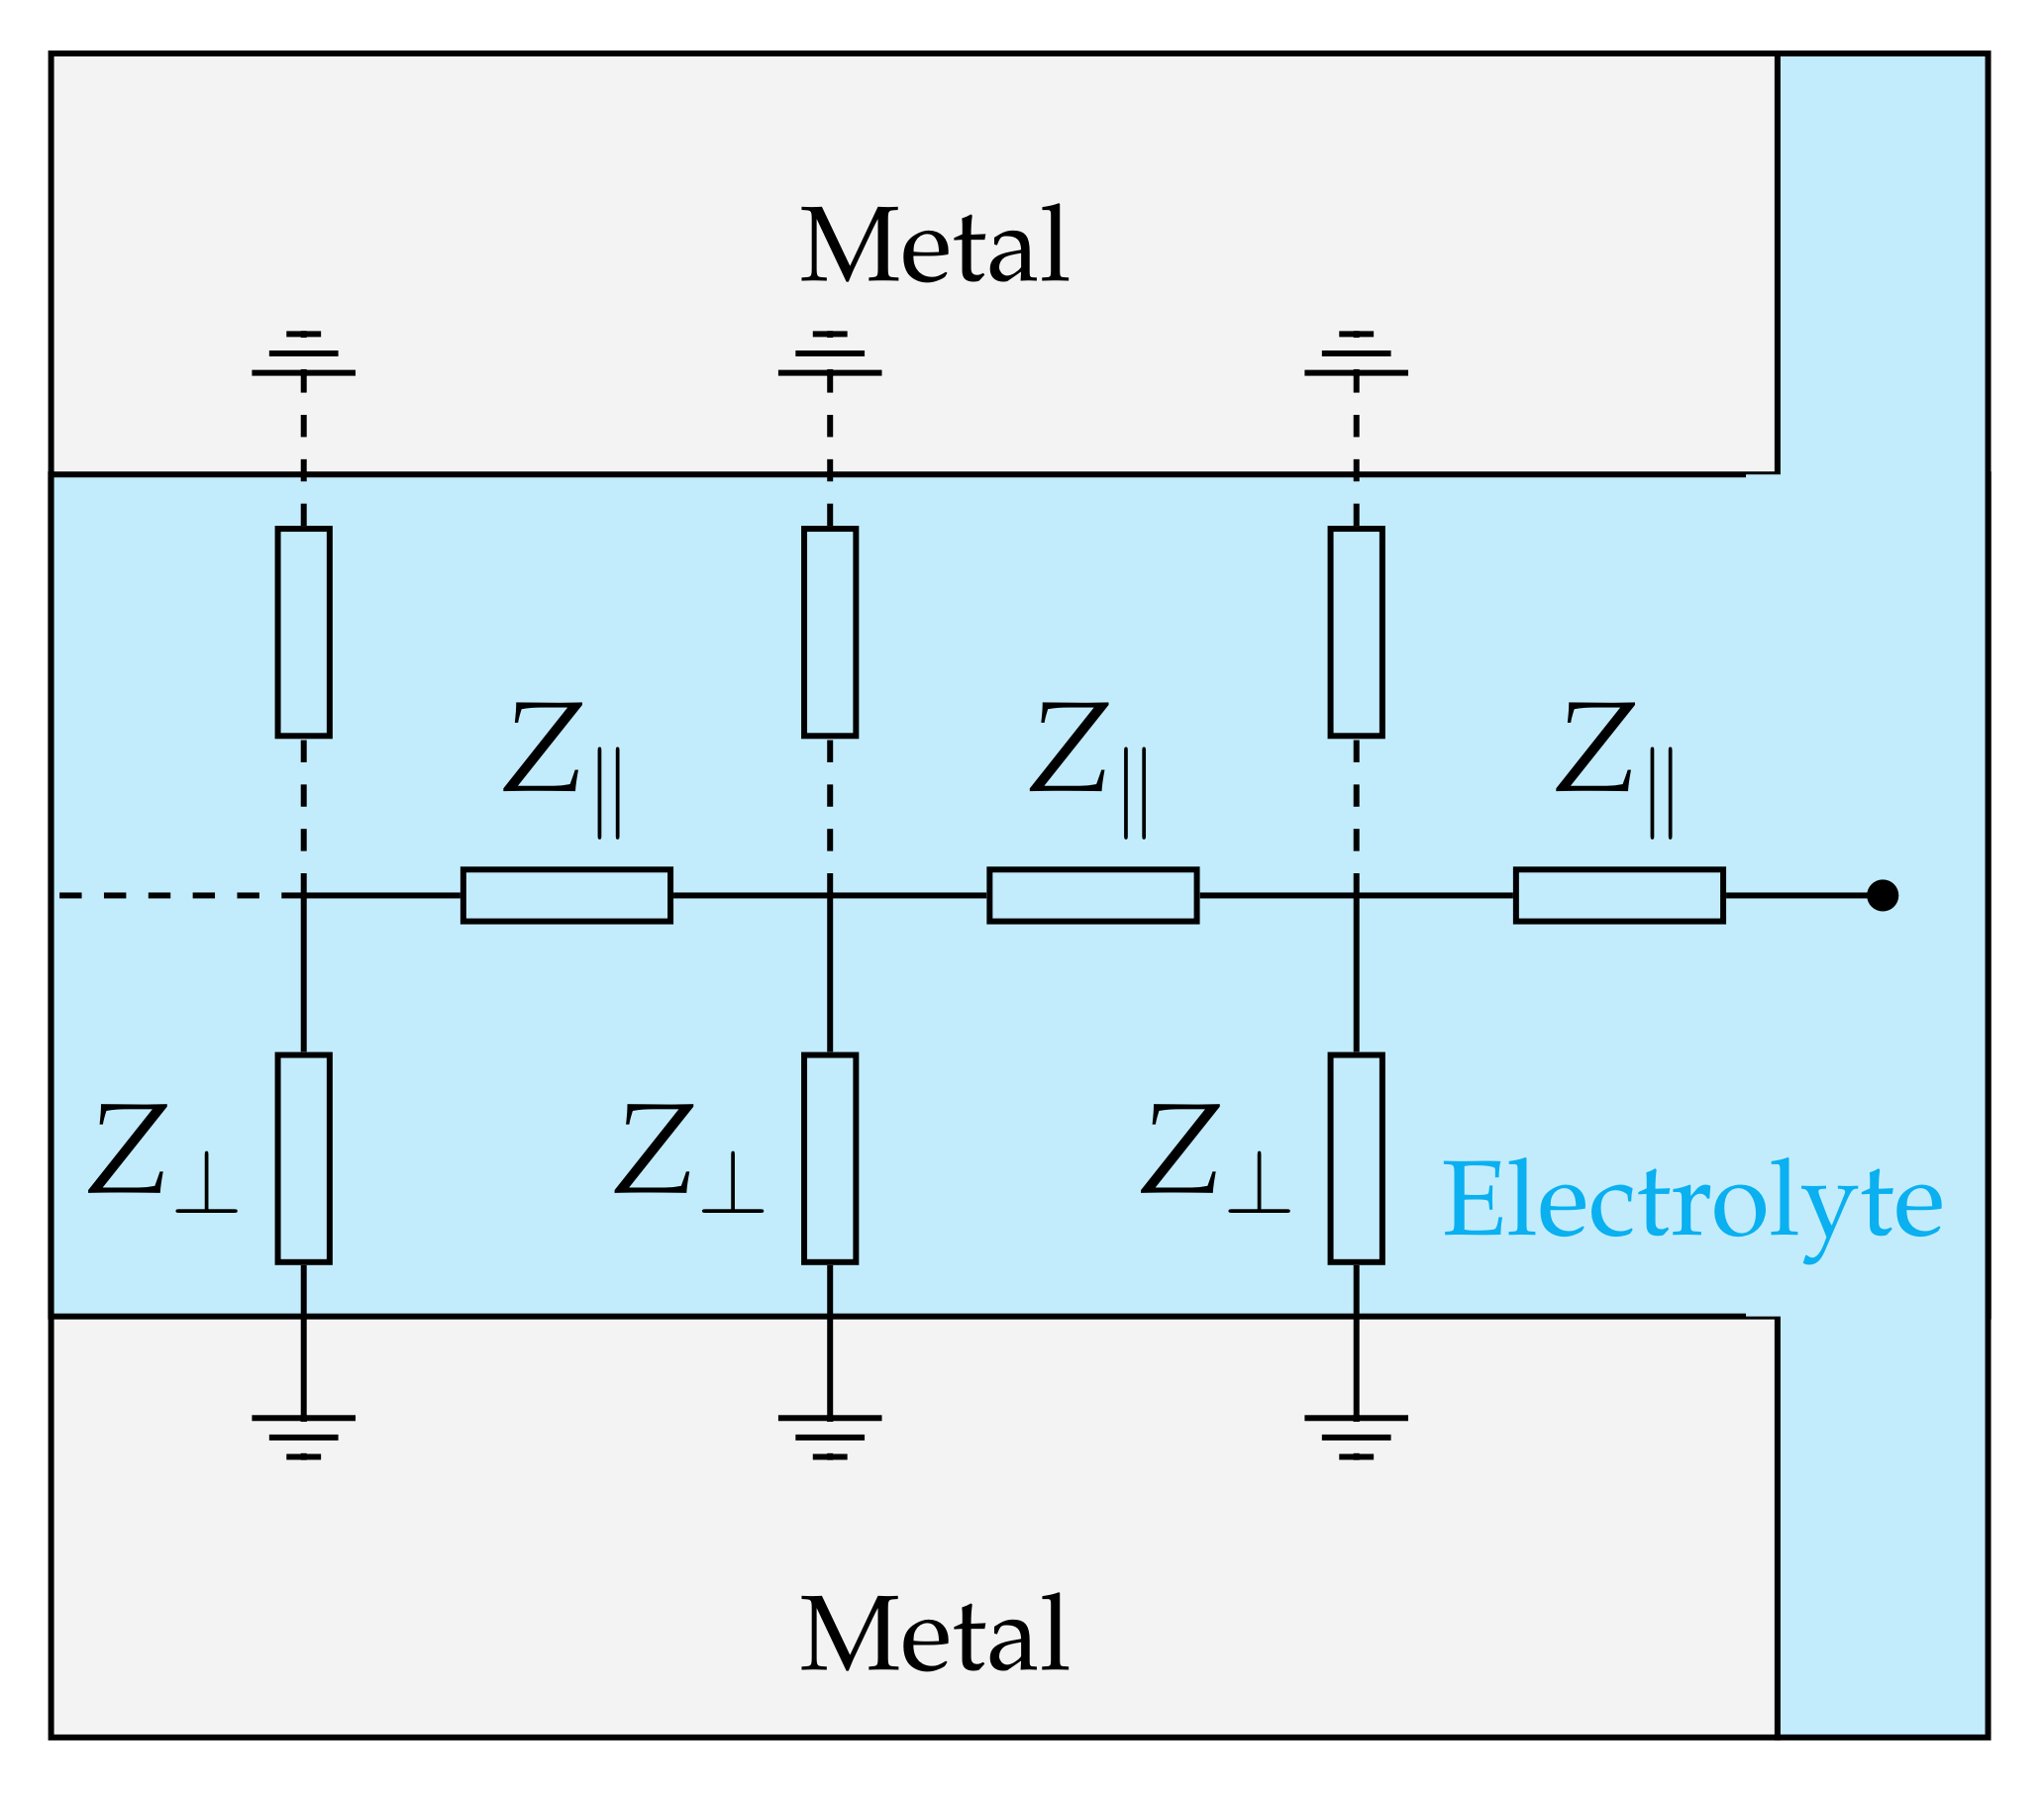
3.2. Admittance Study

The obtained admittance spectra and their CNLS approximations are presented in Figure 6. As can be concluded from these data, all spectra are arc-shaped (not semicircle) indicating that the surface of the electrodes is porous and developed [4,71,78] (compare with Figure 3). Moreover, these spectra can be perfectly fitted by the equivalent scheme (Figure 2) that contains only one R-CPE branch. Thus, the surface morphology of the electrodes for the most part should not reveal areas with significantly different types of irregularities (e.g., areas with nanopores separated by areas with micropores), which is also confirmed by SEM in Figure 3. Analyzing the data presented in Table 2, we can observe that the exponents α for Cu-based electrodes are lower than 1/2. At first glance, this observation seems disturbing, since typical capacitance dispersion exponent lies in the range of 1 / 2 α 1 [79,80,81,82]. In addition, the value α = 1 / 2 is the limiting value in the case of the infinite pore with pure capacitance surface/electrolyte impedance [78]. Therefore, for the α value lower than one half, we must assume that surface/electrolyte impedance of the pores in the electrodes should a priori demonstrate capacitance dispersion effect confirming high porosity of Cu-based electrodes. The more detailed explanation of this observation is presented in Appendix A. We also observed that α -values for Cu–Ru electrodes are usually higher than α -value for Cu electrode. This may be due to the clogging of the pores of the copper layer caused by ruthenium deposition during the second stage of synthesis of the Cu–Ru electrode (see Section 2.1). This process decreases the copper pore size leading to a decrease in the effective surface area (see Section 3.1) and an increase in the α -value as a result of deviation from the infinite pore limiting case (see Appendix A).
Interestingly enough, the Ru-based electrode obtained in our previous work [64] had large pores with small zigzag nanopores and “plane” regions containing zigzag nano-sized irregularities. The existence of these two types of pores resulted in the appearance of two arcs in the admittance spectra. In opposite, the Cu–Ru electrode described in this work has no “plane” regions and, hence, its admittance locus has only one arc. So it is clear that the use of copper reduces the equivalent circuit of Ru-based bioelectrodes simplifying the analysis of the bioimpedance data.

3.3. Biocompatibility and Cells Adhesion

The results of the biocompatibility studies of Cu-based electrodes are shown in Figure 7 (the green spots in a pseudo-color photograph indicate alive cells after incubation for 24 h). The Cu electrode has much lower biocompatibility compared to the Cu–Ru electrode, and only 30 ± 10% of the cells seeded on the Cu surface survived after one day of incubation. In turn, the surface of the Cu–Ru electrode reveals 91 ± 4% of alive cells. The higher biocompatibility of Cu–Ru electrodes can be explained by the presence of biocompatible ruthenium [65] islands on the surface of Cu–Ru electrode (see Figure 3b,c and Figure 4b). The high reproducibility of biocompatible properties of the copper–ruthenium material was confirmed by a low value of the relative error.
The quality of the cell adhesion on the surface of Cu-based electrodes is presented in cut-view tomographic images (Figure 8). These pictures contain the top-view (located between red (x axis) and blue lines (y axis)) and the cross-section views of the HeLa cells [located between green (z axis) and blue (y axis) lines as well as between red and green lines]. The ends of cutting lines, across which the images in cross-section were depicted, are marked by white triangles. All images are presented in pseudocolor: the green channel corresponds to membrane visualization using Deep Red Cell Mask dye and the blue channel corresponds to nuclei visualization using DAPI dye. The natural cell adhesion on glass is presented for comparison in Figure 8a.
The obtained data show that the cell adhesion on the surface of Cu-based electrodes is ideal: (1) all cells have a natural fusiform shape; (2) all cells duplicate the shape of the electrode surface in the z-direction; (3) all cells create healthy focal contacts. In addition, despite the fact that the height of the electrode surface can vary within a few micrometers, the cells can grow on top of the electrodes in a monolayer manner. Thus, the Cu-based electrodes synthesized in this work are very promising for in vitro cell investigation using ECIS [6] methodology as well as for neuronal cell studies [34].

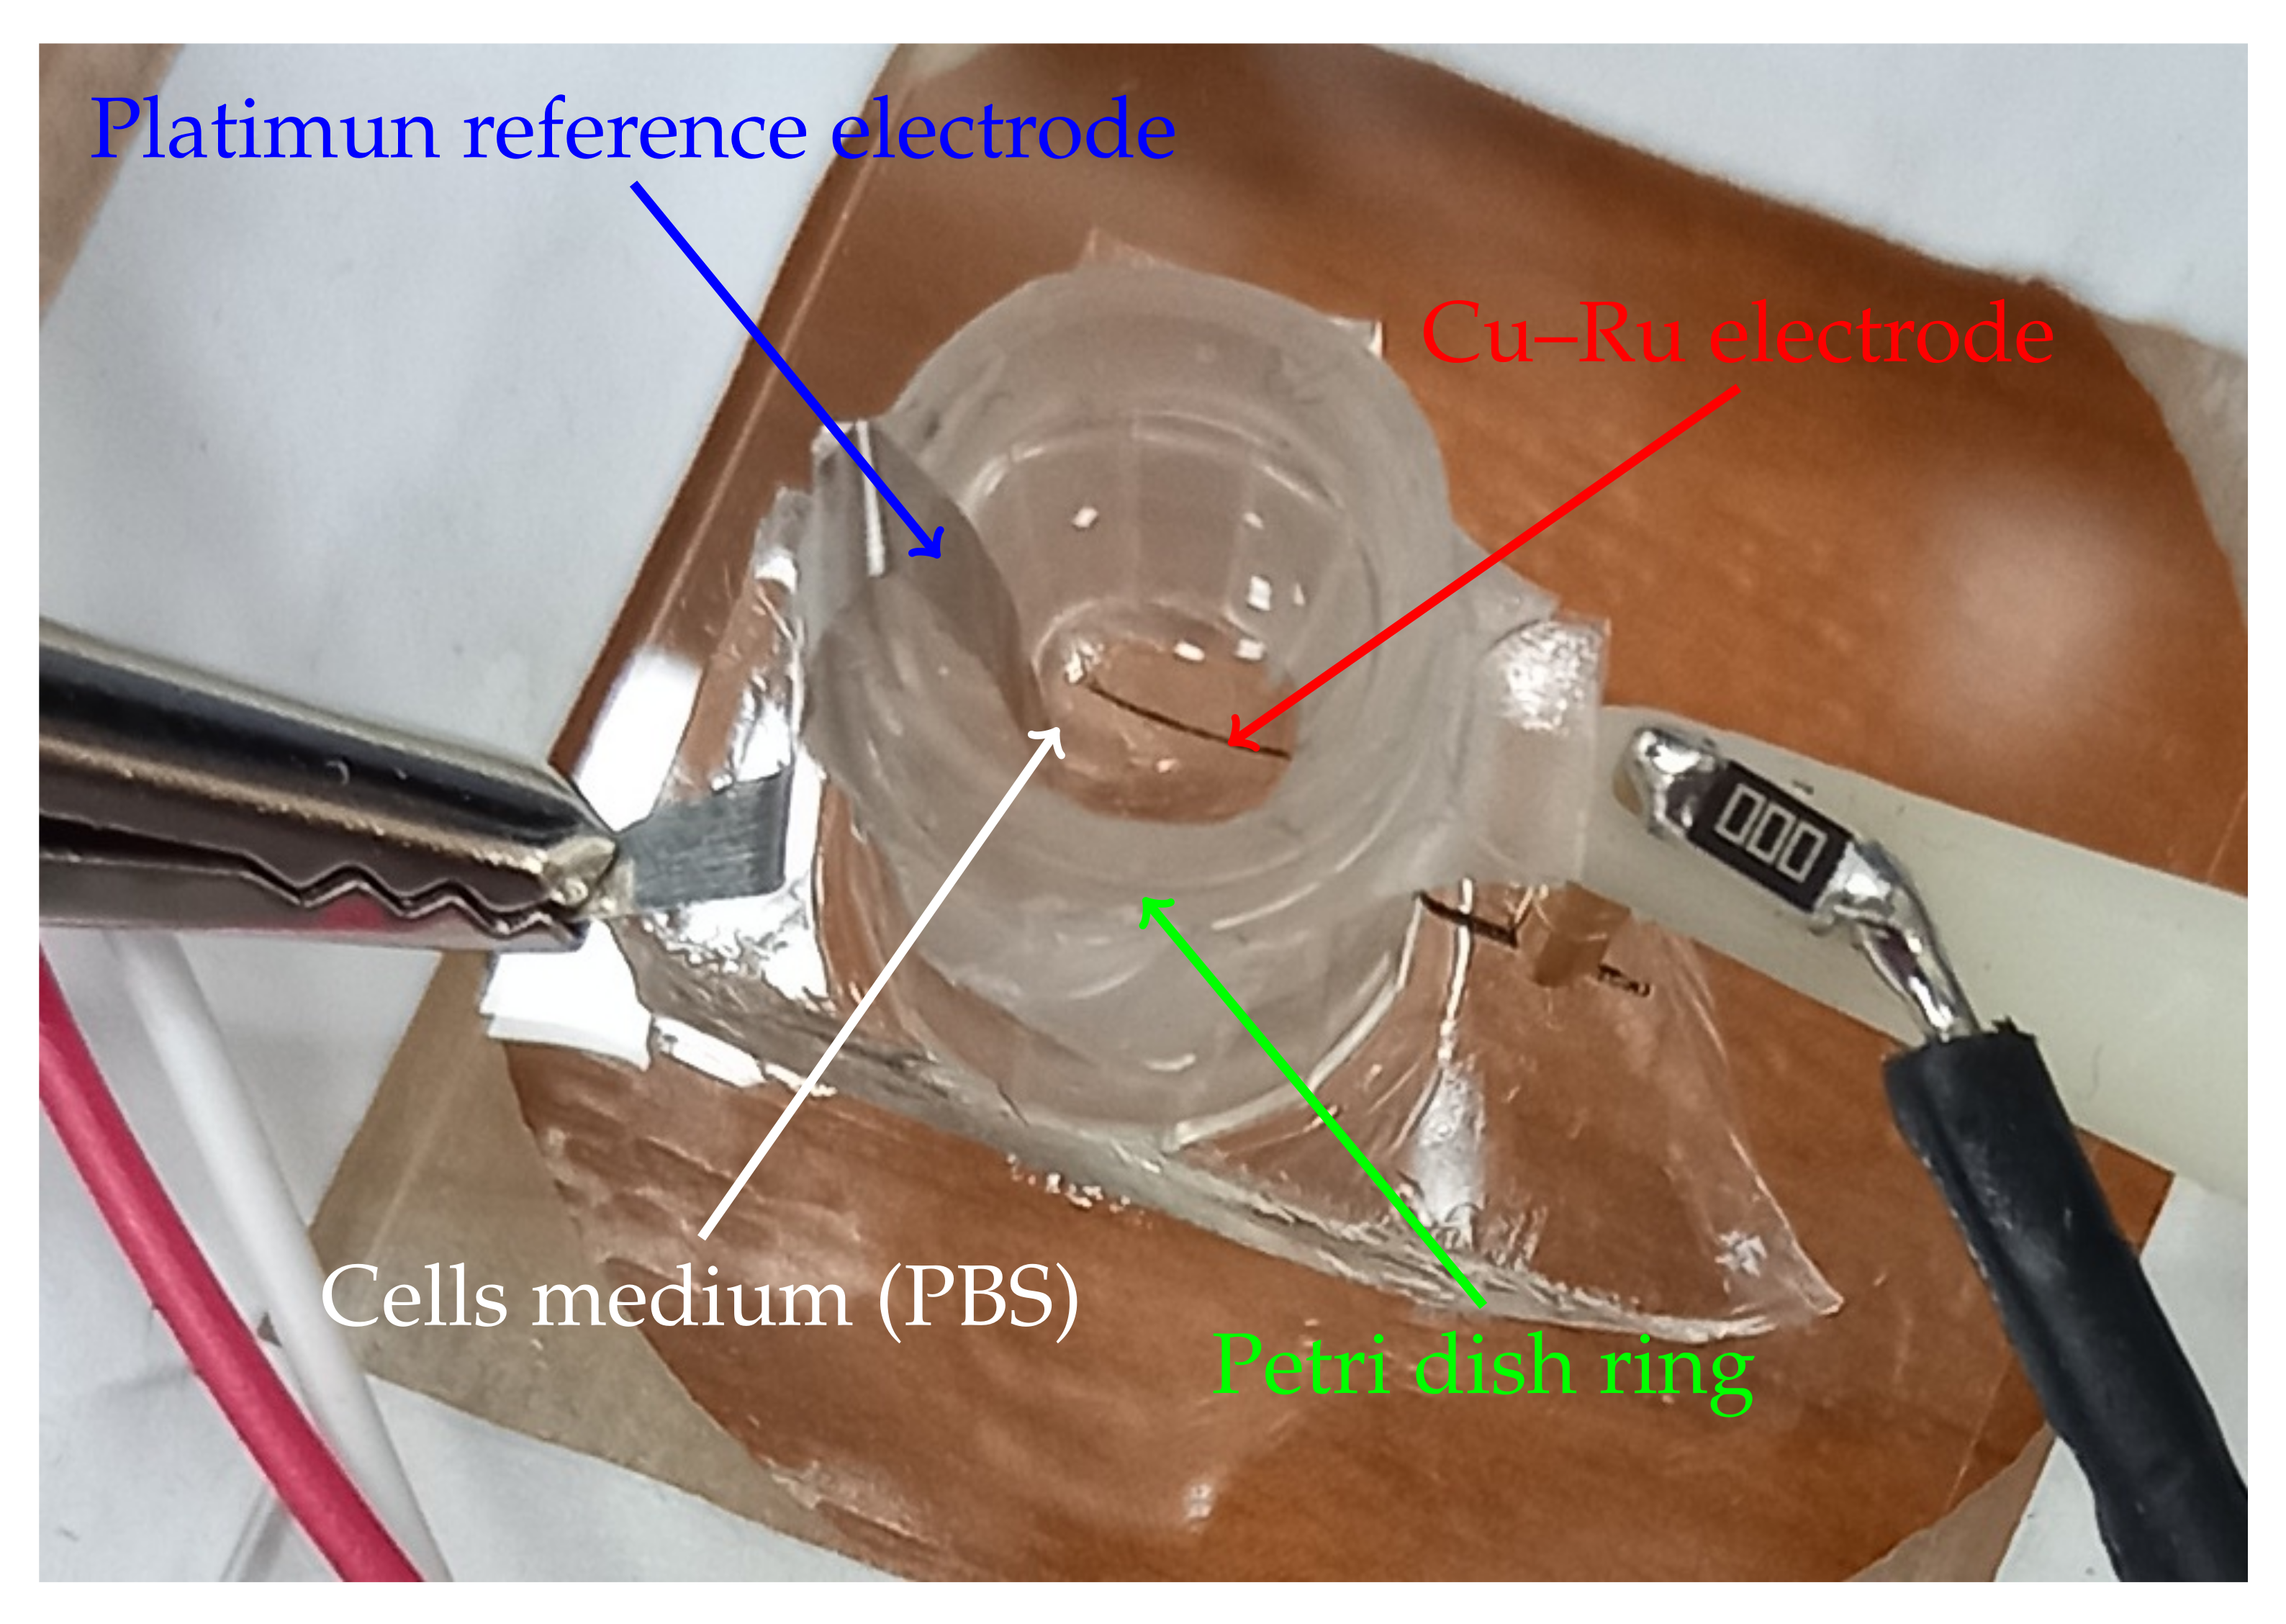
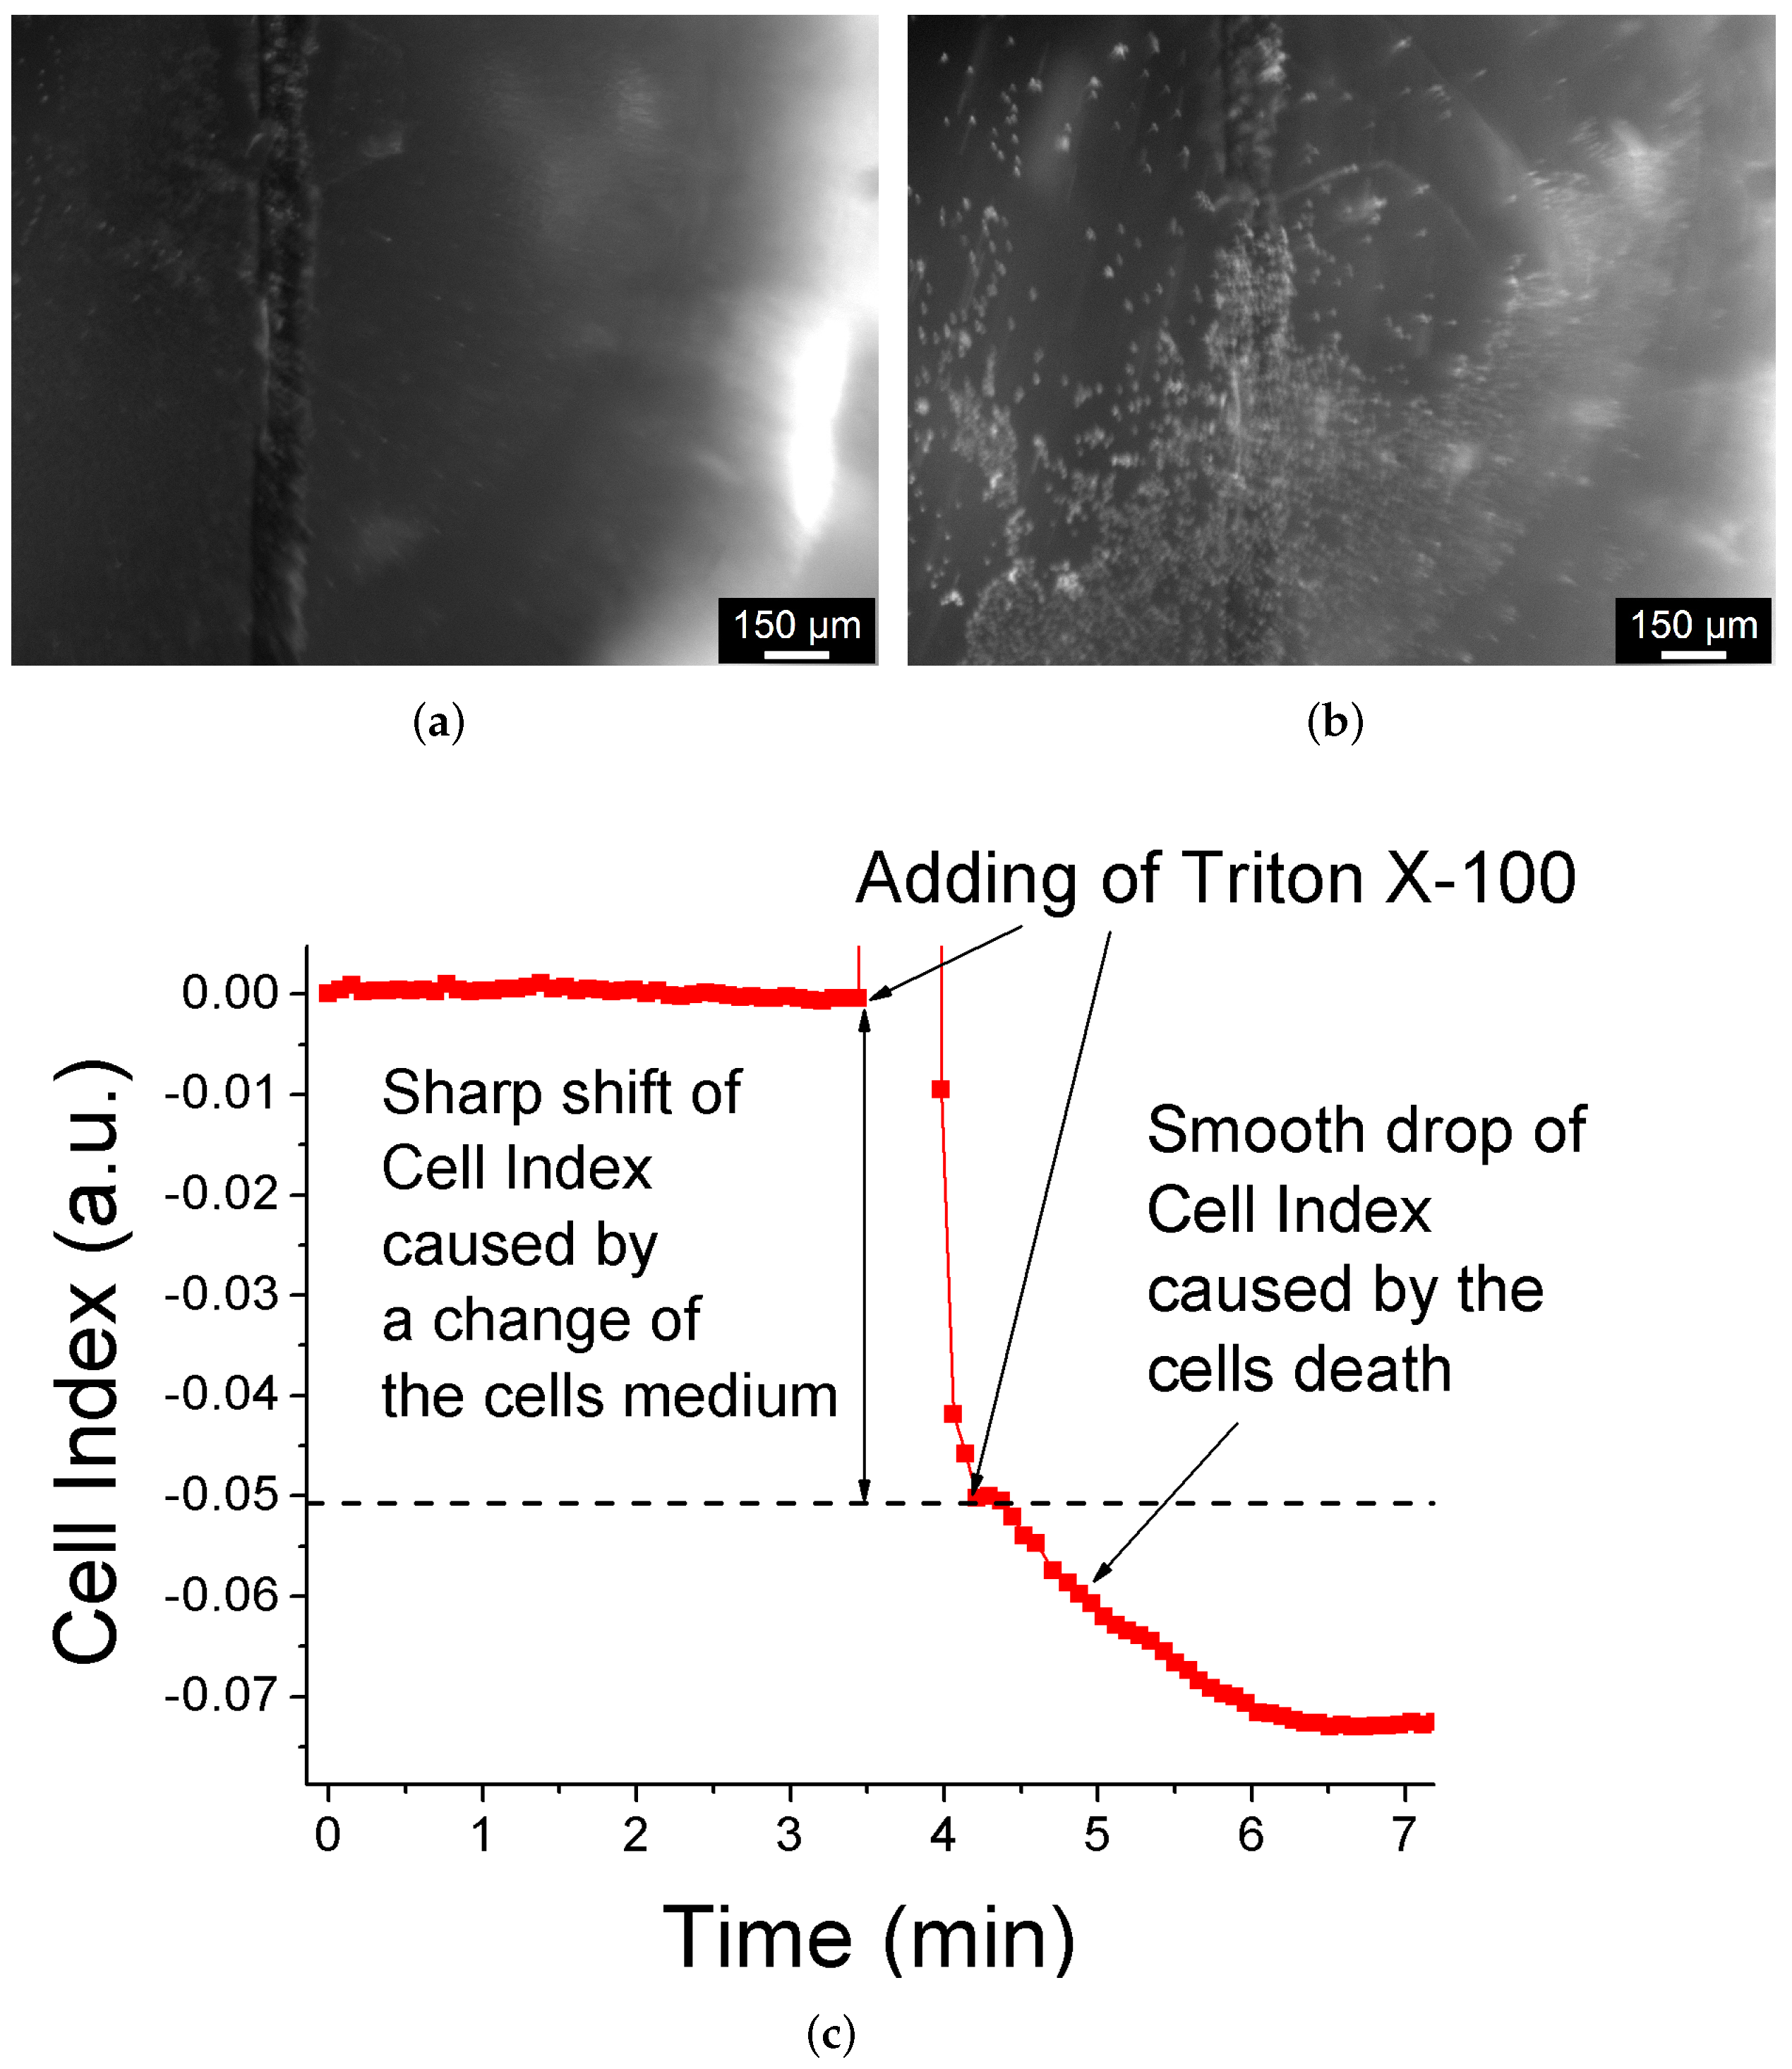
3.4. Biosensor as a Proof of Concept

For the design of an impedance-based biosensor (Figure 9), the Cu–Ru electrode with the best biocompatibility was chosen. Then, it was glued to a plastic Petri dish ring (1.1 cm in height and 8 mm in diameter) using PDMS (polydimietisiloxane). One day before the experiment, we seeded HeLa cells on top of the Cu–Ru electrode and incubated them in DMEM medium (Sigma Aldrich, St Louis, MO USA) with 5% fetal bovine serum and 0.1% gentamicin. Directly before the experiment, we changed the DMEM medium in the Petri dish with phosphate-buffered saline (PBS) containing propidium iodide dye (PI). A platinum plate was used as a reference electrode. Further, we have started impedance measurements of the Cu–Ru electrode with HeLa cells. After 3.5 min, the PI-PBS medium was replaced with PI-PBS solution containing an excess of the Triton X-100 detergent (1:1000 v/v). The impedance was measured as cell index at the frequency of 35 kHz
Cell   Index = Z ( t ) Z ( 0 ) Z ( 0 ) ,
where Z ( 0 ) is impedance magnitude of Cu–Ru electrode at the beginning of the experiment, and Z ( t ) is impedance magnitude of Cu–Ru electrode at time t. The impedance was measured using adaptive-filtering impedance spectroscopy [73].
The results of biosensing application of Cu–Ru electrode are presented in Figure 10. One can see that before Triton X-100 addition the cells were alive (Figure 10a) and their cell index (Equation (3)) was stable in time for 3.5 min (Figure 10c). On the other hand, after Triton X-100 addition, the cells became dead (Figure 10b), and their cell index started rapidly decreasing. This behavior can be explained by damage to the cells membrane caused by Triton X-100 detergent leading to an increase in the current flow through cells-substrate [4,5,14]. Thus, the obtained results confirm the efficiency of Cu–Ru electrodes with respect to biosensing applications.

4. Conclusions

Herein we reported our investigations that aim to search for inexpensive biocompatible electrode materials with properties optimal for biosensing applications. We obtained two types of electrodes (Cu and Cu–Ru) and studied their structure, biocompatibility, adhesion, and impedance properties. The Cu–Ru composite was fabricated using laser modification of the presynthesized copper structures by ruthenium. It was shown that such a modification significantly increases the biocompatibility and adhesion ability of pure Cu. Indeed, the majority of the HeLa cells seeded on the surface of the Cu–Ru electrode survived in contrast to the Cu electrode. The high biocompatibility can be attributed to the presence of biocompatible ruthenium islands distributed along the surface of the copper layer. In addition, the electrical properties of the fabricated Cu-based electrodes are found to be very promising for cell-based biosensor devices. As a proof-of-concept application, we proposed a simple impedance-based biosensor that allows us to distinguish between dead and alive HeLa cells. Future improvement of the proposed Cu–Ru biosensor can be achieved through the use of lithographic post-processing of the LCLD materials for the creation of an array of cell-sized electrodes. This multielectrode geometry will allow studying the individual cells. It will also pave the way for the development of platforms for the investigation of neurons and other excitable cells, such as photoreceptors. In addition, the combination of the proposed Cu–Ru sensors with microfluidic technologies can be used to study the cells with poor adhesion, such as erythrocytes or K562.
Finally, the overall results of this work expand the scope of the application of biocompatible materials with untypical electrochemical properties.

Author Contributions

Conceptualization, D.D.S., M.S.P. and M.N.R.; methodology, D.D.S. and M.S.P.; validation, D.D.S., M.S.P. and M.N.R.; investigation, D.D.S., A.A.A., A.S.M. and M.S.P.; data curation D.D.S., A.A.A., A.S.M. and M.S.P.; writing—original draft preparation, D.D.S.; writing—review and editing, M.S.P. and M.N.R.; project administration, M.S.P. and M.N.R.; funding acquisition, M.N.R. All authors have read and agreed to the published version of the manuscript.

Funding

This study was supported by the Russian Science Foundation (project No 20-13-00303).

Institutional Review Board Statement

Not applicable.

Informed Consent Statement

Not applicable.

Data Availability Statement

Not applicable.

Acknowledgments

Authors are thankful to N. A. Knyazev, K. P. Kotlyar, N. A. Boitsova, M. I. Blinova, and M. V. Dubina for multifaceted assistance and support. The authors also express their gratitude to the Research park of St. Petersburg State University “Center for Molecular and Cell Technologies”, “Center for Optical and Laser Research”, “Center for Magnetic Resonance”, “Center for Chemical Analysis and Materials Research”.

Conflicts of Interest

The authors declare no conflict of interest.

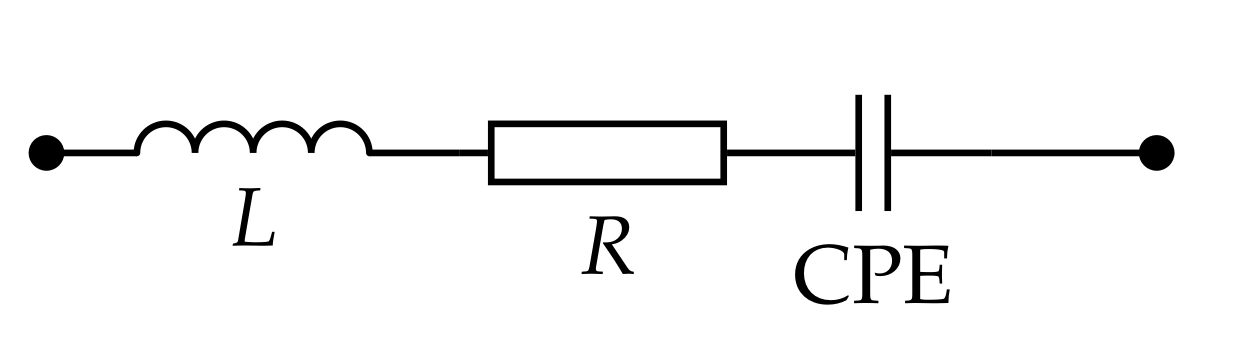
Appendix A. On the Origin of the CPE Exponent below 1/2

As it was mentioned in the section “Results”, for an α value lower than one-half, it is necessary to assume that the surface/electrolyte impedance of the pores in the electrodes should a priori demonstrate capacitance dispersion effect. Indeed, if we calculate the impedance Z P of the infinite pore in the Levie’s transmission-line approximation approach (Figure A1) using Feynman trick [83], for | Z | | Z | , we should get the classical Levie’s result:
Z P = Z Z .
In ref. [78] Levie calculated the pore impedance using assumption that the flat metal/electrolyte interface has double-layer pure capacitive impedance Z = 1 / ( i ω C ) and the plausible assumption that the pore cross-sectional impedance is purely resistive, i.e., Z = R , which leads to well-known result:
Z P = R C × 1 ( i ω ) 1 / 2 ,
where C is the double layer capacitance (per unit length) and R is the resistance of the pore cross-section.
According to Equation (A2), the CPE exponent is equal to one-half in the limiting case of an infinite pore with pure capacitance surface/electrolyte impedance. However, at the same time, if the metal/electrolyte interface Z a priori has pseudocapacitance behavior with α < 1 , then, according to Levie’s works [78,84], it is possible to have CPE with a value of α below 1/2 at the electrode/electrolyte interface. Indeed, if Z = 1 / [ W ( i ω ) β ] , then, from Equation (A1), we obtain:
Z P = R W × 1 ( i ω ) α ,
where α = β / 2 1 / 2 . Therefore, the phenomenon of the dispersion of capacitance with a CPE exponent lower than one-half has a clear physical meaning. Such an effect can be observed either if the electrode surface contains pores consisting of smaller pores [85,86], or if it contains pores in which electrochemical reactions and diffusion processes occur. The latter explains the presence of a Warburg-type impedance [4] at the metal/electrolyte interface [84,87]. For our samples, the first assumption seems to be the most probable, since according to Figure 3, Cu and Cu–Ru electrodes have uniformly distributed pores containing smaller irregularities. Moreover, since the α values are near 1/4, in accordance to the Itagaki [86] interpretation, we can conclude that these electrodes have only a two-level hierarchy, i.e., they only consist of pores with smaller pores, and these smaller pores have a non-developed surface. Thus, the proposed LCLD electrodes are promising not only for biosensing, but also for creation of factor devices [88,89,90,91].
Figure A1. Equivalent scheme of an infinite pore according to Levie’s theory. The direction of the pore deepening is shown from right to left. Here, Z is the impedance of the metal/electrolyte interface, and Z is the impedance of the pore cross-section.
Biosensors 12 00527 g0a1

Appendix B. Estimation of the Effective Surface Area

In this section, we derived the formula for the estimation of the effective electrode area. It was assumed that each pore, numbered by index j, has a semi-spherical shape with a diameter of d j . Further, the surface area of the planar electrode was designated as S e l = H × W (here W is the width of the electrode and H is its length), whereas the number of the pores locates on S e l was assigned as N. As a result, in order to estimate the electrode effective area, the value of S w p (the area of pores) should be subtracted from the electrode area S e l , and then the result of subtraction should be added to the total area of the semi-spherical pores S p . Obviously,
S w p = π 4 j = 1 N d j 2 ,
i.e., it is a sum of the areas of the circles with diameter d j , and
S p = 2 π 4 j = 1 N d j 2 ,
i.e., it is a sum of the areas of the semi-spheres with diameter d j . Thus, the effective surface area is equal to:
S e f f = S e l S w p + S p = S e l 1 + π 4 D d j 2 ,
where D is number of the pores per unit area (density of pores) and d j 2 is mean-square value of the pore size. Finally, the expression in parentheses in the last right-hand side of the Equation (A6) represents the coefficient of increase of the effective surface area.

References

  1. Grimnes, S.; Martinsen, O.G. Bioimpedance and Bioelectricity Basics; Academic Press: Cambridge, MA, USA, 2011. [Google Scholar]
  2. Liu, Q.; Wang, P. Cell-Based Biosensors: Principles and Applications; Artech House: Norwood, MA, USA, 2009. [Google Scholar]
  3. Liu, Q.; Wu, C.; Cai, H.; Hu, N.; Zhou, J.; Wang, P. Cell-based biosensors and their application in biomedicine. Chem. Rev. 2014, 114, 6423–6461. [Google Scholar]
  4. Stupin, D.D.; Kuzina, E.A.; Abelit, A.A.; Emelyanov, A.K.; Nikolaev, D.M.; Ryazantsev, M.N.; Koniakhin, S.V.; Dubina, M.V. Bioimpedance Spectroscopy: Basics and Applications. ACS Biomater. Sci. Eng. 2021, 7, 1962–1986. [Google Scholar] [CrossRef] [PubMed]
  5. Wegener, J.; Keese, C.R.; Giaever, I. Electric cell–substrate impedance sensing (ECIS) as a noninvasive means to monitor the kinetics of cell spreading to artificial surfaces. Exp. Cell Res. 2000, 259, 158–166. [Google Scholar] [CrossRef] [PubMed] [Green Version]
  6. Giaever, I.; Keese, C.R. Electric Cell-Substrate Impedance Sensing and Cancer Metastasis, 1st ed.; Cancer Metastasis—Biology and Treatment, 17; Jiang, W.G., Ed.; Springer: Dordrecht, The Netherlands, 2012. [Google Scholar]
  7. Tlili, C.; Reybier, K.; Géloën, A.; Ponsonnet, L.; Martelet, C.; Ouada, H.B.; Lagarde, M.; Jaffrezic-Renault, N. Fibroblast cells: A sensing bioelement for glucose detection by impedance spectroscopy. Anal. Chem. 2003, 75, 3340–3344. [Google Scholar] [CrossRef] [PubMed]
  8. Gao, F.; Song, J.; Zhang, B.; Tanaka, H.; Gao, F.; Qiu, W.; Wang, Q. Synthesis of core-shell structured AU@Bi2S3 nanorod and its application as DNA immobilization matrix for electrochemical biosensor construction. Chin. Chem. Lett. 2020, 31, 181–184. [Google Scholar] [CrossRef]
  9. Banerjee, P.; Bhunia, A.K. Mammalian cell-based biosensors for pathogens and toxins. Trends Biotechnol. 2009, 27, 179–188. [Google Scholar] [CrossRef]
  10. Nikolaev, D.M.; Panov, M.S.; Shtyrov, A.A.; Boitsov, V.M.; Vyazmin, S.Y.; Chakchir, O.B.; Yakovlev, I.P.; Ryazantsev, M.N. Perspective tools for optogenetics and photopharmacology: From design to implementation. In Progress in Photon Science; Springer: Berlin/Heidelberg, Germany, 2019; pp. 139–172. [Google Scholar]
  11. Neal, C.J.; Fox, C.R.; Sakthivel, T.S.; Kumar, U.; Fu, Y.; Drake, C.; Parks, G.D.; Seal, S. Metal-Mediated Nanoscale Cerium Oxide Inactivates Human Coronavirus and Rhinovirus by Surface Disruption. ACS Nano 2021, 15, 14544–14556. [Google Scholar] [CrossRef]
  12. Soares, A.C.; Soares, J.C.; Shimizu, F.M.; Melendez, M.E.; Carvalho, A.L.; Oliveira, O.N., Jr. Controlled film architectures to detect a biomarker for pancreatic cancer using impedance spectroscopy. ACS Appl. Mater. Interfaces 2015, 7, 25930–25937. [Google Scholar] [CrossRef]
  13. Shah, P.; Zhu, X.; Zhang, X.; He, J.; Li, C.Z. Microelectromechanical system-based sensing arrays for comparative in vitro nanotoxicity assessment at single cell and small cell-population using electrochemical impedance spectroscopy. ACS Appl. Mater. Interfaces 2016, 8, 5804–5812. [Google Scholar] [CrossRef]
  14. Stupin, D. A single-cell electronic sensor of toxins. J. Phys. Conf. Ser. 2017, 917, 042006. [Google Scholar] [CrossRef] [Green Version]
  15. Stingl, K.; Schippert, R.; Bartz-Schmidt, K.U.; Besch, D.; Cottriall, C.L.; Edwards, T.L.; Gekeler, F.; Greppmaier, U.; Kiel, K.; Koitschev, A.; et al. Interim results of a multicenter trial with the new electronic subretinal implant alpha AMS in 15 patients blind from inherited retinal degenerations. Front. Neurosci. 2017, 11, 445. [Google Scholar] [CrossRef] [Green Version]
  16. Ryazantsev, M.N.; Strashkov, D.M.; Nikolaev, D.M.; Shtyrov, A.A.; Panov, M.S. Photopharmacological compounds based on azobenzenes and azoheteroarenes: Principles of molecular design, molecular modelling, and synthesis. Russ. Chem. Rev. 2021, 90, 868. [Google Scholar] [CrossRef]
  17. Ayton, L.N.; Blamey, P.J.; Guymer, R.H.; Luu, C.D.; Nayagam, D.A.; Sinclair, N.C.; Shivdasani, M.N.; Yeoh, J.; McCombe, M.F.; Briggs, R.J.; et al. First-in-human trial of a novel suprachoroidal retinal prosthesis. PLoS ONE 2014, 9, e115239. [Google Scholar] [CrossRef] [Green Version]
  18. Fujikado, T.; Kamei, M.; Sakaguchi, H.; Kanda, H.; Morimoto, T.; Ikuno, Y.; Nishida, K.; Kishima, H.; Maruo, T.; Sawai, H.; et al. Clinical trial of chronic implantation of suprachoroidal-transretinal stimulation system for retinal prosthesis. Sens. Mater. 2012, 24, 181–187. [Google Scholar]
  19. Mathieson, K.; Loudin, J.; Goetz, G.; Huie, P.; Wang, L.; Kamins, T.I.; Galambos, L.; Smith, R.; Harris, J.S.; Sher, A.; et al. Photovoltaic retinal prosthesis with high pixel density. Nat. Photonics 2012, 6, 391–397. [Google Scholar] [CrossRef] [PubMed]
  20. Chow, A.Y.; Chow, V.Y.; Packo, K.H.; Pollack, J.S.; Peyman, G.A.; Schuchard, R. The artificial silicon retina microchip for the treatment of visionloss from retinitis pigmentosa. Arch. Ophthalmol. 2004, 122, 460–469. [Google Scholar] [CrossRef] [PubMed] [Green Version]
  21. Weiland, J.D.; Cho, A.K.; Humayun, M.S. Retinal prostheses: Current clinical results and future needs. Ophthalmology 2011, 118, 2227–2237. [Google Scholar] [CrossRef]
  22. Humayun, M.S.; de Juan, E., Jr.; Dagnelie, G. The bionic eye: A quarter century of retinal prosthesis research and development. Ophthalmology 2016, 123, S89–S97. [Google Scholar] [CrossRef]
  23. Hornig, R.; Zehnder, T.; Velikay-Parel, M.; Laube, T.; Feucht, M.; Richard, G. The IMI retinal implant system. In Artificial Sight; Springer: Berlin/Heidelberg, Germany, 2007; pp. 111–128. [Google Scholar]
  24. Kral, A.; Dorman, M.F.; Wilson, B.S. Neuronal development of hearing and language: Cochlear implants and critical periods. Annu. Rev. Neurosci. 2019, 42, 47–65. [Google Scholar] [CrossRef]
  25. Neroev, V.; Astakhov, Y.; Lobanova, M.; Stupin, D. Artificial Vision: Progress, Problems, Perspective. Russ. Ophthalmol. J. 2018, 11, 3–27. (In Russian) [Google Scholar]
  26. Das, A.; Dobbidi, P. Impedance Spectroscopy and ac Conductivity in Ba0.5Sr0.5TiO3–Ca10 (PO4)6(OH)2 Ceramic Composites: An Electrical Approach to Unveil Biocomposites. ACS Biomater. Sci. Eng. 2021, 7, 2296–2308. [Google Scholar] [CrossRef]
  27. Khare, D.; Basu, B.; Dubey, A.K. Electrically stimulated piezoelectric biomaterials as next generation implants for orthopedic applications. Biomaterials 2020, 258, 120280. [Google Scholar] [CrossRef] [PubMed]
  28. McLaughlin, N.; Griffiths, C.; Campbell, R.; Murray, A. Review of Seven cardiac Electrophysiology stimulators. Physiol. Meas. 1993, 14, 57. [Google Scholar] [CrossRef] [PubMed]
  29. Gala, M.; Vajdikova, I.; Babusiak, B.; Penhaker, M.; Cerny, M.; Augustynek, M. Battery check test on pacemaker by advanced technique. In Proceedings of the 2014 IEEE 12th International Symposium on Applied Machine Intelligence and Informatics (SAMI), Herlany, Slovakia, 23–25 January 2014; pp. 45–48. [Google Scholar]
  30. Zou, Y.; Guo, Z. A review of electrical impedance techniques for breast cancer detection. Med. Eng. Phys. 2003, 25, 79–90. [Google Scholar] [CrossRef]
  31. Van Eijnatten, M.A.; Van Rijssel, M.J.; Peters, R.J.; Verdaasdonk, R.M.; Meijer, J.H. Comparison of cardiac time intervals between echocardiography and impedance cardiography at various heart rates. J. Electr. Bioimpedance 2019, 5, 2–8. [Google Scholar] [CrossRef] [Green Version]
  32. Brown, B.H. Medical impedance tomography and process impedance tomography: A brief review. Meas. Sci. Technol. 2001, 12, 991. [Google Scholar] [CrossRef]
  33. Mahdavi, R.; Yousefpour, N.; Abbasvandi, F.; Ataee, H.; Hoseinpour, P.; Akbari, M.E.; Parniani, M.; Delshad, B.; Avatefi, M.; Nourinejad, Z.; et al. Intraoperative pathologically-calibrated diagnosis of lymph nodes involved by breast cancer cells based on electrical impedance spectroscopy; a prospective diagnostic human model study. Int. J. Surg. 2021, 96, 106166. [Google Scholar] [CrossRef] [PubMed]
  34. Bisio, M.; Pimashkin, A.; Buccelli, S.; Tessadori, J.; Semprini, M.; Levi, T.; Colombi, I.; Gladkov, A.; Mukhina, I.; Averna, A.; et al. Closed-Loop Systems and In Vitro Neuronal Cultures: Overview and Applications. In Vitro Neuronal Netw. 2019, 22, 351–387. [Google Scholar]
  35. Bou, A.; Bisquert, J. Impedance spectroscopy dynamics of biological neural elements: From memristors to neurons and synapses. J. Phys. Chem. B 2021, 125, 9934–9949. [Google Scholar] [CrossRef]
  36. Matsumura, R.; Yamamoto, H.; Hayakawa, T.; Katsurabayashi, S.; Niwano, M.; Hirano-Iwata, A. Dependence and Homeostasis of Membrane Impedance on Cell Morphology in Cultured Hippocampal Neurons. Sci. Rep. 2018, 8, 9905. [Google Scholar] [CrossRef]
  37. Alferov, Z.I. Nobel Lecture: The double heterostructure concept and its applications in physics, electronics, and technology. Rev. Mod. Phys. 2001, 73, 767. [Google Scholar] [CrossRef] [Green Version]
  38. Kilby, J.S.C. Turning potential into realities: The invention of the integrated circuit (Nobel lecture). ChemPhysChem 2001, 2, 482–489. [Google Scholar] [CrossRef]
  39. Kroemer, H. Nobel Lecture: Quasielectric fields and band offsets: Teaching electrons new tricks. Rev. Mod. Phys. 2001, 73, 783. [Google Scholar] [CrossRef]
  40. Moreau, W.M. Semiconductor Lithography: Principles, Practices, and Materials, 1st ed.; Microdevices; Springer: Berlin/Heidelberg, Germany, 1988. [Google Scholar]
  41. Hodgkin, D.C. The X-ray Analysis of Complicated Molecules, Nobel Lecture, December 11, 1964. In Nobel Lectures, Chemistry 1963–1970; World Scientific: Singapore, 1972; Volume 71, p. 91. [Google Scholar]
  42. Huxley, A. The quantitative analysis of excitation and conduction in nerve. Les Prix Nobel 1963, 1963, 242–260. [Google Scholar] [CrossRef]
  43. Masters, J.R. HeLa cells 50 years on: The good, the bad and the ugly. Nat. Rev. Cancer 2002, 2, 315. [Google Scholar] [CrossRef] [PubMed]
  44. Dahodwala, H.; Lee, K.H. The fickle CHO: A review of the causes, implications, and potential alleviation of the CHO cell line instability problem. Curr. Opin. Biotechnol. 2019, 60, 128–137. [Google Scholar] [CrossRef]
  45. Kelly, A.; Farid, N.; Krukiewicz, K.; Belisle, N.; Groarke, J.; Waters, E.M.; Trotier, A.; Laffir, F.; Kilcoyne, M.; O’Connor, G.M.; et al. Laser-Induced Periodic Surface Structure Enhances Neuroelectrode Charge Transfer Capabilities and Modulates Astrocyte Function. ACS Biomater. Sci. Eng. 2020, 6, 1449–1461. [Google Scholar] [CrossRef]
  46. Nycz, M.; Arkusz, K.; Pijanowska, D.G. Electrodes Based on a Titanium Dioxide Nanotube–Spherical Silver Nanoparticle Composite for Sensing of Proteins. ACS Biomater. Sci. Eng. 2020, 7, 105–113. [Google Scholar] [CrossRef]
  47. Kundu, A.; McCoy, L.; Azim, N.; Nguyen, H.; Didier, C.M.; Ausaf, T.; Sharma, A.D.; Curley, J.L.; Moore, M.J.; Rajaraman, S. Fabrication and Characterization of 3D Printed, 3D Microelectrode Arrays for Interfacing with a Peripheral Nerve-on-a-Chip. ACS Biomater. Sci. Eng. 2020, 7, 3018–3029. [Google Scholar] [CrossRef]
  48. Luque, G.L.; Rodríguez, M.C.; Rivas, G.A. Glucose biosensors based on the immobilization of copper oxide and glucose oxidase within a carbon paste matrix. Talanta 2005, 66, 467–471. [Google Scholar] [CrossRef]
  49. Rodriguez, M.; Rivas, G. Amperometric glucose biosensor based on the deposition of copper and glucose oxidase onto glassy carbon transducer. Anal. Lett. 2000, 33, 2373–2389. [Google Scholar] [CrossRef]
  50. Bodade, A.; Taiwade, M.; Chaudhari, G. Bioelectrode based chitosan-nano copper oxide for application to lipase biosensor. J. Appl. Pharm. Res. 2017, 5, 30–39. [Google Scholar]
  51. Rodriguez, M.; Rivas, G. Highly selective first generation glucose biosensor based on carbon paste containing copper and glucose oxidase. Electroanal. Int. J. Devoted Fundam. Pract. Asp. Electroanal. 2001, 13, 1179–1184. [Google Scholar] [CrossRef]
  52. Zhou, W.; Song, R.; Pan, X.; Peng, Y.; Qi, X.; Peng, J.; Hui, K.; Hui, K. Fabrication and impedance measurement of novel metal dry bioelectrode. Sens. Actuators A Phys. 2013, 201, 127–133. [Google Scholar] [CrossRef]
  53. Zhou, W.; Ling, W.s.; Liu, W.; Peng, Y.; Peng, J. Laser direct micromilling of copper-based bioelectrode with surface microstructure array. Opt. Lasers Eng. 2015, 73, 7–15. [Google Scholar] [CrossRef]
  54. Zhou, W.; Liu, W.; Liu, S.; Zhang, G.; Shen, Z. Experimental investigation on surface wettability of copper-based dry bioelectrodes. Sens. Actuators A Phys. 2016, 244, 237–242. [Google Scholar] [CrossRef]
  55. Charkhkar, H.; Frewin, C.; Nezafati, M.; Knaack, G.L.; Peixoto, N.; Saddow, S.E.; Pancrazio, J.J. Use of cortical neuronal networks for in vitro material biocompatibility testing. Biosens. Bioelectron. 2014, 53, 316–323. [Google Scholar] [CrossRef]
  56. Abe, S.; Iwadera, N.; Narushima, T.; Uchida, Y.; Uo, M.; Akasaka, T.; Yawaka, Y.; Watari, F.; Yonezawa, T. Comparison of biodistribution and biocompatibility of gelatin-coated copper nanoparticles and naked copper oxide nanoparticles. E-J. Surf. Sci. Nanotechnol. 2012, 10, 33–37. [Google Scholar] [CrossRef] [Green Version]
  57. Karlsson, H.L.; Gustafsson, J.; Cronholm, P.; Möller, L. Size-dependent toxicity of metal oxide particles—A comparison between nano-and micrometer size. Toxicol. Lett. 2009, 188, 112–118. [Google Scholar] [CrossRef]
  58. Kolawole, S.K.; Hai, W.; Zhang, S.; Sun, Z.; Siddiqui, M.A.; Ullah, I.; Song, W.; Witte, F.; Yang, K. Preliminary study of microstructure, mechanical properties and corrosion resistance of antibacterial Ti-15Zr-xCu alloy for dental application. J. Mater. Sci. Technol. 2020, 50, 31–43. [Google Scholar] [CrossRef]
  59. Jin, S.; Ren, L.; Yang, K. Bio-functional Cu containing biomaterials: A new way to enhance bio-adaption of biomaterials. J. Mater. Sci. Technol. 2016, 32, 835–839. [Google Scholar] [CrossRef]
  60. Ma, Z.; Li, M.; Liu, R.; Ren, L.; Zhang, Y.; Pan, H.; Zhao, Y.; Yang, K. In vitro study on an antibacterial Ti–5Cu alloy for medical application. J. Mater. Sci. Mater. Med. 2016, 27, 91. [Google Scholar] [CrossRef]
  61. Karthika, A. Biocompatible iron and copper incorporated nanohydroxyapatite coating for biomedical implant applications. Mater. Today Proc. 2021, 51, 1754–1759. [Google Scholar] [CrossRef]
  62. Bertuola, M.; Grillo, C.A.; Pissinis, D.E.; Prieto, E.D.; de Mele, M.F.L. Is the biocompatibility of copper with polymerized natural coating dependent on the potential selected for the electropolymerization process? Colloids Surf. B Biointerfaces 2017, 159, 673–683. [Google Scholar] [CrossRef] [PubMed]
  63. Rodrigues, L.E.A.; Carvalho, A.A.; Azevedo, A.L.; Cruz, C.B.; Maia, A.W.C. Odontologic use of copper/aluminum alloys: Mitochondrial respiration as sensitive parameter of biocompatibility. Braz. Dent. J. 2003, 14, 32–36. [Google Scholar] [CrossRef] [PubMed] [Green Version]
  64. Panov, M.S.; Grishankina, A.E.; Stupin, D.D.; Lihachev, A.I.; Mironov, V.N.; Strashkov, D.M.; Khairullina, E.M.; Tumkin, I.I.; Ryazantsev, M.N. In Situ Laser-Induced Fabrication of a Ruthenium-Based Microelectrode for Non-Enzymatic Dopamine Sensing. Materials 2020, 13, 5385. [Google Scholar] [CrossRef]
  65. Atmaramani, R.; Chakraborty, B.; Rihani, R.T.; Usoro, J.; Hammack, A.; Abbott, J.; Nnoromele, P.; Black, B.J.; Pancrazio, J.J.; Cogan, S.F. Ruthenium oxide based microelectrode arrays for in vitro and in vivo neural recording and stimulation. Acta Biomater. 2020, 101, 565–574. [Google Scholar] [CrossRef]
  66. Panov, M.S.; Khairullina, E.; Vshivtcev, F.S.; Ryazantsev, M.N.; Tumkin, I.I. Laser-Induced Synthesis of Composite Materials Based on Iridium, Gold and Platinum for Non-Enzymatic Glucose Sensing. Materials 2020, 13, 3359. [Google Scholar] [CrossRef]
  67. El-Khoury, P.Z.; Tarnovsky, A.N.; Schapiro, I.; Ryazantsev, M.N.; Olivucci, M. Structure of the photochemical reaction path populated via promotion of CF2I2 into its first excited state. J. Phys. Chem. A 2009, 113, 10767–10771. [Google Scholar] [CrossRef] [Green Version]
  68. Sugioka, K.; Meunier, M.; Piqué, A. Laser Precision Microfabrication; Springer: Berlin/Heidelberg, Germany, 2010; Volume 135. [Google Scholar]
  69. Ryazantsev, M.N.; Jamal, A.; Maeda, S.; Morokuma, K. Global investigation of potential energy surfaces for the pyrolysis of C 1–C 3 hydrocarbons: Toward the development of detailed kinetic models from first principles. Phys. Chem. Chem. Phys. 2015, 17, 27789–27805. [Google Scholar] [CrossRef]
  70. Khairullina, E.M.; Tumkin, I.I.; Stupin, D.D.; Smikhovskaia, A.V.; Mereshchenko, A.S.; Lihachev, A.I.; Vasin, A.V.; Ryazantsev, M.N.; Panov, M.S. Laser-assisted surface modification of Ni microstructures with Au and Pt toward cell biocompatibility and high enzyme-free glucose sensing. ACS Omega 2021, 6, 18099–18109. [Google Scholar] [CrossRef] [PubMed]
  71. Chang, B.Y.; Park, S.M. Electrochemical impedance spectroscopy. Annu. Rev. Anal. Chem. 2010, 3, 207–229. [Google Scholar] [CrossRef] [PubMed]
  72. Popkirov, G.; Schindler, R. A new impedance spectrometer for the investigation of electrochemical systems. Rev. Sci. Instrum. 1992, 63, 5366–5372. [Google Scholar] [CrossRef]
  73. Stupin, D.D.; Koniakhin, S.V.; Verlov, N.A.; Dubina, M.V. Adaptive Filtering to Enhance Noise Immunity of Impedance and Admittance Spectroscopy: Comparison with Fourier Transformation. Phys. Rev. Appl. 2017, 7, 054024. [Google Scholar] [CrossRef] [Green Version]
  74. Macdonald, J.R.; Schoonman, J.; Lehnen, A. Applicability and power of complex nonlinear least squares for the analysis of impedance and admittance data. J. Electroanal. Chem. Interfacial Electrochem. 1982, 131, 77–95. [Google Scholar] [CrossRef]
  75. Jorcin, J.B.; Orazem, M.E.; Pébère, N.; Tribollet, B. CPE analysis by local electrochemical impedance spectroscopy. Electrochim. Acta 2006, 51, 1473–1479. [Google Scholar] [CrossRef]
  76. Kanoun, O. Progress Reports on Impedance Spectroscopy (Measurements, Modeling, and Application) || Frequency-Dependent Phase Correction for Impedance Measurements; De Gruyter Oldenbourg: Berlin, Germany, 2016. [Google Scholar] [CrossRef]
  77. Matsumoto, B. Cell Biologcal Applications of Confocal Microscopy; Methods in Cell Biology 38; Academic Press, Elsevier: Cambridge, MA, USA, 1993. [Google Scholar]
  78. De Levie, R. The influence of surface roughness of solid electrodes on electrochemical measurements. Electrochim. Acta 1965, 10, 113–130. [Google Scholar] [CrossRef]
  79. de Levie, R. Fractals and rough electrodes. J. Electroanal. Chem. Interfacial Electrochem. 1990, 281, 1–21. [Google Scholar] [CrossRef]
  80. Rammelt, U.; Reinhard, G. On the applicability of a constant phase element (CPE) to the estimation of roughness of solid metal electrodes. Electrochim. Acta 1990, 35, 1045–1049. [Google Scholar] [CrossRef]
  81. Nyikos, L.; Pajkossy, T. Fractal dimension and fractional power frequency-dependent impedance of blocking electrodes. Electrochim. Acta 1985, 30, 1533–1540. [Google Scholar] [CrossRef]
  82. Kerner, Z.; Pajkossy, T. On the origin of capacitance dispersion of rough electrodes. Electrochim. Acta 2000, 46, 207–211. [Google Scholar] [CrossRef]
  83. Feynman, R.P. The Feynman Lectures on Physics, 1st ed.; Addison-Wesley Pub (Sd): Boston, MA, USA, 1963; Volume V1. [Google Scholar]
  84. De Levie, R. On porous electrodes in electrolyte solutions—IV. Electrochim. Acta 1964, 9, 1231–1245. [Google Scholar] [CrossRef]
  85. Liu, S. Fractal model for the ac response of a rough interface. Phys. Rev. Lett. 1985, 55, 529. [Google Scholar] [CrossRef] [PubMed]
  86. Itagaki, M.; Hatada, Y.; Shitanda, I.; Watanabe, K. Complex impedance spectra of porous electrode with fractal structure. Electrochim. Acta 2010, 55, 6255–6262. [Google Scholar] [CrossRef]
  87. Paasch, G.; Micka, K.; Gersdorf, P. Theory of the electrochemical impedance of macrohomogeneous porous electrodes. Electrochim. Acta 1993, 38, 2653–2662. [Google Scholar] [CrossRef]
  88. Adhikary, A.; Khanra, M.; Pal, J.; Biswas, K. Realization of fractional order elements. Inae Lett. 2017, 2, 41–47. [Google Scholar] [CrossRef] [Green Version]
  89. Adhikary, A.; Khanra, M.; Sen, S.; Biswas, K. Realization of a carbon nanotube based electrochemical fractor. In Proceedings of the 2015 IEEE International Symposium on Circuits and Systems (ISCAS), Lisbon, Portugal, 24–27 May 2015; pp. 2329–2332. [Google Scholar]
  90. Adhikary, A.; Shil, A.; Biswas, K. Realization of foster structure-based ladder fractor with phase band specification. Circuits Syst. Signal Process. 2020, 39, 2272–2292. [Google Scholar] [CrossRef]
  91. Stupin, D.; Lihachev, A.; Nashchekin, A. How to take fractional-order derivative experimentally? J. Phys. Conf. Ser. 2018, 1124, 071011. [Google Scholar] [CrossRef]
Figure 1. The schematic picture of the experimental setup used for the fabrication of Cu-based electrodes. 1—Nd:YAG 532 nm blue cw (continuous-wave) laser, 2—Al mirror, 3—splitting cube, 4—microscope objective, 5—experimental chemical cell, 6—glass window, 7—electrode glass substrate, 8—chemical solution (see Table 1), 9—XYZ motorized stage, 10—attenuation filter, 11—focusing lens, 12—web-camera, 13—personal computer.
Biosensors 12 00527 g001
Figure 2. The equivalent scheme for describing Cu-based electrodes. Here, L∼10 mH is parasitic inductance caused by finite-time response of the ammeter.
Biosensors 12 00527 g002
Figure 3. SEM images of Cu-based electrodes. (a) Pure Cu electrode; (b,c) Cu–Ru electrode. The inserts in blue squares show the microstructure of these electrodes. SEM images were obtained using the secondary electrons mode with 20 kV accelerating voltage. One can see that both electrodes have developed porous surface and demonstrate an obvious hierarchical structure—large pores and protrusions that contain small irregularities. Moreover, the surface of Cu–Ru electrode consists of ruthenium islands spread on top of the Cu layer (see Figure 4b).
Biosensors 12 00527 g003
Figure 4. The results of X-ray microanalysis confirm the the elemental composition of Cu (a) and Cu–Ru (b) electrodes. One can see that Cu–Ru electrode consists of ruthenium islands located on top of copper (here, insert image is magnified SEM photograph Figure 3c, scale bar corresponds to 200 nm). The C, Na, Cl, O, and Si peaks correspond to the elements of the substrate material (glass).
Biosensors 12 00527 g004
Figure 5. The XRD patterns of Cu and Cu–Ru electrodes fabricated at the optimized physical (laser power, scanning speed) and chemical parameters (composition of solutions).
Biosensors 12 00527 g005
Figure 6. The admittance loci and their CNLS-approximation for Cu (a) and Cu–Ru (b) electrodes. The black squares correspond to the experimentally obtained admittance spectra using the FFT-EIS, and the red circles denote the CNLS fitting of the experimental data with an equivalent scheme shown in Figure 2. As one can see, the admittance spectra of all electrodes have an arc shape indicating that the surfaces of these electrodes are developed and porous. The difference in the shape of the spectra is associated with different values of α caused by different pore sizes and the structure of the studied electrodes (see Figure 3 and Table 2).
Biosensors 12 00527 g006
Figure 7. Investigation of biocompatibility of Cu (a) and Cu–Ru (b) electrodes. The dead and alive cells are shown in yellow and green, respectively (the examples of the dead and alive cells are shown by arrows). Cu–Ru electrode exhibits much better biocompatibility in comparison with pure Cu electrode (90 vs. 30% alive cells).
Biosensors 12 00527 g007
Figure 8. Confocal tomography images of the HeLa cells seeded on top of glass (a), Cu (b), and Cu–Ru (c) electrodes. Here, the red lines are referred to x axis, the green lines correspond to the z axis, and the blue lines refer to the y axis. The ends of cut-lines are marked by white triangles. One can see that the HeLa cells on top of Cu-based electrodes (b,c) have a fusiform shape similar to those observed on glass (a). Moreover, they duplicate the morphology of the electrodes, meaning that Cu-based electrodes are biocompatible.
Biosensors 12 00527 g008
Figure 9. Macrophotograph of the copper–ruthenium biosensor.
Biosensors 12 00527 g009
Figure 10. Estimation of the viability of the cells on the surface of the Cu–Ru electrode. Panels (a,b) correspond to fluorescence photographs (“N21” cube) of Cu–Ru electrode before and after Triton X-100 addition, respectively. It is clear that the cells were alive before the Triton X-100 addition since there is no fluorescence of propidium iodide. On the other hand, the cells became dead after Triton X-100 addition, which is confirmed by PI fluorescence (bright white dots). Panel (c) corresponds to the time evolution of the cell index. The obtained data indicate that before detergent was added when the majority of the cells on the electrode were alive, the cell index was stable at zero value. After adding detergent, almost all cells became dead leading to a slow and smooth decrease of the cell index. The sharp rise and drop of the cell index during Triton X-100 addition (∼3.5–4.0 min) can be attributed to manipulations with the cells medium (i.e., replacing and adding).
Biosensors 12 00527 g010
Table 1. Solution components used for laser-induced synthesis of metallic and bimetallic electrodes based on Cu and Ru. Here, DMF is N,N-dimethylformamide.
Electrode MaterialReagent, (mM)Solvent
Cucopper(II) chloride dihydrate
(CuCl 2 · 2 H 2 O), (2)
H2O
potassium sodium tartrate tetrahydrate
(KNaC 4 H 4 O 6 · 4H 2 O), (7)
sodium hydroxide
(NaOH), (10)
Cu–Rutriruthenium dodecacarbonyl
(Ru 3 (CO) 12 ), (3)
DMF
Table 2. Typical results of the CNLS fitting of the admittance spectra of Cu-based electrodes. The accuracy is calculated as 99% confidence intervals.
ParameterR, k Ω W, S·s α α
Cu4.60(9)3.5(3) ×  10 5 0.28(1)
Cu–Ru7.5(1)3.2(9) ×  10 5 0.34(3)
Publisher’s Note: MDPI stays neutral with regard to jurisdictional claims in published maps and institutional affiliations.

