Brush-like Polymer Prodrug with Aggregation-Induced Emission Features for Precise Intracellular Drug Tracking


Abstract
:1. Introduction
2. Materials and Methods
2.1. Preparation Methods
2.2. Characterization
3. Results and Discussion
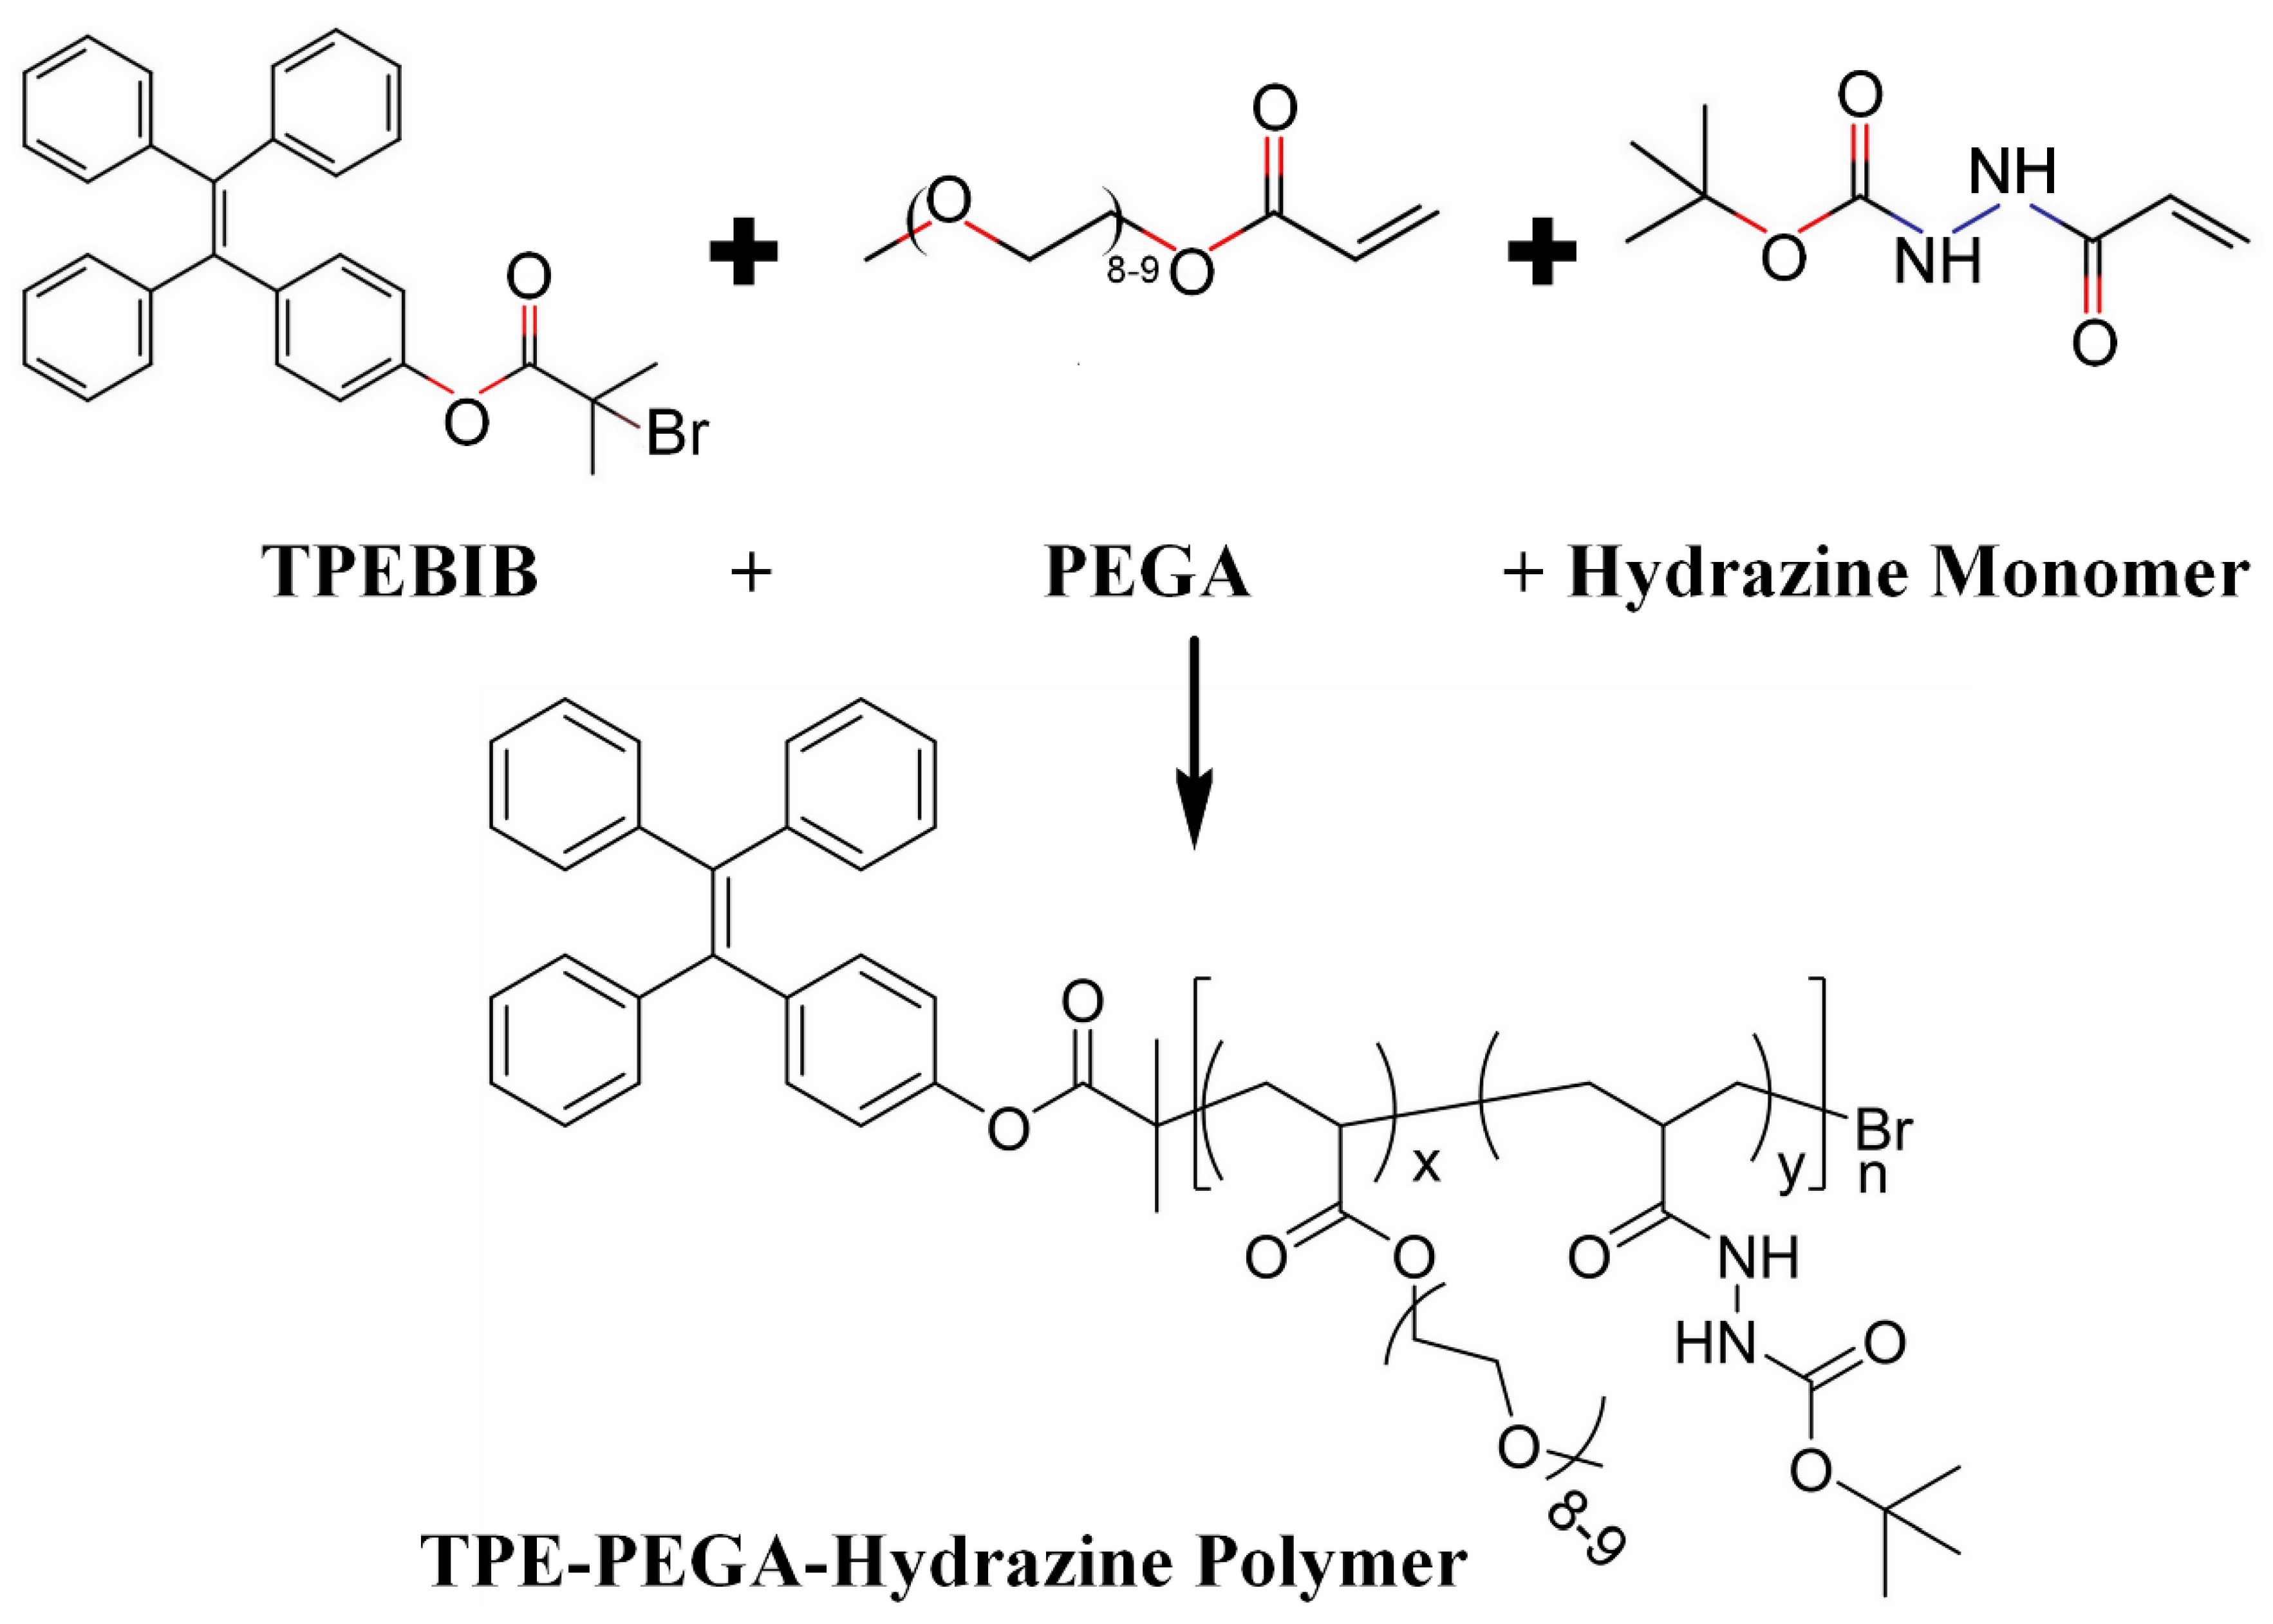
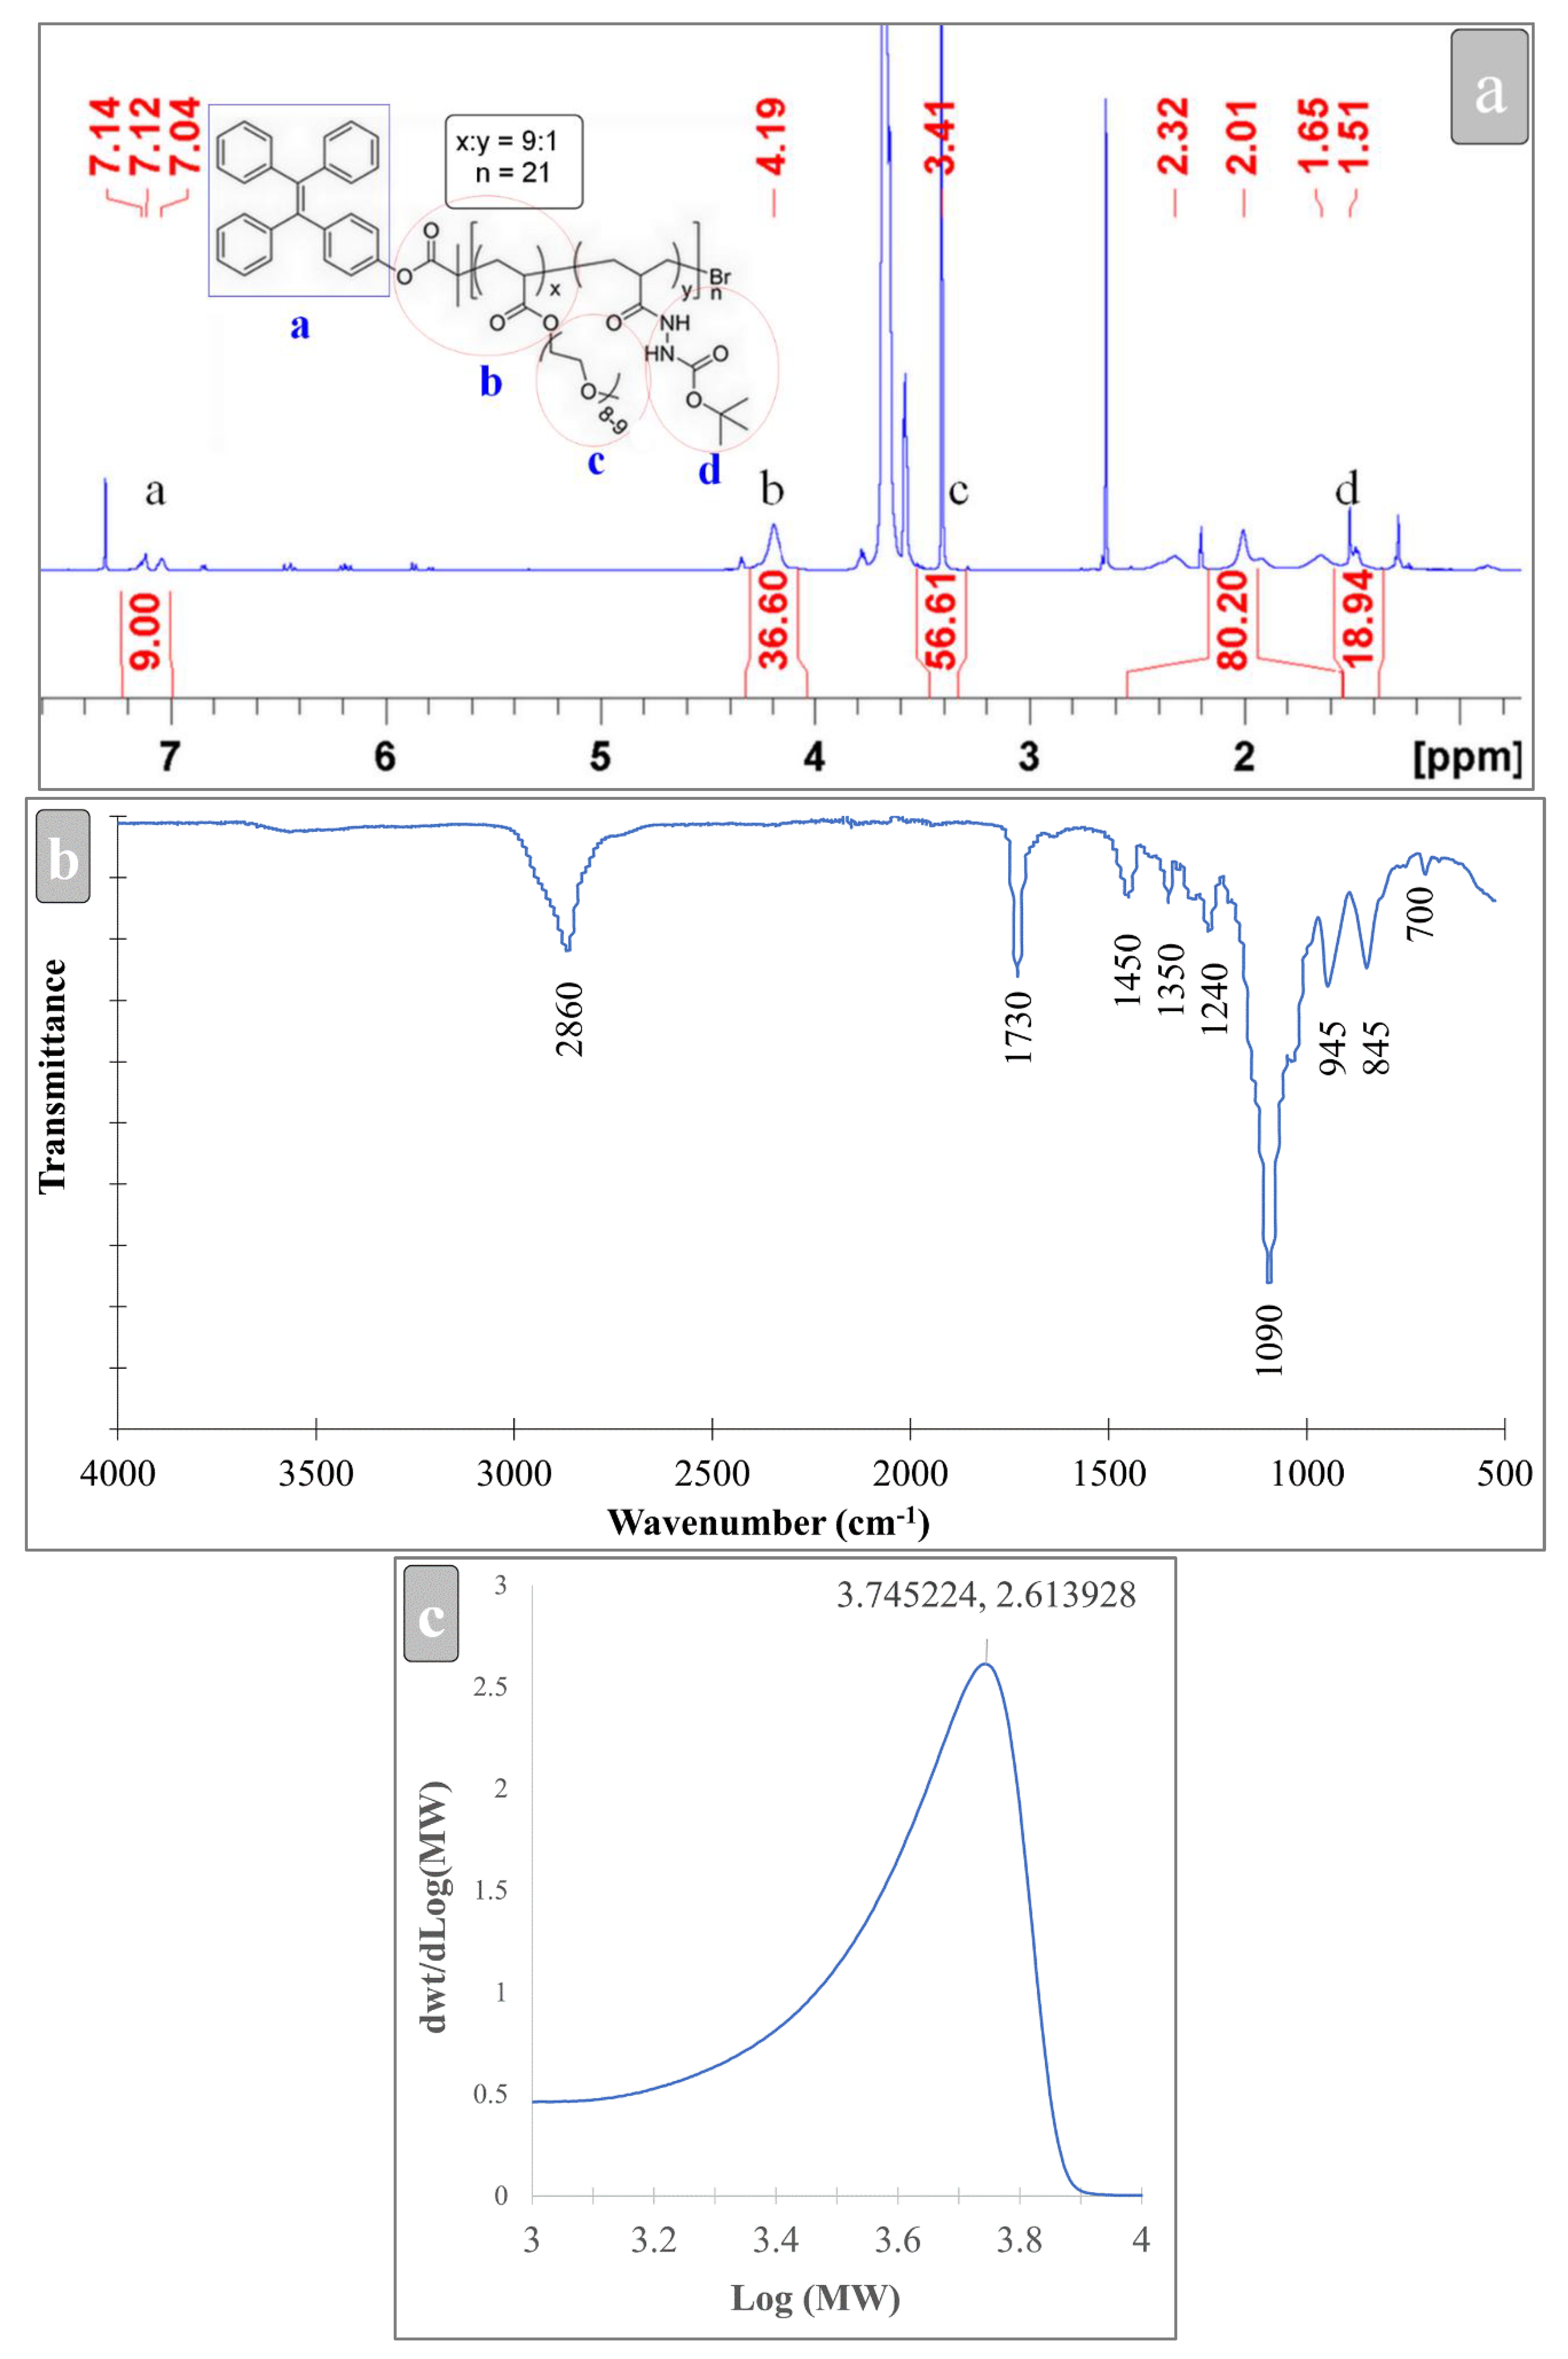
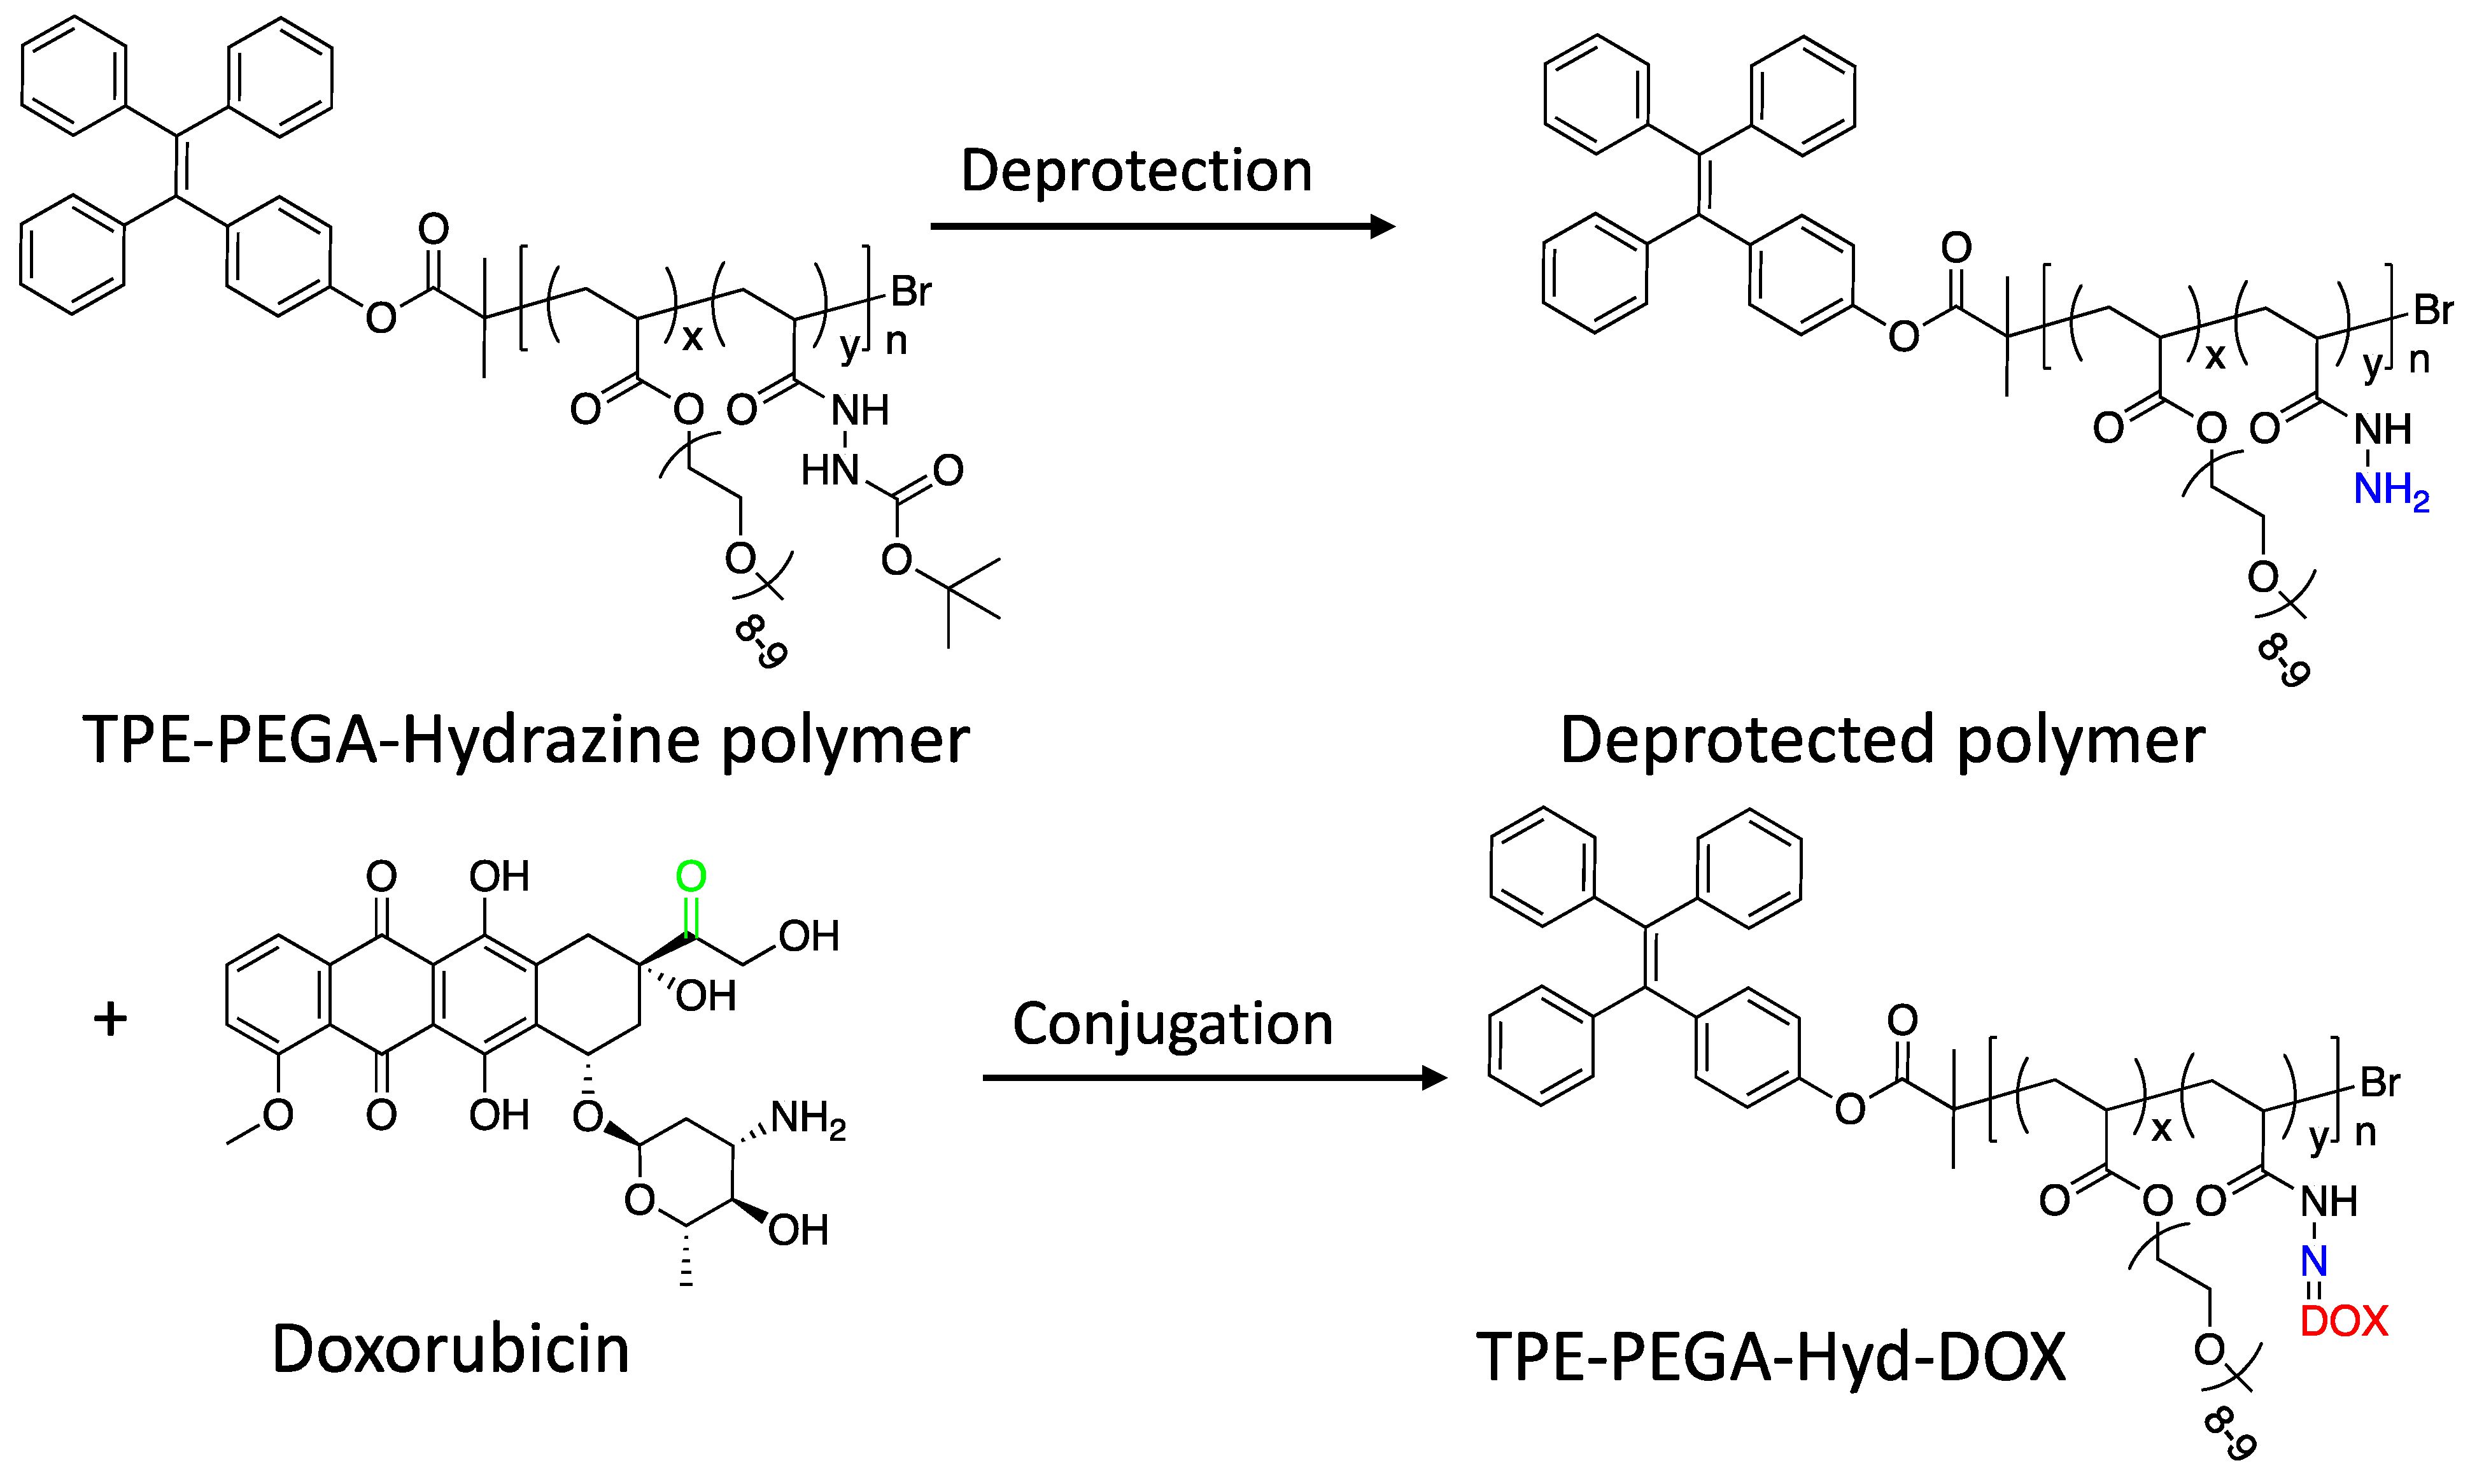
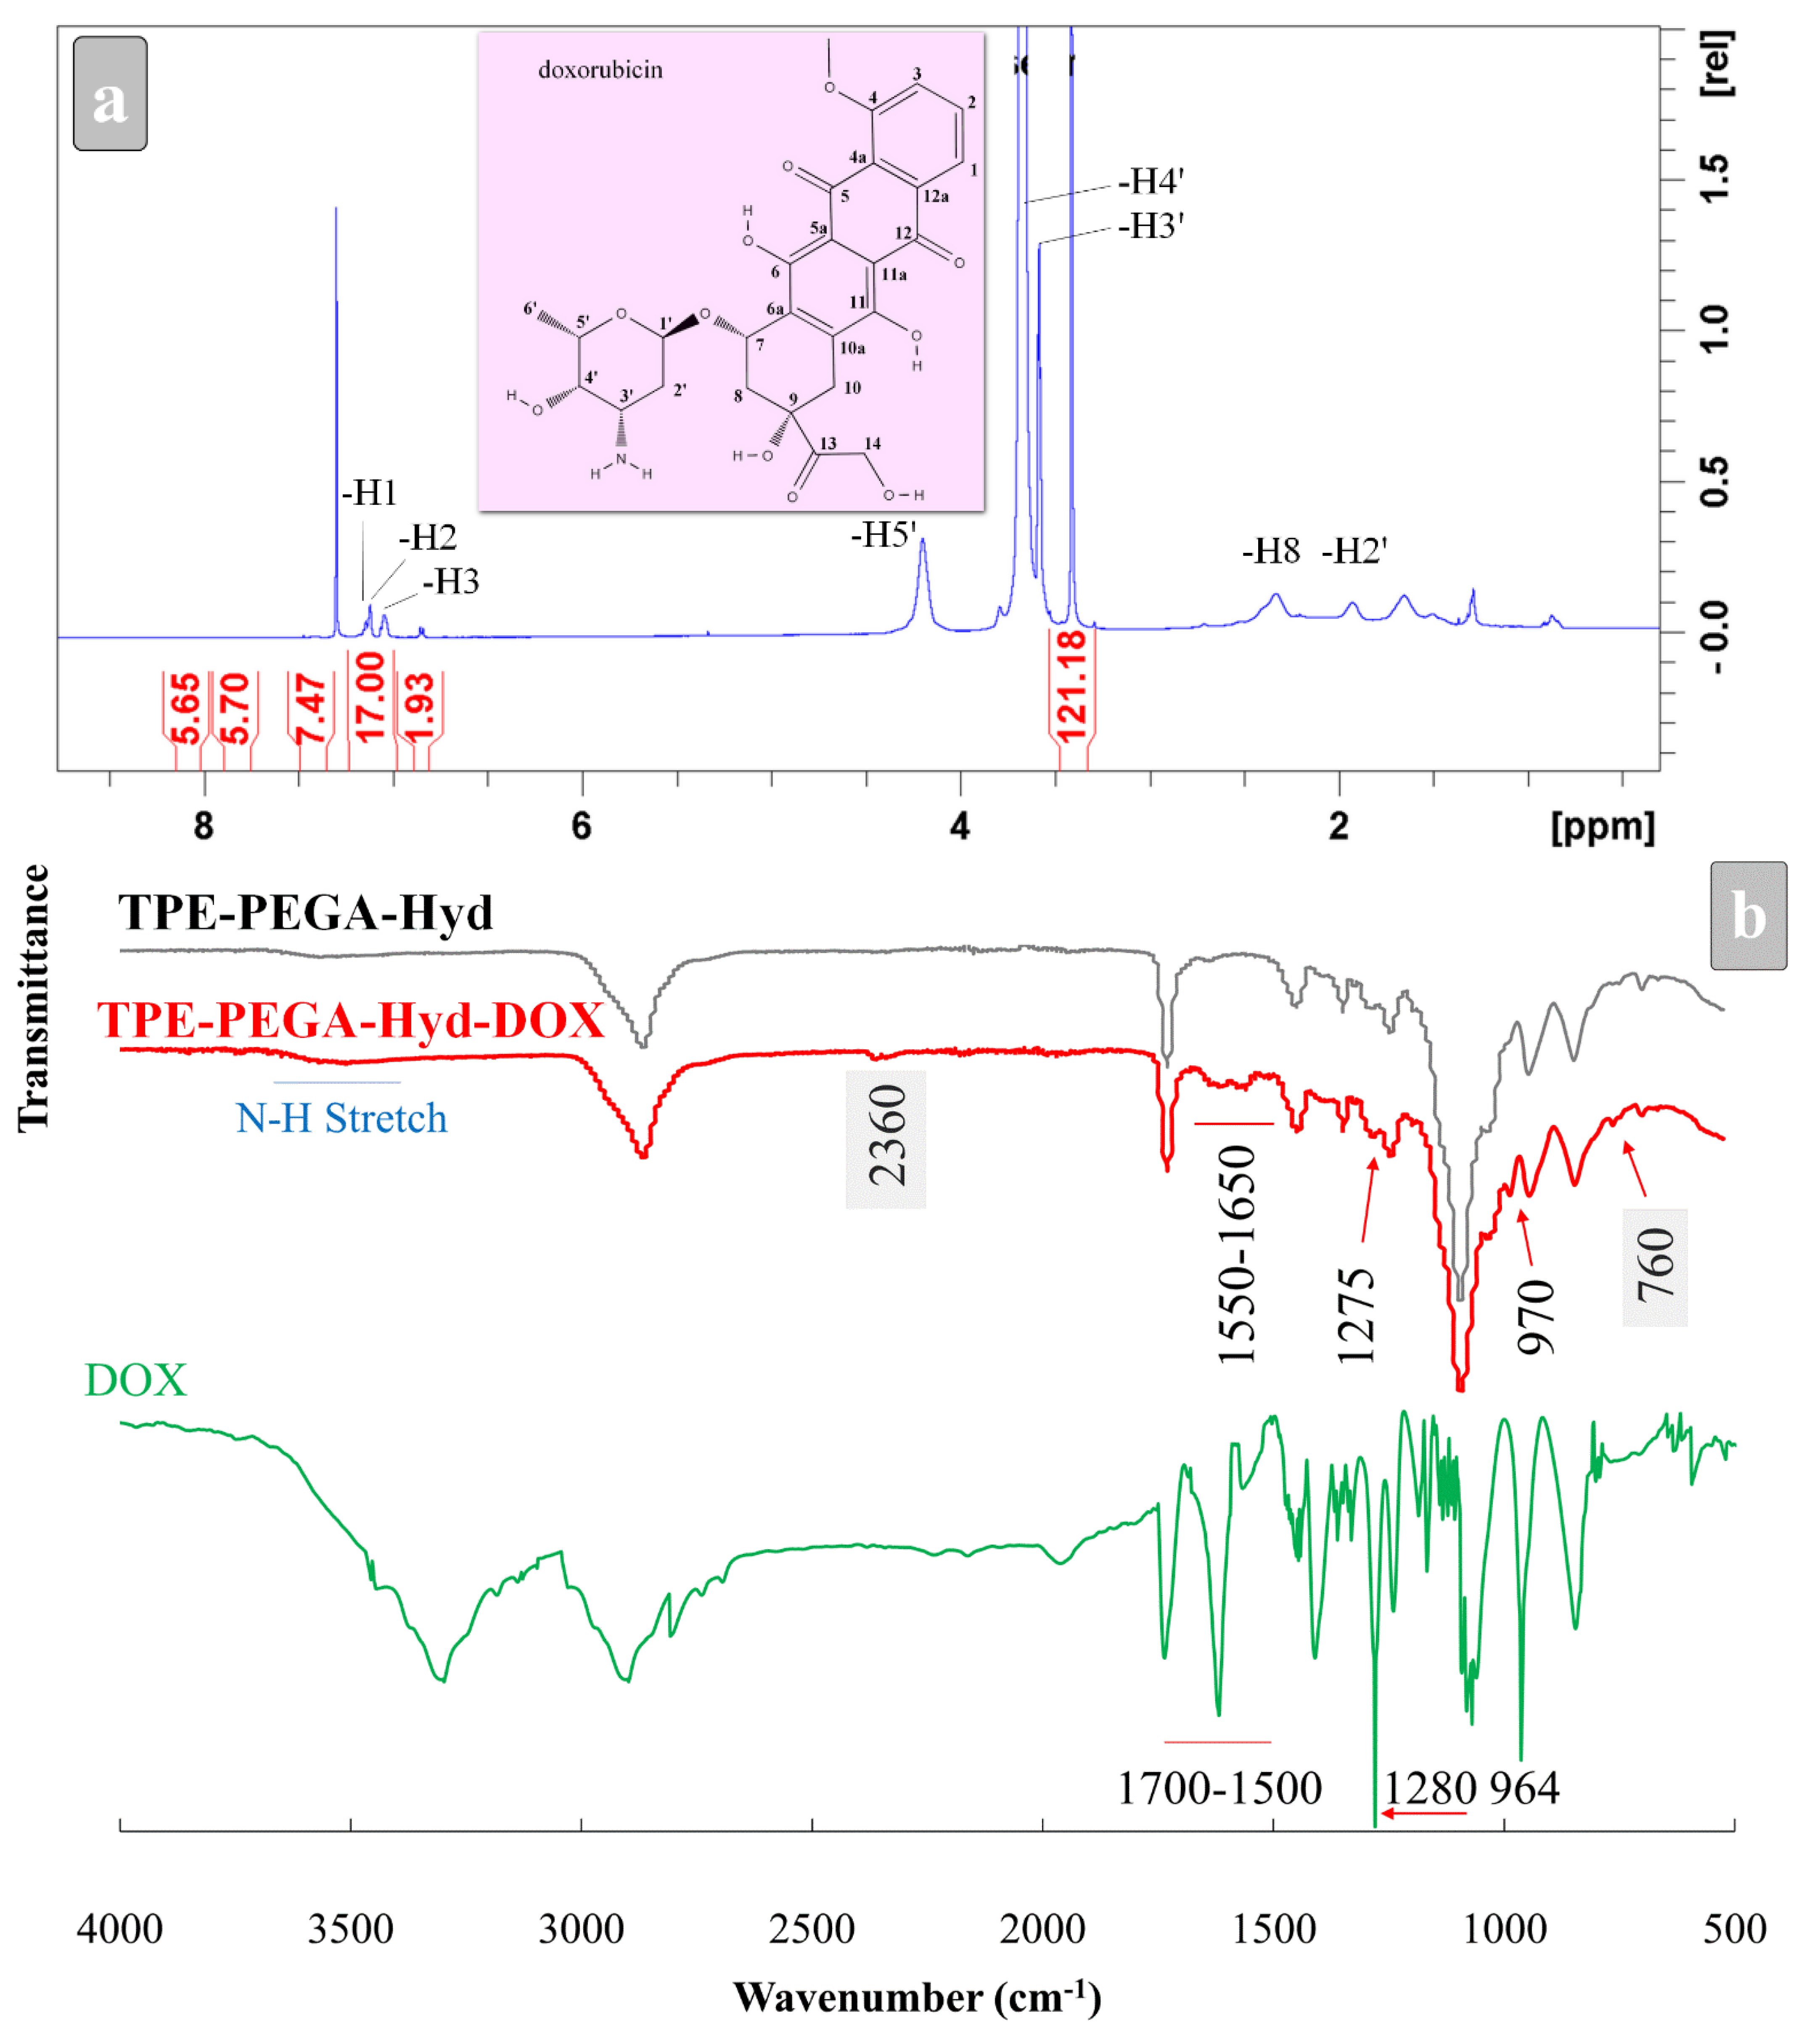
3.1. Synthesis of TPE-PEGA-Hydrazine Polymer Compound
3.2. Drug Loading
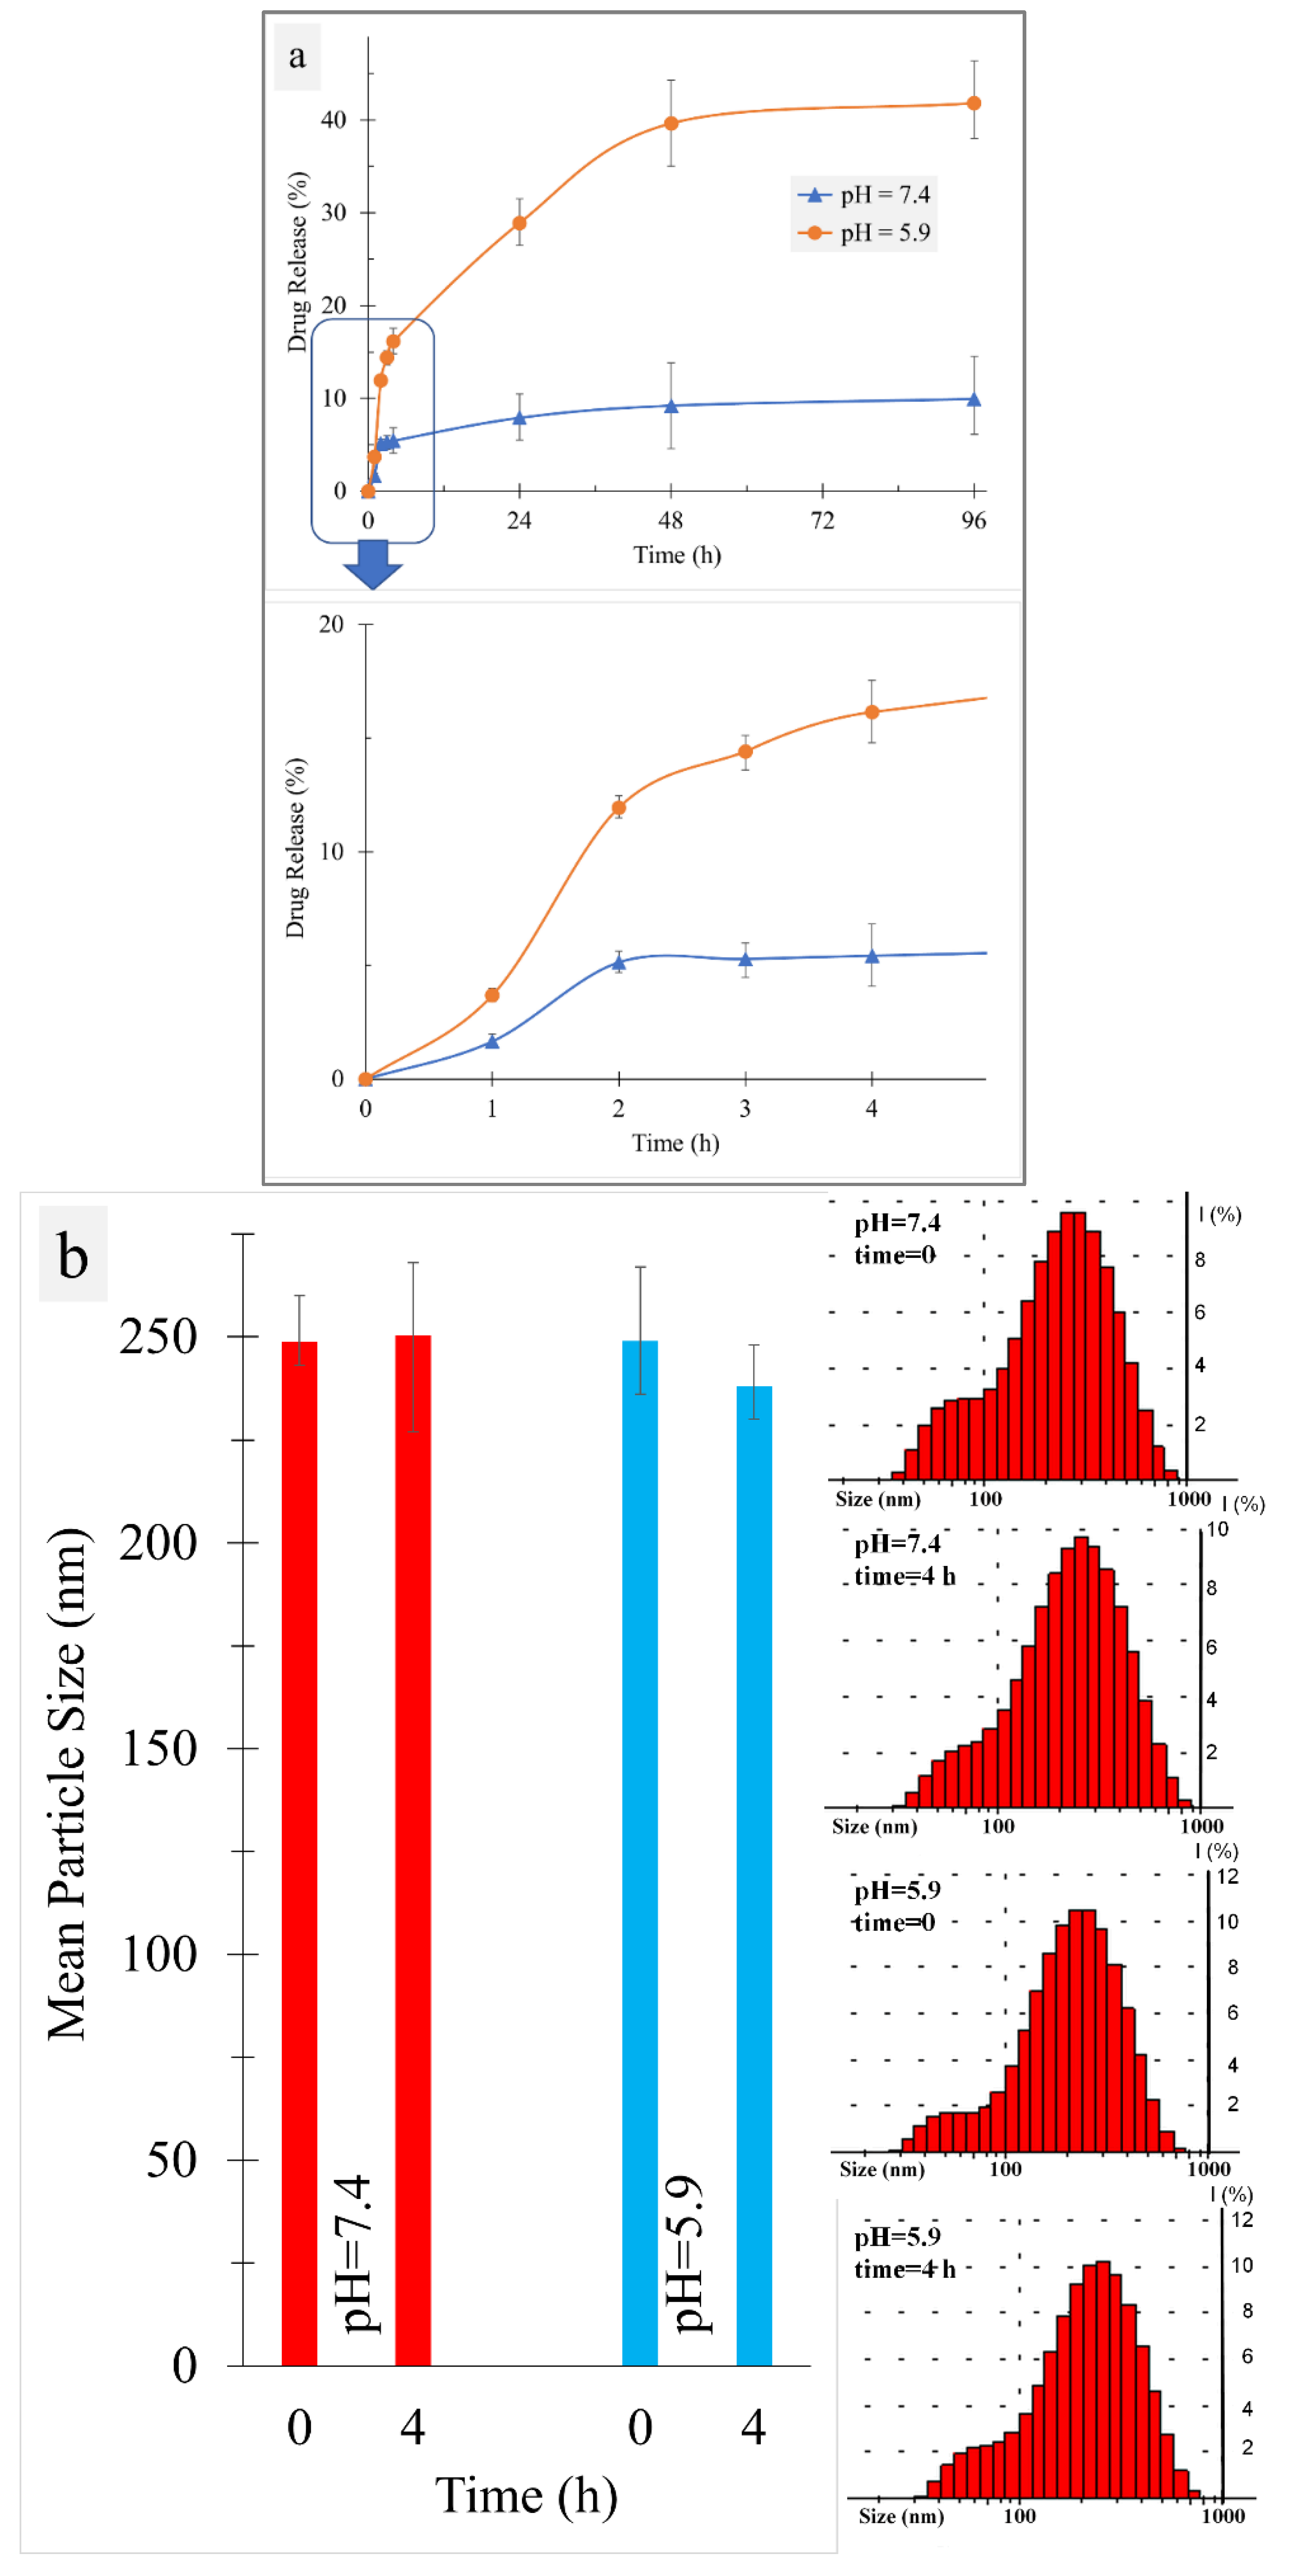
3.3. Drug Release
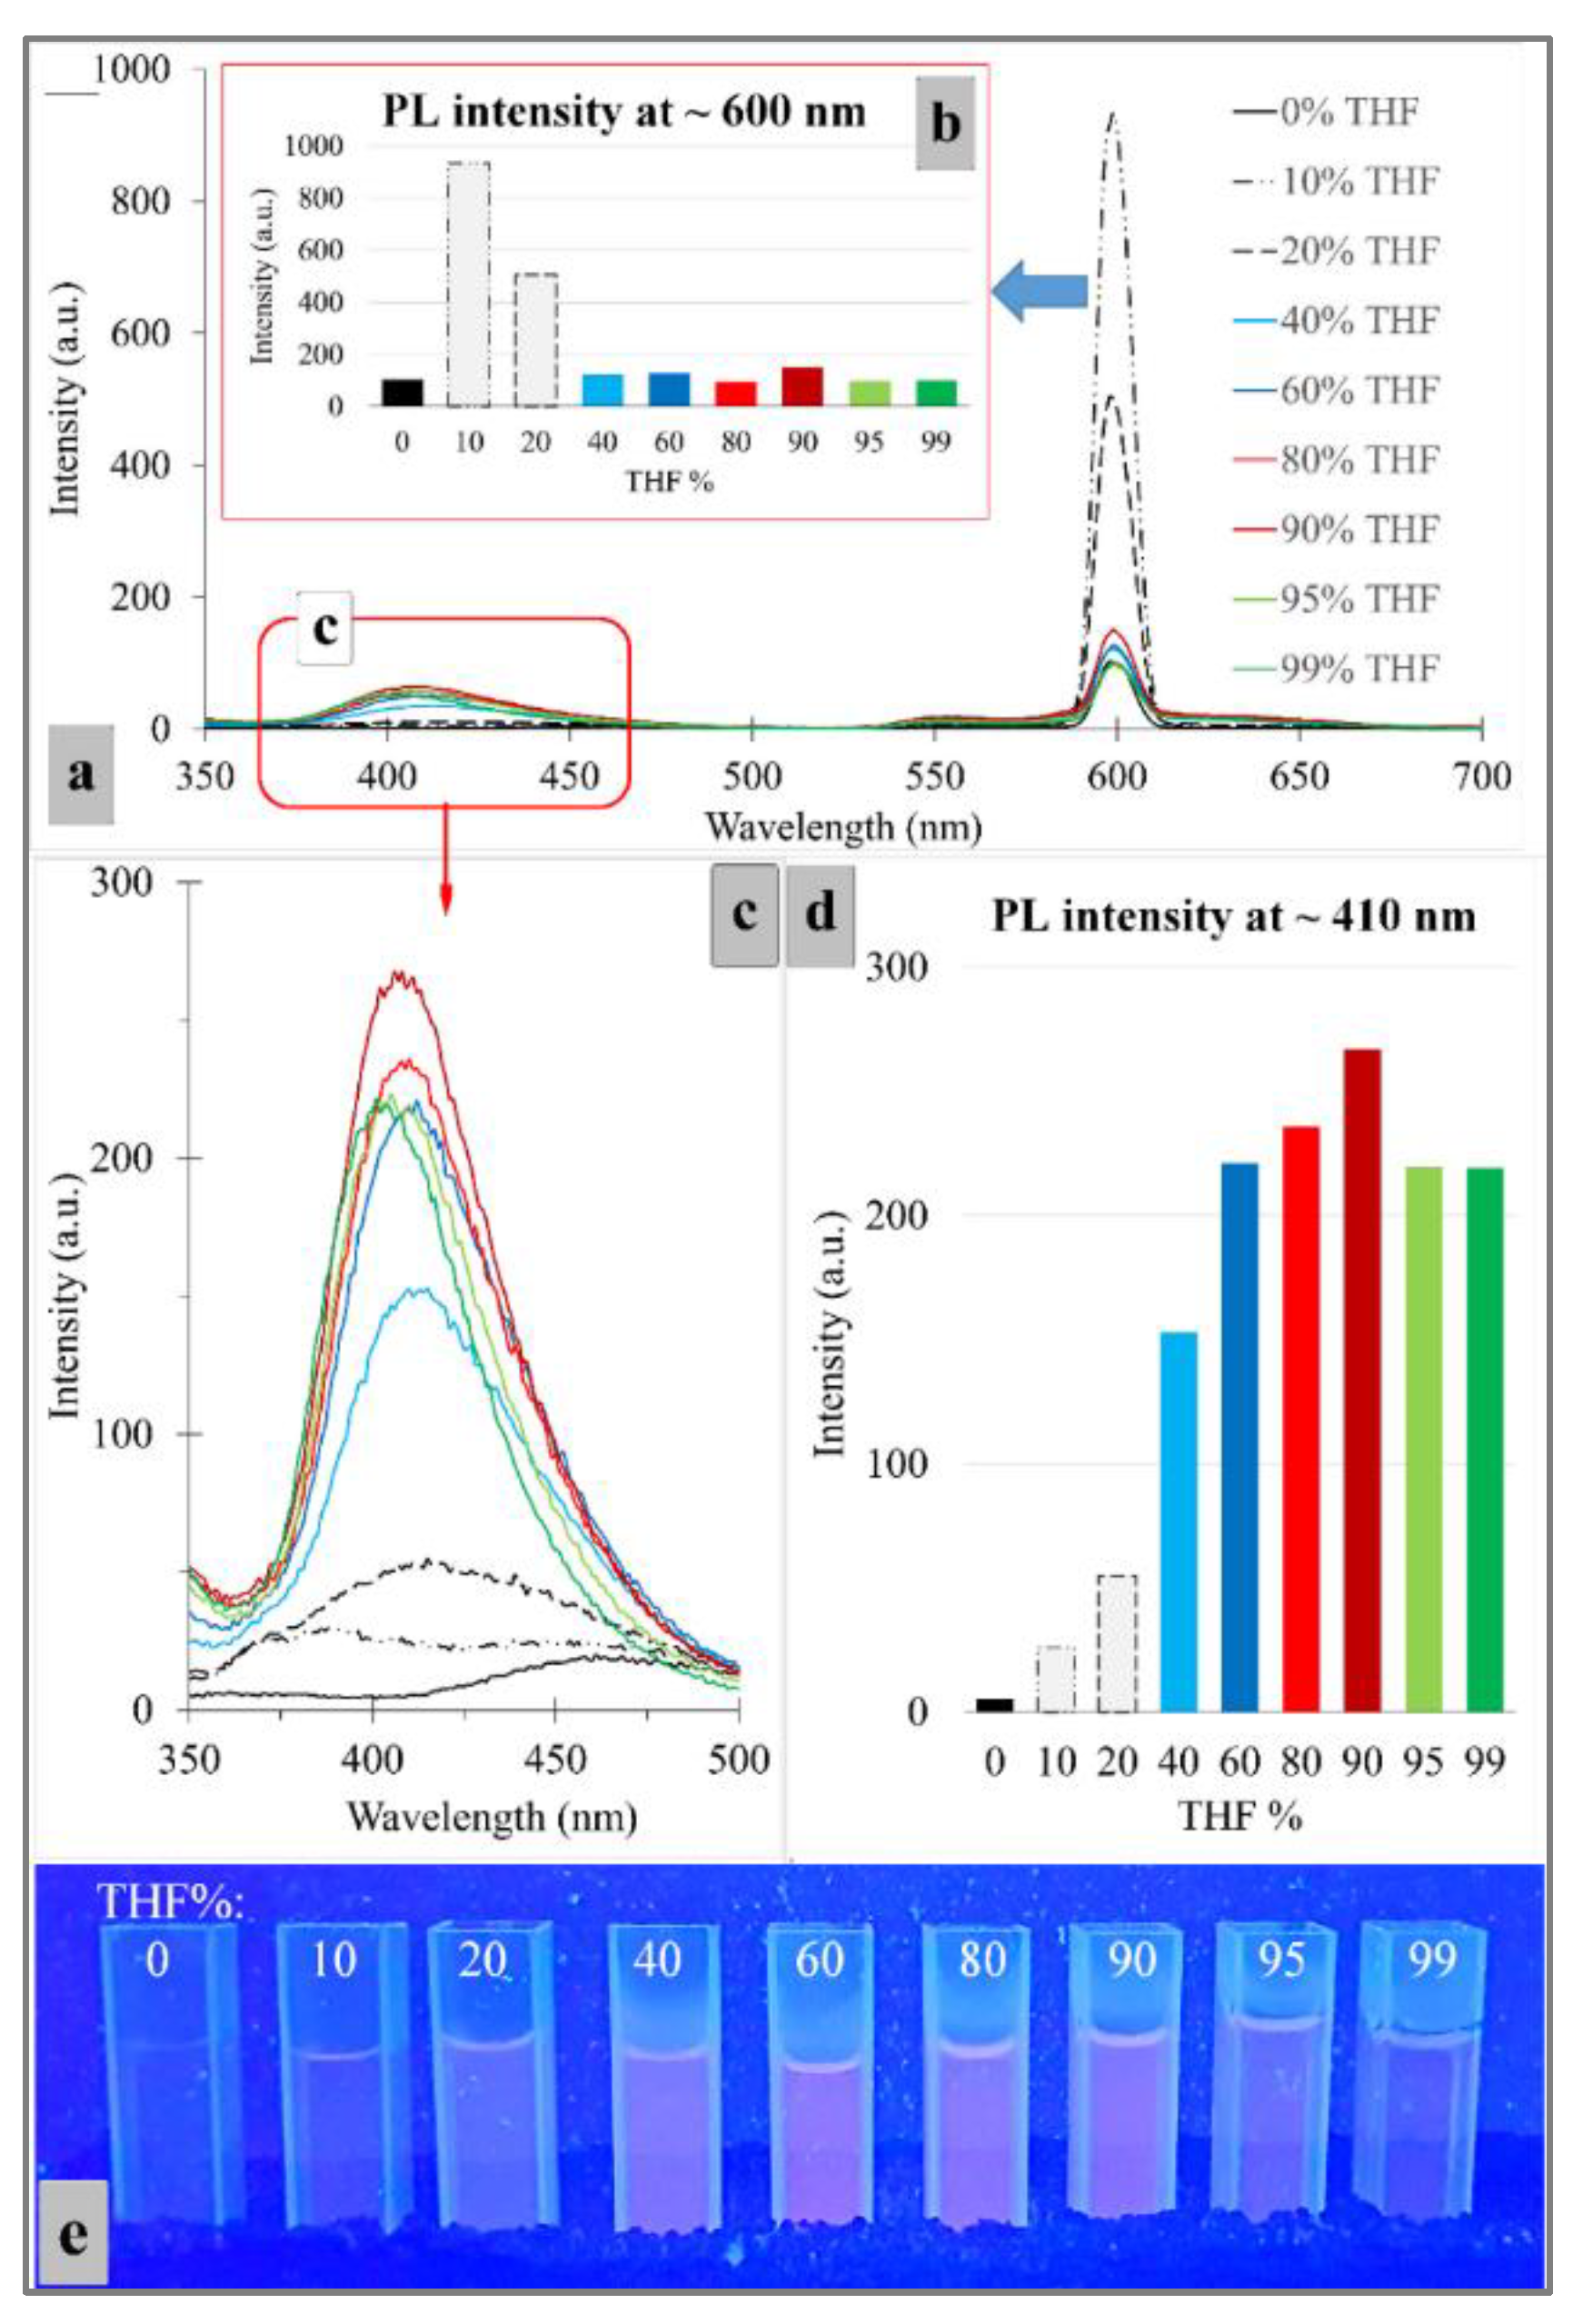
3.4. AIE Behavior
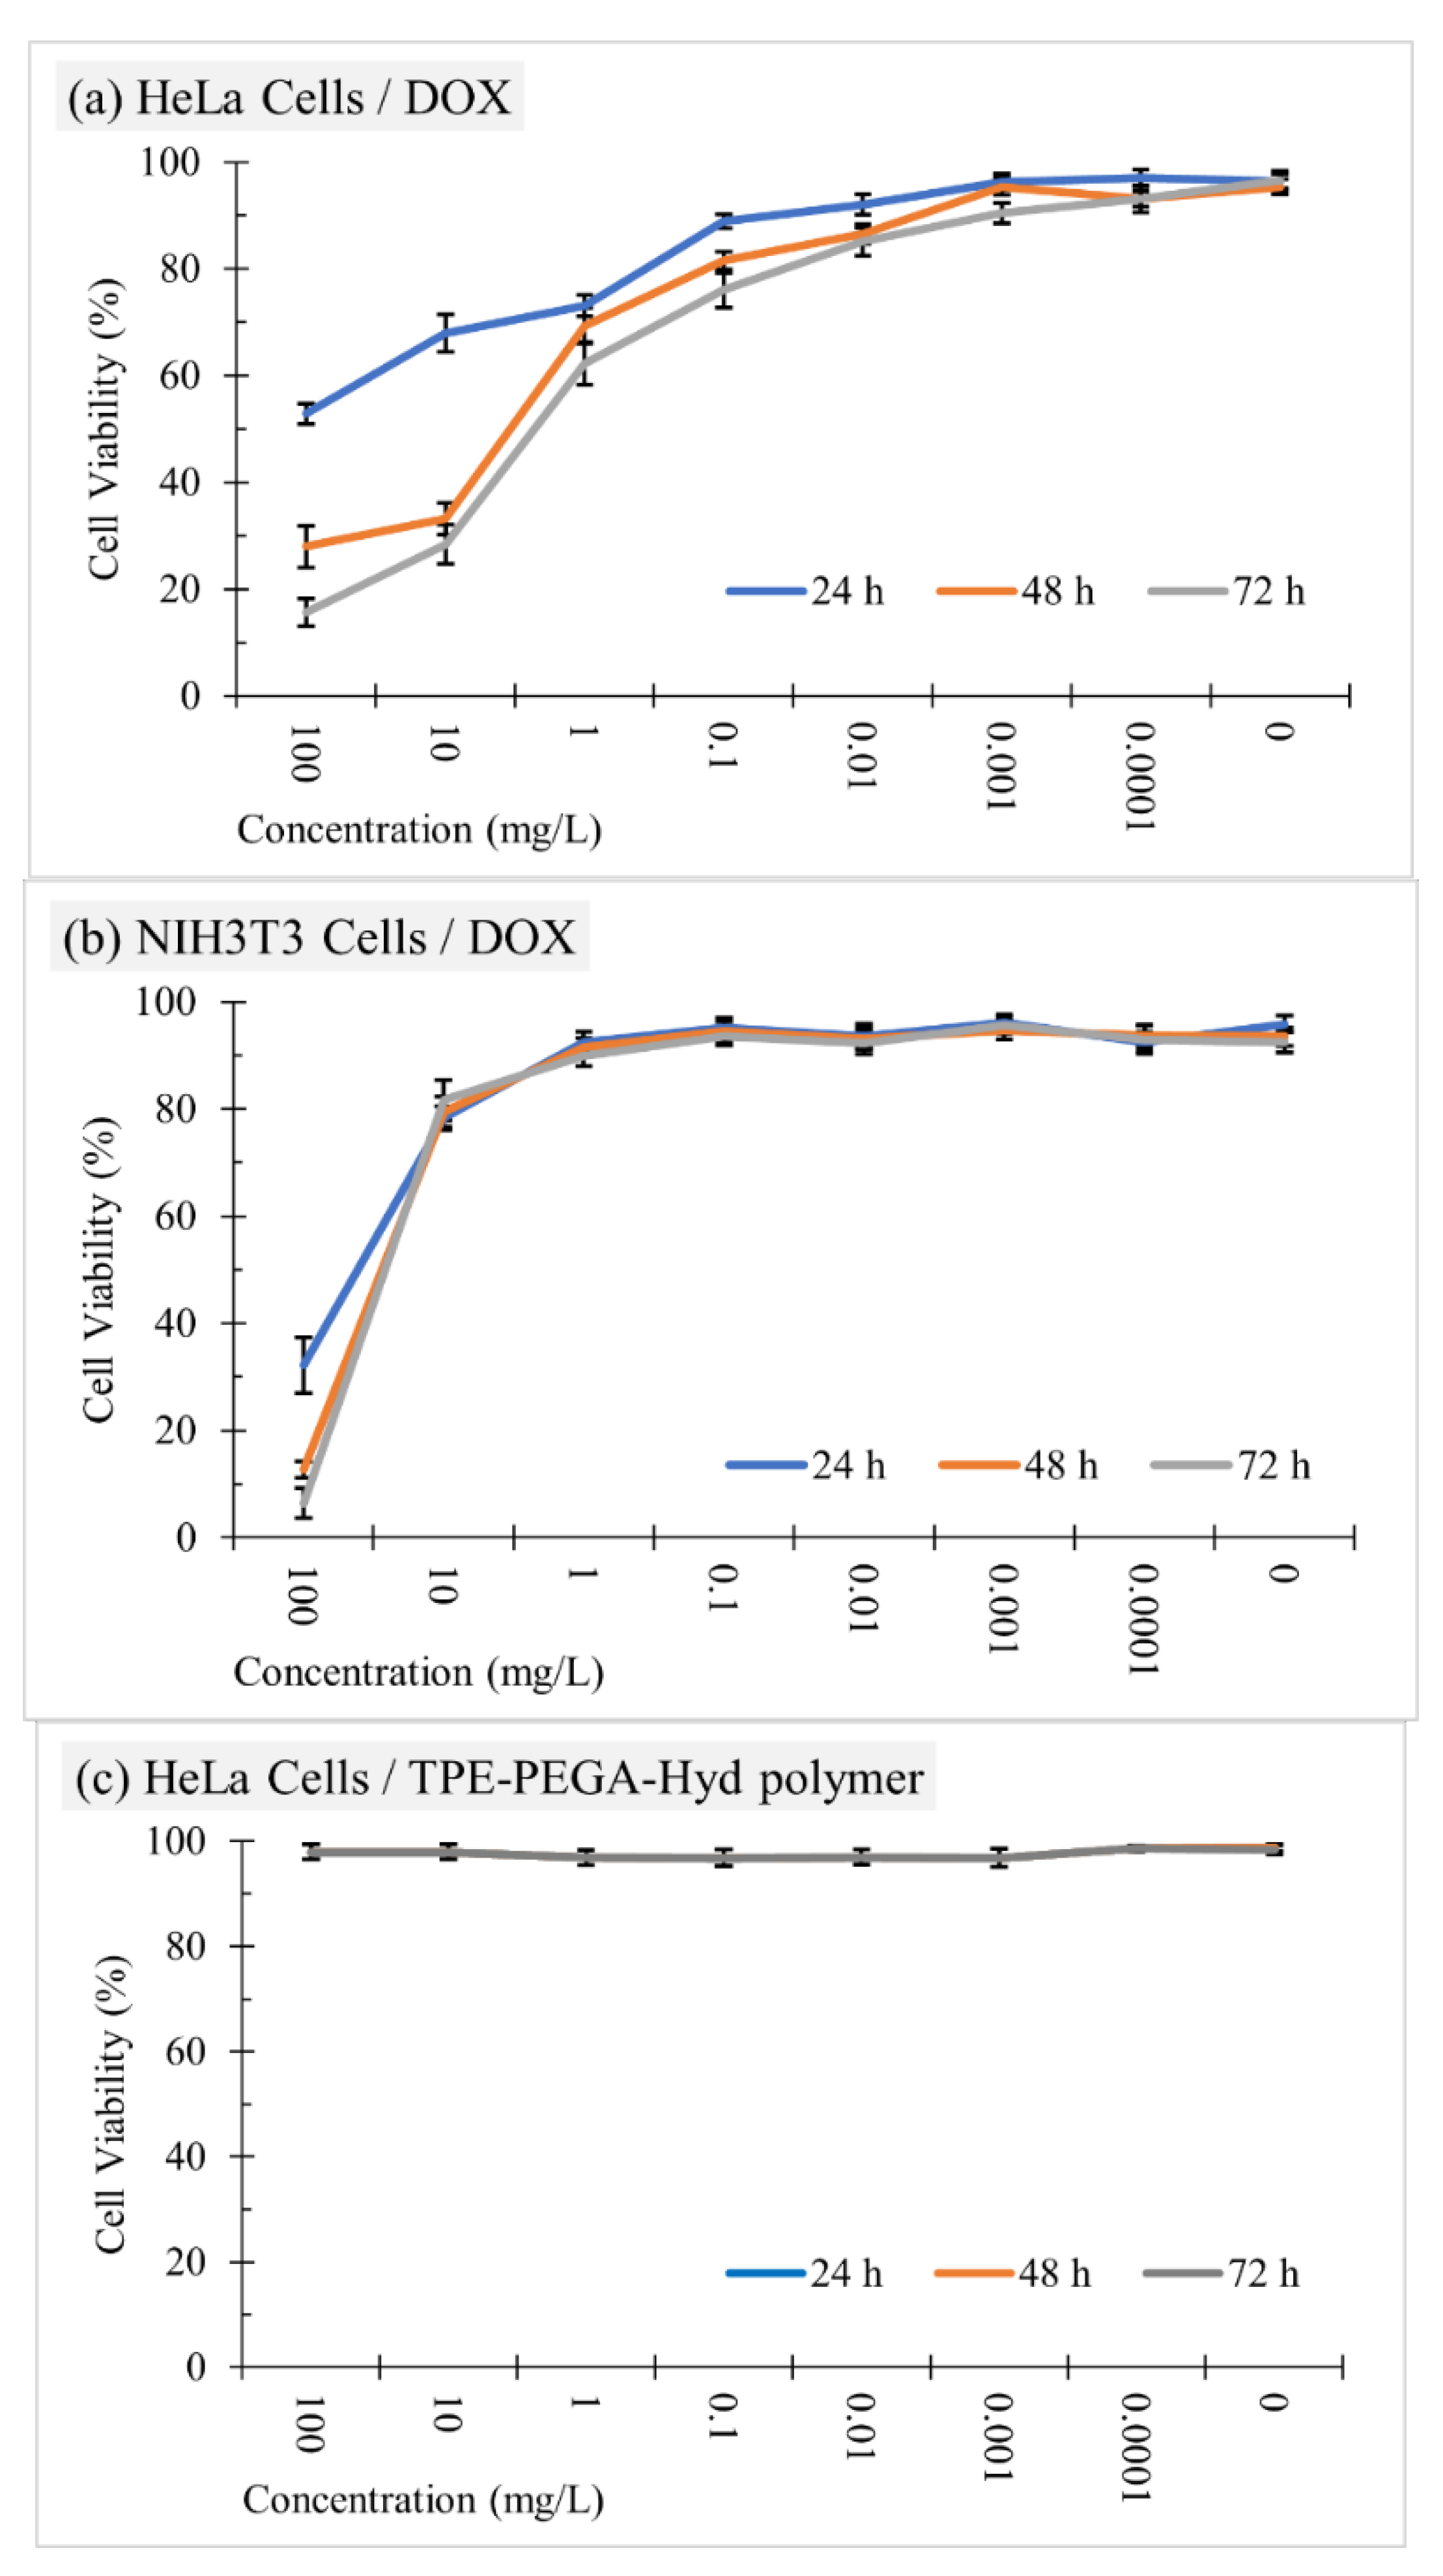
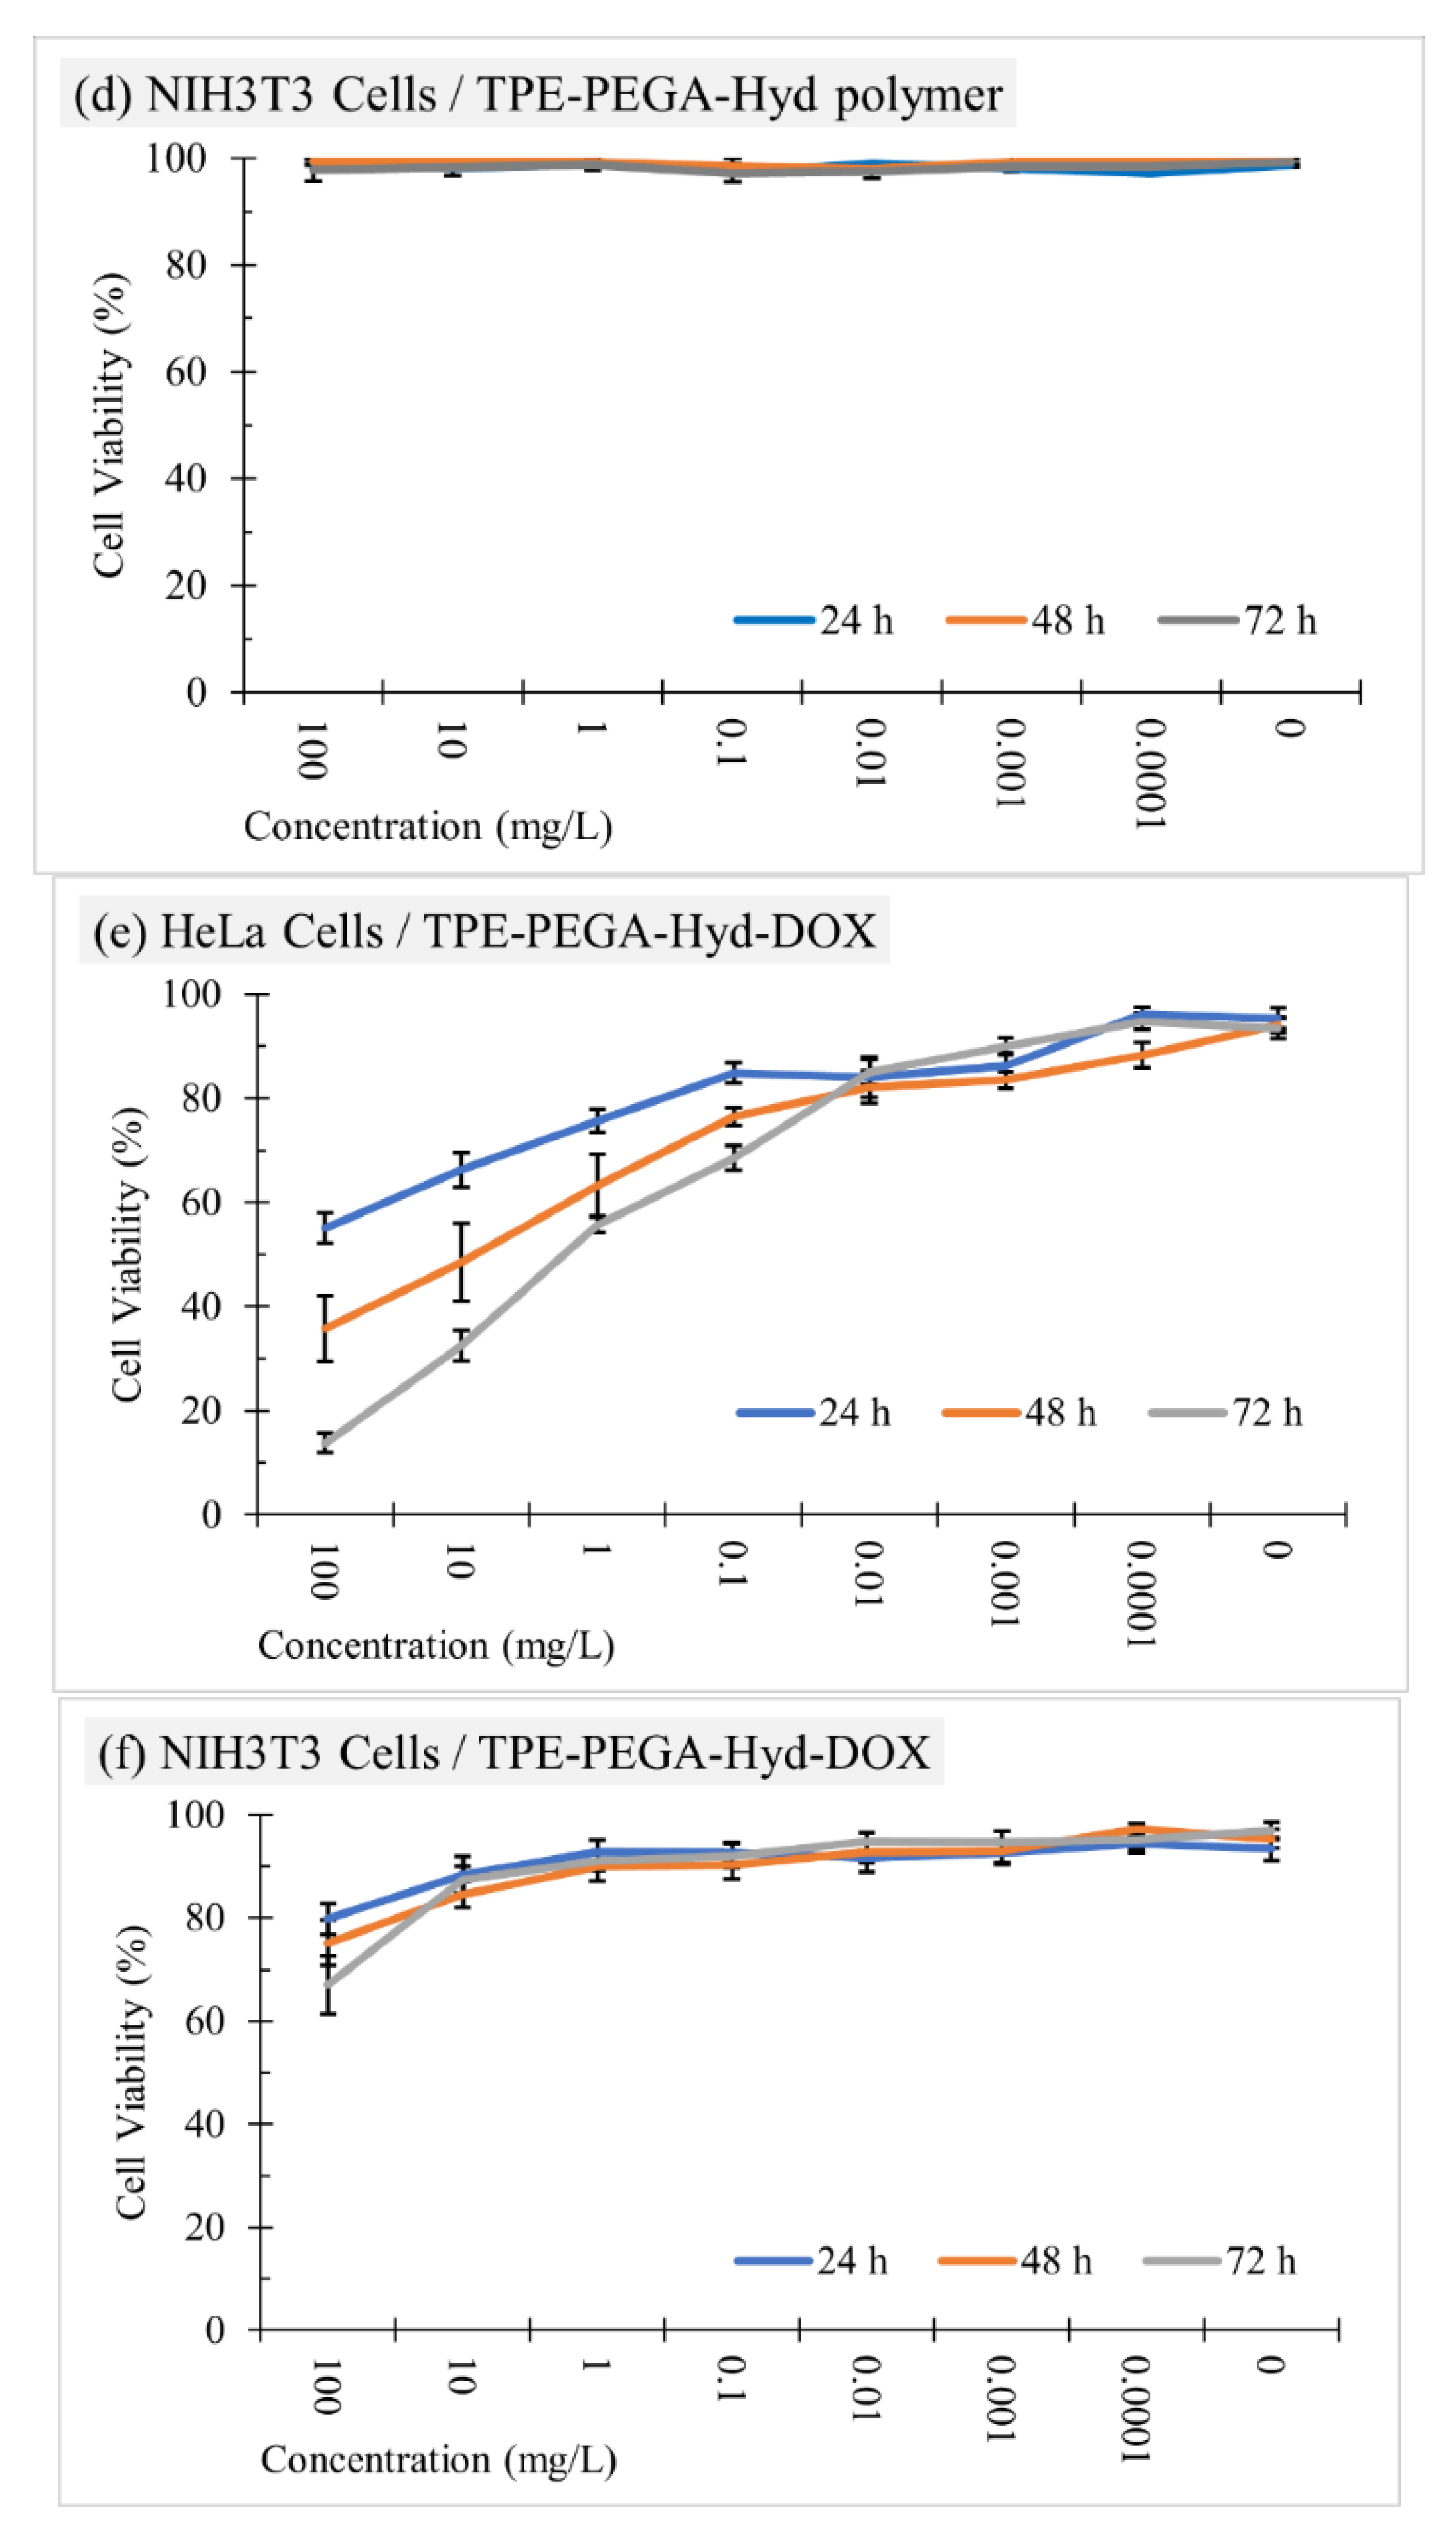
3.5. Cell Viability Assay and Drug Release Monitoring
4. Conclusions
Supplementary Materials
Author Contributions
Funding
Institutional Review Board Statement
Informed Consent Statement
Data Availability Statement
Acknowledgments
Conflicts of Interest
References
- Dickens, E.; Ahmed, S. Principles of cancer treatment by chemotherapy. Surgery 2021, 39, 215–220. [Google Scholar] [CrossRef]
- Majeed, H.; Gupta, V. Adverse Effects of Radiation Therapy; StatPearls Publishing: Treasure Island, FL, USA, 2021. [Google Scholar]
- Huda, S.; Alam, M.A.; Sharma, P.K. Smart nanocarriers-based drug delivery for cancer therapy: An innovative and developing strategy. J. Drug Deliv. Sci. Technol. 2020, 60, 102018. [Google Scholar] [CrossRef]
- Bieniek, A.; Terzyk, A.P.; Wiśniewski, M.; Roszek, K.; Kowalczyk, P.; Sarkisov, L.; Keskin, S.; Kaneko, K. MOF materials as therapeutic agents, drug carriers, imaging agents and biosensors in cancer biomedicine: Recent advances and perspectives. Prog. Mater. Sci. 2021, 117, 100743. [Google Scholar] [CrossRef]
- Xiao, Y.; Gu, Y.; Qin, L.; Chen, L.; Chen, X.; Cui, W.; Li, F.; Xiang, N.; He, X. Injectable thermosensitive hydrogel-based drug delivery system for local cancer therapy. Colloids Surf. B Biointerfaces 2021, 200, 111581. [Google Scholar] [CrossRef]
- Xie, Z.; Shen, J.; Sun, H.; Li, J.; Wang, X. Polymer-based hydrogels with local drug release for cancer immunotherapy. Biomed. Pharmacother. 2021, 137, 111333. [Google Scholar] [CrossRef]
- Danewalia, S.S.; Singh, K. Bioactive glasses and glass—Ceramics for hyperthermia treatment of cancer: State-of-art, challenges, and future perspectives. Mater. Today Bio 2021, 10, 100100. [Google Scholar] [CrossRef]
- Parent, M.; Baradari, H.; Champion, E.; Damia, C.; Viana-Trecant, M. Design of calcium phosphate ceramics for drug delivery applications in bone diseases: A review of the parameters affecting the loading and release of the therapeutic substance. J. Control. Release 2017, 252, 1–17. [Google Scholar] [CrossRef]
- Naghibi, S.; Madaah Hosseini, H.R.; Faghihi Sani, M.A.; Shokrgozar, M.A.; Mehrjoo, M. Mortality response of folate receptor-activated, PEG–functionalized TiO2 nanoparticles for doxorubicin loading with and without ultraviolet irradiation. Ceram. Int. 2014, 40, 5481–5488. [Google Scholar] [CrossRef]
- Veronese, F.M.; Schiavon, O.; Pasut, G.; Mendichi, R.; Andersson, L.; Tsirk, A.; Ford, J.; Wu, G.; Kneller, S.; Davies, J.; et al. PEG−doxorubicin conjugates: Influence of polymer structure on drug release, in vitro cytotoxicity, biodistribution, and antitumor activity. Bioconjug. Chem. 2005, 16, 775–784. [Google Scholar] [CrossRef]
- Li, J.; Xin, M.; Huo, Y.; Cai, A.; Yan, M.; Wang, C.; Wei, G. Synthesis of β-cyclodextrin-PEG-G molecules to delay tumor growth and application of β-cyclodextrin-PEG-G aggregates as drug carrier. Carbohydr. Polym. 2020, 229, 115478. [Google Scholar] [CrossRef]
- Karimi, S.; Namazi, H. Fe3O4@PEG-coated dendrimer modified graphene oxide nanocomposite as a pH-sensitive drug carrier for targeted delivery of doxorubicin. J. Alloy Compd. 2021, 879, 160426. [Google Scholar] [CrossRef]
- Weber, A.; Engelmaier, A.; Hainzelmayer, S.; Minibeck, E.; Anderle, H.; Schwarz, H.P.; Turecek, P.L. Development, validation, and application of a novel ligand-binding assay to selectively measure PEGylated recombinant human coagulation factor VIII (BAX 855). Bioconjug. Chem. 2015, 26, 2133–2142. [Google Scholar] [CrossRef] [PubMed]
- Feng, C.; Huang, X. Polymer brushes: Efficient synthesis and applications. Acc. Chem. Res. 2018, 51, 2314–2323. [Google Scholar] [CrossRef] [PubMed]
- Ye, W.-L.; Zhao, Y.-P.; Li, H.-Q.; Na, R.; Li, F.; Mei, Q.-B.; Zhao, M.-G.; Zhou, S.-Y. Doxorubicin-poly (ethylene glycol)-alendronate self-assembled micelles for targeted therapy of bone metastatic cancer. Sci. Rep. 2015, 5, 14614. [Google Scholar] [CrossRef] [PubMed]
- Akram, M.W.; Raziq, F.; Fakhar-e-Alam, M.; Aziz, M.H.; Alimgeer, K.S.; Atif, M.; Amir, M.; Hanif, A.; Aslam Farooq, W. Tailoring of Au-TiO2 nanoparticles conjugated with doxorubicin for their synergistic response and photodynamic therapy applications. J. Photochem. Photobiol. A Chem. 2019, 384, 112040. [Google Scholar] [CrossRef]
- Richter, M.; Zhang, H. Receptor-targeted cancer therapy. DNA Cell Biol. 2005, 24, 271–282. [Google Scholar] [CrossRef] [PubMed]
- Cai, X.; Liu, B. Aggregation-induced emission: Recent advances in materials and biomedical applications. Angew. Chem. Int. Ed. 2020, 59, 9868–9886. [Google Scholar] [CrossRef]
- Freudenberg, J.; Bunz, U.H.F. Perarylation as a strategy toward aggregation-induced emitters: Will they ever be stable? In Principles and Applications of Aggregation-Induced Emission; Tang, Y., Tang, B.Z., Eds.; Springer International Publishing: Cham, Switzerland, 2019; pp. 1–25. [Google Scholar]
- Mao, D.; Ding, D. AIE nanoparticles for in vitro and in vivo imaging. In Aggregation-Induced Emission: Materials and Applications; Fujiki, M., Liu, B., Tang, B.Z., Eds.; American Chemical Society: Washington, DC, USA, 2016; Volume 2, pp. 217–243. [Google Scholar]
- Naghibi, S.; Chen, T.; Jamshidi Ghahfarokhi, A.; Tang, Y. AIEgen-enhanced protein imaging: Probe design and sensing mechanisms. Aggregate 2021, 2, e41. [Google Scholar]
- Reza, A.M.; Zhou, Y.; Qin, J.; Tang, Y. Aggregation-induced emission luminogens for lipid droplet imaging. In Progress in Molecular Biology and Translational Science; Elsevier: Cambridge, MA, USA, 2021; Volume 184, pp. 101–144. [Google Scholar]
- Zhang, X.; Wan, Q.; Liu, M.; Wei, Y. Aggregation-induced emission polymers. In Encyclopedia of Polymer Science and Technology; Wiley: Hoboken, NJ, USA, 2002; pp. 1–60. [Google Scholar]
- Chen, J.-I.; Wu, W.-C. Fluorescent polymeric micelles with aggregation-induced emission properties for monitoring the encapsulation of doxorubicin. Macromol. Biosci. 2013, 13, 623–632. [Google Scholar] [CrossRef]
- Zhang, C.; Jin, S.; Li, S.; Xue, X.; Liu, J.; Huang, Y.; Jiang, Y.; Chen, W.-Q.; Zou, G.; Liang, X.-J. Imaging intracellular anticancer drug delivery by self-assembly micelles with aggregation-induced emission (AIE Micelles). ACS Appl. Mater. Interfaces 2014, 6, 5212–5220. [Google Scholar] [CrossRef]
- Yuan, Y.; Kwok, R.T.K.; Zhang, R.; Tang, B.Z.; Liu, B. Targeted theranostic prodrugs based on an aggregation-induced emission (AIE) luminogen for real-time dual-drug tracking. Chem. Commun. 2014, 50, 11465–11468. [Google Scholar] [CrossRef] [PubMed]
- Wang, L.; Zhang, H.; Qin, A.; Jin, Q.; Tang, B.Z.; Ji, J. Theranostic hyaluronic acid prodrug micelles with aggregation-induced emission characteristics for targeted drug delivery. Sci. China Chem. 2016, 59, 1609–1615. [Google Scholar] [CrossRef]
- Liow, S.S.; Dou, Q.; Kai, D.; Li, Z.; Sugiarto, S.; Yu, C.Y.Y.; Kwok, R.T.K.; Chen, X.; Wu, Y.-L.; Ong, S.T.; et al. Long-term real-time in vivo drug release monitoring with AIE thermogelling polymer. Small 2017, 13, 1603404. [Google Scholar] [CrossRef]
- Wang, T.-T.; Wei, Q.-C.; Zhang, Z.-T.; Lin, M.-T.; Chen, J.-J.; Zhou, Y.; Guo, N.-N.; Zhong, X.-C.; Xu, W.-H.; Liu, Z.-X.; et al. AIE/FRET-based versatile PEG-Pep-TPE/DOX nanoparticles for cancer therapy and real-time drug release monitoring. Biomater. Sci. 2020, 8, 118–124. [Google Scholar] [CrossRef] [PubMed]
- Dong, Z.; Bi, Y.; Cui, H.; Wang, Y.; Wang, C.; Li, Y.; Jin, H.; Wang, C. AIE supramolecular assembly with FRET effect for visualizing drug delivery. ACS Appl. Mater. Interfaces 2019, 11, 23840–23847. [Google Scholar] [CrossRef] [PubMed]
- Liu, Z.; Wang, Q.; Zhu, Z.; Liu, M.; Zhao, X.; Zhu, W.-H. AIE-based nanoaggregate tracker: High-fidelity visualization of lysosomal movement and drug-escaping processes. Chem. Sci. 2020, 11, 12755–12763. [Google Scholar] [CrossRef] [PubMed]
- Wang, Y.; Zhang, Y.; Wang, J.; Liang, X.-J. Aggregation-induced emission (AIE) fluorophores as imaging tools to trace the biological fate of nano-based drug delivery systems. Adv. Drug Deliv. Rev. 2019, 143, 161–176. [Google Scholar] [CrossRef]
- Wang, C.; Wang, Z.; Zhao, X.; Yu, F.; Quan, Y.; Cheng, Y.; Yuan, H. DOX loaded aggregation-induced emission active polymeric nanoparticles as a fluorescence resonance energy transfer traceable drug delivery system for self-indicating cancer therapy. Acta Biomater. 2019, 85, 218–228. [Google Scholar] [CrossRef]
- Gao, X.; Cao, J.; Song, Y.; Shu, X.; Liu, J.; Sun, J.Z.; Liu, B.; Tang, B.Z. A unimolecular theranostic system with H2O2-specific response and AIE-activity for doxorubicin releasing and real-time tracking in living cells. RSC Adv. 2018, 8, 10975–10979. [Google Scholar] [CrossRef] [Green Version]
- Ma, C.; Han, T.; Kang, M.; Liarou, E.; Wemyss, A.M.; Efstathiou, S.; Tang, B.Z.; Haddleton, D. Aggregation-induced emission active polyacrylates via Cu-mediated reversible deactivation radical polymerization with bioimaging applications. ACS Macro Lett. 2020, 9, 769–775. [Google Scholar] [CrossRef]
- Zhao, Y.; Kwok, R.T.K.; Lam, J.W.Y.; Tang, B.Z. A highly fluorescent AIE-active theranostic agent with anti-tumor activity to specific cancer cells. Nanoscale 2016, 8, 12520–12523. [Google Scholar] [CrossRef] [PubMed] [Green Version]
- Ashjari, M.; Kazemi, M.; Abi, M.N.; Mohammadi, M.; Rafiezadeh, S.J. Poly (isopropyl-oxazoline) micelle nanocarrier as dual-responsive prodrug for targeted doxorubicin delivery. J. Drug Deliv. Sci. Technol. 2020, 59, 101914. [Google Scholar] [CrossRef]
- Farjadian, F.; Ghasemi, S.; Andami, Z.; Tamami, B. Thermo-responsive nanocarrier based on poly (N-isopropylacrylamide) serving as a smart doxorubicin delivery system. Iran. Polym. J. 2020, 29, 197–207. [Google Scholar] [CrossRef]
- Priegue, J.M.; Crisan, D.N.; Martínez-Costas, J.; Granja, J.R.; Fernandez-Trillo, F.; Montenegro, J. In situ functionalized polymers for siRNA delivery. Angew. Chem. Int. Ed. 2016, 55, 7492–7495. [Google Scholar] [CrossRef] [PubMed] [Green Version]
- Zhai, J.; Suryadinata, R.; Luan, B.; Tran, N.; Hinton, T.M.; Ratcliffe, J.; Hao, X.; Drummond, C.J. Amphiphilic brush polymers produced using the RAFT polymerisation method stabilise and reduce the cell cytotoxicity of lipid lyotropic liquid crystalline nanoparticles. Faraday Discuss. 2016, 191, 545–563. [Google Scholar] [CrossRef] [PubMed]
- Zeng, Z.; Mo, X.-M.; He, C.; Morsi, Y.; El-Hamshary, H.; El-Newehy, M. An in situ forming tissue adhesive based on poly(ethylene glycol)-dimethacrylate and thiolated chitosan through the Michael reaction. J. Mater. Chem. B 2016, 4, 5585–5592. [Google Scholar] [CrossRef]
- Koech, J.; Shao, Q.; Mutua, F.; Wang, Y. Application of hydrazine hydrate in the synthesis of octa(aminophenyl)silsesquioxane (OAPS) poss. Adv. Chem. Eng. Sci. 2013, 3, 93–97. [Google Scholar] [CrossRef] [Green Version]
- Sonawane, S.J.; Kalhapure, R.S.; Govender, T. Hydrazone linkages in pH responsive drug delivery systems. Eur. J. Pharm. Sci. 2017, 99, 45–65. [Google Scholar] [CrossRef]
- Hao, G.; Xu, Z.; Li, L. Manipulating extracellular tumour pH: An effective target for cancer therapy. RSC Adv. 2018, 8, 22182–22192. [Google Scholar] [CrossRef] [Green Version]
- Thuy, V.T.T.; Lim, C.W.; Park, J.H.; Ahn, C.-H.; Kim, D. Self-assembled nanoaggregates based on polyaspartamide graft copolymers for pH-controlled release of doxorubicin. J. Mater. Chem. B 2015, 3, 2978–2985. [Google Scholar] [CrossRef]
- Kauffman, M.K.; Kauffman, M.E.; Zhu, H.; Jia, Z.; Li, Y.R. Fluorescence-based assays for measuring doxorubicin in biological systems. React. Oxyg. Species 2016, 2, 432–439. [Google Scholar] [CrossRef] [PubMed] [Green Version]


Publisher’s Note: MDPI stays neutral with regard to jurisdictional claims in published maps and institutional affiliations. |
© 2022 by the authors. Licensee MDPI, Basel, Switzerland. This article is an open access article distributed under the terms and conditions of the Creative Commons Attribution (CC BY) license (https://creativecommons.org/licenses/by/4.0/).
Share and Cite
Naghibi, S.; Sabouri, S.; Hong, Y.; Jia, Z.; Tang, Y. Brush-like Polymer Prodrug with Aggregation-Induced Emission Features for Precise Intracellular Drug Tracking. Biosensors 2022, 12, 373. https://doi.org/10.3390/bios12060373
Naghibi S, Sabouri S, Hong Y, Jia Z, Tang Y. Brush-like Polymer Prodrug with Aggregation-Induced Emission Features for Precise Intracellular Drug Tracking. Biosensors. 2022; 12(6):373. https://doi.org/10.3390/bios12060373
Chicago/Turabian StyleNaghibi, Sanaz, Soheila Sabouri, Yuning Hong, Zhongfan Jia, and Youhong Tang. 2022. "Brush-like Polymer Prodrug with Aggregation-Induced Emission Features for Precise Intracellular Drug Tracking" Biosensors 12, no. 6: 373. https://doi.org/10.3390/bios12060373
APA StyleNaghibi, S., Sabouri, S., Hong, Y., Jia, Z., & Tang, Y. (2022). Brush-like Polymer Prodrug with Aggregation-Induced Emission Features for Precise Intracellular Drug Tracking. Biosensors, 12(6), 373. https://doi.org/10.3390/bios12060373