Surface, Interface, and Temperature Effects on the Phase Separation and Nanoparticle Self Assembly of Bi-Metallic Ni0.5Ag0.5: A Molecular Dynamics Study


 ,
,  ,
,
Abstract
1. Introduction
2. Materials and Methods
3. Results
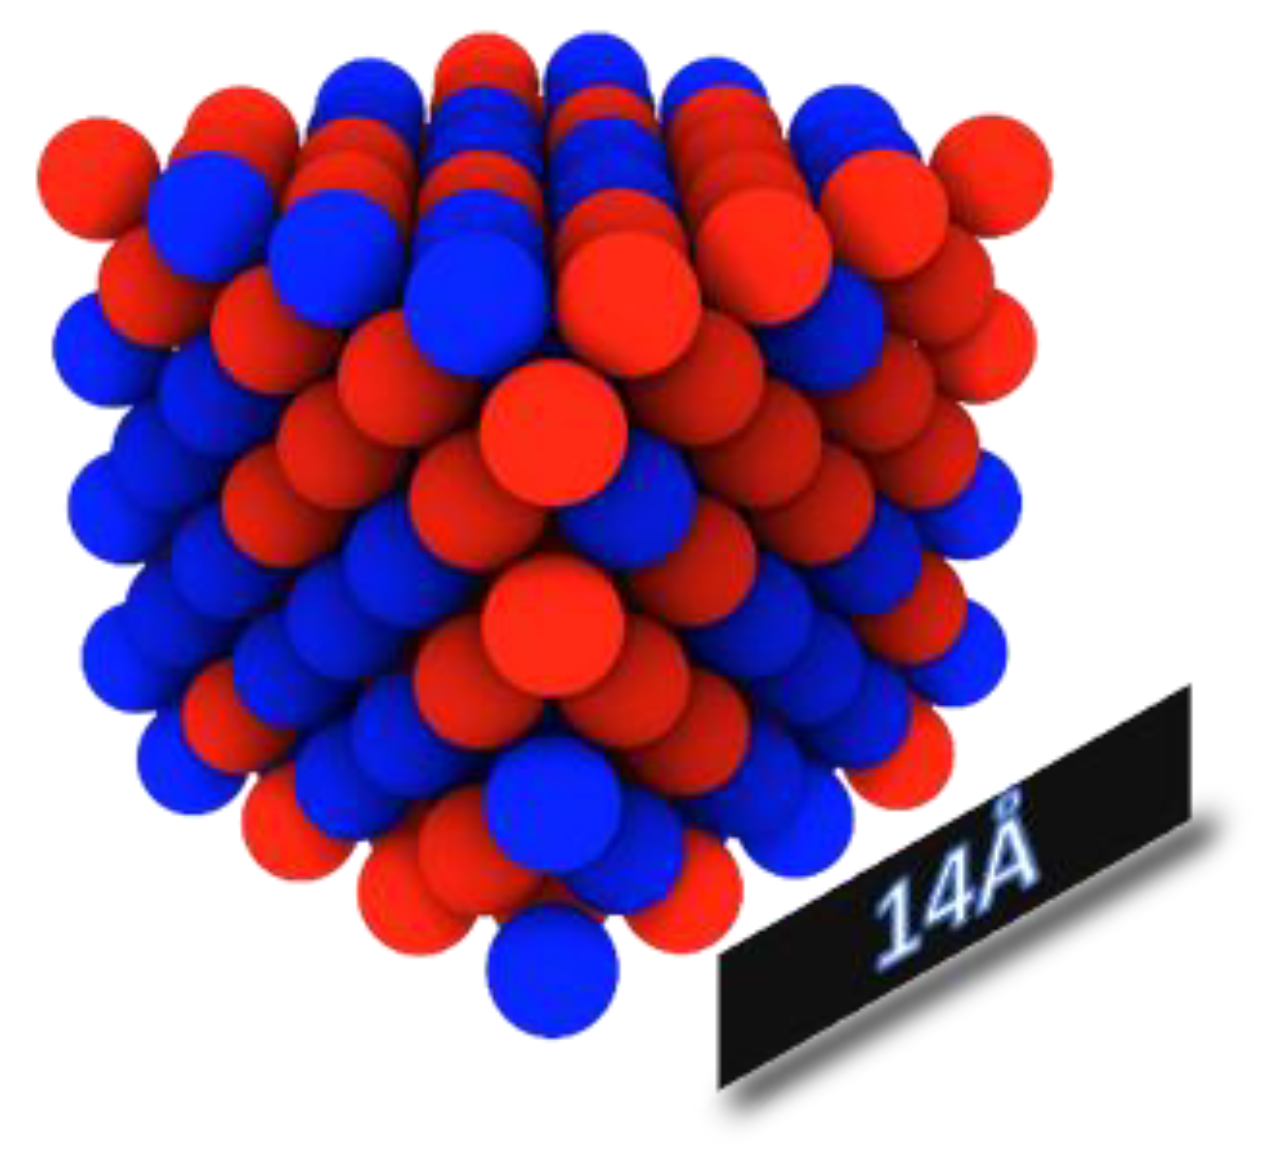
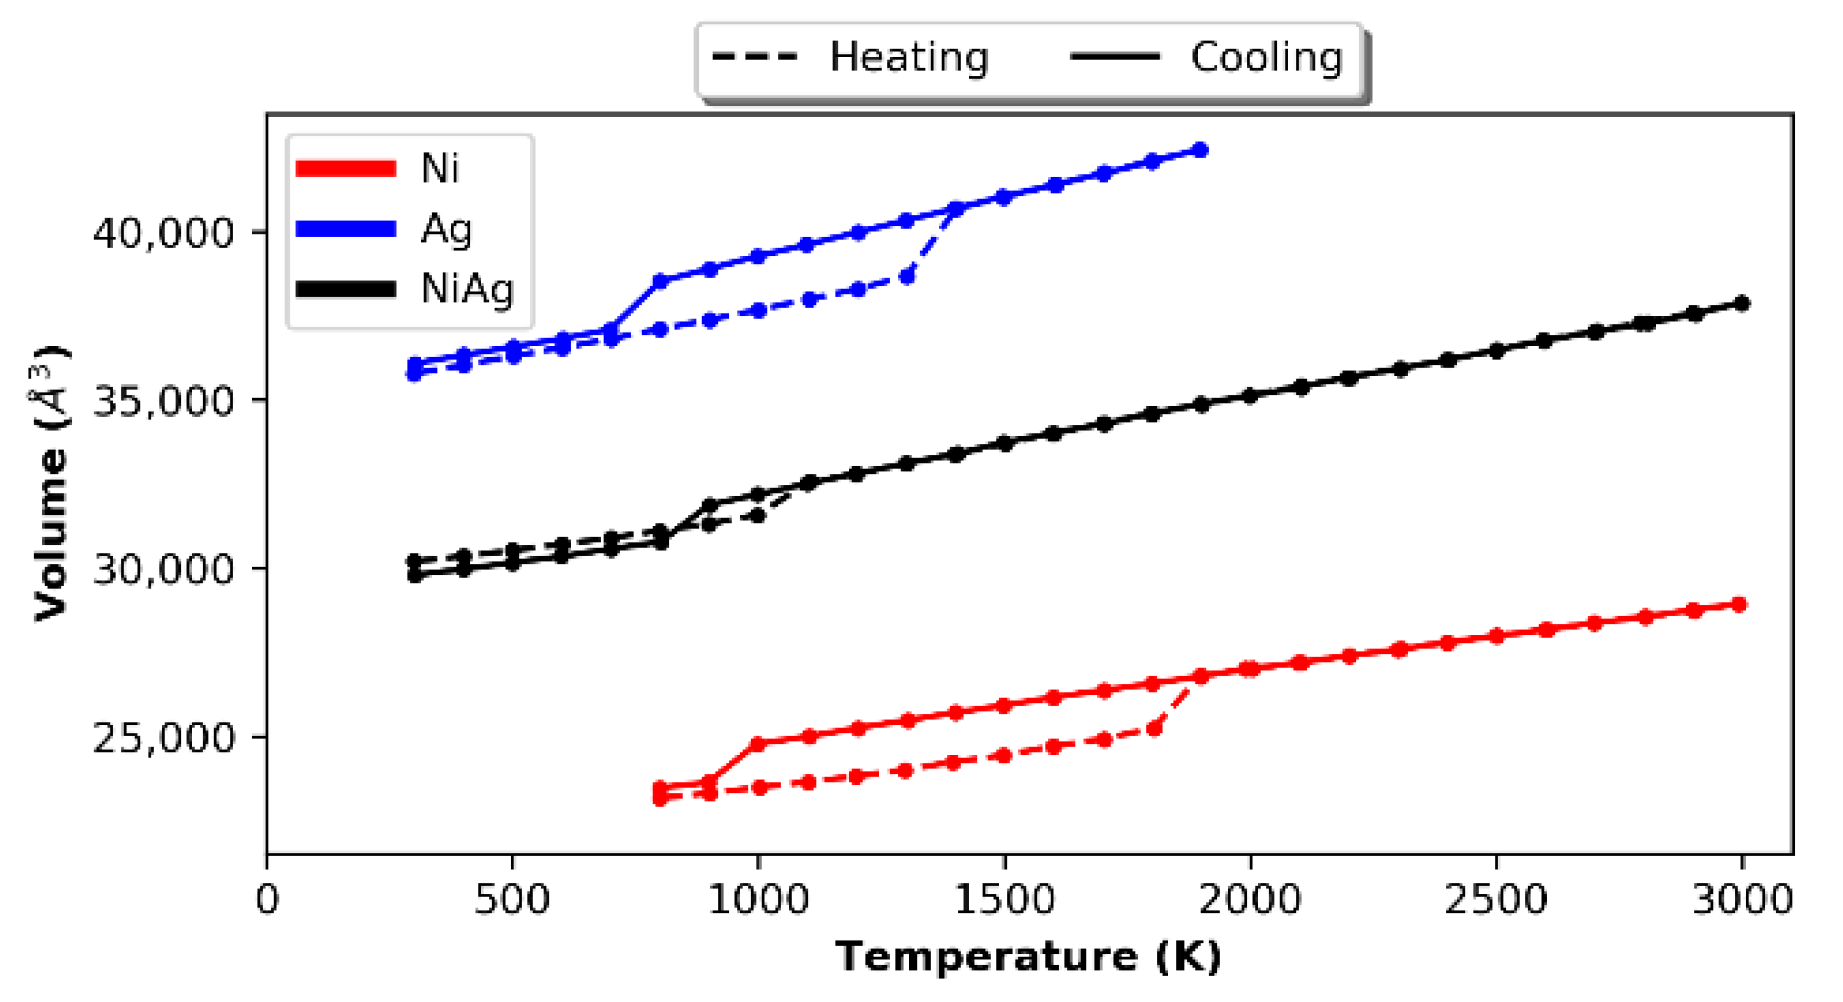
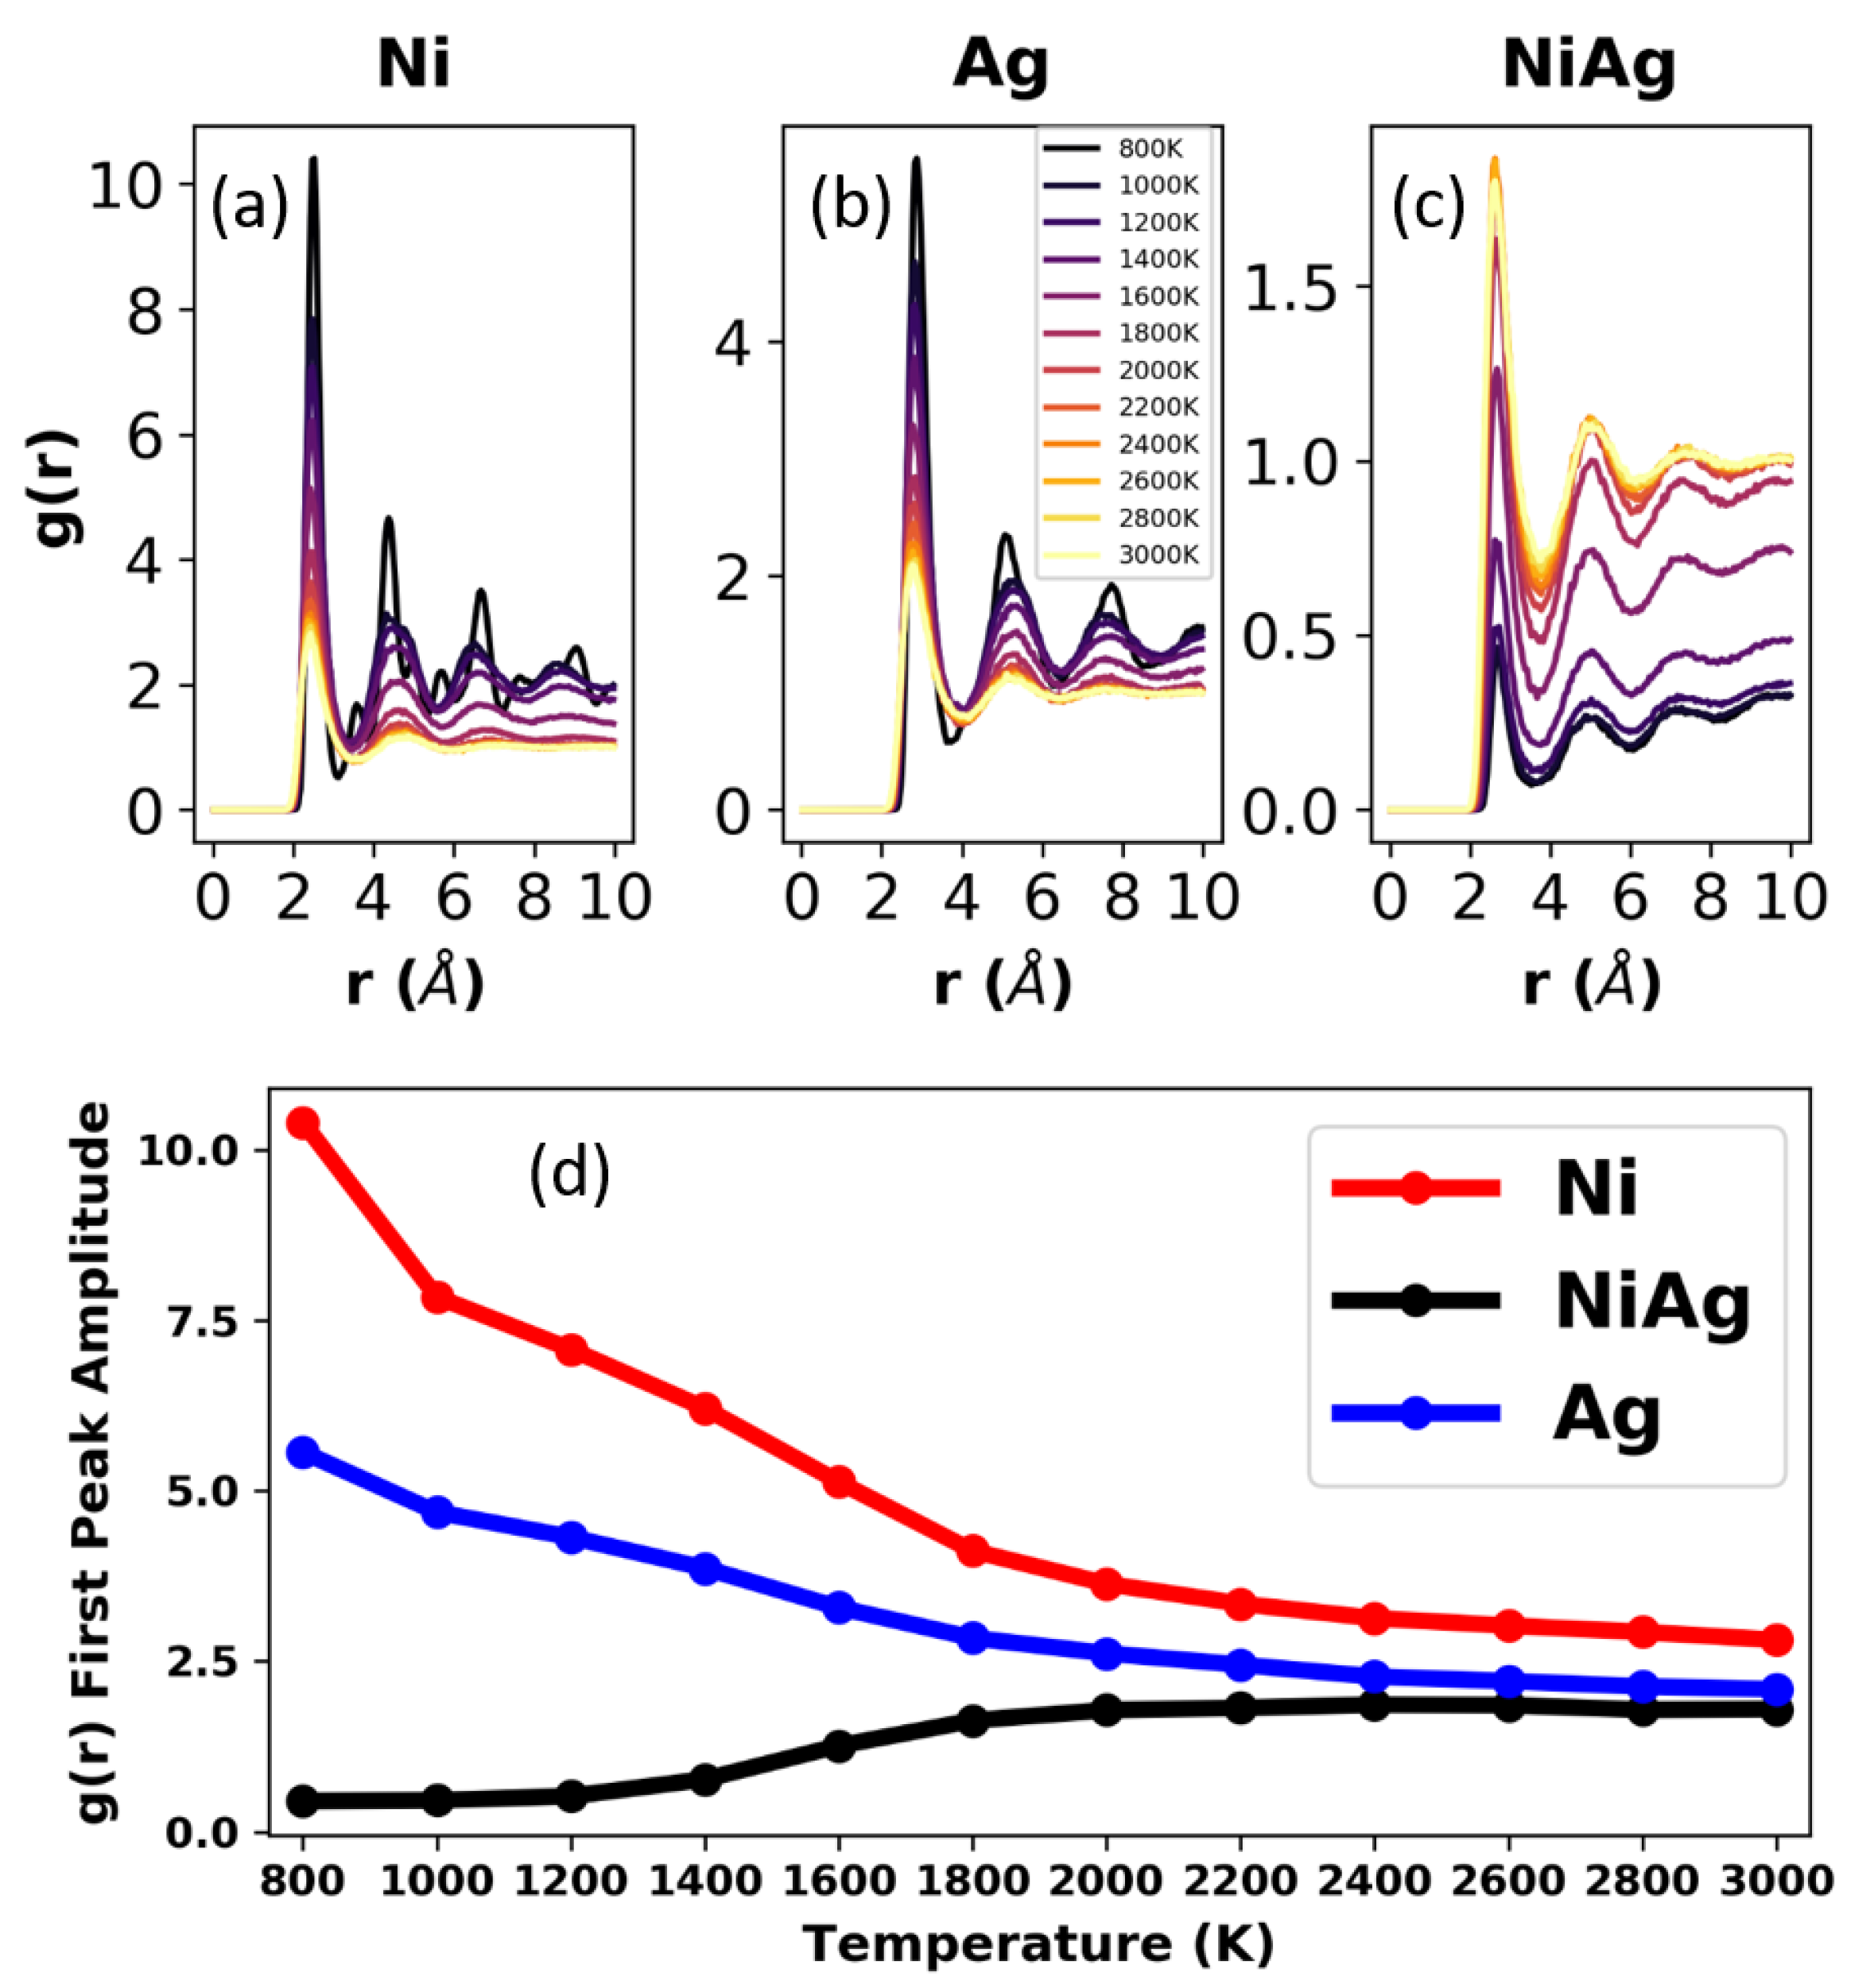
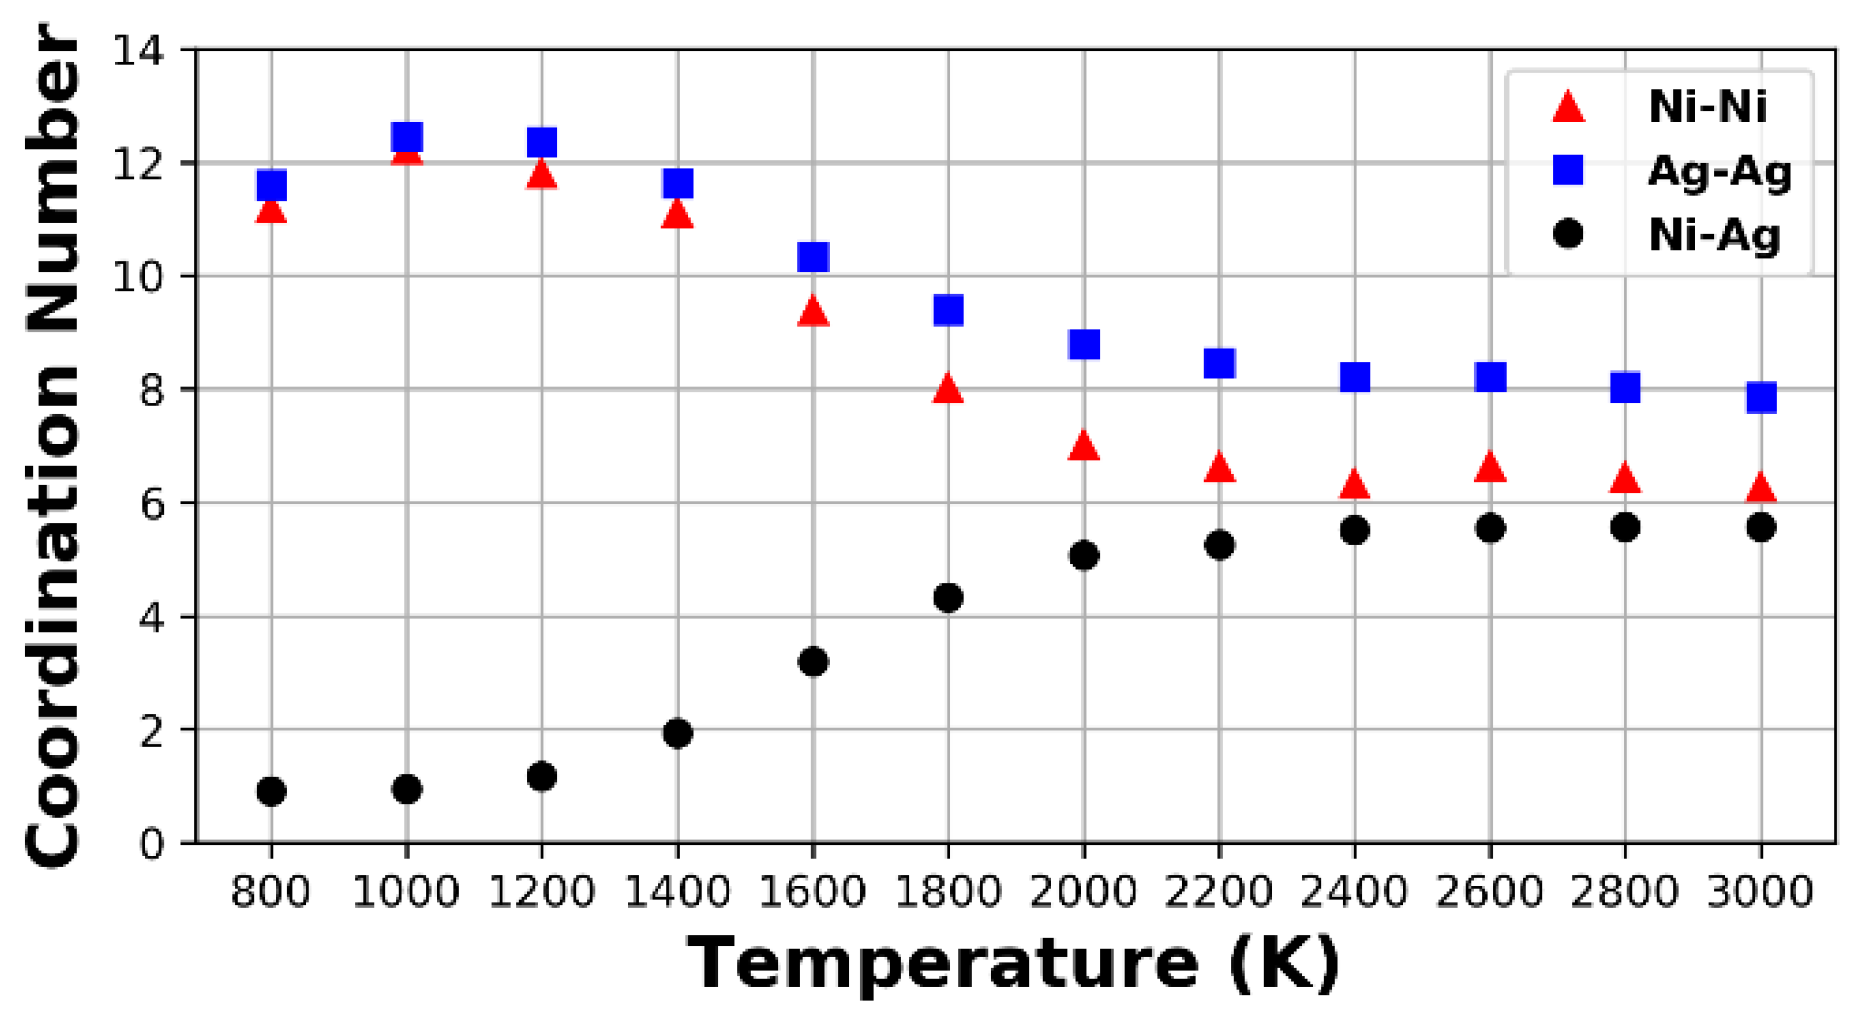
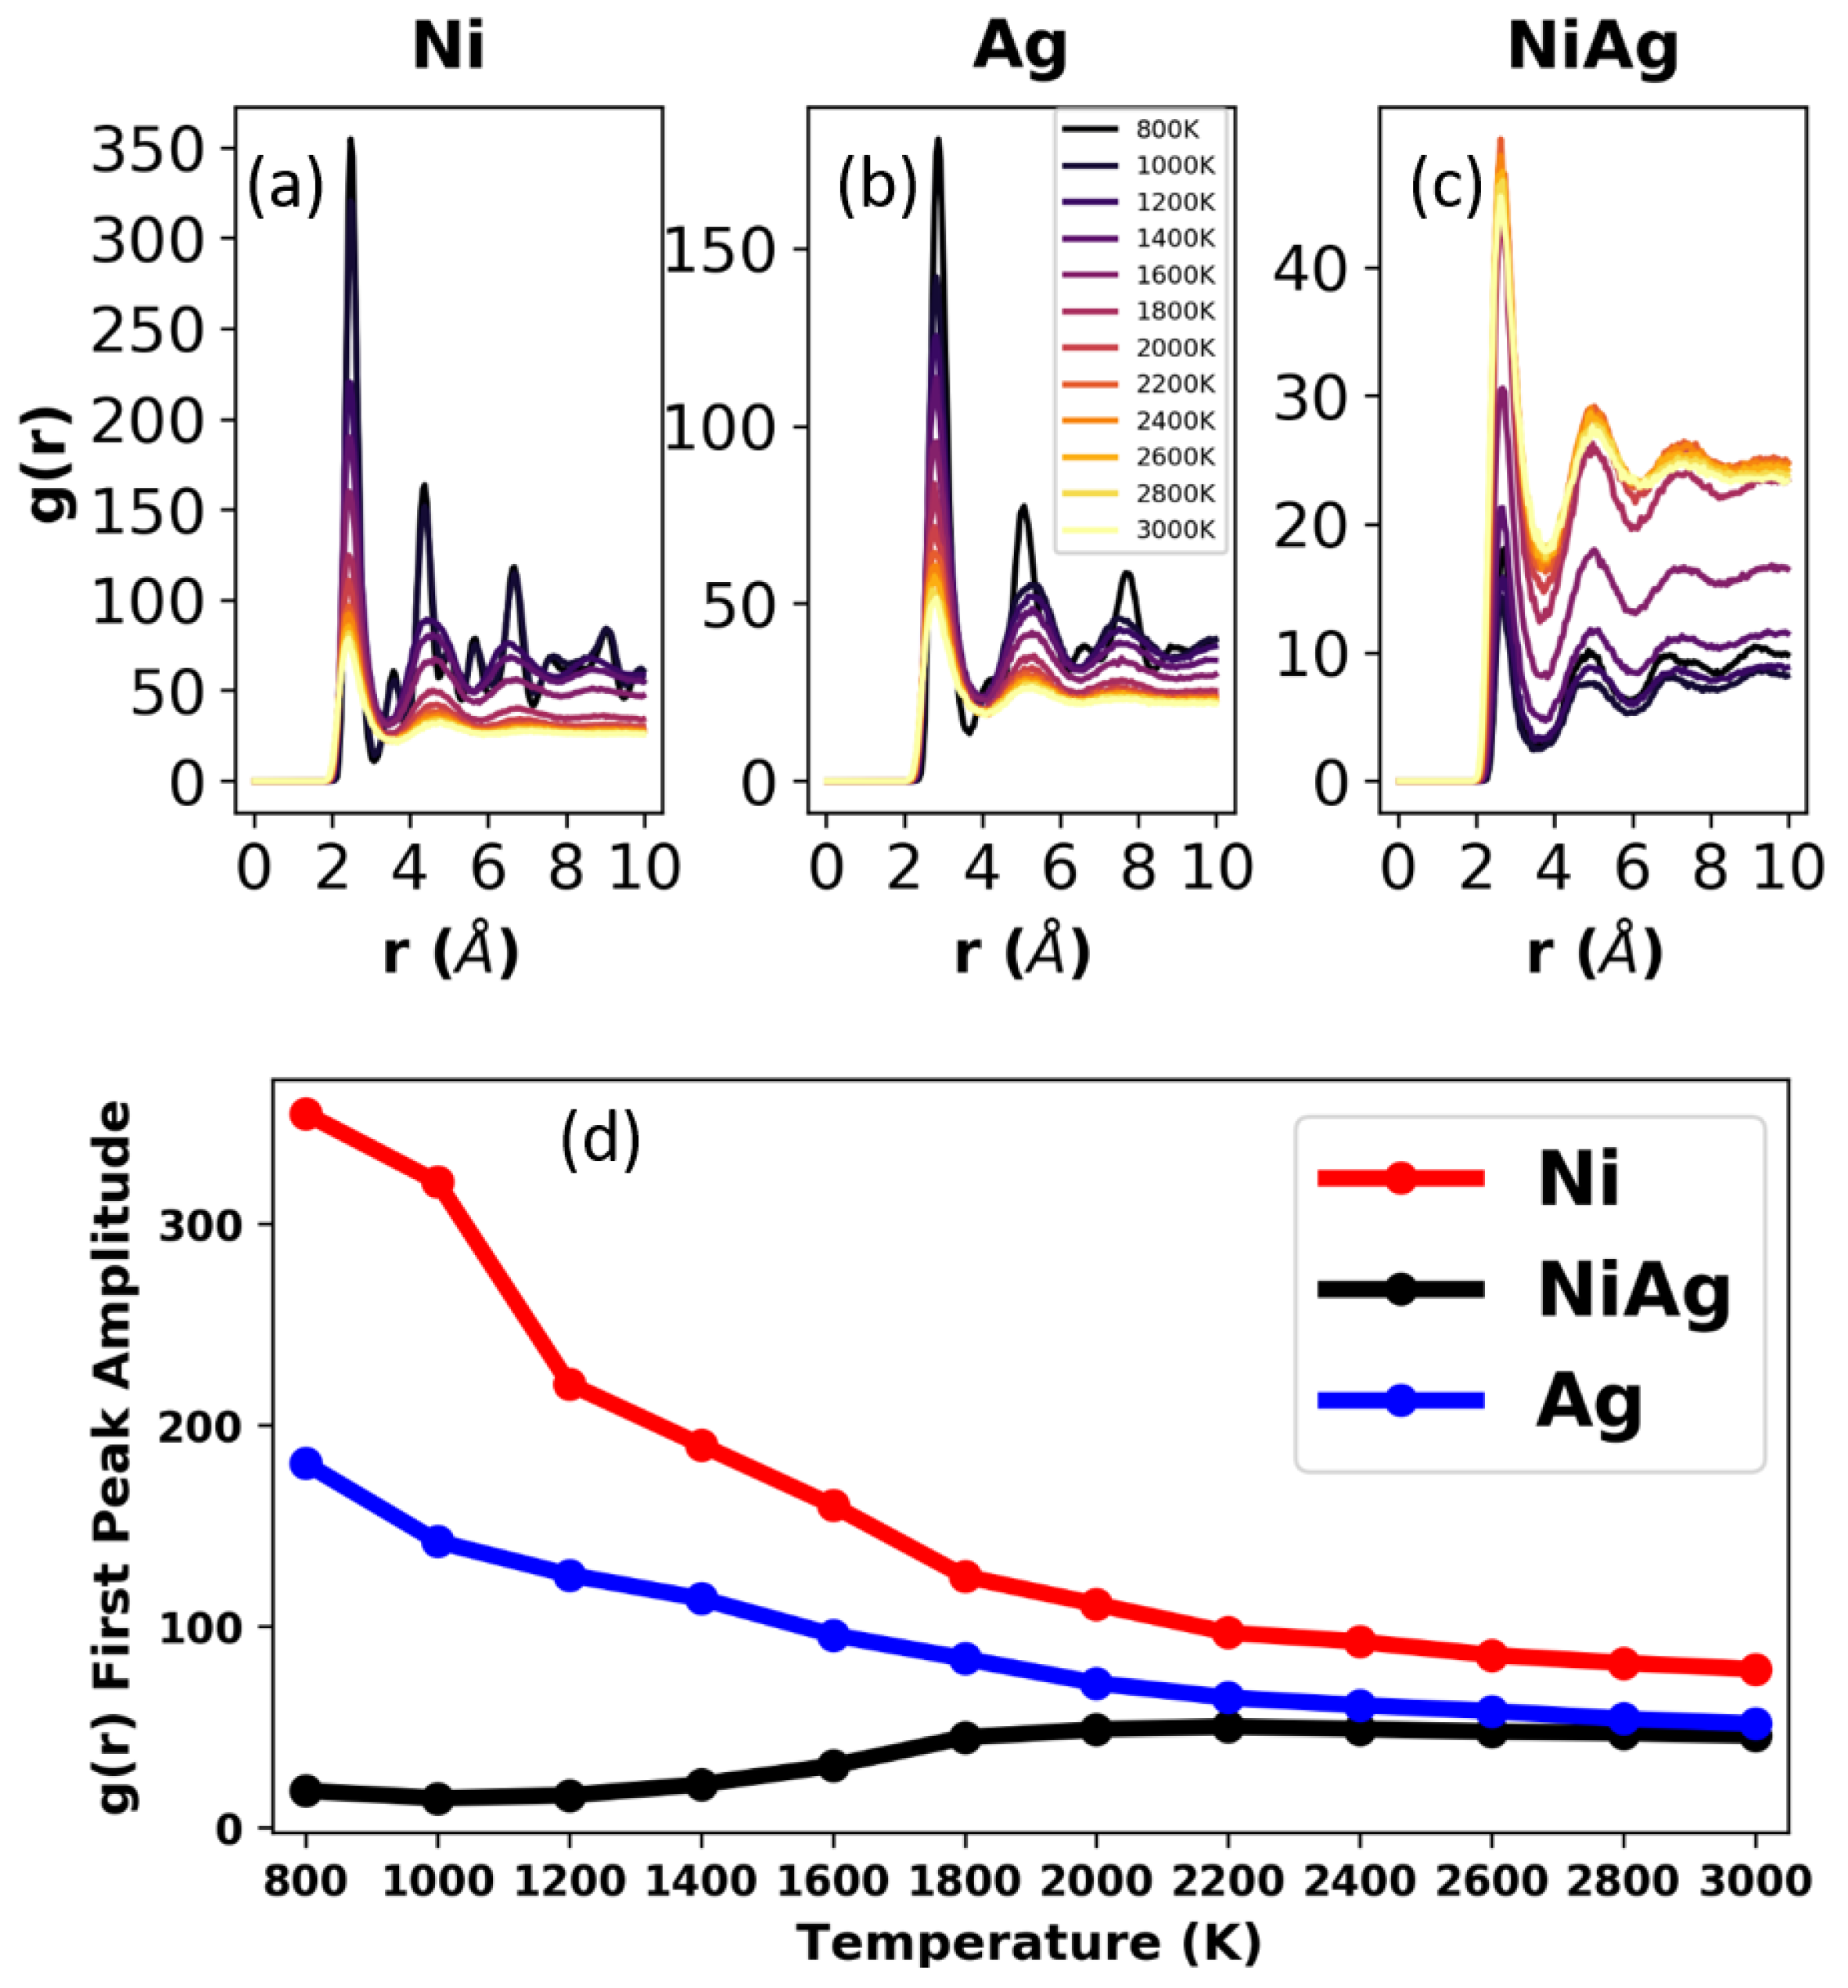
3.1. Bulk Samples
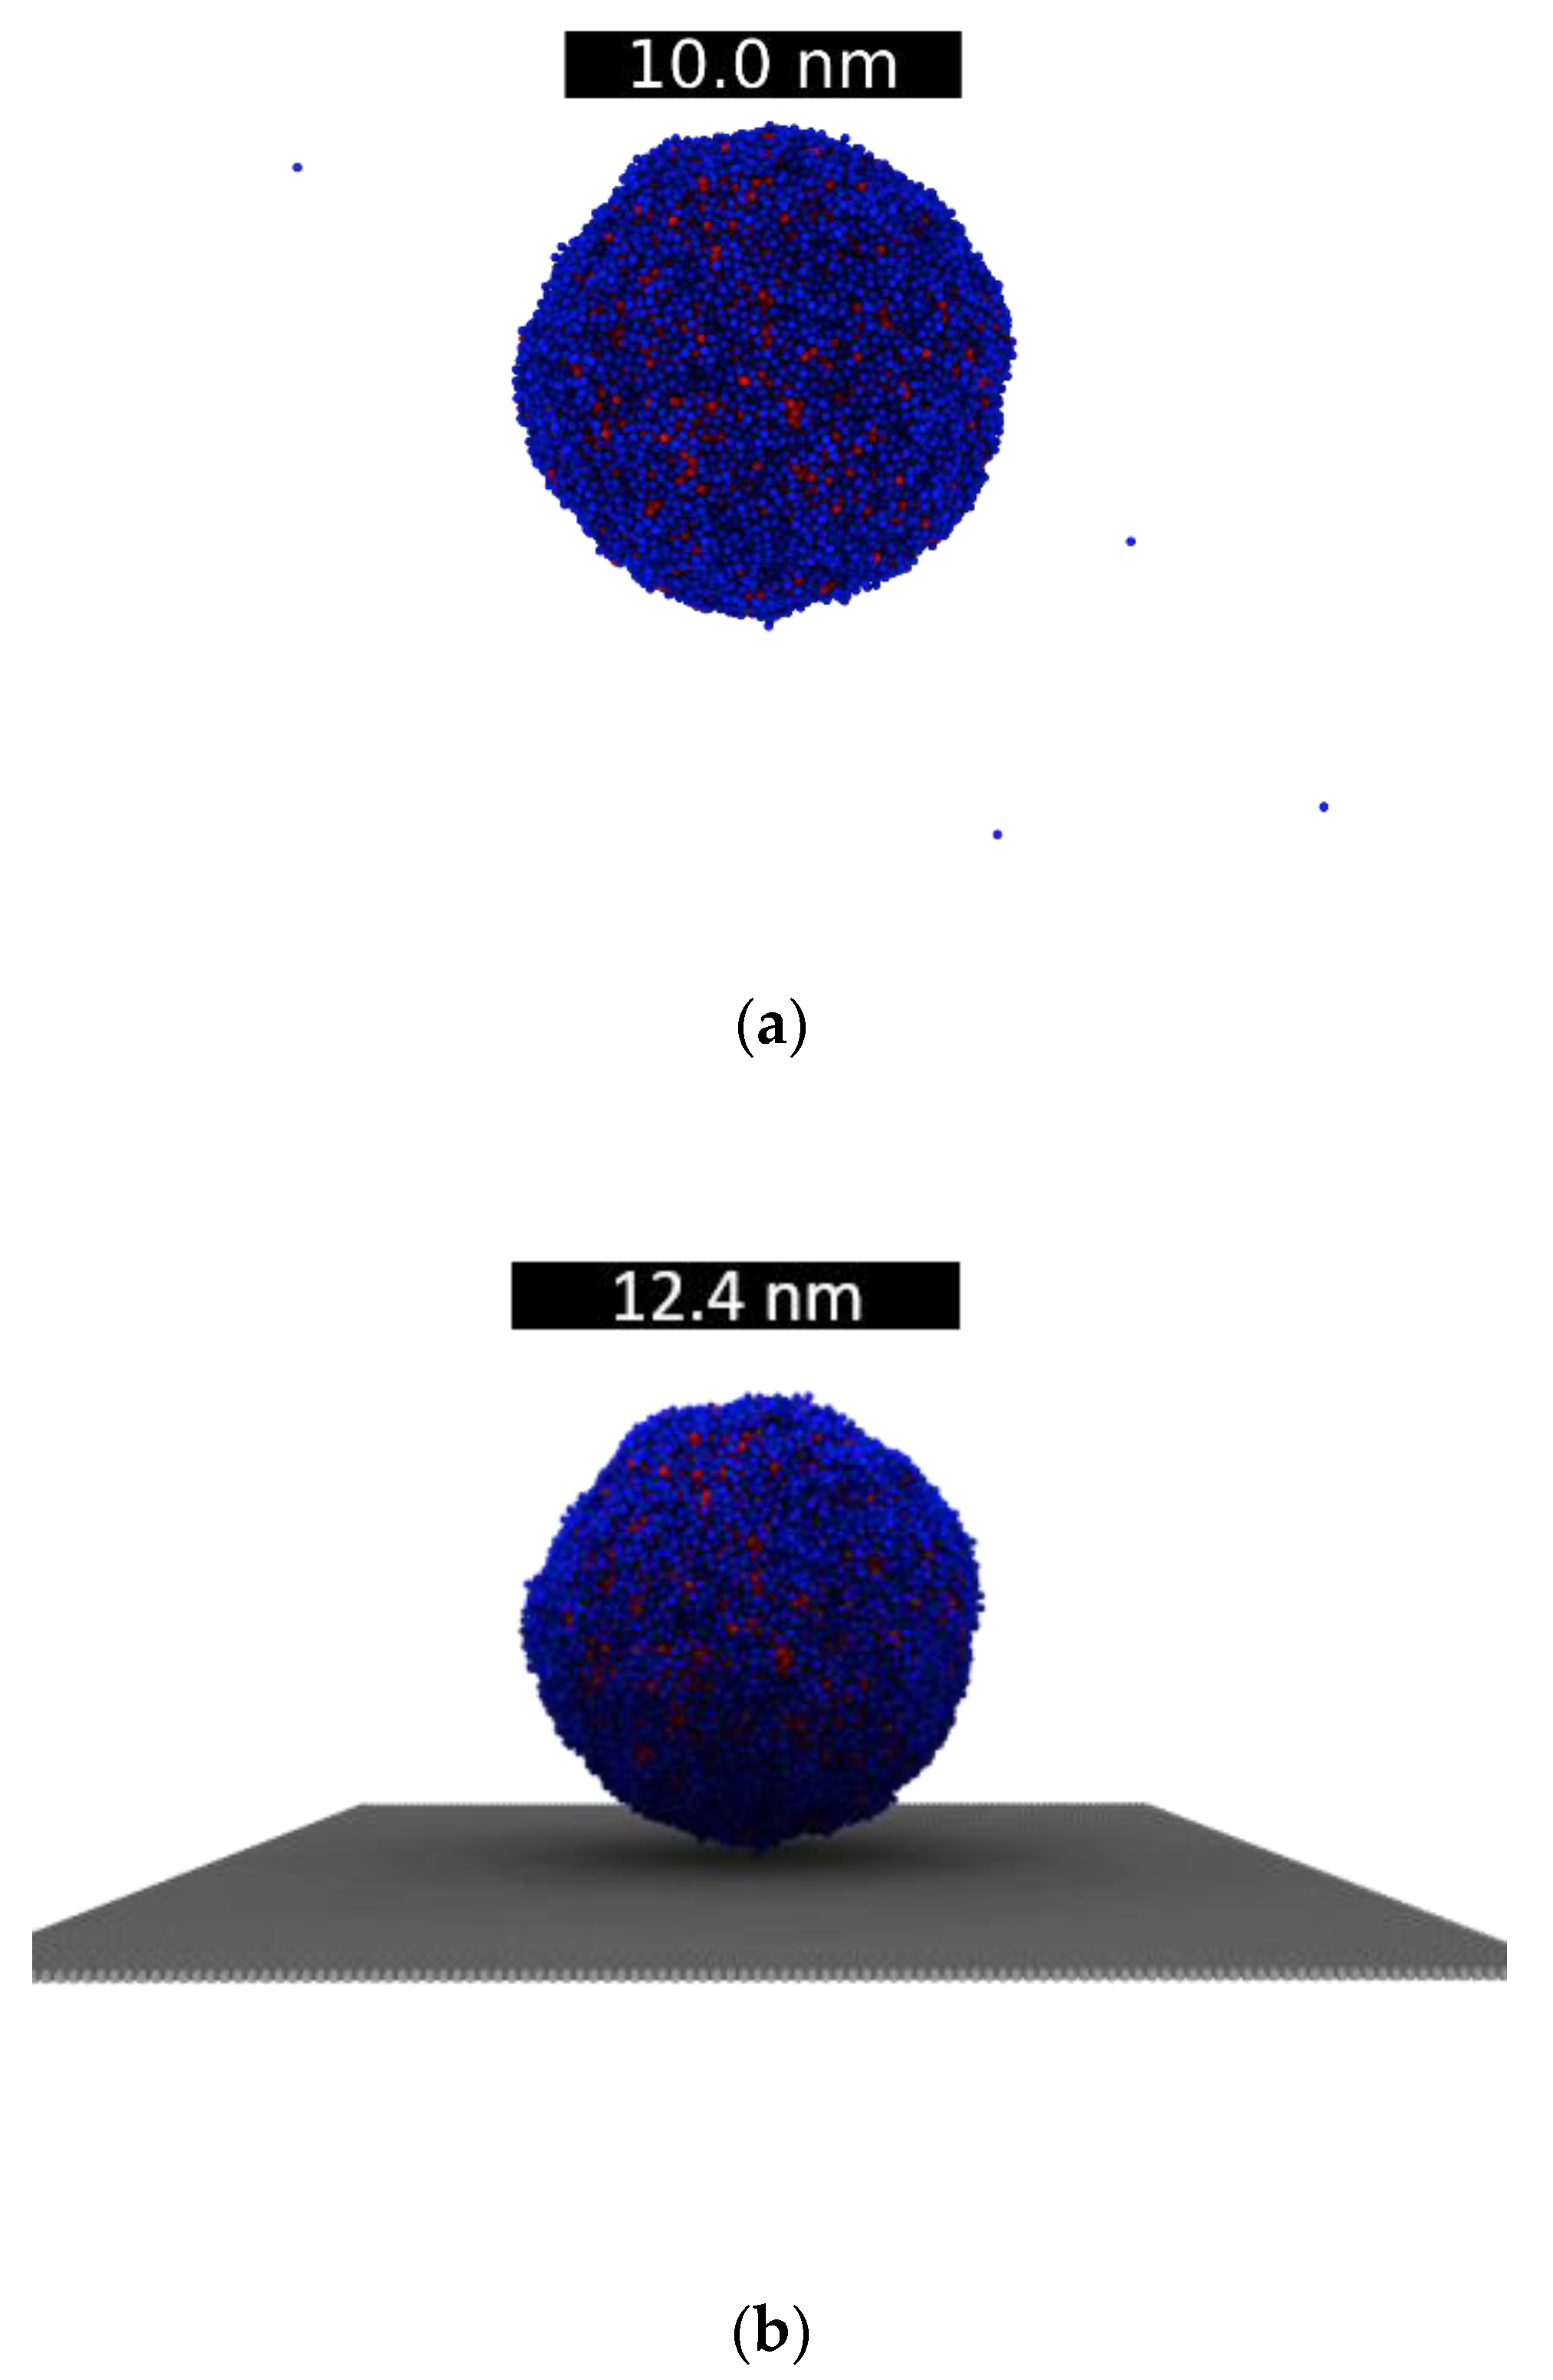
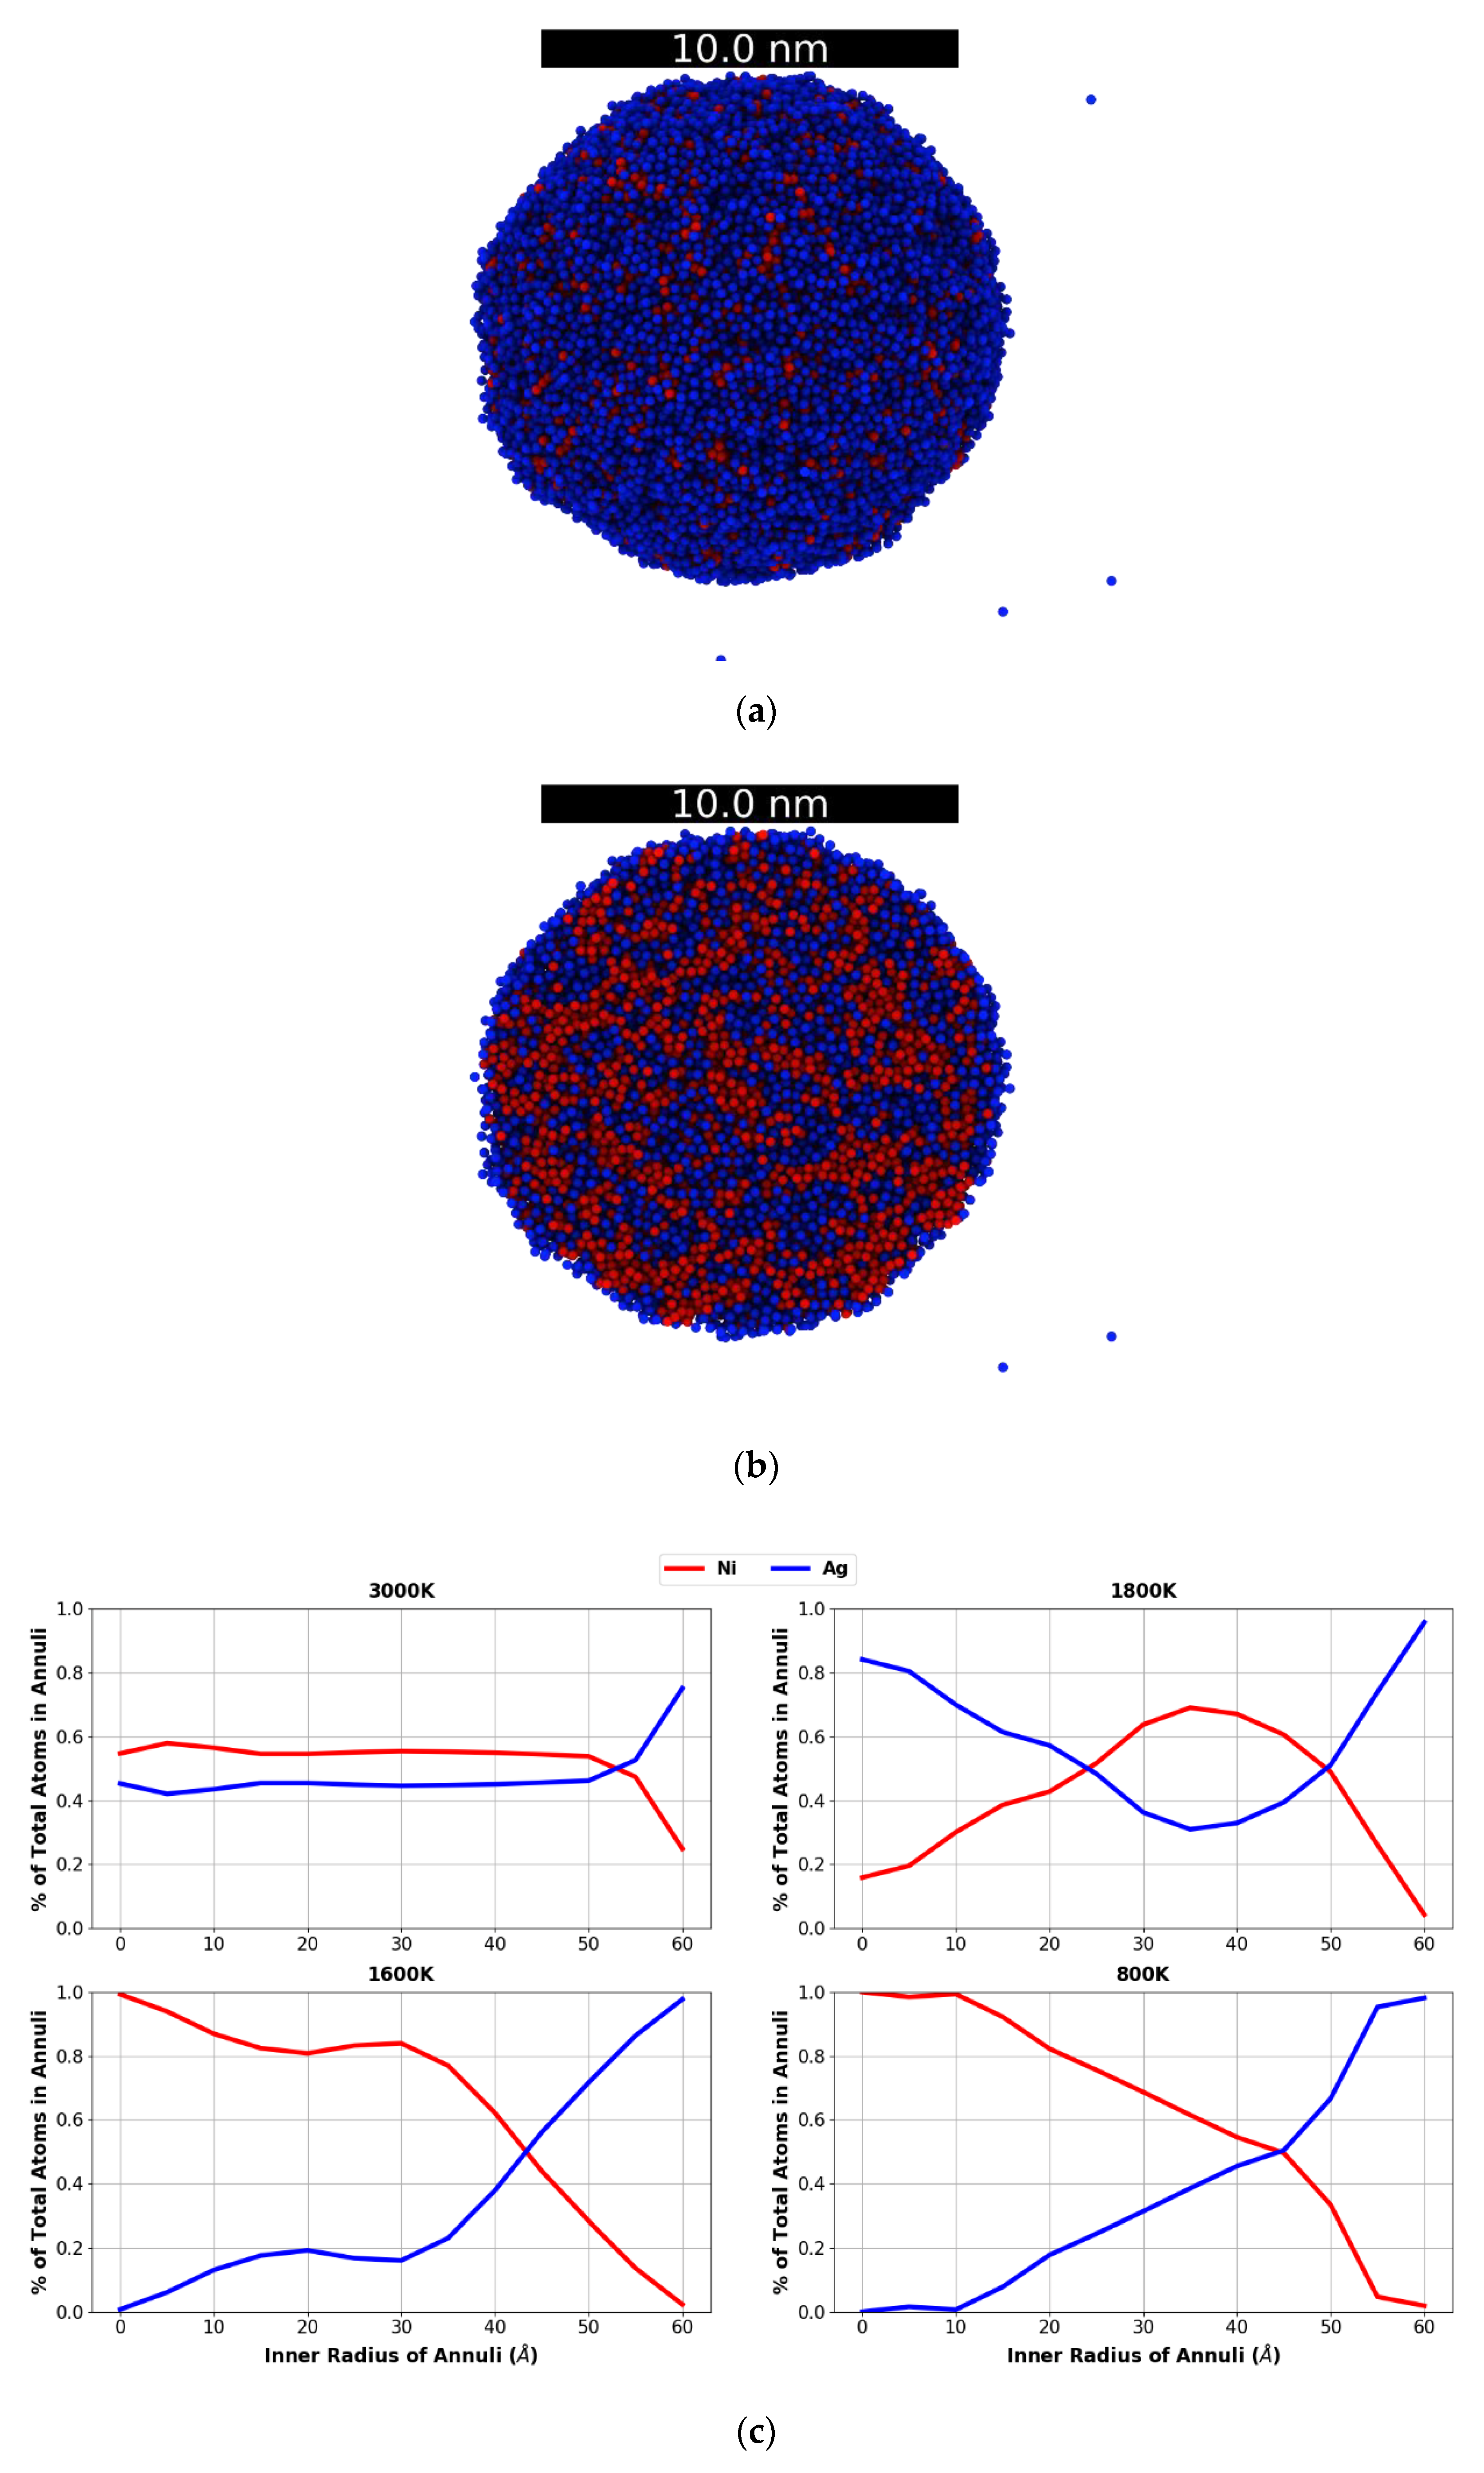
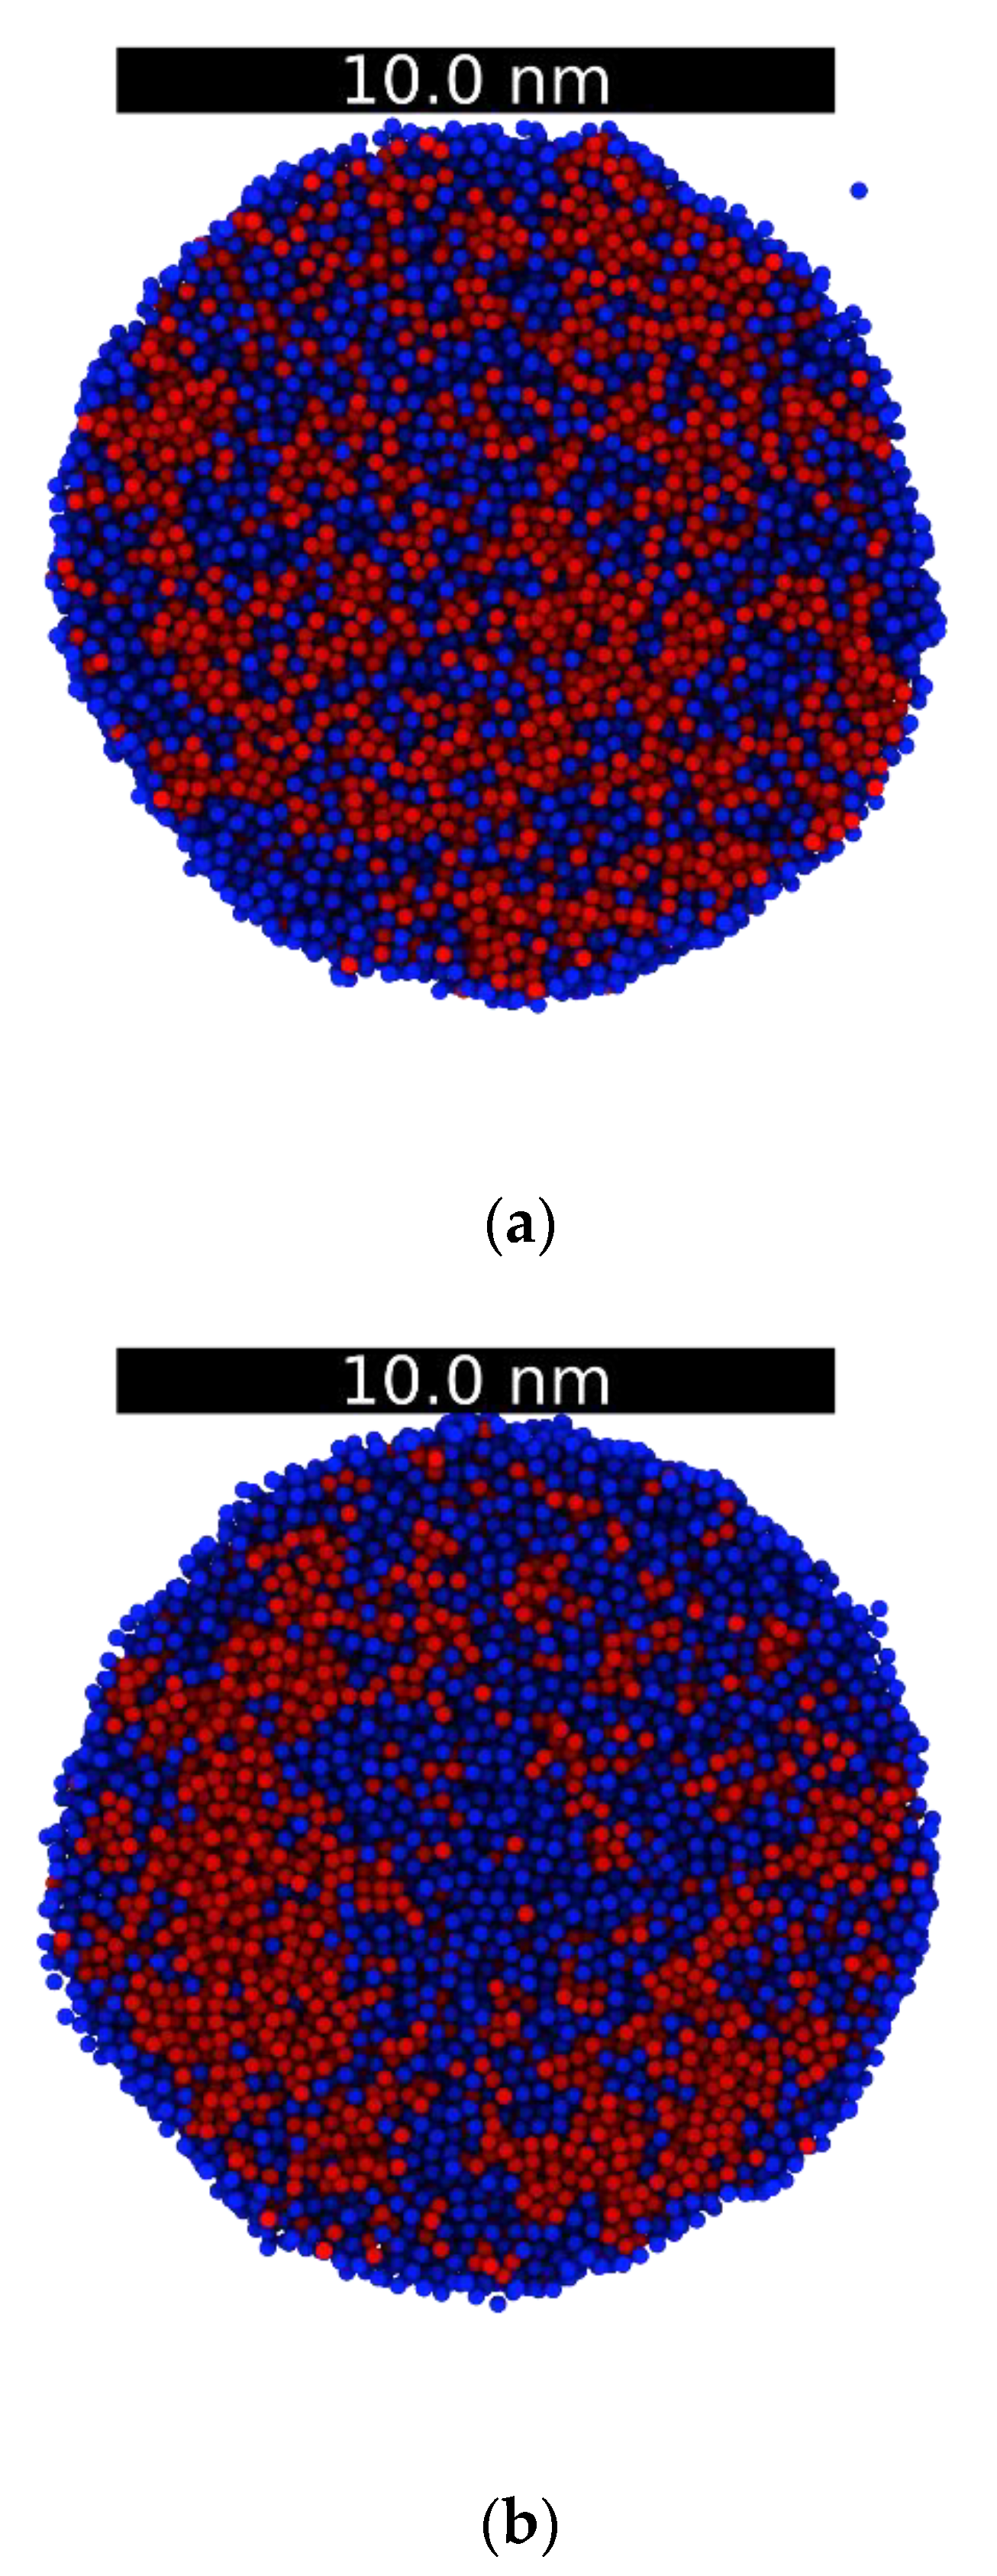
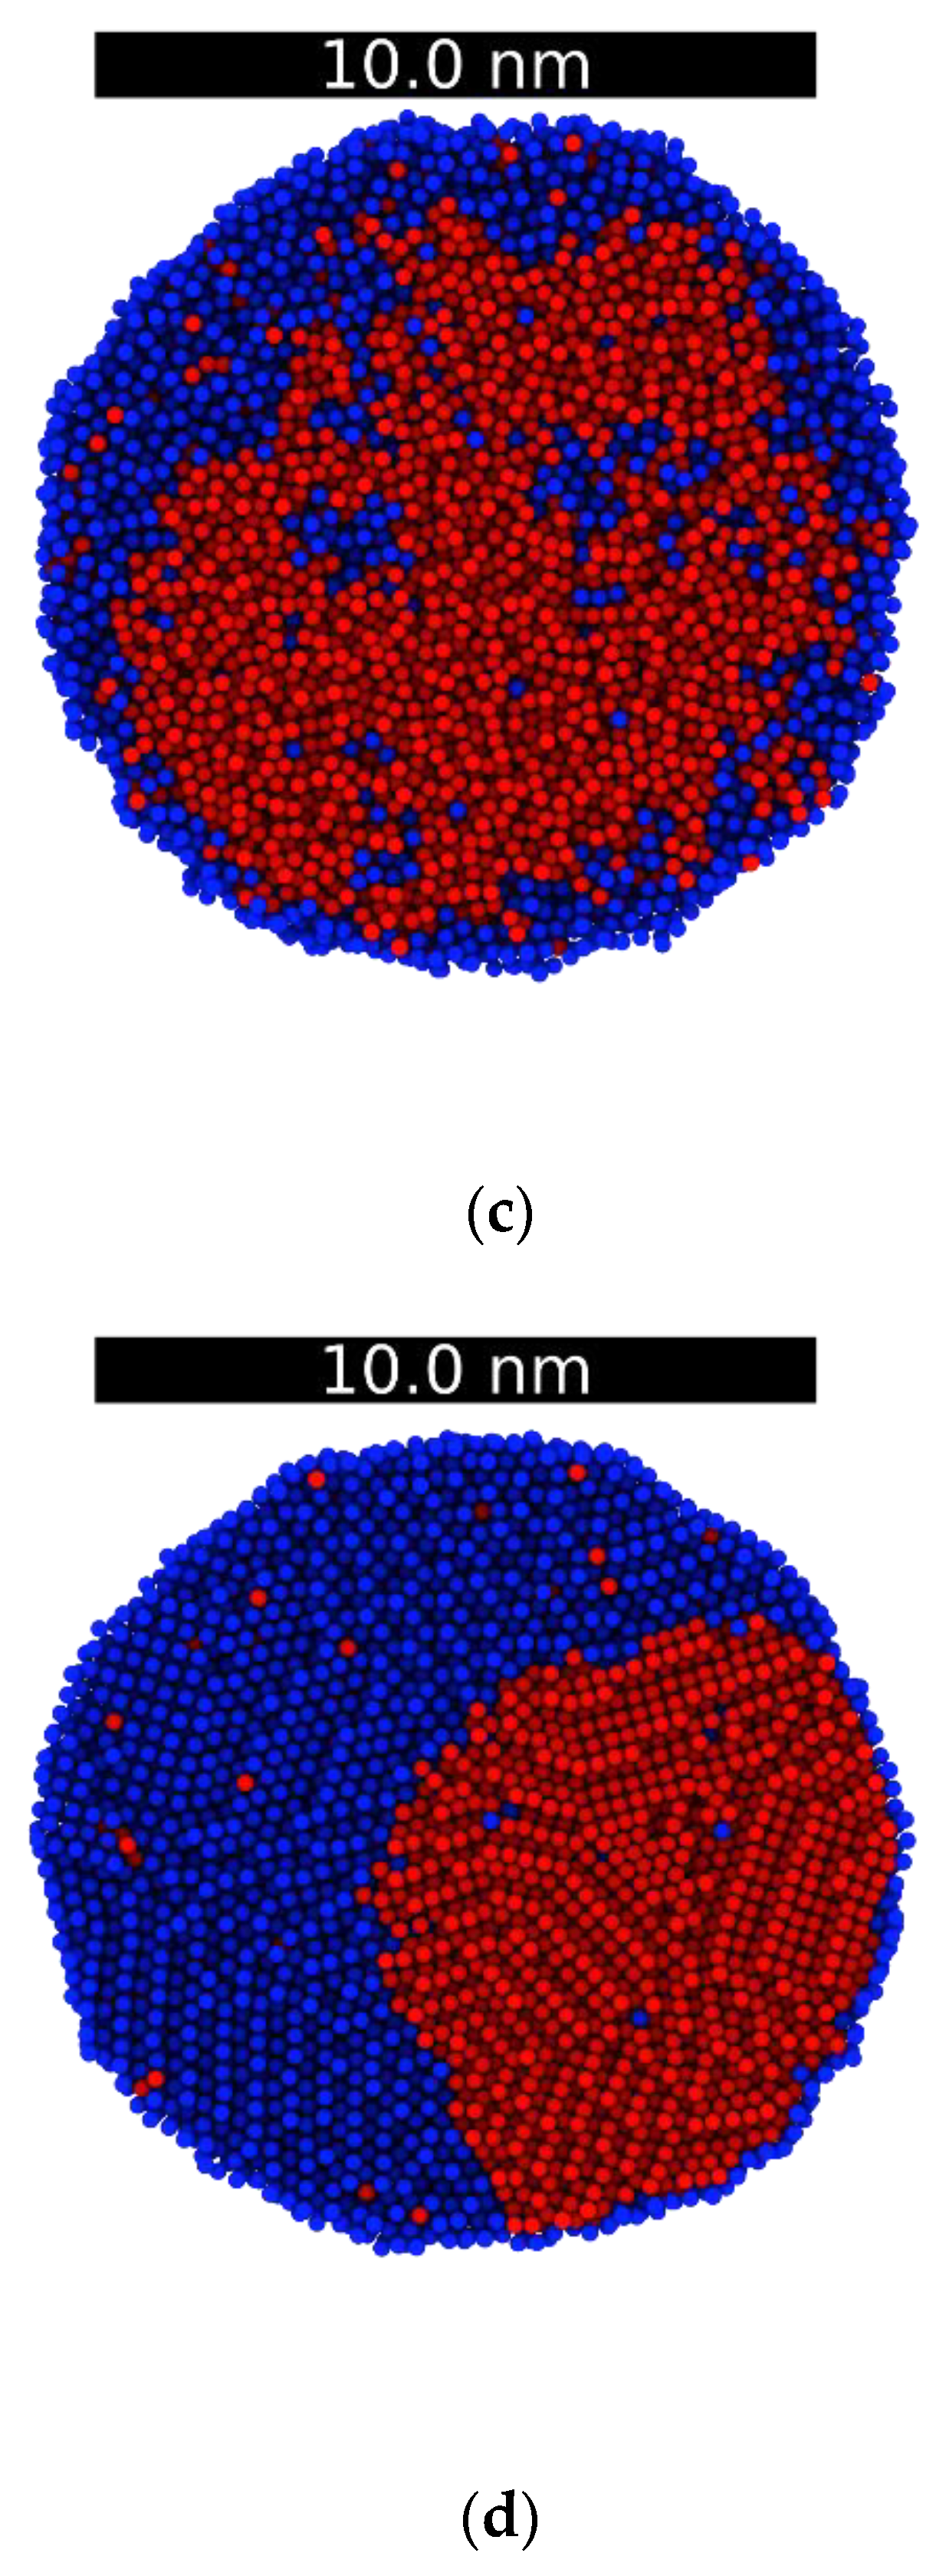
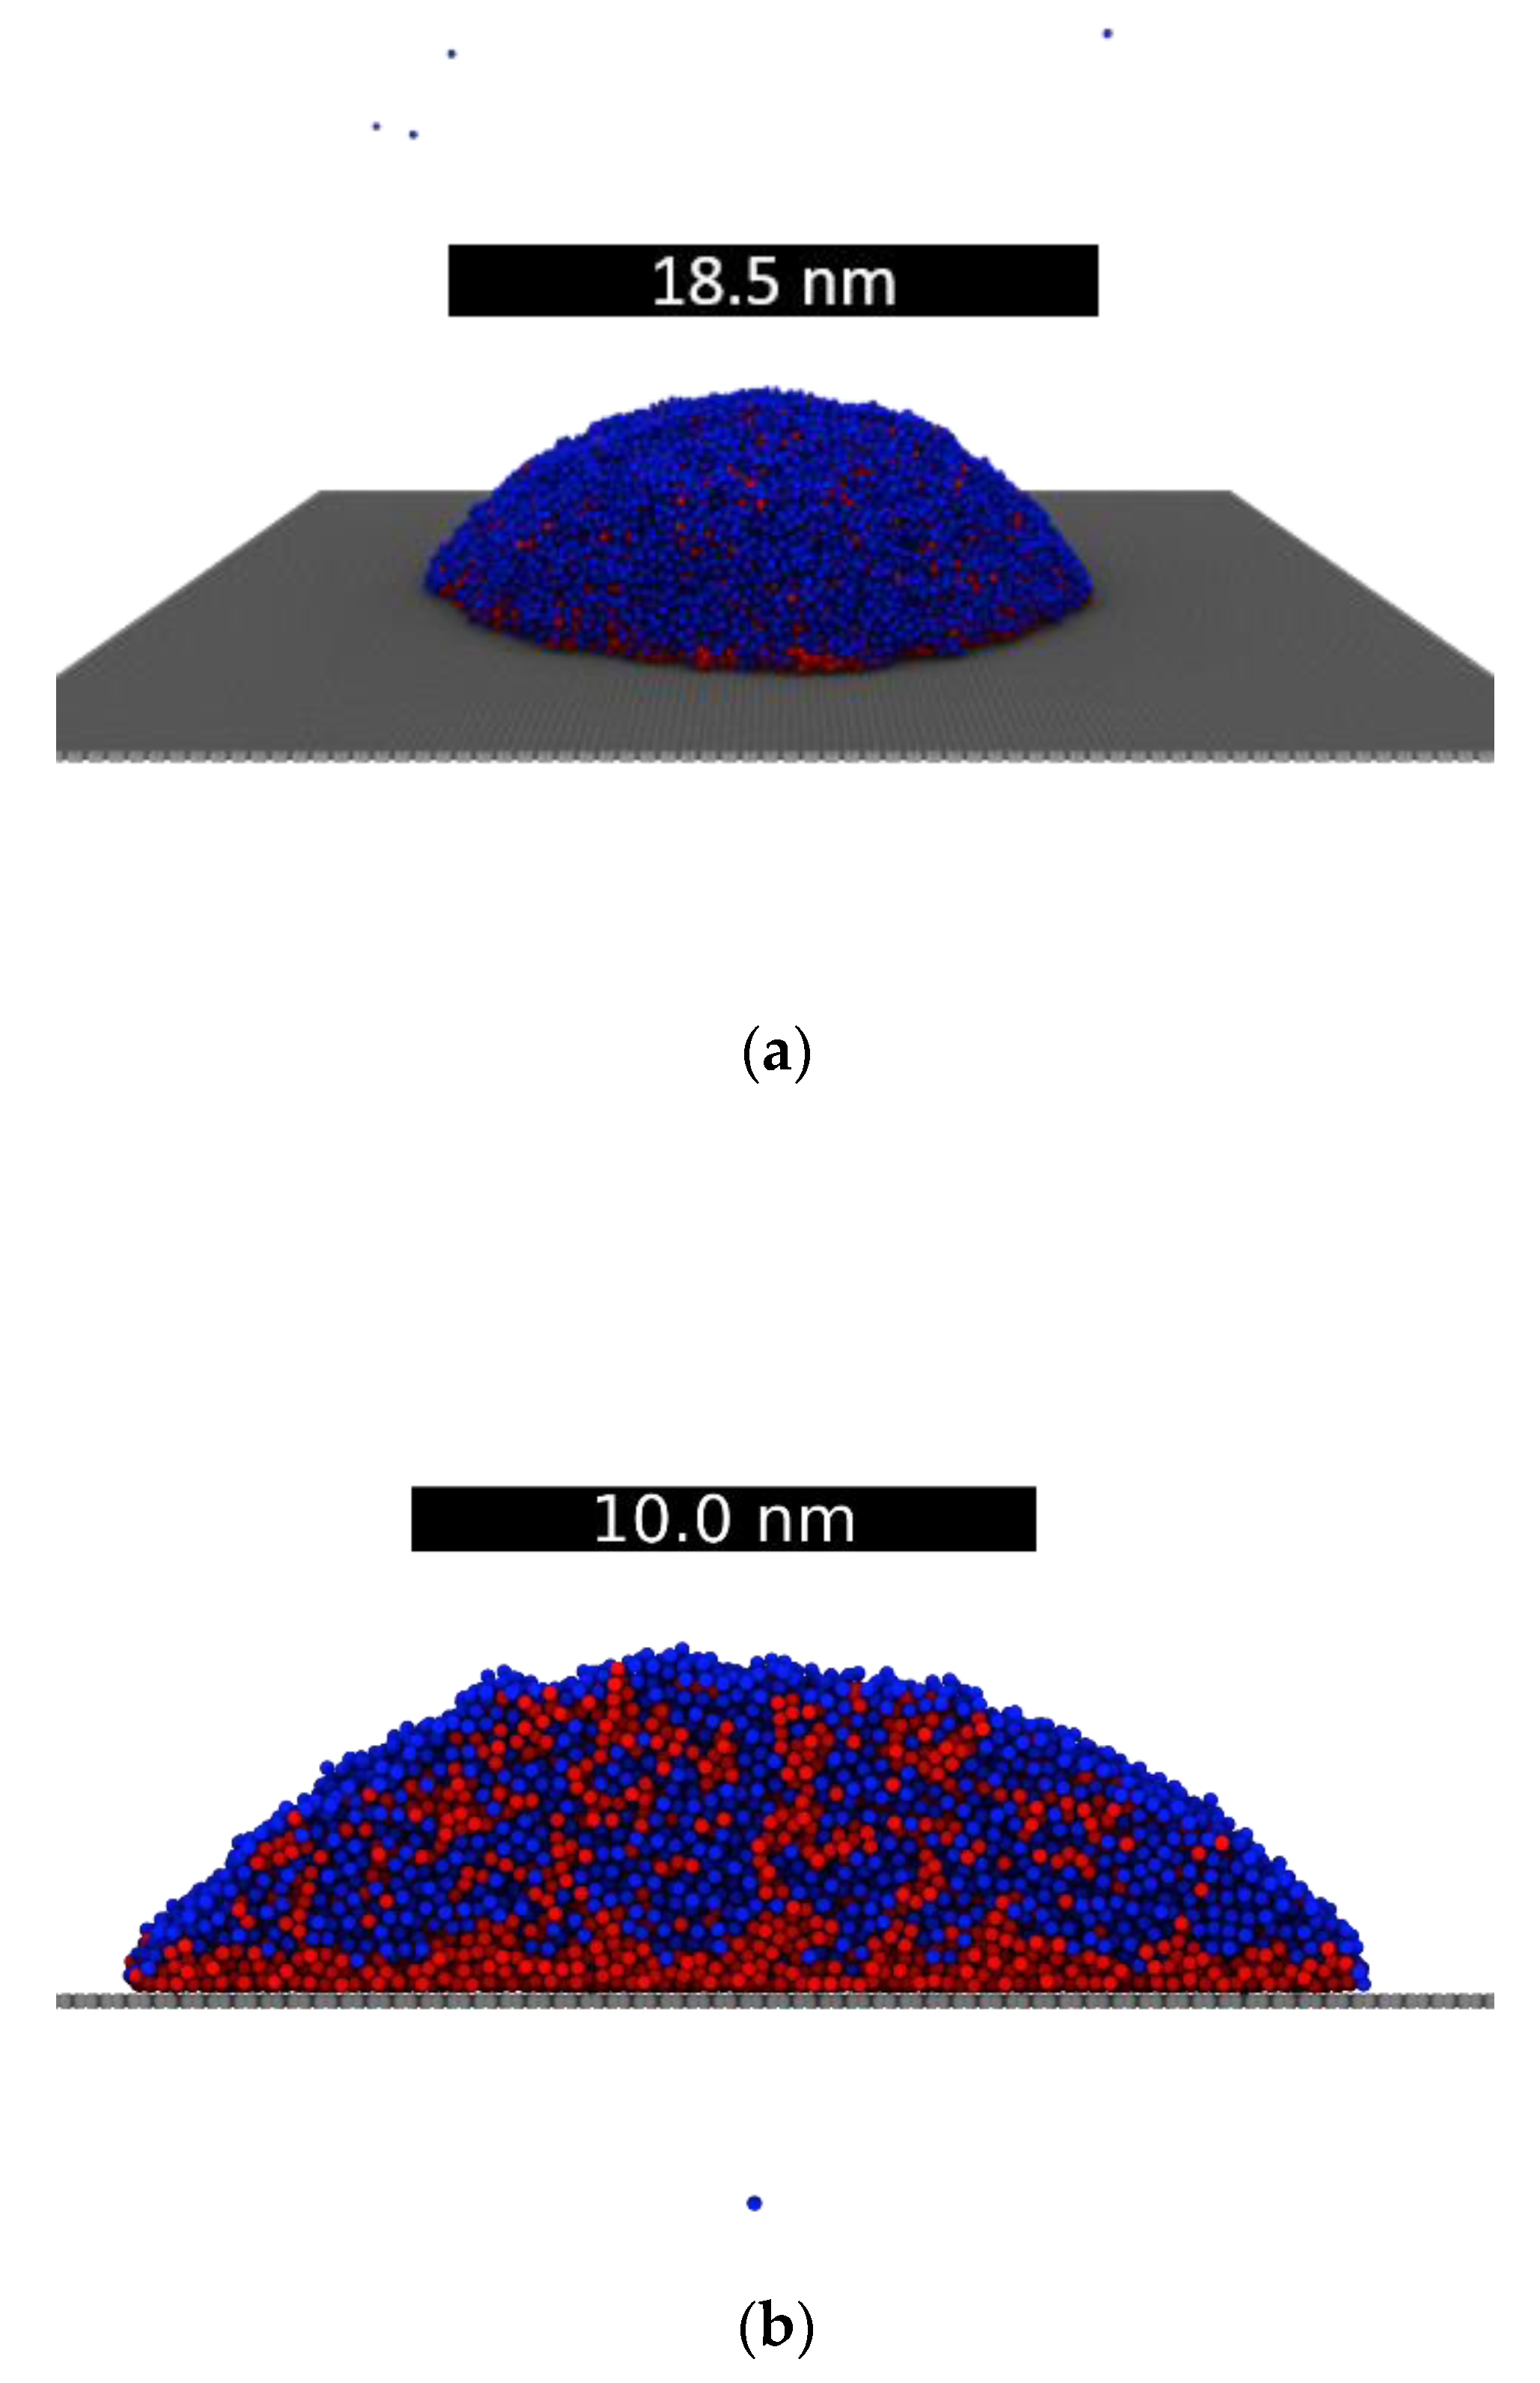
3.2. Droplets
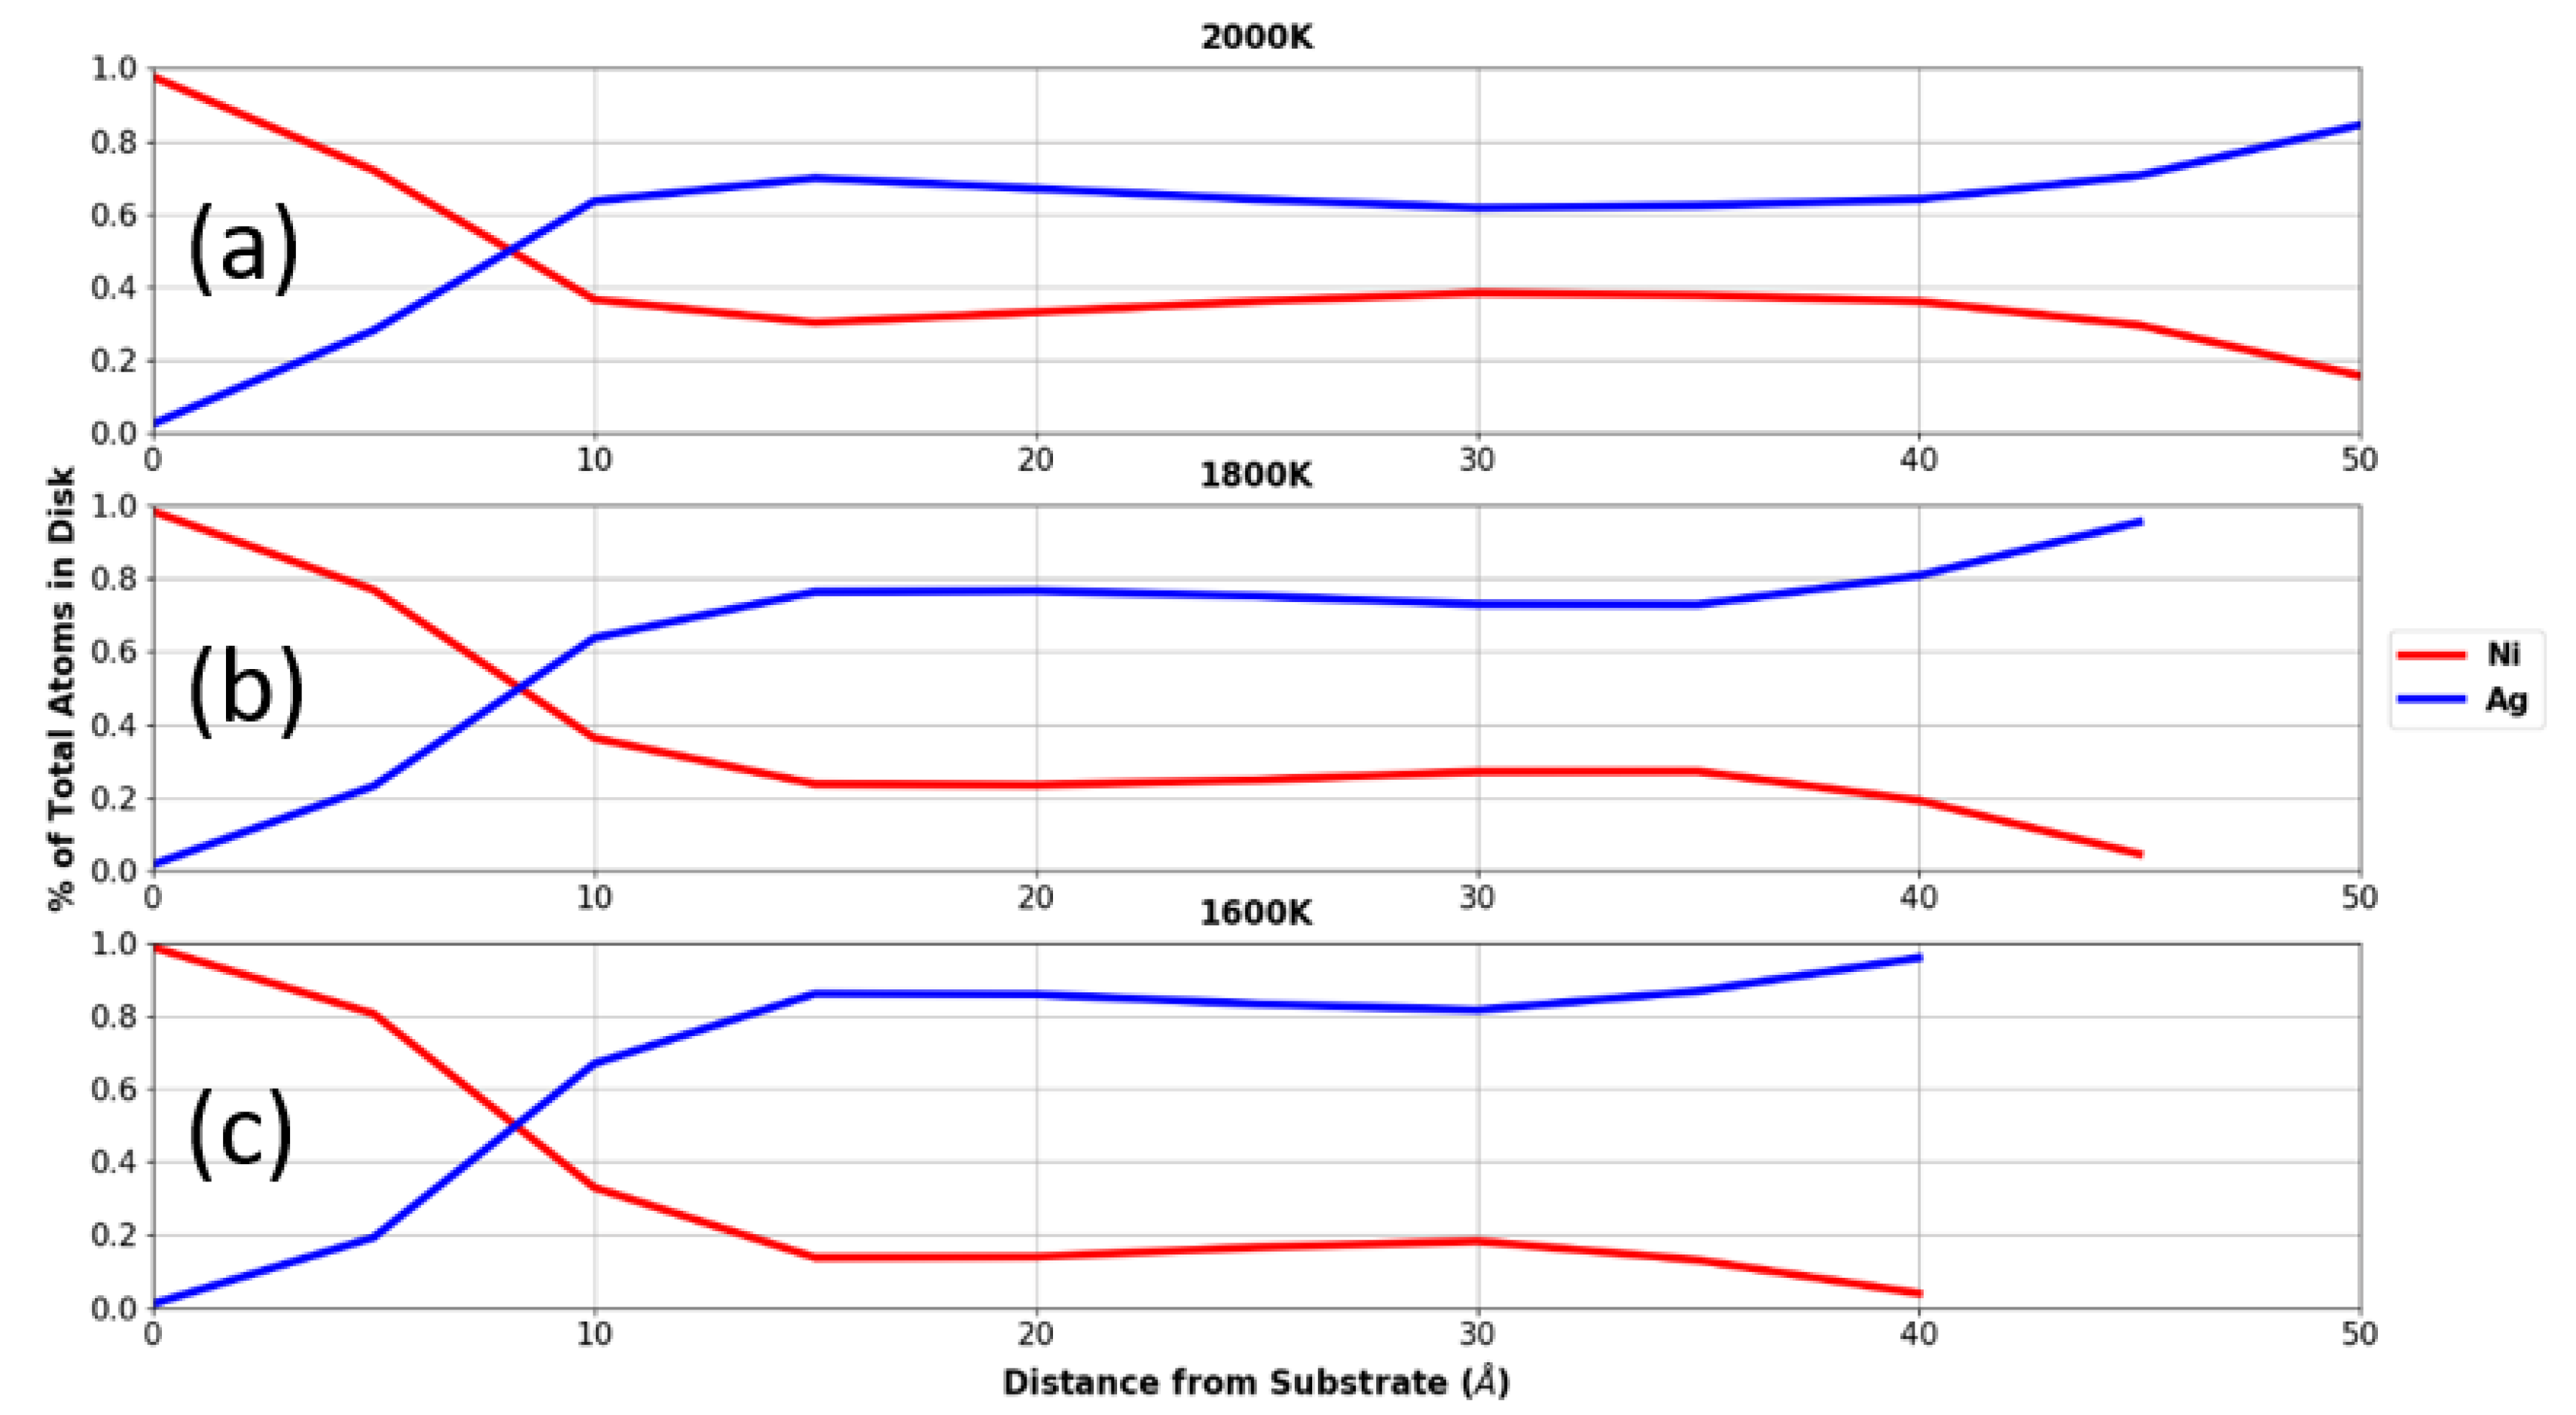
3.3. Droplets on Graphite
4. Conclusions
Supplementary Materials
Author Contributions
Funding
Acknowledgments
Conflicts of Interest
References
- Favazza, C.; Kalyanaraman, R.; Sureshkumar, R. Robust nanopatterning by laser-induced dewetting of metal nanofilms. Nanotechnology 2006, 17, 4229–4234. [Google Scholar] [CrossRef] [PubMed]
- Herminghaus, S.; Jacobs, K.; Mecke, K.; Bischof, J.; Fery, A.; Ibn-Elhaj, M.; Schlagowski, S. Spinodal dewetting in liquid crystal and liquid metal films. Science (New York, N.Y.) 1998, 282, 916–919. [Google Scholar] [CrossRef] [PubMed]
- McKeown, J.T.; Roberts, N.A.; Fowlkes, J.D.; Wu, Y.; LaGrange, T.; Reed, B.W.; Campbell, G.H.; Rack, P.D. Real-Time Observation of Nanosecond Liquid-Phase Assembly of Nickel Nanoparticles via Pulsed-Laser Heating. Langmuir 2012, 28, 17168–17175. [Google Scholar] [CrossRef] [PubMed][Green Version]
- Ruffino, F.; Pugliara, A.; Carria, E.; Bongiorno, C.; Spinella, C.; Grimaldi, M.G. Formation of nanoparticles from laser irradiated Au thin film on SiO2/Si: Elucidating the Rayleigh-instability role. Mater. Lett. 2012, 84, 27–30. [Google Scholar] [CrossRef]
- Fowlkes, J.D.; Kondic, L.; Diez, J.; Wu, Y.; Rack, P.D. Self-Assembly versus Directed Assembly of Nanoparticles via Pulsed Laser Induced Dewetting of Patterned Metal Films. Nano Lett. 2011, 11, 2478–2485. [Google Scholar] [CrossRef] [PubMed]
- Fowlkes, J.D.; Roberts, N.A.; Wu, Y.; Diez, J.A.; González, A.G.; Hartnett, C.; Mahady, K.; Afkhami, S.; Kondic, L.; Rack, P.D. Hierarchical Nanoparticle Ensembles Synthesized by Liquid Phase Directed Self-Assembly. Nano Lett. 2014, 14, 774–782. [Google Scholar] [CrossRef] [PubMed][Green Version]
- Guan, Y.F.; Pearce, R.C.; Melechko, A.V.; Hensley, D.K.; Simpson, M.L.; Rack, P.D. Pulsed laser dewetting of nickel catalyst for carbon nanofiber growth. Nanotechnology 2008, 19, 235604. [Google Scholar] [CrossRef]
- Hartnett, C.A.; Mahady, K.; Fowlkes, J.D.; Afkhami, S.; Kondic, L.; Rack, P.D. Instability of Nano- and Microscale Liquid Metal Filaments: Transition from Single Droplet Collapse to Multidroplet Breakup. Langmuir 2015, 31, 13609–13617. [Google Scholar] [CrossRef]
- Hartnett, C.A.; Seric, I.; Mahady, K.; Kondic, L.; Afkhami, S.; Fowlkes, J.D.; Rack, P.D. Exploiting the Marangoni Effect To Initiate Instabilities and Direct the Assembly of Liquid Metal Filaments. Langmuir 2017, 33, 8123–8128. [Google Scholar] [CrossRef]
- Kondic, L.; Diez, J.A.; Rack, P.D.; Guan, Y.; Fowlkes, J.D. Nanoparticle assembly via the dewetting of patterned thin metal lines: Understanding the instability mechanisms. Phys. Rev. E 2009, 79, 026302. [Google Scholar] [CrossRef]
- Rack, P.D.; Guan, Y.; Fowlkes, J.D.; Melechko, A.V.; Simpson, M.L. Pulsed laser dewetting of patterned thin metal films: A means of directed assembly. Appl. Phys. Lett. 2008, 92, 223108. [Google Scholar] [CrossRef]
- Wu, Y.; Fowlkes, J.D.; Rack, P.D.; Diez, J.A.; Kondic, L. On the Breakup of Patterned Nanoscale Copper Rings into Droplets via Pulsed-Laser-Induced Dewetting: Competing Liquid-Phase Instability and Transport Mechanisms. Langmuir 2010, 26, 11972–11979. [Google Scholar] [CrossRef] [PubMed]
- Wu, Y.; Fowlkes, J.D.; Roberts, N.A.; Diez, J.A.; Kondic, L.; González, A.G.; Rack, P.D. Competing Liquid Phase Instabilities during Pulsed Laser Induced Self-Assembly of Copper Rings into Ordered Nanoparticle Arrays on SiO2. Langmuir 2011, 27, 13314–13323. [Google Scholar] [CrossRef] [PubMed]
- Wu, Y.; Li, G.; Cherqui, C.; Bigelow, N.W.; Thakkar, N.; Masiello, D.J.; Camden, J.P.; Rack, P.D. Electron Energy Loss Spectroscopy Study of the Full Plasmonic Spectrum of Self-Assembled Au–Ag Alloy Nanoparticles: Unraveling Size, Composition, and Substrate Effects. ACS Photonics 2016, 3, 130–138. [Google Scholar] [CrossRef]
- McKeown, J.T.; Wu, Y.; Fowlkes, J.D.; Rack, P.D.; Campbell, G.H. Simultaneous In-Situ Synthesis and Characterization of Co@Cu Core-Shell Nanoparticle Arrays. Adv. Mater. 2015, 27, 1060–1065. [Google Scholar] [CrossRef] [PubMed]
- Sachan, R.; Yadavali, S.; Shirato, N.; Krishna, H.; Ramos, V.; Duscher, G.; Pennycook, S.J.; Gangopadhyay, A.K.; Garcia, H.; Kalyanaraman, R. Self-organized bimetallic Ag–Co nanoparticles with tunable localized surface plasmons showing high environmental stability and sensitivity. Nanotechnology 2012, 23, 275604. [Google Scholar] [CrossRef] [PubMed]
- Atena, A.; Khenner, M. Thermocapillary effects in driven dewetting and self assembly of pulsed-laser-irradiated metallic films. Phys. Rev. B 2009, 80, 075402. [Google Scholar] [CrossRef]
- González, A.G.; Diez, J.A.; Wu, Y.; Fowlkes, J.D.; Rack, P.D.; Kondic, L. Instability of Liquid Cu Films on a SiO2 Substrate. Langmuir 2013, 29, 9378–9387. [Google Scholar] [CrossRef]
- Trice, J.; Thomas, D.; Favazza, C.; Sureshkumar, R.; Kalyanaraman, R. Pulsed-laser-induced dewetting in nanoscopic metal films: Theory and experiments. Phys. Rev. B 2007, 75, 235439. [Google Scholar] [CrossRef]
- Fowlkes, J.; Horton, S.; Fuentes-Cabrera, M.; Rack, P.D. Signatures of the Rayleigh-Plateau Instability Revealed by Imposing Synthetic Perturbations on Nanometer-Sized Liquid Metals on Substrates. Angew. Chem. Int. Ed. 2012, 51, 8768–8772. [Google Scholar] [CrossRef]
- Fuentes-Cabrera, M.; Rhodes, B.H.; Fowlkes, J.D.; López-Benzanilla, A.; Terrones, H.; Simpson, M.L.; Rack, P.D. Molecular dynamics study of the dewetting of copper on graphite and graphene: Implications for nanoscale self-assembly. Phys. Rev. E 2011, 83, 041603. [Google Scholar] [CrossRef] [PubMed]
- Nguyen, T.D.; Fuentes-Cabrera, M.; Fowlkes, J.D.; Diez, J.A.; González, A.G.; Kondic, L.; Rack, P.D. Competition between Collapse and Breakup in Nanometer-Sized Thin Rings Using Molecular Dynamics and Continuum Modeling. Langmuir 2012, 28, 13960–13967. [Google Scholar] [CrossRef] [PubMed]
- Nguyen, T.D.; Fuentes-Cabrera, M.; Fowlkes, J.D.; Rack, P.D. Coexistence of spinodal instability and thermal nucleation in thin-film rupture: Insights from molecular levels. Phys. Rev. E 2014, 89, 032403. [Google Scholar] [CrossRef] [PubMed]
- Zhou, X.W.; Johnson, R.A.; Wadley, H.N.G. Misfit-energy-increasing dislocations in vapor-deposited CoFe/NiFe multilayers. Phys. Rev. B 2004, 69, 144113. [Google Scholar] [CrossRef]
- Pan, Z.; Borovikov, V.; Mendelev, M.I.; Sansoz, F. Development of a semi-empirical potential for simulation of Ni solute segregation into grain boundaries in Ag. Model. Simul. Mater. Sci. Eng. 2018, 26, 075004. [Google Scholar] [CrossRef]
- Luo, S.-N.; Ahrens, T.J.; Çağın, T.; Strachan, A.; Goddard, W.A.; Swift, D.C. Maximum superheating and undercooling: Systematics, molecular dynamics simulations, and dynamic experiments. Phys. Rev. B 2003, 68, 134206. [Google Scholar] [CrossRef]
- Kumar, S. Spreading and orientation of silver nano-drop over a flat graphene substrate: An atomistic investigation. Carbon 2018, 138, 26–41. [Google Scholar] [CrossRef]
- Akbarzadeh, H.; Yaghoubi, H. Molecular dynamics simulations of silver nanocluster supported on carbon nanotube. J. Colloid Interface Sci. 2014, 418, 178–184. [Google Scholar] [CrossRef]
- Graves, D.B.; Brault, P. Molecular dynamics for low temperature plasma-surface interaction studies. J. Phys. D Appl. Phys. 2009, 42, 194011. [Google Scholar] [CrossRef]
- Schebarchov, D.; Hendy, S.C. Effects of epitaxial strain on the melting of supported nickel nanoparticles. Phys. Rev. B 2011, 84, 085407. [Google Scholar] [CrossRef]
- Tavazza, F.; Senftle, T.P.; Zou, C.; Becker, C.A.; van Duin, A.T. Molecular Dynamics Investigation of the Effects of Tip-Substrate Interactions during Nanoindentation. J. Phys. Chem. 2015, 119, 13580–13589. [Google Scholar] [CrossRef]
- Bozack, M.J.; Bell, A.E.; Swanson, L.W. Influence of surface segregation on wetting of liquid metal alloys. J. Phys. Chem. 1988, 92, 3925–3934. [Google Scholar] [CrossRef]
- Hlinka, J.; Weltsch, Z. Relation between the Wetting Property and Electrical Conduction of Silver-Gold (Ag-Au) Alloys. Period. Polytech. Transp. Eng. 2013, 41, 95–98. [Google Scholar] [CrossRef]
- Lee, J.; Seo, K.; Hirai, N.; Takahira, N.; Tanaka, T. Intrinsic contact angle and contact interaction between liquid silver and solid graphite. Met. Mater. Int. 2007, 13, 83–86. [Google Scholar] [CrossRef]
- Naidich, Y.V.; Perevertailo, V.M.; Nevodnik, G.M. Wetting of graphite by nickel as affected by the liquid-phase dissolution process of carbon. Sov. Powder Metall. Met. Ceram. 1971, 10, 45–47. [Google Scholar] [CrossRef]
- Ricci, E.; Novakovic, R. Wetting and surface tension measurements on gold alloys. Gold Bull. 2001, 34, 41–49. [Google Scholar] [CrossRef]
- Weltsch, Z.; Lovas, A.; Takács, J.; Cziráki, Á.; Toth, A.; Kaptay, G. Measurement and modelling of the wettability of graphite by a silver-tin (Ag-Sn) liquid alloy. Appl. Surf. Sci. 2013, 268, 52–60. [Google Scholar] [CrossRef]
- Plimpton, S. Fast Parallel Algorithms for Short-Range Molecular Dynamics. J. Comput. Phys. 1995, 117, 1–19. [Google Scholar] [CrossRef]
- Stukowski, A. Visualization and analysis of atomistic simulation data with OVITO the Open Visualization Tool. Model. Simul. Mater. Sci. Eng. 2009, 18, 015012. [Google Scholar] [CrossRef]
- Humphrey, W.; Dalke, A.; Schulten, K. VMD Visual Molecular Dynamics. J. Molec. Graph. 1996, 14, 33–38. [Google Scholar] [CrossRef]


| Element | ||
|---|---|---|
| Ni | 2.047 | 2.072 |
| Ag | 2.855 | 3.549 |
| NiAg | 1.962 | 2.815 |
| Interaction | |||
|---|---|---|---|
| Ni-C | 0.072 | 2.8 | 11.0 |
| Ag-C | 0.01 | 3.006 | 11.0 |
© 2019 by the authors. Licensee MDPI, Basel, Switzerland. This article is an open access article distributed under the terms and conditions of the Creative Commons Attribution (CC BY) license (http://creativecommons.org/licenses/by/4.0/).
Share and Cite
Allaire, R.H.; Dhakane, A.; Emery, R.; Ganesh, P.; Rack, P.D.; Kondic, L.; Cummings, L.; Fuentes-Cabrera, M. Surface, Interface, and Temperature Effects on the Phase Separation and Nanoparticle Self Assembly of Bi-Metallic Ni0.5Ag0.5: A Molecular Dynamics Study. Nanomaterials 2019, 9, 1040. https://doi.org/10.3390/nano9071040
Allaire RH, Dhakane A, Emery R, Ganesh P, Rack PD, Kondic L, Cummings L, Fuentes-Cabrera M. Surface, Interface, and Temperature Effects on the Phase Separation and Nanoparticle Self Assembly of Bi-Metallic Ni0.5Ag0.5: A Molecular Dynamics Study. Nanomaterials. 2019; 9(7):1040. https://doi.org/10.3390/nano9071040
Chicago/Turabian StyleAllaire, Ryan H., Abhijeet Dhakane, Reece Emery, P. Ganesh, Philip D. Rack, Lou Kondic, Linda Cummings, and Miguel Fuentes-Cabrera. 2019. "Surface, Interface, and Temperature Effects on the Phase Separation and Nanoparticle Self Assembly of Bi-Metallic Ni0.5Ag0.5: A Molecular Dynamics Study" Nanomaterials 9, no. 7: 1040. https://doi.org/10.3390/nano9071040
APA StyleAllaire, R. H., Dhakane, A., Emery, R., Ganesh, P., Rack, P. D., Kondic, L., Cummings, L., & Fuentes-Cabrera, M. (2019). Surface, Interface, and Temperature Effects on the Phase Separation and Nanoparticle Self Assembly of Bi-Metallic Ni0.5Ag0.5: A Molecular Dynamics Study. Nanomaterials, 9(7), 1040. https://doi.org/10.3390/nano9071040