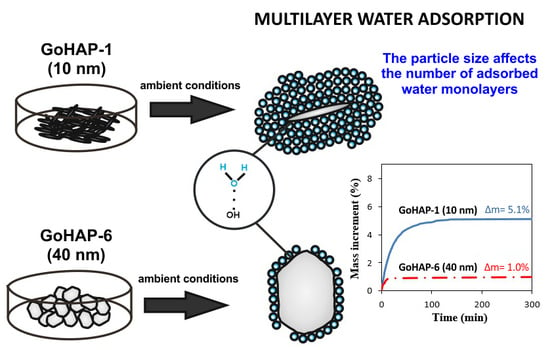
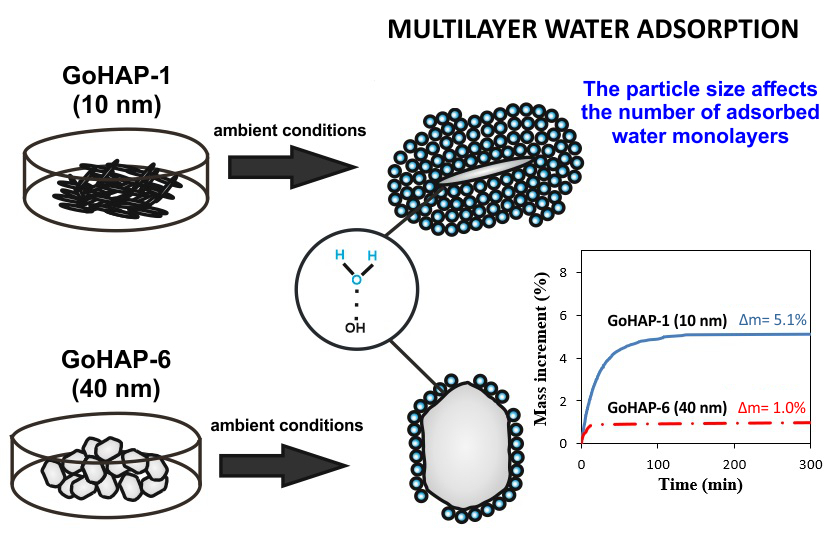
Nanoparticle Size Effect on Water Vapour Adsorption by Hydroxyapatite


Abstract
1. Introduction
2. Materials and Methods
2.1. Substrates
2.2. Synthesis of Hydroxyapatite Nanoparticles
2.3. Measurement of Density and Specific Surface Area
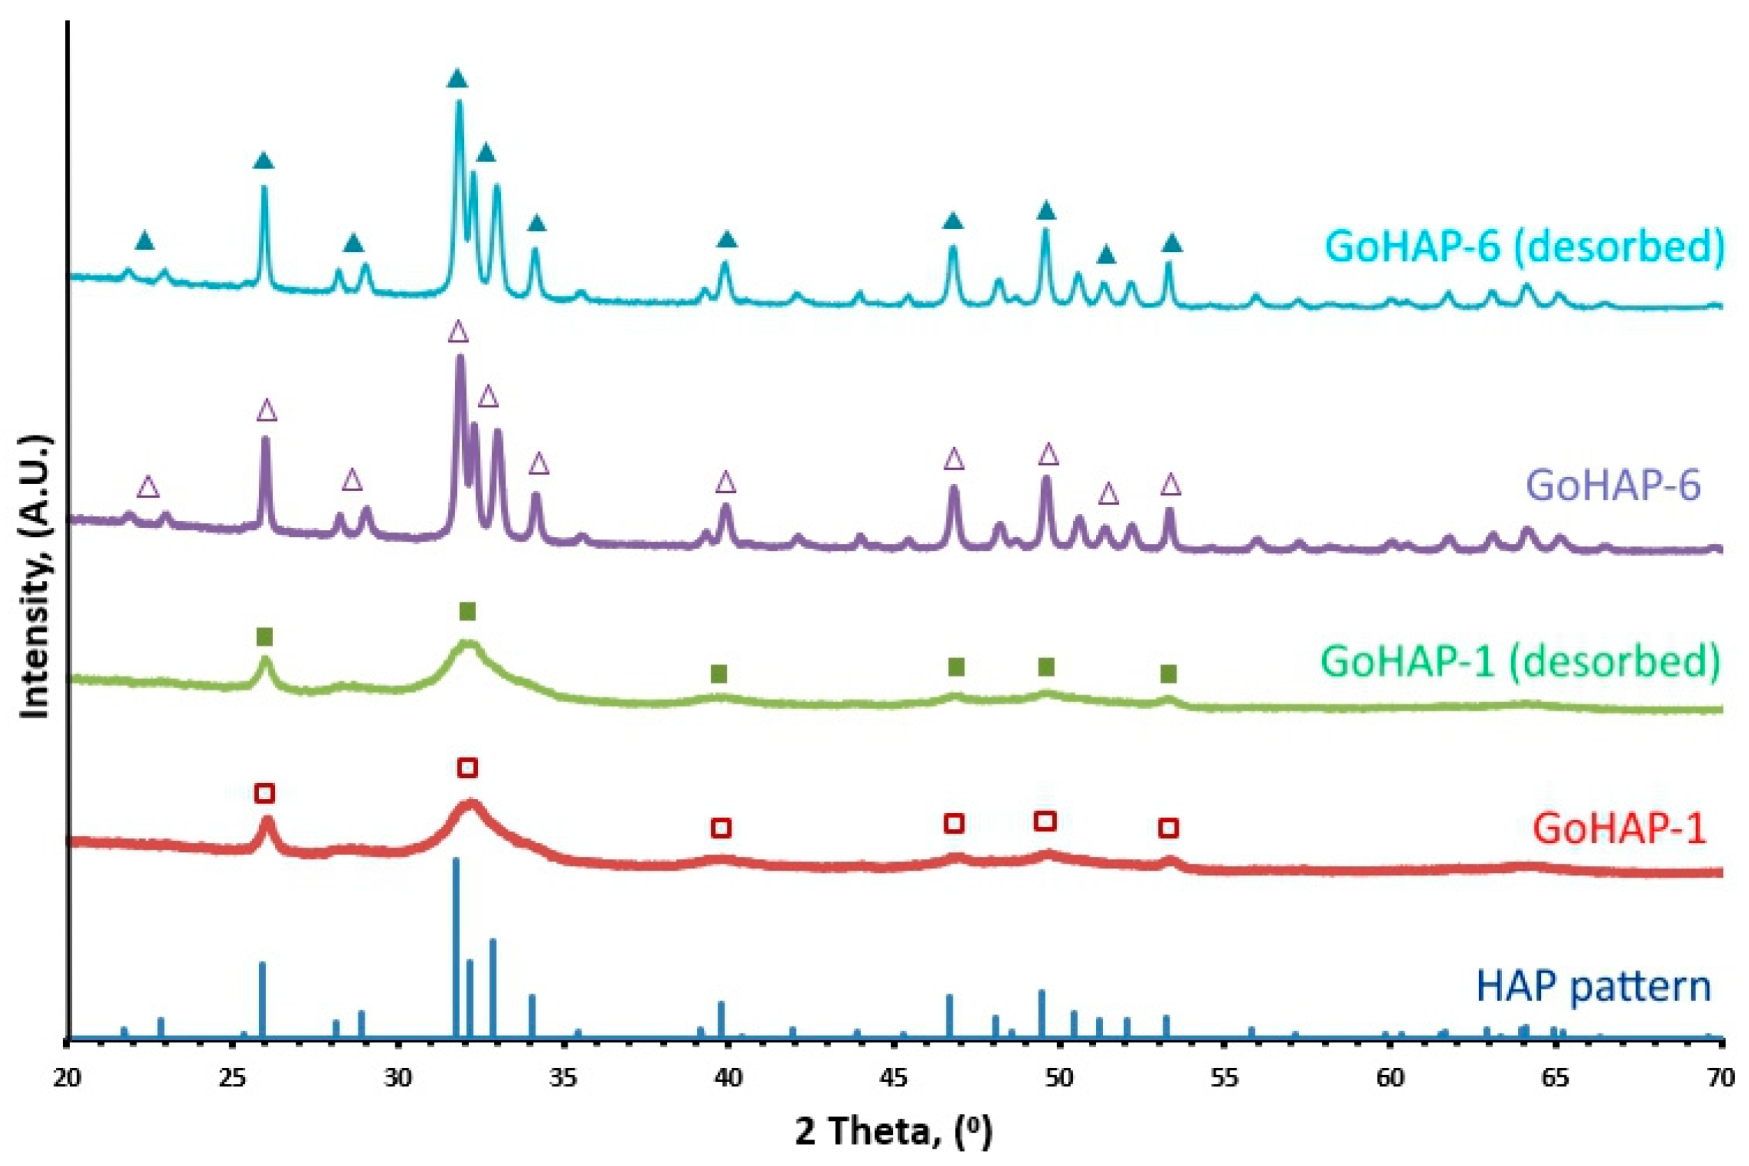
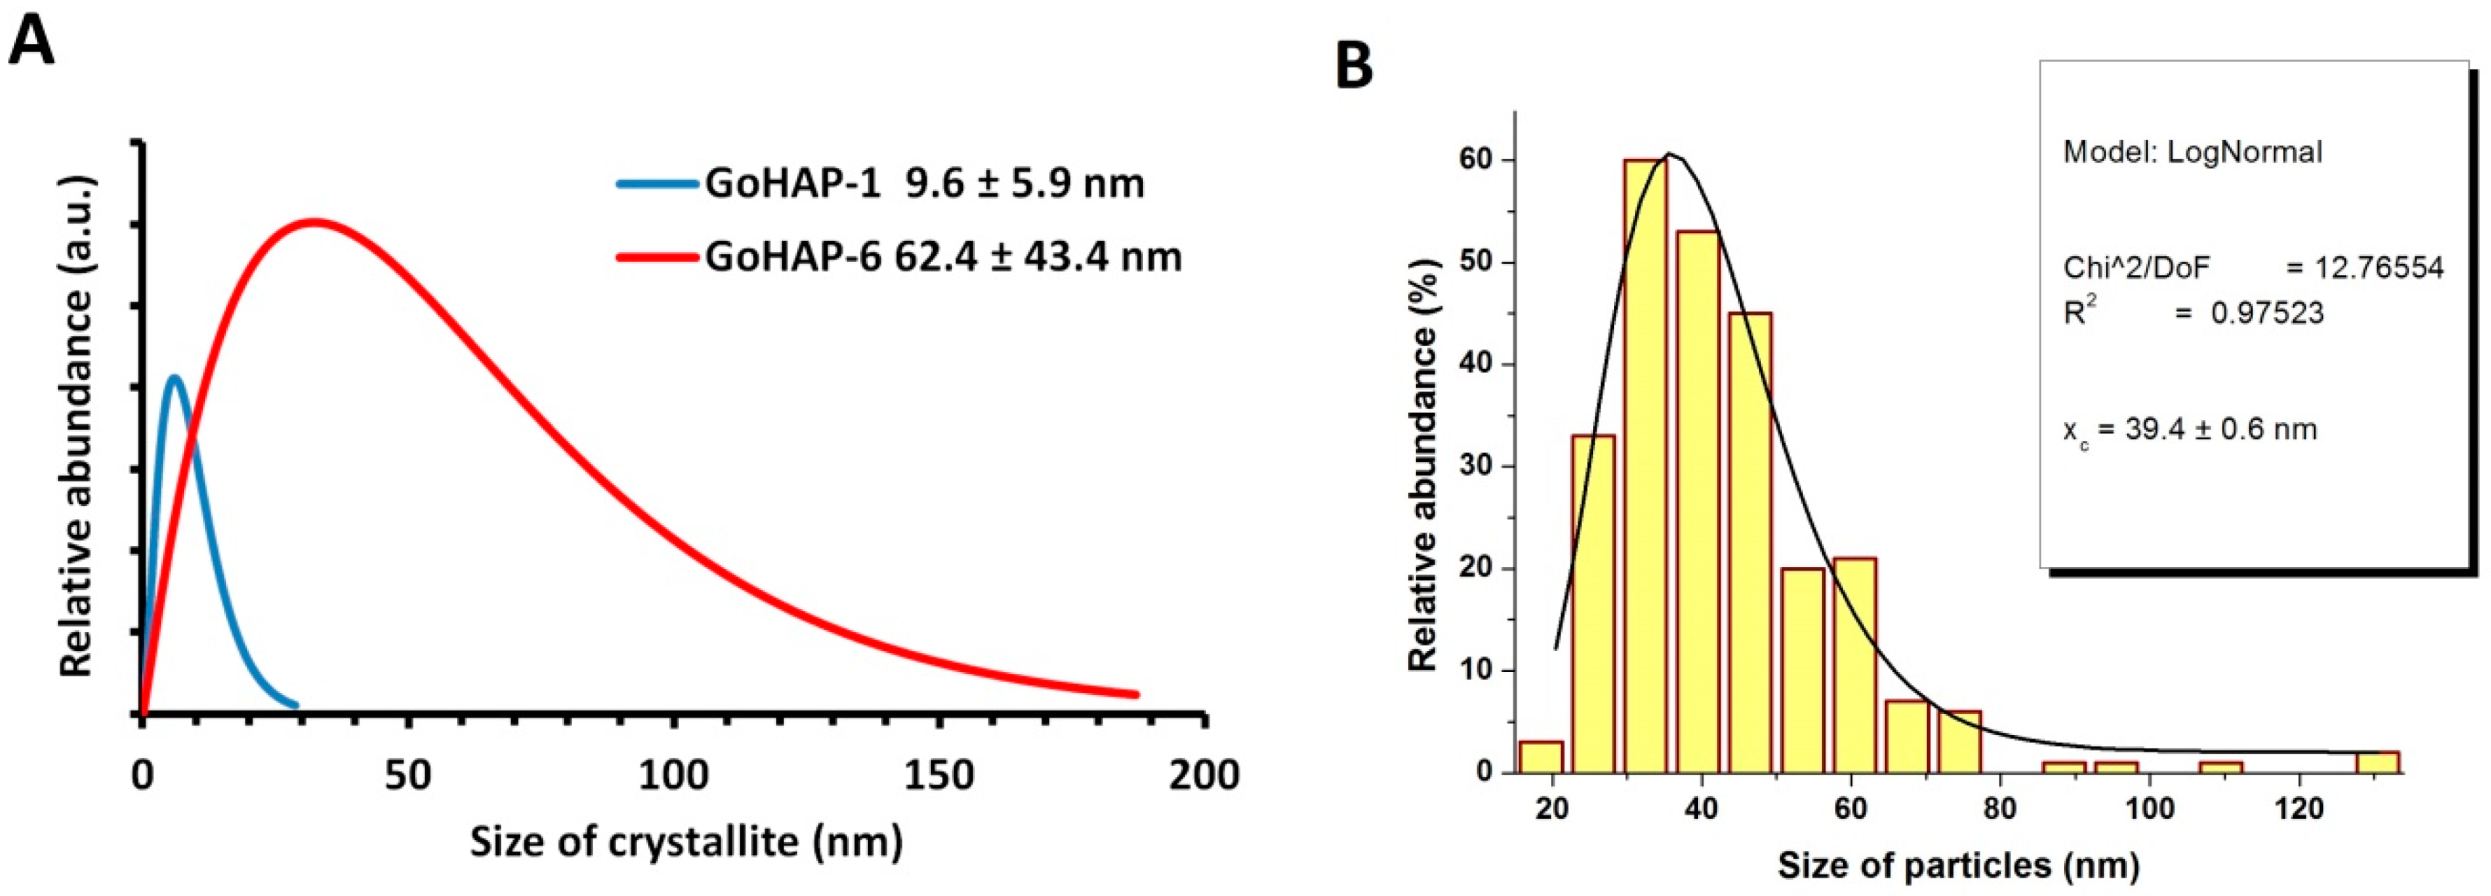
2.4. X-Ray Powder Diffraction
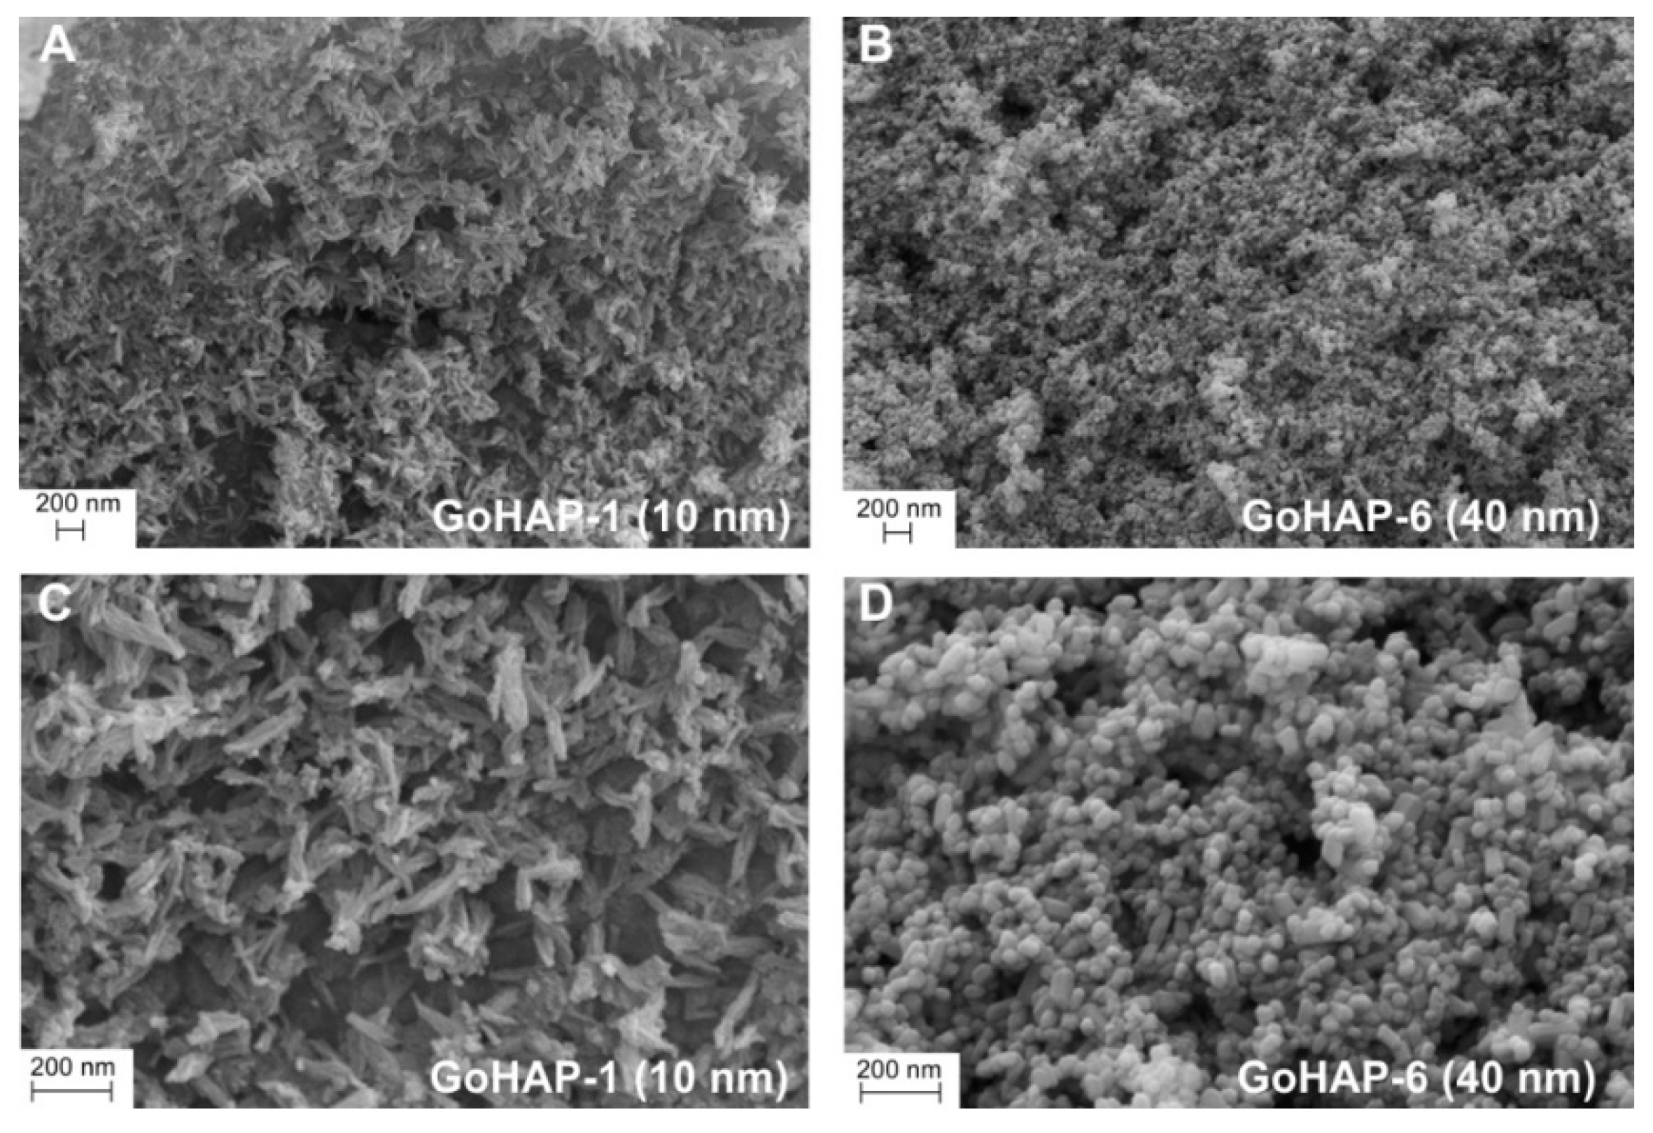
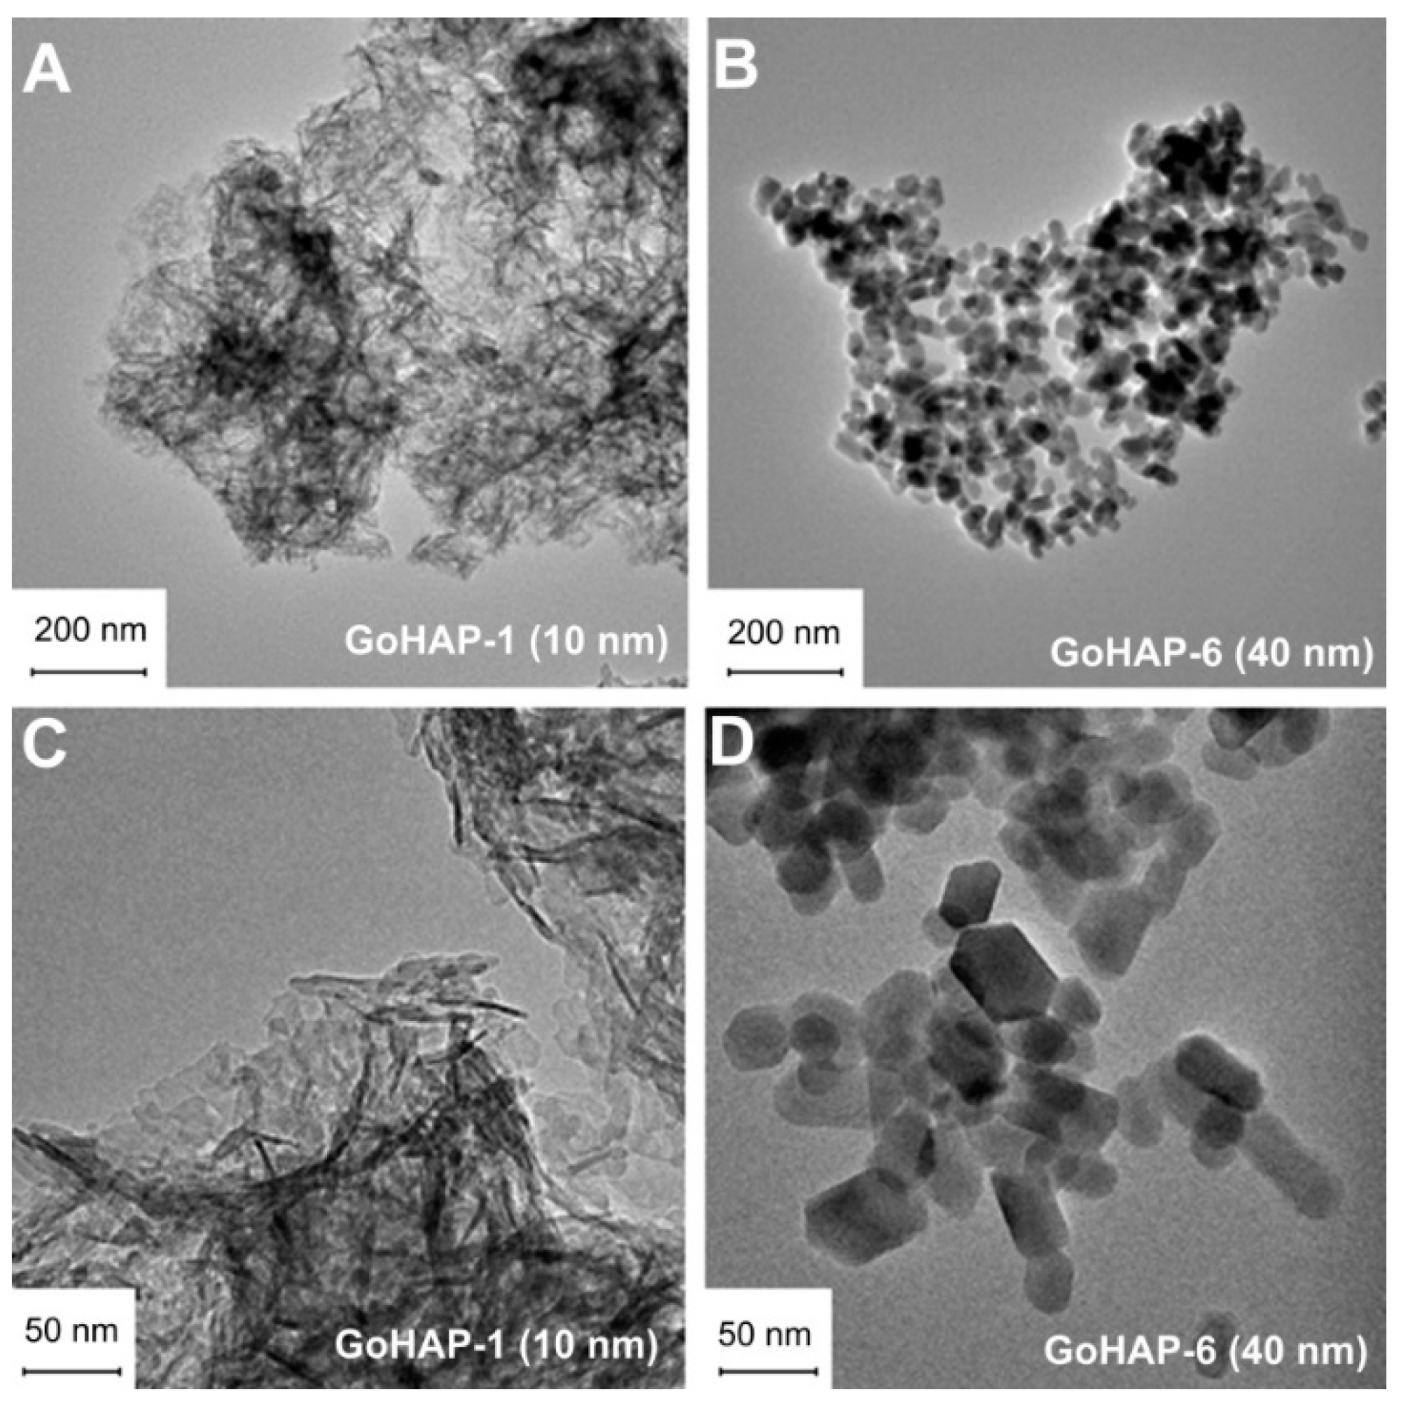
2.5. Morphology Characteristics
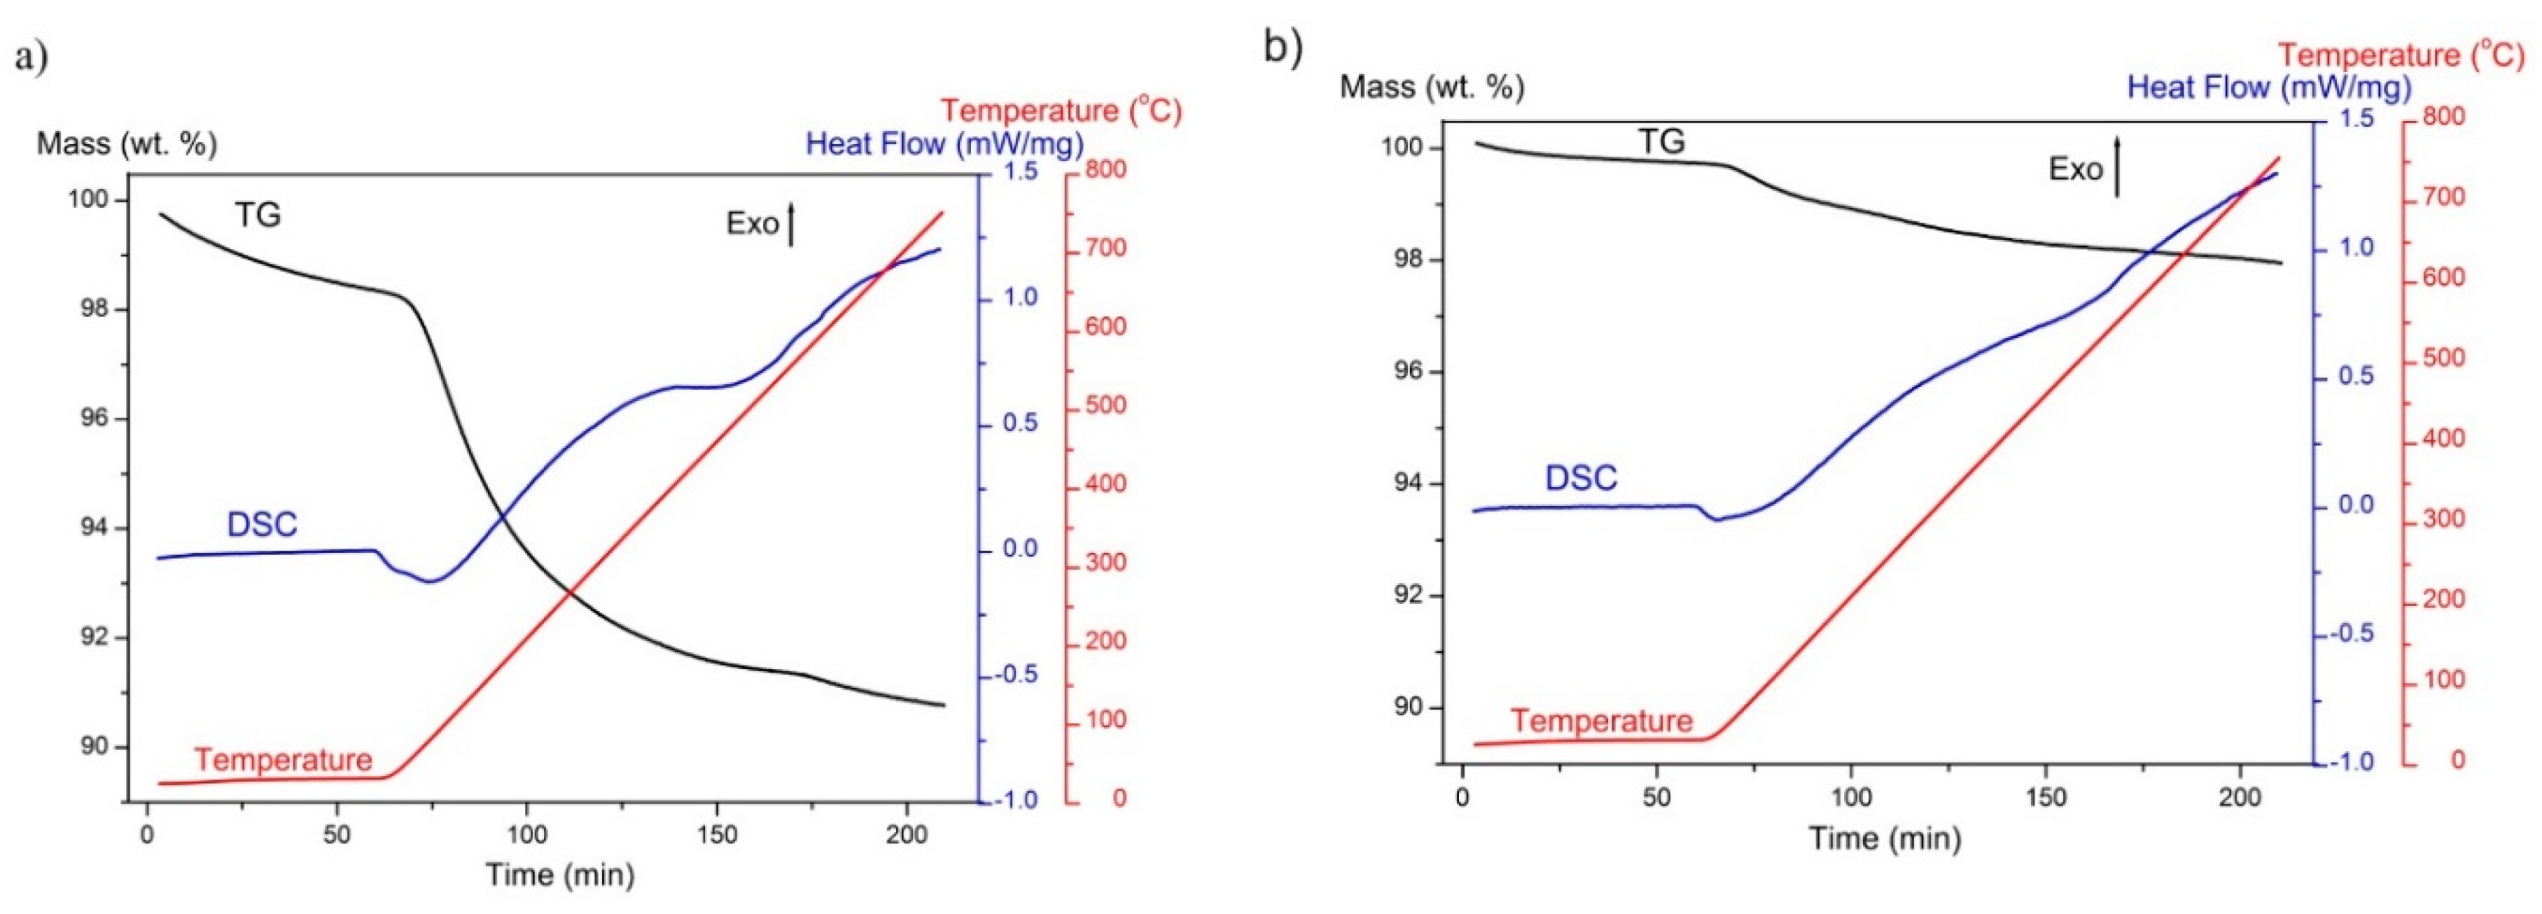
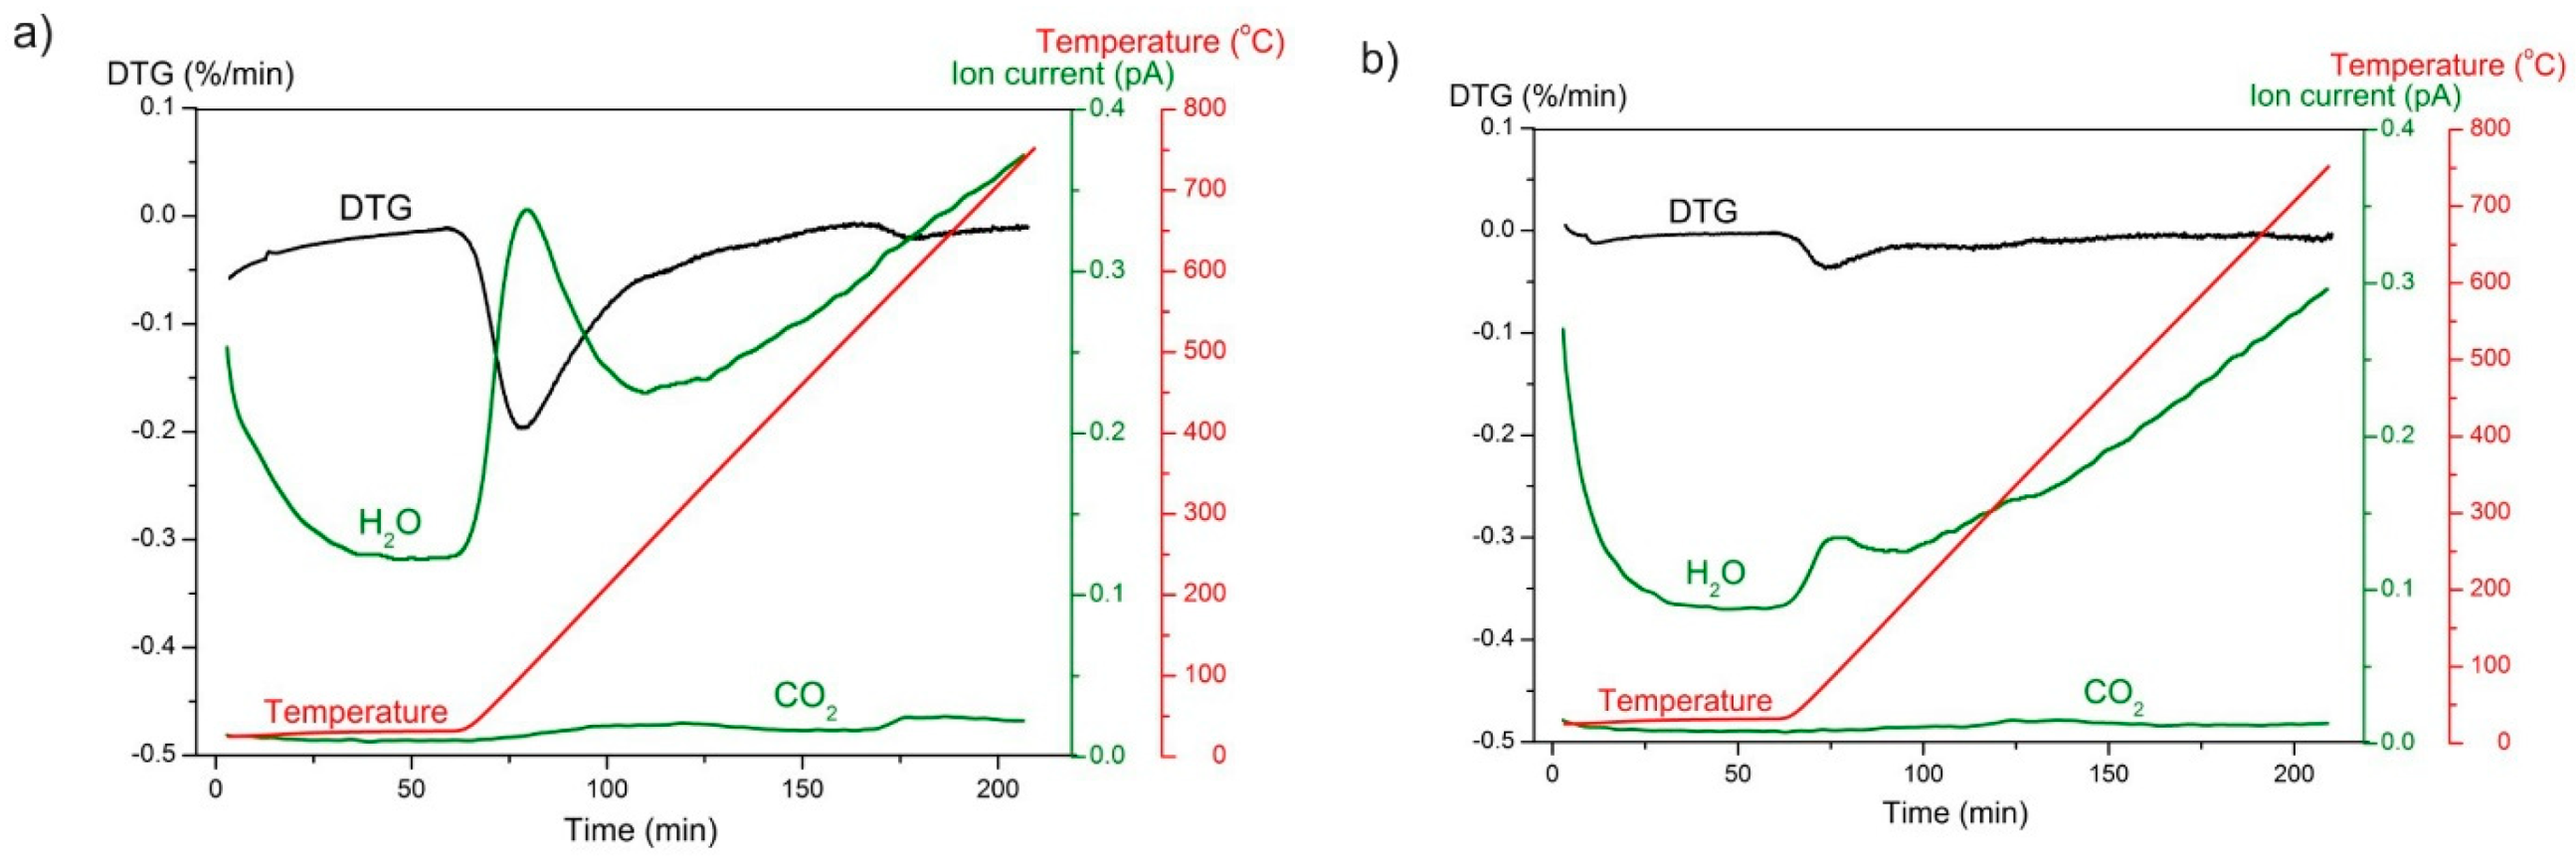
2.6. Thermogravimetric Analysis
2.7. Measurement of Relative Humidity
2.8. Kinetics of the Water Vapour Adsorption
3. Results
3.1. Material Characterisation
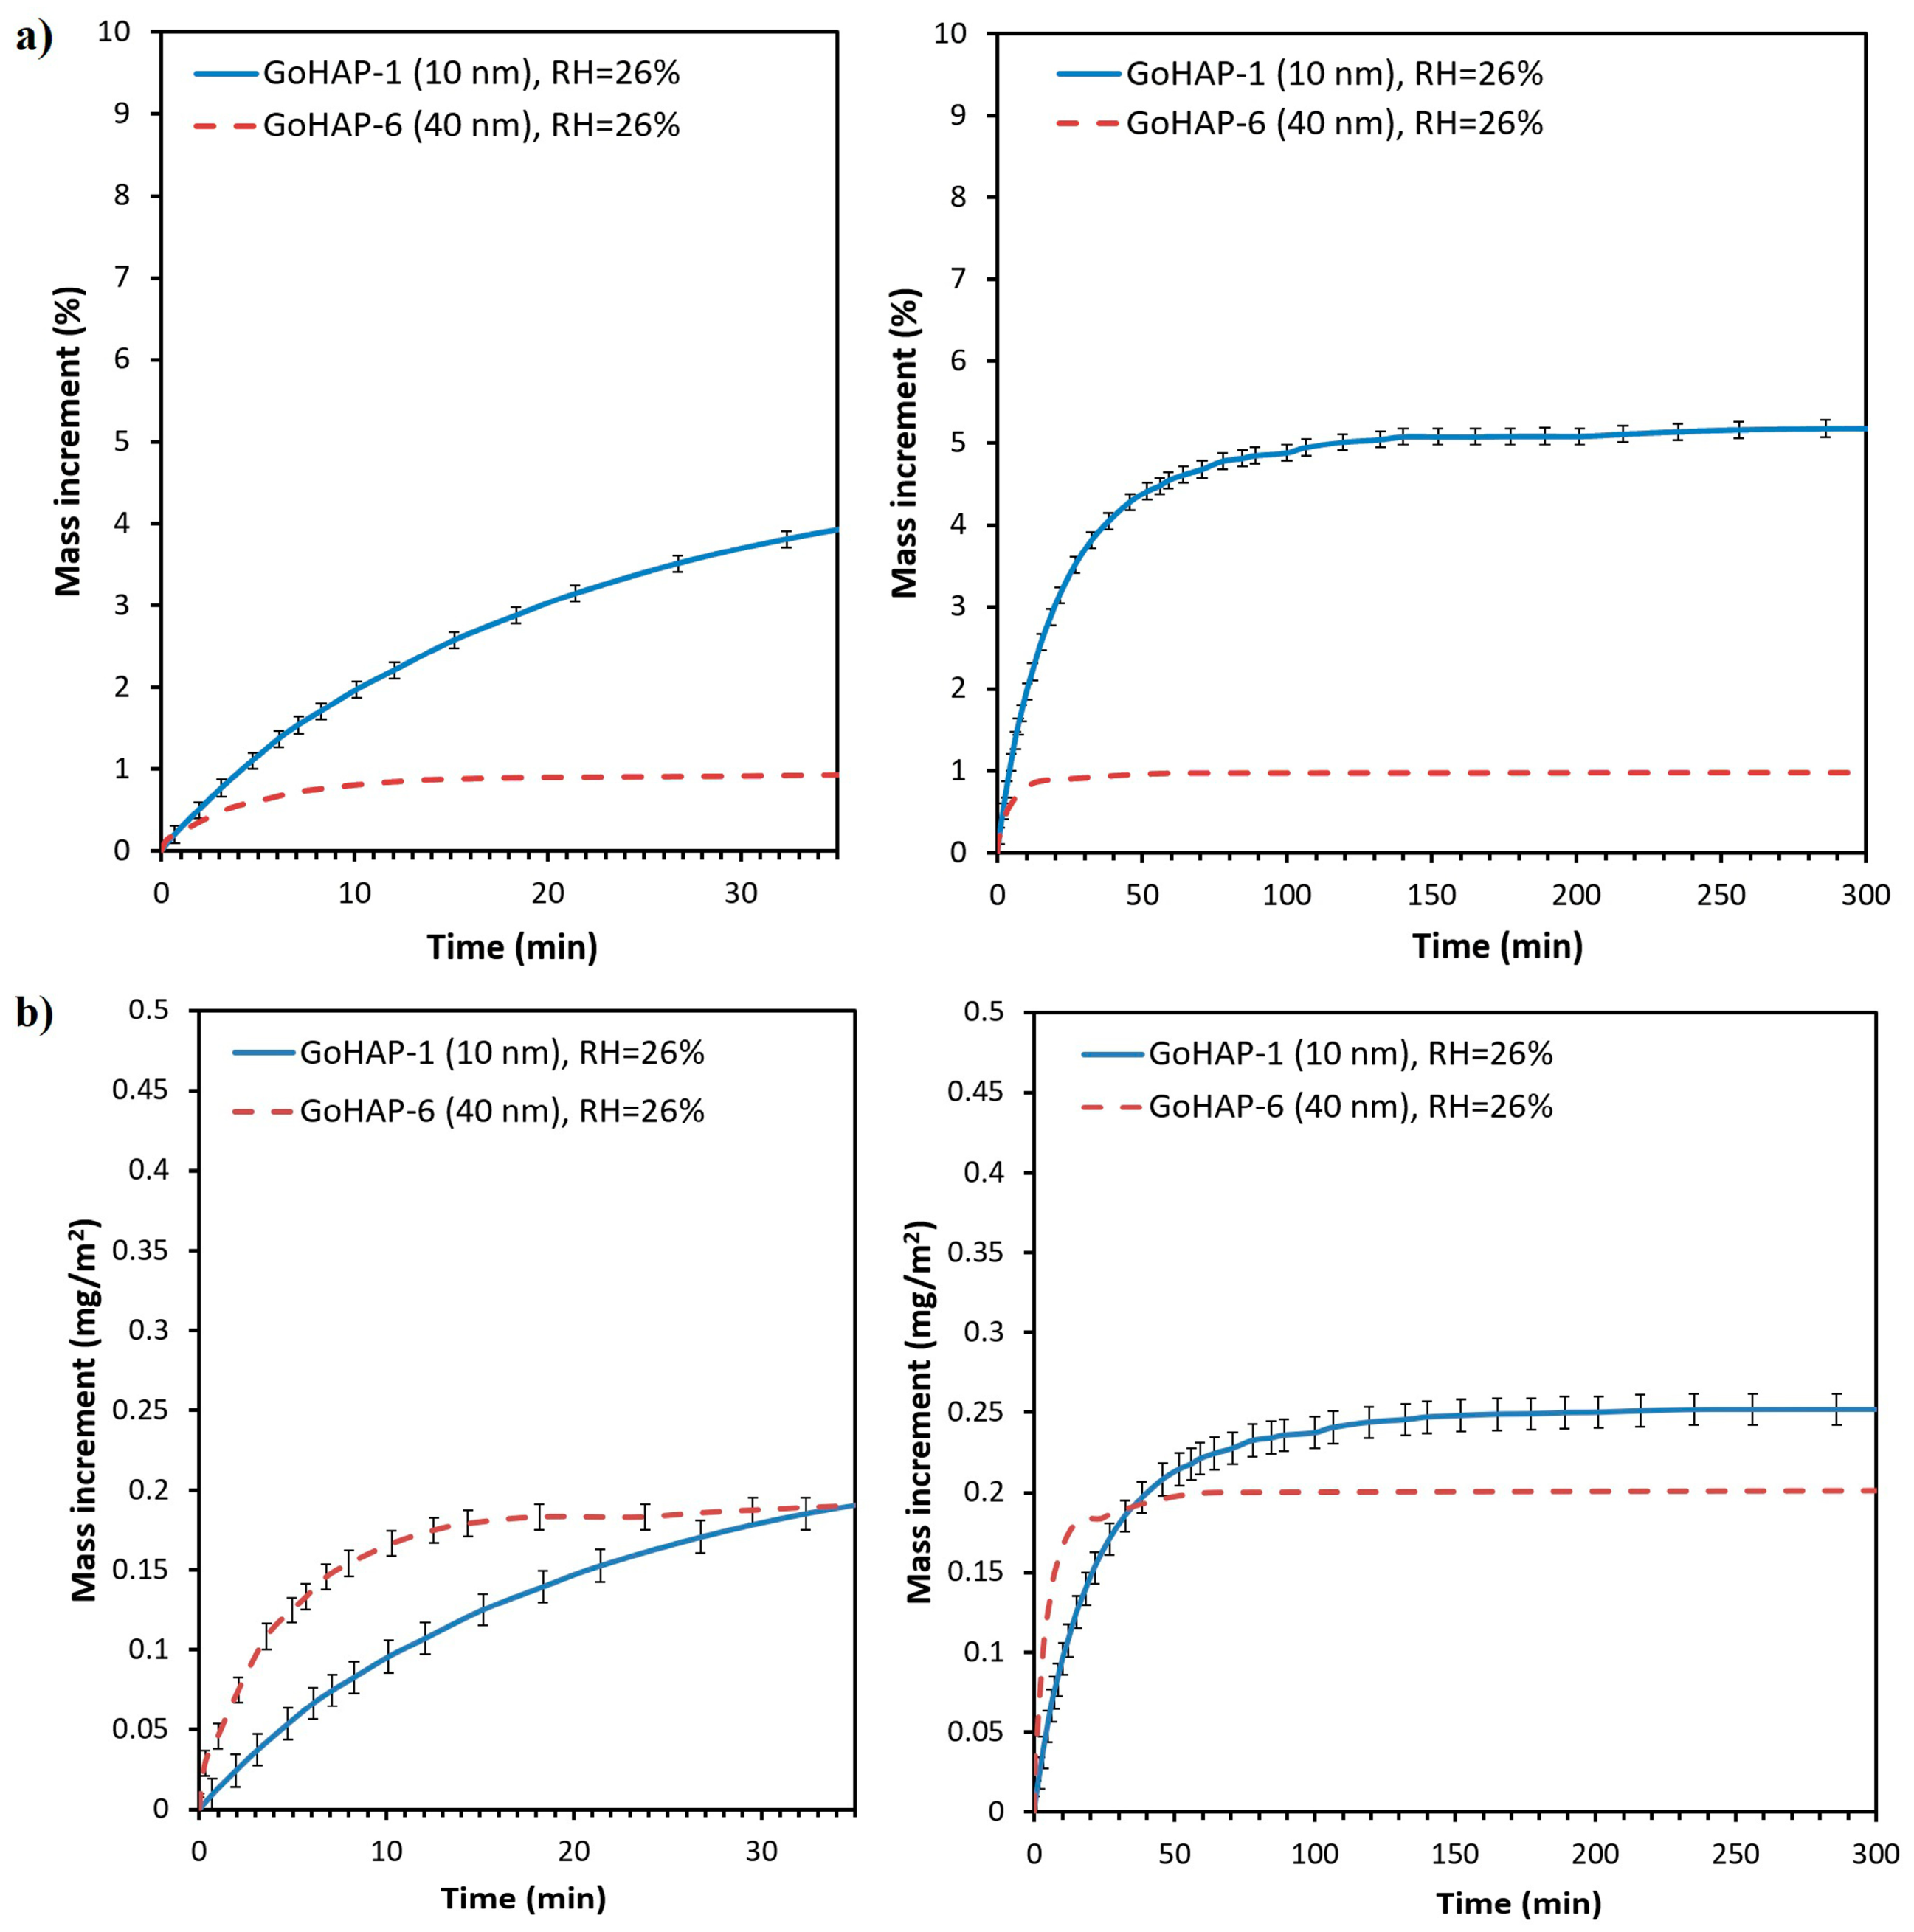
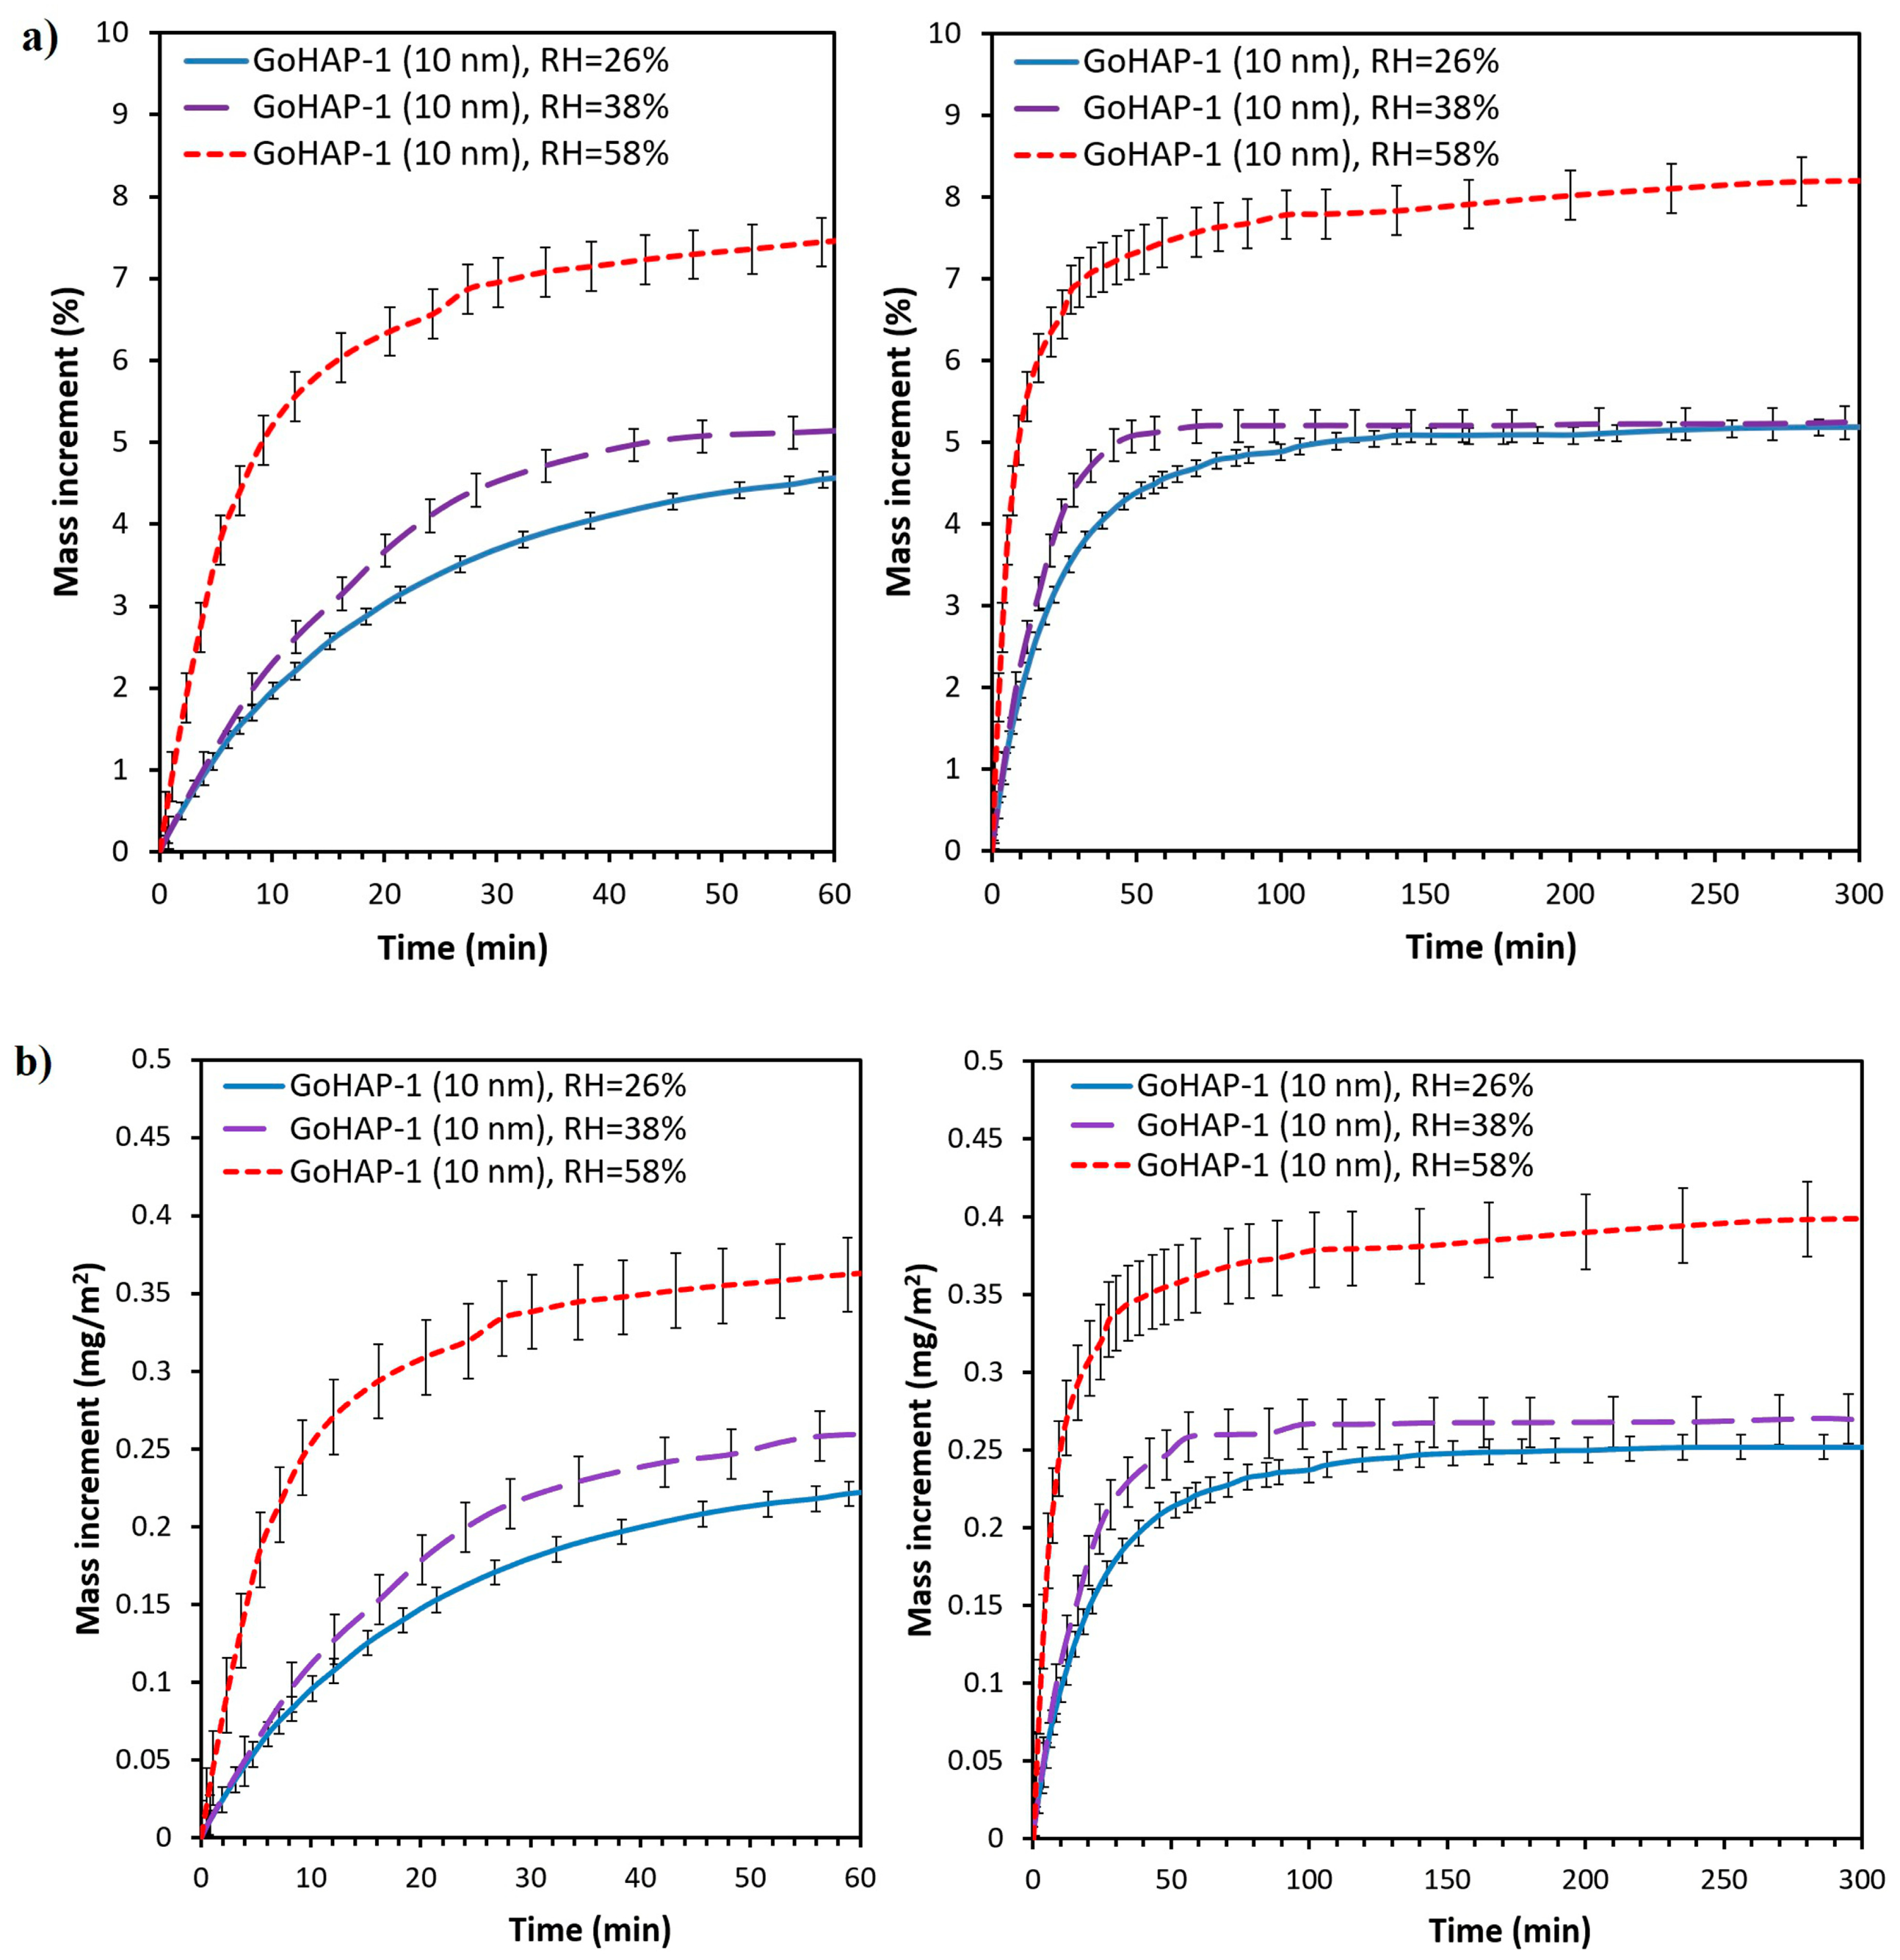
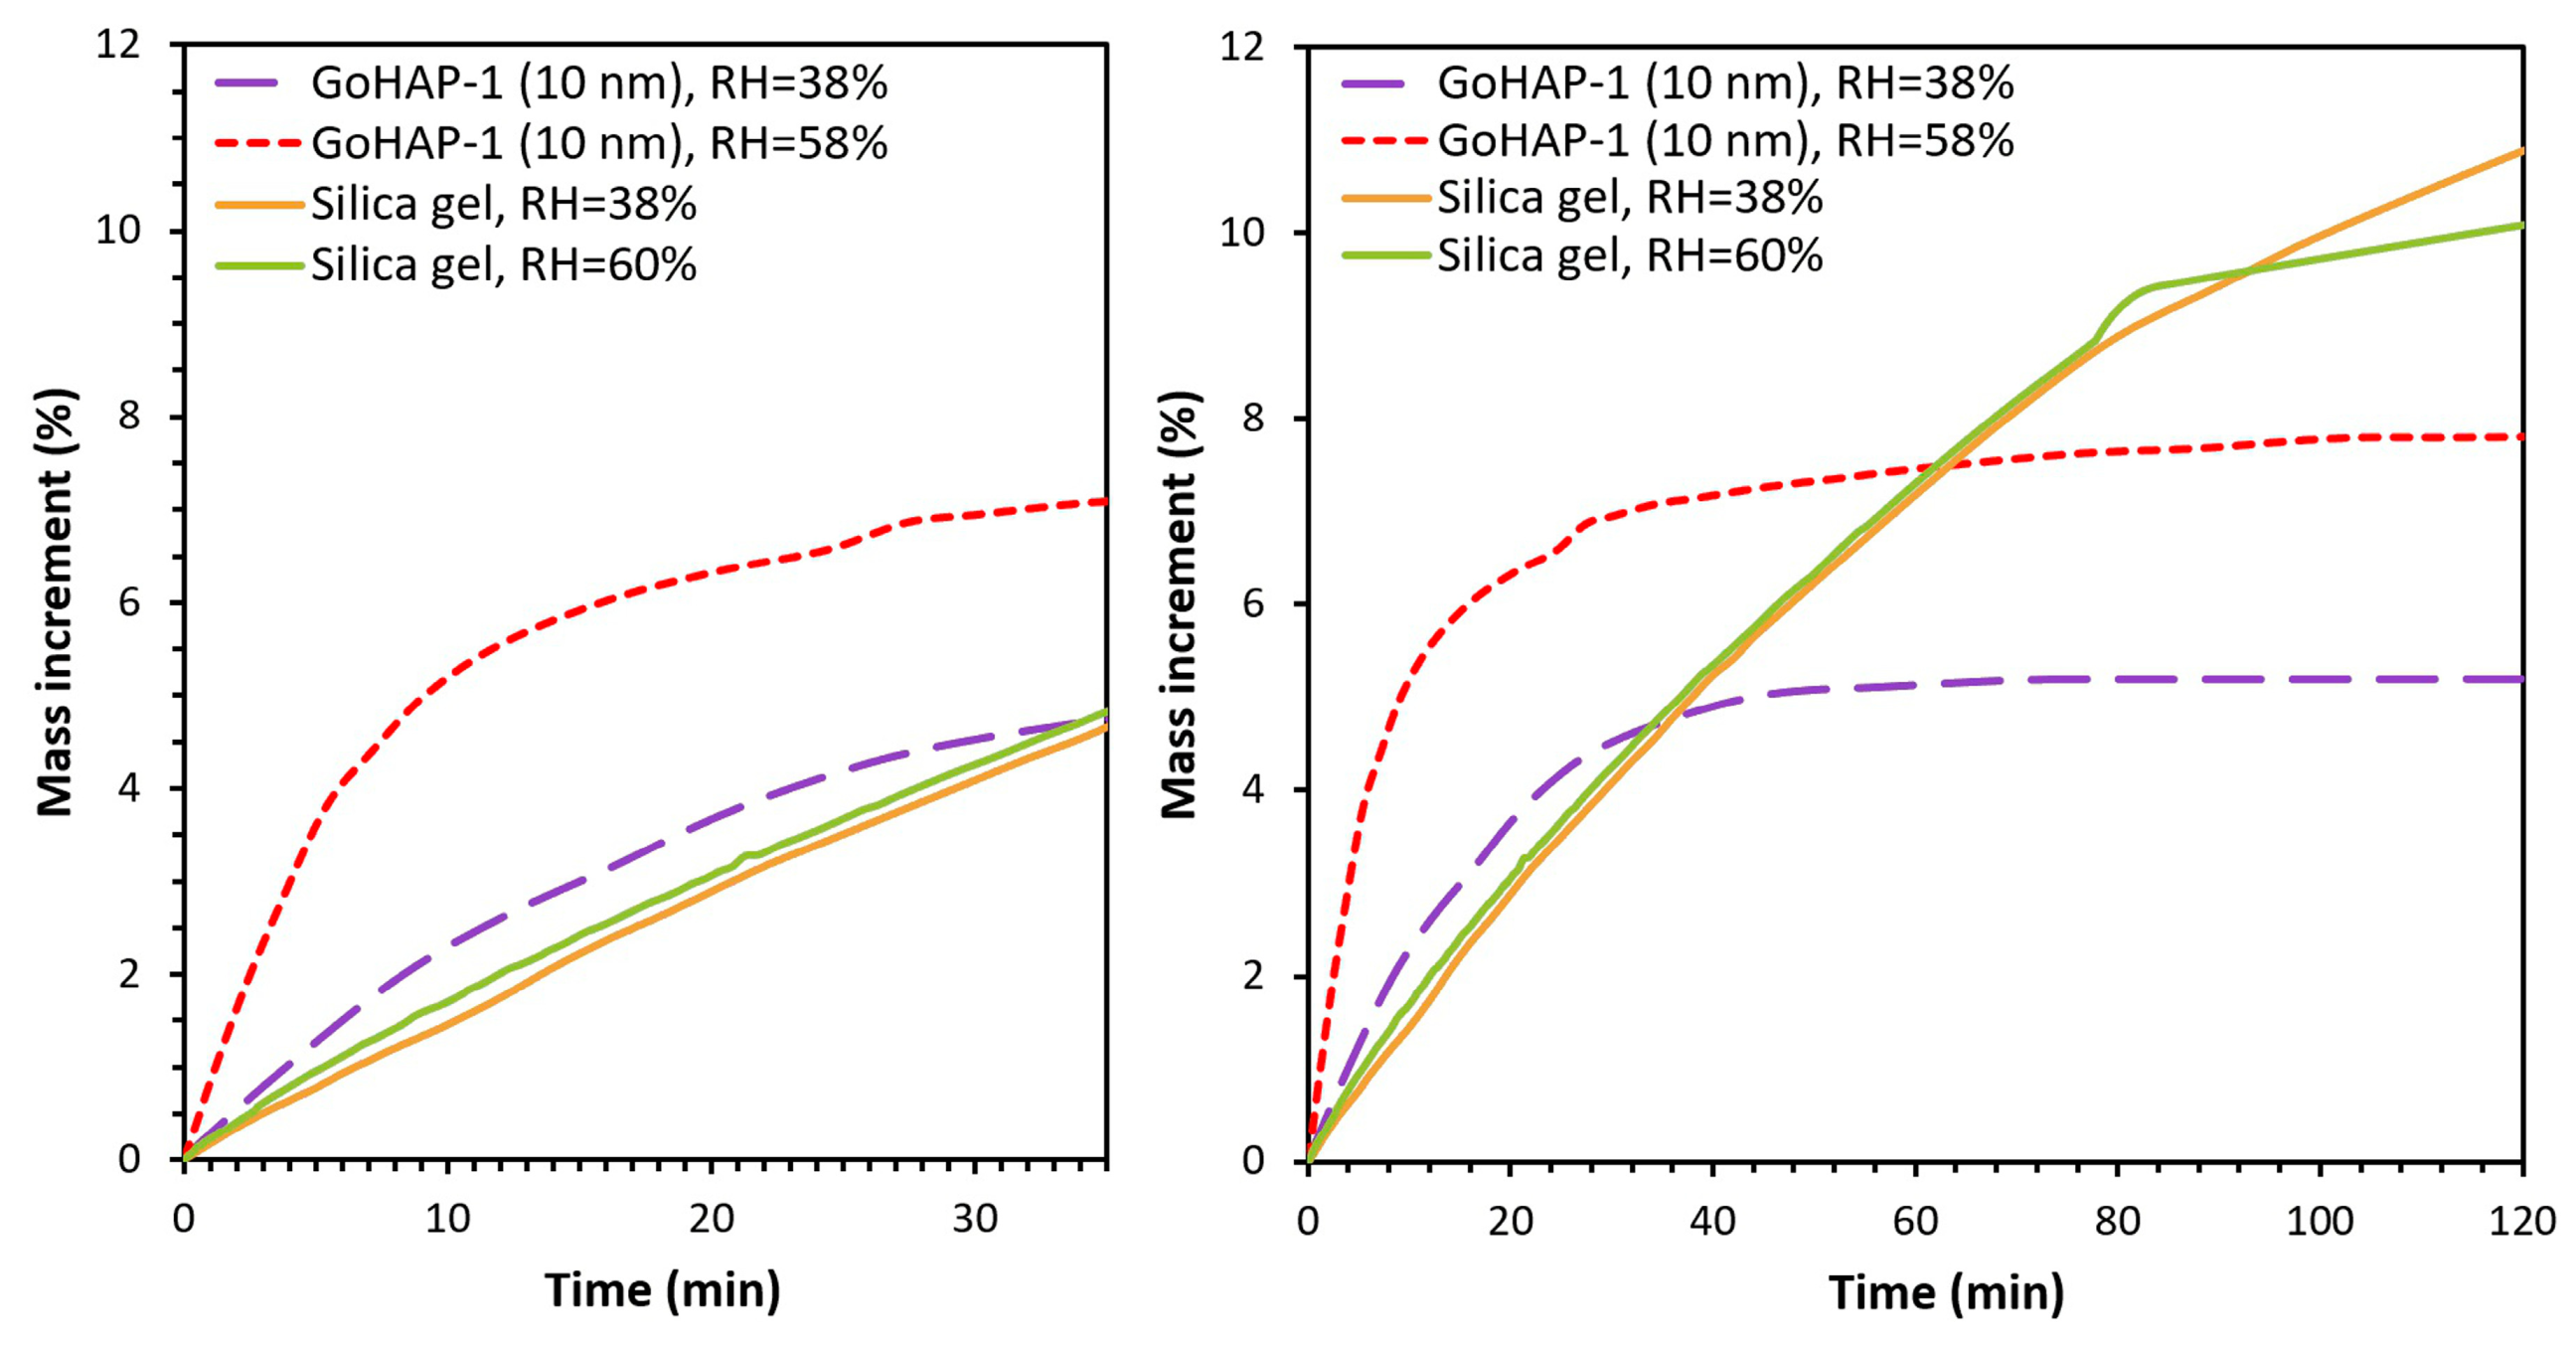
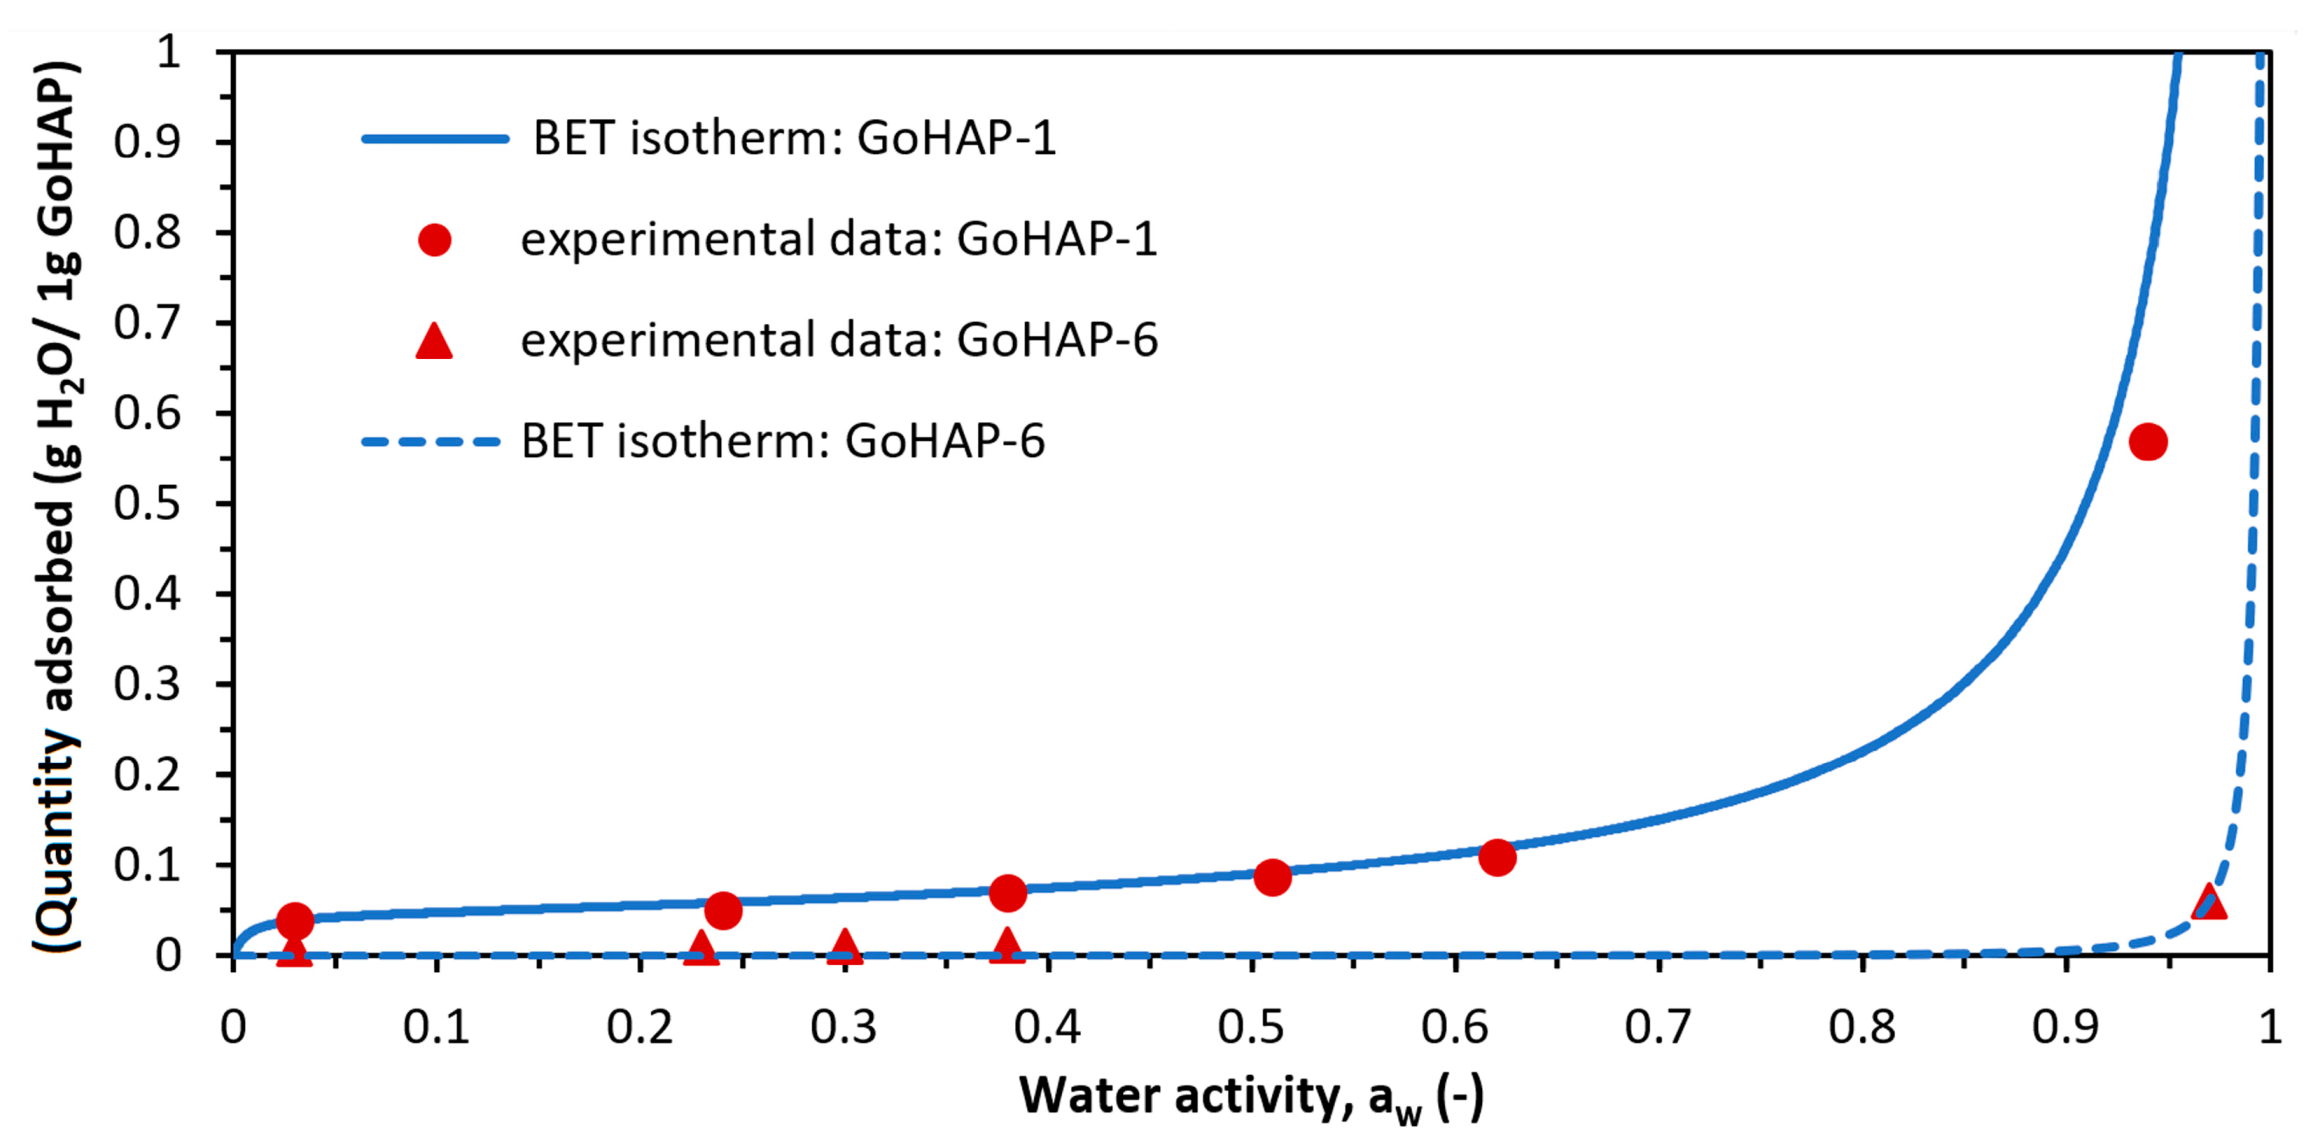
3.2. Examination of Water Adsorption Process
4. Discussion
5. Conclusions
Supplementary Materials
Author Contributions
Funding
Acknowledgments
Conflicts of Interest
References
- Guozhong, C. Emergence of nanotechnology. In Nanostructures and Nanomaterials Synthesis, Properties and Applications; Chog, S., Narayanan, L., Eds.; Imperial College Press: London, UK, 2004; pp. 4–7. ISBN 1-86094-4159. [Google Scholar]
- Favier, I.; Pla, D.; Gómez, M. Metal-based nanoparticles dispersed in glycerol: An efficient approach for catalysis. Catal. Today 2018, 310, 98–106. [Google Scholar] [CrossRef]
- Mancin, F.; Prins, L.J.; Scrimin, P. Catalysis on gold-nanoparticle-passivating monolayers. Curr. Opin. Colloid Interface Sci. 2013, 18, 61–69. [Google Scholar] [CrossRef]
- Gao, F.; Rajathurai, K.; Cui, Q.; Zhou, G.; Nkengforacha, I.; Gu, Z. Effect of surface oxide on the melting behavior of lead-free solder nanowires and nanorods. Appl. Surf. Sci. 2012, 258, 7507–7514. [Google Scholar] [CrossRef]
- Mishra, R.; Zemanova, A.; Kroupa, A.; Flandorfer, H.; Ipser, H. Synthesis and characterization of Sn-rich Ni—Sb—Sn nanosolders. J. Alloy. Compd. 2012, 513, 224–229. [Google Scholar] [CrossRef]
- Wu, M.; Wang, X.; Wang, K.; Guo, Z. An ultrasensitive fluorescent nanosensor for trypsin based on upconversion nanoparticles. Talanta 2017, 174, 797–802. [Google Scholar] [CrossRef]
- Zhang, C.Y.; Yeh, H.C.; Kuroki, M.T.; Wang, T.H. Single-quantum-dot-based DNA nanosensor. Nat. Mater. 2005, 4, 826–831. [Google Scholar] [CrossRef]
- Zhang, J.; Dichiara, A.; Novosselov, I.; Gao, D.; Chung, J.H. Polyacrylic acid coated carbon nanotube-paper composites for humidity and moisture sensing. J. Mater. Chem. C 2019, 7, 5374–5380. [Google Scholar] [CrossRef]
- Woźniak, B.; Szałaj, U.; Chodara, A.; Mizeracki, J.; Łojkowski, M.; Myszka, D.; Łojkowski, W. Mechanism for sonocoating a polymer surface with nano-hydroxyapatite. Mater. Lett. 2019, 249, 155–159. [Google Scholar] [CrossRef]
- Nastulyavichus, A.; Kudryashova, S.; Smirnov, N.; Saraeva, I.; Rudenko, A.; Tolordava, E.; Ionin, A.; Romanova, Y.; Zayarny, D. Antibacterial coatings of Se and Si nanoparticles. Appl. Surf. Sci. 2019, 469, 220–225. [Google Scholar] [CrossRef]
- Lin, C.J. Structure and properties of hydroxyapatite for biomedical applications. In Hydroxyapatite (HAp) for Biomedical Applications; Mucalo, M., Ed.; Woodhead Publishing: Cambridge, UK, 2015; Volume 95, pp. 3–19, ISBN-10: 1782420339. [Google Scholar]
- Alobeedallah, H.; Ellis, J.L.; Rohanizadeh, R.; Coster, H.; Dehghani, F. Preparation of nanostructured hydroxyapatite in organic lvents for clinical applications. Trends Biomater. Artif. Organs 2011, 25, 12–19. [Google Scholar]
- Szczes, A.; Holysz, L.; Chibowski, E. Synthesis of hydroxyapatite for biomedical applications. Adv. Colloid Interface Sci. 2017, 249, 1–10. [Google Scholar] [CrossRef] [PubMed]
- Rogowska-Tylman, J.; Locsc, J.; Salma, I.; Woźniak, B.; Pilmane, M.; Zalite, V.; Wojnarowicz, J.; Kędzierska-Sara, A.; Chudoba, T.; Szlązak, K.; et al. In vivo and in vitro study of a novel nanohydroxyapatite sonocoated scaffolds for enhanced bone regeneration. Mater. Sci. Eng. C 2019, 99, 669–684. [Google Scholar] [CrossRef] [PubMed]
- Jaworski, S.; Wierzbicki, M.; Sawosz, E.; Jung, A.; Gielerak, G.; Biernat, J.; Jaremek, H.; Łojkowski, W.; Woźniak, B.; Wojnarowicz, J.; et al. Graphene oxide-based nanocomposites decorated with silver nanoparticles as an antibacterial agent. Nanoscale Res. Lett. 2018, 13, 116. [Google Scholar] [CrossRef] [PubMed]
- Jędrzak, A.; Grześkowiak, B.F.; Coy, E.; Wojnarowicz, J.; Szutkowski, K.; Jurg, S.; Jesionowski, T.; Mrówczyński, R. Dendrimer based theranostic nanostructures for combined chemo- and photothermal therapy of liver cancer cells in vitro. Colloids Surf. B 2019, 173, 698–708. [Google Scholar] [CrossRef]
- Sheth, P.; Sandhu, H.; Singhal, D.; Malick, W.; Shah, N.; Serphil, K.M. Nanoparticles in the pharmaceutical industry and the use of supercritical fluid technologies for nanoparticle production. Curr. Drug Deliv. 2012, 9, 269–284. [Google Scholar] [CrossRef] [PubMed]
- Jamsheera, A.F.; Kupwade-Patilb, K.; Büyüköztürkb, O.; Bumajdada, A. Analysis of engineered cement paste using silica nanoparticles and metakaolin using 29Si NMR, water adsorption and synchrotron X-ray Diffraction. Const. Build. Mater. 2018, 180, 698–709. [Google Scholar] [CrossRef]
- Thiel, P.A.; Madey, T.E. The interaction of water with solidsurfaces—Fundamental-aspects. Surf. Sci. Rep. 1987, 7, 211–385. [Google Scholar] [CrossRef]
- Bose, S.; Tarafder, S.; Bandyopadhyay, A. Biomaterials. In Hydroxyapatite (Hap) for Biomedical Applications; Mucalo, M., Ed.; Woodhead Publishing: Cambridge, UK, 2015; pp. 143–157. [Google Scholar] [CrossRef]
- Chen, L.; Yu, Q.; Wang, Y.; Li, H. BisGMA/TEGDMA dental composite containing high aspect-ratio hydroxyapatite nanofibers. Dent. Mater. 2011, 27, 1187–1195. [Google Scholar] [CrossRef] [PubMed]
- Sadat-Shojai, M.; Atai, M.; Nodehi, A.; Khanlar, L.N. Hydroxyapatite nanorods as novel fillers for improving the properties of dental adhesives: Synthesis and application. Dent. Mater. 2010, 26, 471–482. [Google Scholar] [CrossRef] [PubMed]
- Ong, J.L.; Chan, D.C.N. Hydroxyapatite and their use as coatings in dental implants: A review. Crit. Rev. Biomed. Eng. 2000, 28, 667–707. [Google Scholar] [CrossRef] [PubMed]
- Pokrowiecki, R.; Pałka, K.; Mielczarek, A. Nanomaterials in dentistry: A cornerstone or a black box? Nanomedicine 2018, 13, 639–667. [Google Scholar] [CrossRef] [PubMed]
- Meskinfam, M.; Sadjadi, M.A.S.; Jazdarreh, H.; Zare, K. Biocompatibility evaluation of nano hydroxyapatite-starch biocomposites. J. Biomed. Nanotechnol. 2011, 7, 455–459. [Google Scholar] [CrossRef] [PubMed]
- Zhang, Z.; Kurita, H.; Kobayashi, H.; Kurashina, K. Osteoinduction with HA/TCP ceramics of different composition and porous structure in rabbits. Oral Sci. Inter. 2005, 2, 85–95. [Google Scholar] [CrossRef]
- Zhang, Z.; Zhang, S.; Shang, L. Apatite-coated polymer template for implant and drug delivery. In Hydroxyapatite Coating for Biomedical Applications; Zhang, S., Ed.; CRC Press: Boca Raton, FL, USA, 2013; pp. 239–288. [Google Scholar]
- Dry, M.E.; Beebe, R.A. Adsorption studies on bone mineral and synthetic hydroxyapatite. J. Phys. Chem. 1960, 29, 1300–1304. [Google Scholar] [CrossRef]
- Rootary, H.M.; Craig, R.G. Vapour phase adsorption of water on hydroxyapatite. J. Dent. Res. 1977, 56, 1437–1448. [Google Scholar] [CrossRef] [PubMed]
- Holmes, J.M.; Beebe, R.A.; Posner, A.S.; Harper, R.A. Surface areas of synthetic calcium phosphates and bone mineral. Exp. Biol. Med. 1971, 133, 1250–1253. [Google Scholar] [CrossRef] [PubMed]
- Wade, J.B.; Martin, G.P.; Long, D.F. A methodological approach for determining the effect of moisture content on the compaction properties of powders: Granular hydroxyapatite. Powder Technol. 2013, 246, 511–519. [Google Scholar] [CrossRef]
- Kuśnieruk, S.; Wojnarowicz, J.; Chodara, A.; Chudoba, T.; Gierlotka, S.; Lojkowski, W. Influence of hydrothermal synthesis parameters on the properties of hydroxyapatite nanoparticles. Beilstein J. Nanotechnol. 2016, 7, 1586–1601. [Google Scholar] [CrossRef] [PubMed]
- Nakamura, T.; Yamashita, K.; Neo, M. Remineralization potential of new toothpaste containing nano-hydroxyapatite. Key Eng. Mater. 2006, 647, 139–144. [Google Scholar] [CrossRef]
- Niamtu, J., 3rd. New lip and wrinkle fillers. Oral Maxillofac. Surg. Clin. N. Am. 2005, 17, 17–28. [Google Scholar] [CrossRef] [PubMed]
- Dick, T.A.; Dos Santos, L.A. In situ synthesis and characterization of hydroxyapatite/natural rubber composites for biomedical applications. Mater. Sci. Eng. C 2017, 77, 874–882. [Google Scholar] [CrossRef] [PubMed]
- Miyazaki, T.; Kawashita, M. Electrochemical deposition of hydroxyapatite and its biomedical applications. In Hydroxyapatite Coatings for Biomedical Applications; Zhang, S., Ed.; CRC Press: Boca Raton, FL, USA, 2013; pp. 31–55. [Google Scholar] [CrossRef]
- Franklin-Ford, T.W.; Suarez-Gonzalez, D.; Sung Lee, J.; Murphy, W.L. Biomimetic hydroxyapatite materials for therapeutic delivery. In Hydroxyapatite Synthesis, Properties and Applications; Zhang, S., Ed.; CRC Press: New York, NY, USA, 2012; pp. 201–239. [Google Scholar]
- Wang, X.; Li, Y.; Wei, J.; De Groot, K. Development of biomimetic nano-hydroxyapatite/poly(hexamethylene adipamide) composites. Biomaterials 2002, 23, 4787–4791. [Google Scholar] [CrossRef]
- Le Bolay, N.; Lamure, A.; Gallego Leis, N.; Subhani, A. How to combine a hydrophobic matrix and a hydrophilic filler without adding a compatibilizer—Co-grinding enhances use properties of Renewable PLA–starch composites. Chem. Eng. Process. 2012, 56, 1–9. [Google Scholar] [CrossRef]
- Bangudu, A.B.; Pilpel, N. Effects of composition, moisture and stearic acid on the plasto-elasticity and tableting of paracetamol-microcrystalline cellulose mixtures. J. Pharm. Pharmacol. 1985, 5, 289–293. [Google Scholar] [CrossRef] [PubMed]
- Abboud, M.; Turner, M.; Duguet, E.; Fontanille, M. PMMA-based composite materials with reactive ceramic fillers PMMA-based composite materials with reactive ceramic fillers. J. Mater. Chem. 1997, 7, 1527–1532. [Google Scholar] [CrossRef]
- Hong, Z.; Zhang, P.; He, C.; Qiu, X.; Liu, A.; Chem, L.; Chen, X.; Jing, X. Nano-composite of poly(L-lactide) and surface grafted hydroxyapatite: Mechanical properties and biocompatibility. Biomaterials 2005, 26, 6296–6304. [Google Scholar] [CrossRef]
- Wang, T. Improve the strength of PLA/HA composite through the use of surface initiated polymerization and phosphonic acid coupling agent. J. Res. Natl. Inst. Stand. Technol. 2011, 116, 785–796. [Google Scholar] [CrossRef]
- Nokhodchi, A.; Rubinstein, M.H.; Larhirb, H.; Guyot, J.C. The effect of moisture on the properties of ibuprofen tablets. Int. J. Pharmac. 1995, 118, 191–197. [Google Scholar] [CrossRef]
- Garr, J.S.M.; Rubinstein, M.H. The influence of moisture on consolidation and compaction properties of paracetamol. Int. J. Pharmac. 1992, 81, 187–192. [Google Scholar] [CrossRef]
- Thapa, P.; Lee, A.R.; Choi, D.H.; Jeong, S.H. Effects of moisture content and compression pressure of various deforming granules on the physical properties of tablets. Powder Technol. 2017, 310, 92–102. [Google Scholar] [CrossRef]
- Muti, H.; Othman, S. Effects of binders and moisture content on the disintegration, hardness and friability of paracetamol and orphenadrine citrate tablets. Drug Dev. Ind. Pharm. 1989, 15, 2017–2035. [Google Scholar] [CrossRef]
- Smolen, D.; Kedzierska, A.; Pietrzykowska, E.; Chudoba, T.; Lojkowski, W.; Swieszkowski, W.; Kurzydlowski, K. Method for Producing Synthetic Hydroxyapatite Nanoplates and Nanopowder Containing Synthetic Hydroxyapatite Nanoplate. WO2014162167A1, 9 October 2014. [Google Scholar]
- Opalinska, A.; Leonelli, C.; Lojkowski, W.; Pielaszek, R.; Grzanka, E.; Chudoba, T.; Matysiak, H.; Wejrzanowski, T.; Kurzydlowski, K.J. Effect of Pressure on Synthesis of Pr-Doped Zirconia Powders Produced by Microwave-Driven Hydrothermal Reaction. J. Nanomater. 2006, 2006, 98769. [Google Scholar] [CrossRef]
- Wojnarowicz, J.; Chudoba, T.; Gierlotka, S.; Lojkowski, W. Effect of microwave radiation power on the size of aggregates of ZnO NPs prepared using microwave solvothermal synthesis. Nanomaterials 2018, 8, 343. [Google Scholar] [CrossRef] [PubMed]
- Wojnarowicz, J.; Chudoba, T.; Gierlotka, S.; Sobczak, K.; Lojkowski, W. Size control of cobalt-doped ZnO nanoparticles obtained in microwave solvothermal synthesis. Crystals 2018, 8, 179. [Google Scholar] [CrossRef]
- Wojnarowicz, J.; Mukhovskyi, R.; Pietrzykowska, E.; Kusnieruk, S.; Mizeracki, J.; Lojkowski, W. Microwave solvothermal synthesis and characterization of manganese-doped ZnO nanoparticles. Beilstein J. Nanotechnol. 2016, 7, 721–732. [Google Scholar] [CrossRef]
- Wojnarowicz, J.; Opalinska, A.; Chudoba, T.; Gierlotka, S.; Mukhovskyi, R.; Pietrzykowska, E.; Sobczak, K.; Lojkowski, W. Effect of water content in ethylene glycol solvent on the size of ZnO nanoparticles prepared using microwave solvothermal synthesis. J. Nanomater. 2016, 2016, 2789871. [Google Scholar] [CrossRef]
- Wojnarowicz, J.; Chudoba, T.; Koltsov, I.; Gierlotka, S.; Dworakowska, S.; Lojkowski, W. Size control mechanism of ZnO nanoparticles obtained in microwave solvothermal synthesis. Nanotechnology 2018, 29, 065601. [Google Scholar] [CrossRef]
- Lojkowski, W.; Leonelli, C.; Chudoba, T.; Wojnarowicz, J.; Majcher, A.; Mazurkiewicz, A. High-energy-low-temperature technologies for the synthesis of nanoparticles: Microwaves and high pressure. Inorganics 2014, 2, 606–619. [Google Scholar] [CrossRef]
- Nanda, K. Liquid-drop model for the surface energy of nanoparticles. Phys. Lett. A 2012, 376, 1647–1649. [Google Scholar] [CrossRef]
- Lu, H.M.; Jiang, Q. Size-dependent surface energies of nanocrystals. J. Phys. Chem. B 2004, 108, 5617–5619. [Google Scholar] [CrossRef]
- Majcher, A.; Wiejak, J.; Przybylski, J.; Chudoba, T.; Wojnarowicz, J. A novel reactor for microwave hydrothermal scale-up nanopowder synthesis. Int. J. Chem. React. Eng. 2013, 11, 361–368. [Google Scholar] [CrossRef]
- Dąbrowska, S.; Chudoba, T.; Wojnarowicz, J.; Łojkowski, W. Current trends in the development of microwave reactors for the synthesis of nanomaterials in laboratories and industries: A review. Crystals 2018, 8, 379. [Google Scholar] [CrossRef]
- Pielaszek, R. Analytical expression for diffraction line profile for polydispersive powders. Appl. Crystallogr. Proc. XIX Conf. 2004, 43–50. [Google Scholar] [CrossRef]
- Pielaszek, R. FW15/45M method for determination of the grain size distribution from powder diffraction line profile. J. Alloy. Compd. 2004, 37, 128–132. [Google Scholar] [CrossRef]
- Opalinska, A.; Malka, I.; Dzwolak, W.; Chudoba, T.; Presz, A.; Lojkowski, W. Size-dependent density of zirconia nanoparticles. Belistein J. Nanotechnol. 2015, 6, 27–35. [Google Scholar] [CrossRef] [PubMed]
- Pigoń, K.; Ruziewicz, Z. Adsorpcja. In Chemia Fizyczna; PWN: Waraw, Poland, 1980; pp. 323–329. ISBN 9788301150549. [Google Scholar]
- Pickett, G. Modification of the Brunauer—Emmett—Teller theory of multimolecular adsorption. J. Am. Chem. Soc. 1945, 67, 1958–1962. [Google Scholar] [CrossRef]
- Chung, Y.W. Atomic and molecular bonding. In Introduction to Materials Science and Engineering; Chung, Y.W., Ed.; CRC Press Taylor & Francis: Boca Raton, FL, USA, 2006; p. 16, ISBN-10:0849392632. [Google Scholar]
- Quadros, M.E.; Marr, L.C. Environmental and human health risks of aerosolized silver nanoparticles. J. Air Waste Manag. Assoc. 2010, 60, 770–781. [Google Scholar] [CrossRef]
- Armstrong, N.A.; Patel, A. The compressional properties of dextrose monohydrate and anhydrous dextrose of varying water contents. Drug Dev. Ind. Pharm. 1986, 12, 1885–1901. [Google Scholar] [CrossRef]


| Sample Name | SSA (BET) | DEN | SMDBET | MPSTEM | MCSXRD | MCSSch | |
|---|---|---|---|---|---|---|---|
| (m2/g) | (g/cm3) | (nm) | (nm) | (nm) | Length (nm) | Width (nm) | |
| GoHAP-1 (10 nm) | 206 ± 1 | 2.87 ± 0.01 | 10 | - | 10 ± 6 | 19 | 5 |
| GoHAP-6 (40 nm) | 49 ± 1 | 3.09 ± 0.01 | 40 | 39 ± 1 | 62 ± 43 | 54 | 34 |
| Relative Humidity (%) | Adsorption (%) | Specific Adsorption (mg/m2) |
|---|---|---|
| 26 | 5.2 | 0.25 |
| 38 | 5.4 | 0.26 |
| 58 | 8.2 | 0.40 |
| Test Sample | Parameter | Statistics | ||
|---|---|---|---|---|
| am | c | S | F-test | |
| GoHAP-1 (10 nm) | 0.045 | 161 | 0.013 | 230 |
| GoHAP-6 (40 nm) | 0.0078 | 0.00419 | 0.011 | 3.72 |
| Relative Humidity | ||||
|---|---|---|---|---|
| from SSA Method | from BET Isotherm | from SSA Method | from BET Isotherm | |
| 3% | 0.5 | 0.3 | 1.5 | 0.9 |
| 24% | 1.1 | 0.3 | 3.8 | 1.6 |
| 38% | 1.2 | 0.6 | 4.1 | 2 |
| 62% | 1.3 | 0.9 | 4.4 | 3 |
| 94% | 7.1 | 3.6 | 23.6 | 12 |
| Relative Humidity | ||||
|---|---|---|---|---|
| from SSA Method | from BET Isotherm | from SSA Method | from BET Isotherm | |
| 3% | 0.2 | 0.3 | 0.6 | 1.0 |
| 24% | 0.2 | 0.4 | 0.7 | 1.2 |
| 30% | 0.3 | 0.5 | 0.9 | 1.5 |
| 38% | 0.3 | 0.5 | 1.0 | 1.6 |
| 97% | 1.4 | 2.3 | 4.8 | 7.8 |
| Sample Name | Mass Change (%) | |
|---|---|---|
| Heating to 800 °C (TG) | Heating to 150 °C (DS) | |
| GoHAP-1 (10 nm) | −9.2 | −6.3 |
| GoHAP-6 (40 nm) | −2.0 | −1.8 |
© 2019 by the authors. Licensee MDPI, Basel, Switzerland. This article is an open access article distributed under the terms and conditions of the Creative Commons Attribution (CC BY) license (http://creativecommons.org/licenses/by/4.0/).
Share and Cite
Szałaj, U.; Świderska-Środa, A.; Chodara, A.; Gierlotka, S.; Łojkowski, W. Nanoparticle Size Effect on Water Vapour Adsorption by Hydroxyapatite. Nanomaterials 2019, 9, 1005. https://doi.org/10.3390/nano9071005
Szałaj U, Świderska-Środa A, Chodara A, Gierlotka S, Łojkowski W. Nanoparticle Size Effect on Water Vapour Adsorption by Hydroxyapatite. Nanomaterials. 2019; 9(7):1005. https://doi.org/10.3390/nano9071005
Chicago/Turabian StyleSzałaj, Urszula, Anna Świderska-Środa, Agnieszka Chodara, Stanisław Gierlotka, and Witold Łojkowski. 2019. "Nanoparticle Size Effect on Water Vapour Adsorption by Hydroxyapatite" Nanomaterials 9, no. 7: 1005. https://doi.org/10.3390/nano9071005
APA StyleSzałaj, U., Świderska-Środa, A., Chodara, A., Gierlotka, S., & Łojkowski, W. (2019). Nanoparticle Size Effect on Water Vapour Adsorption by Hydroxyapatite. Nanomaterials, 9(7), 1005. https://doi.org/10.3390/nano9071005