Silver Nanoparticles on Cellulose Surfaces: Quantitative Measurements


Abstract

1. Introduction
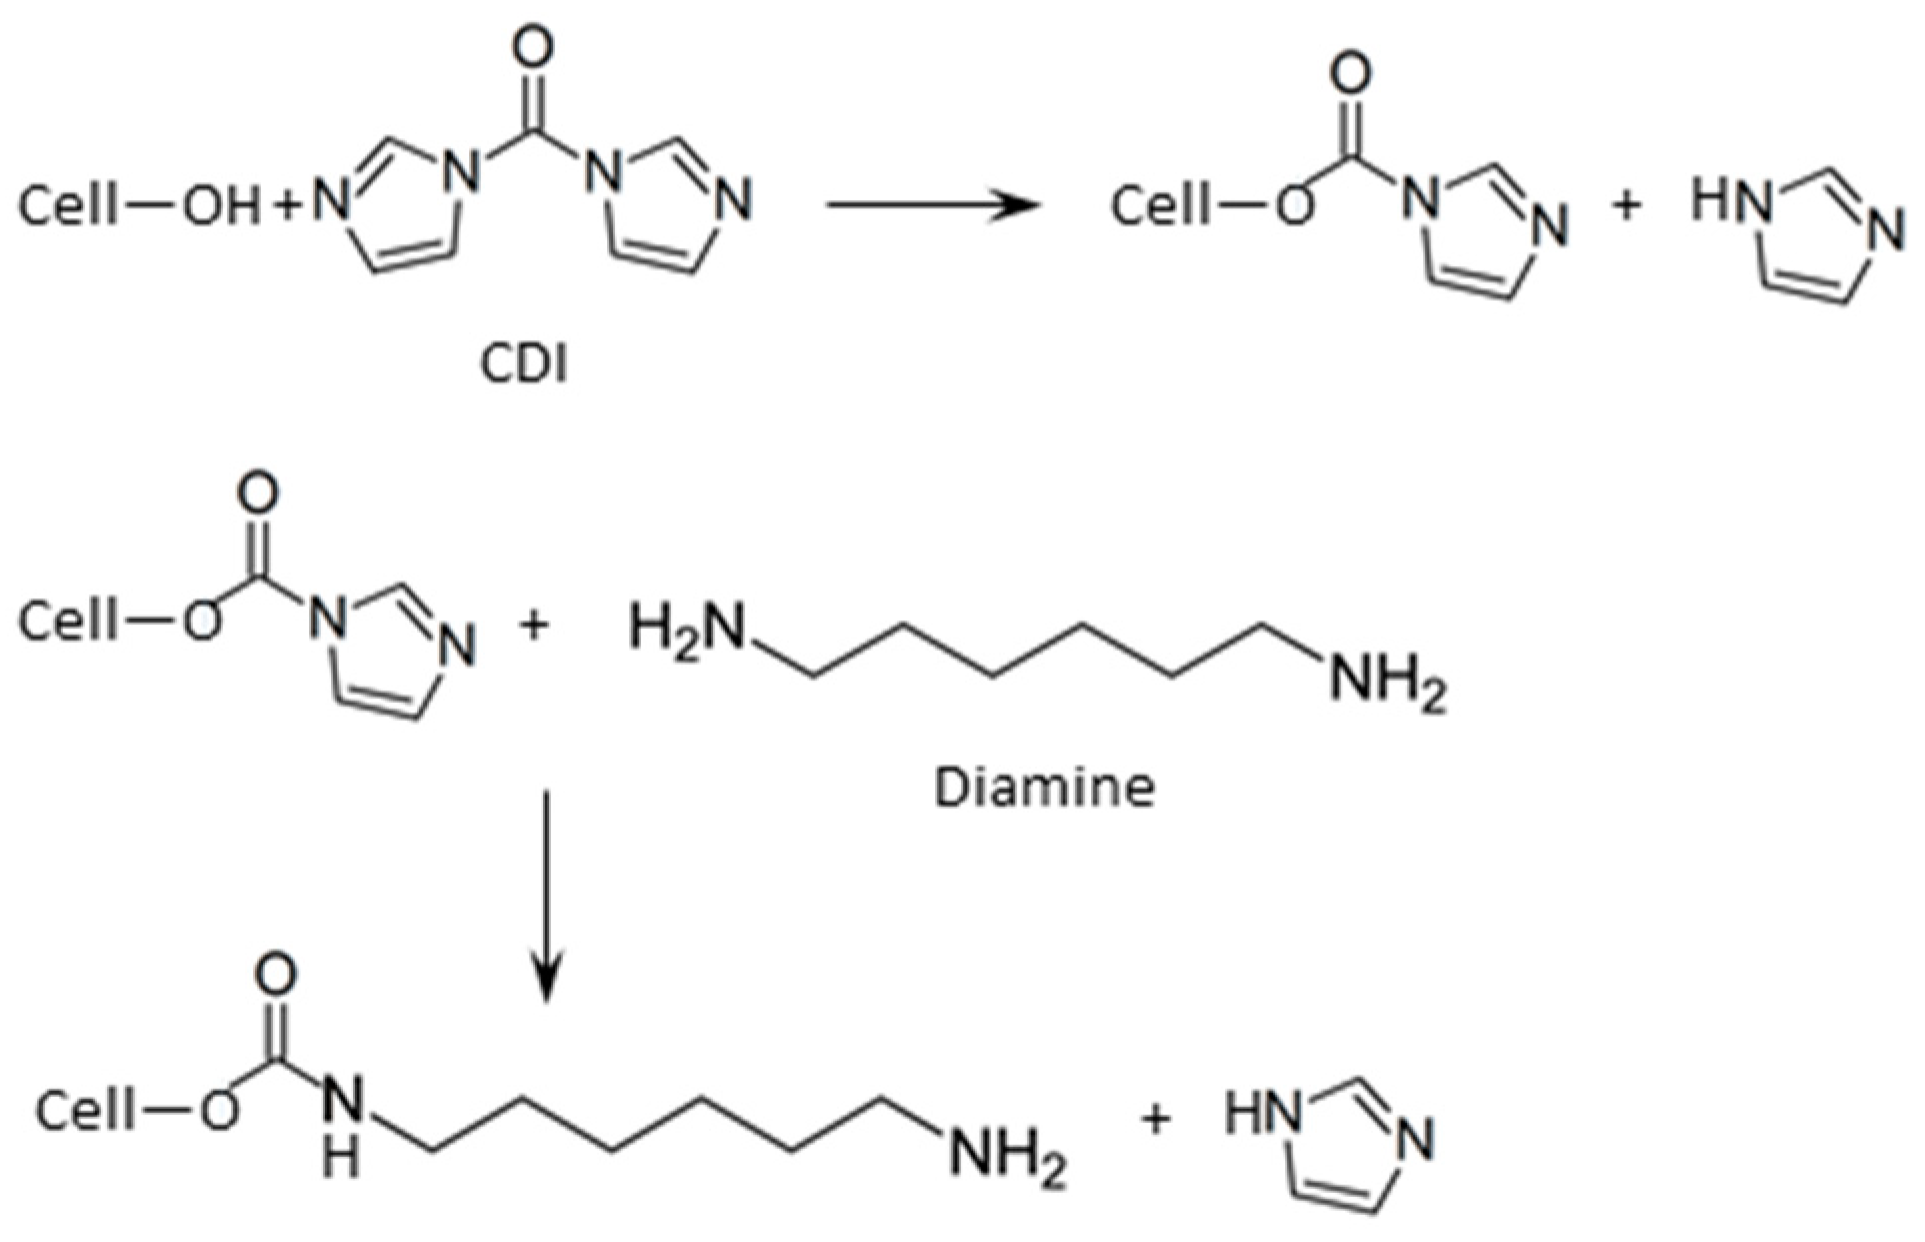
2. Materials and Methods
3. Results
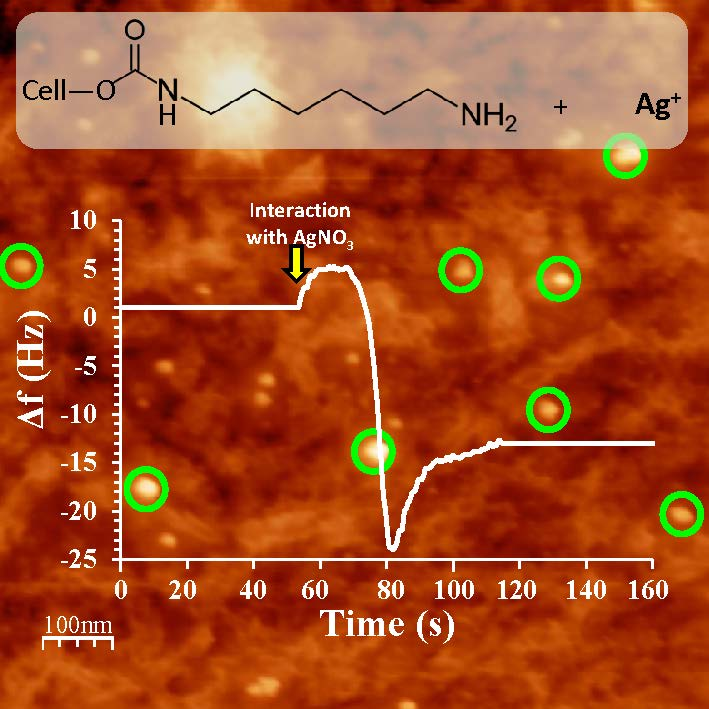
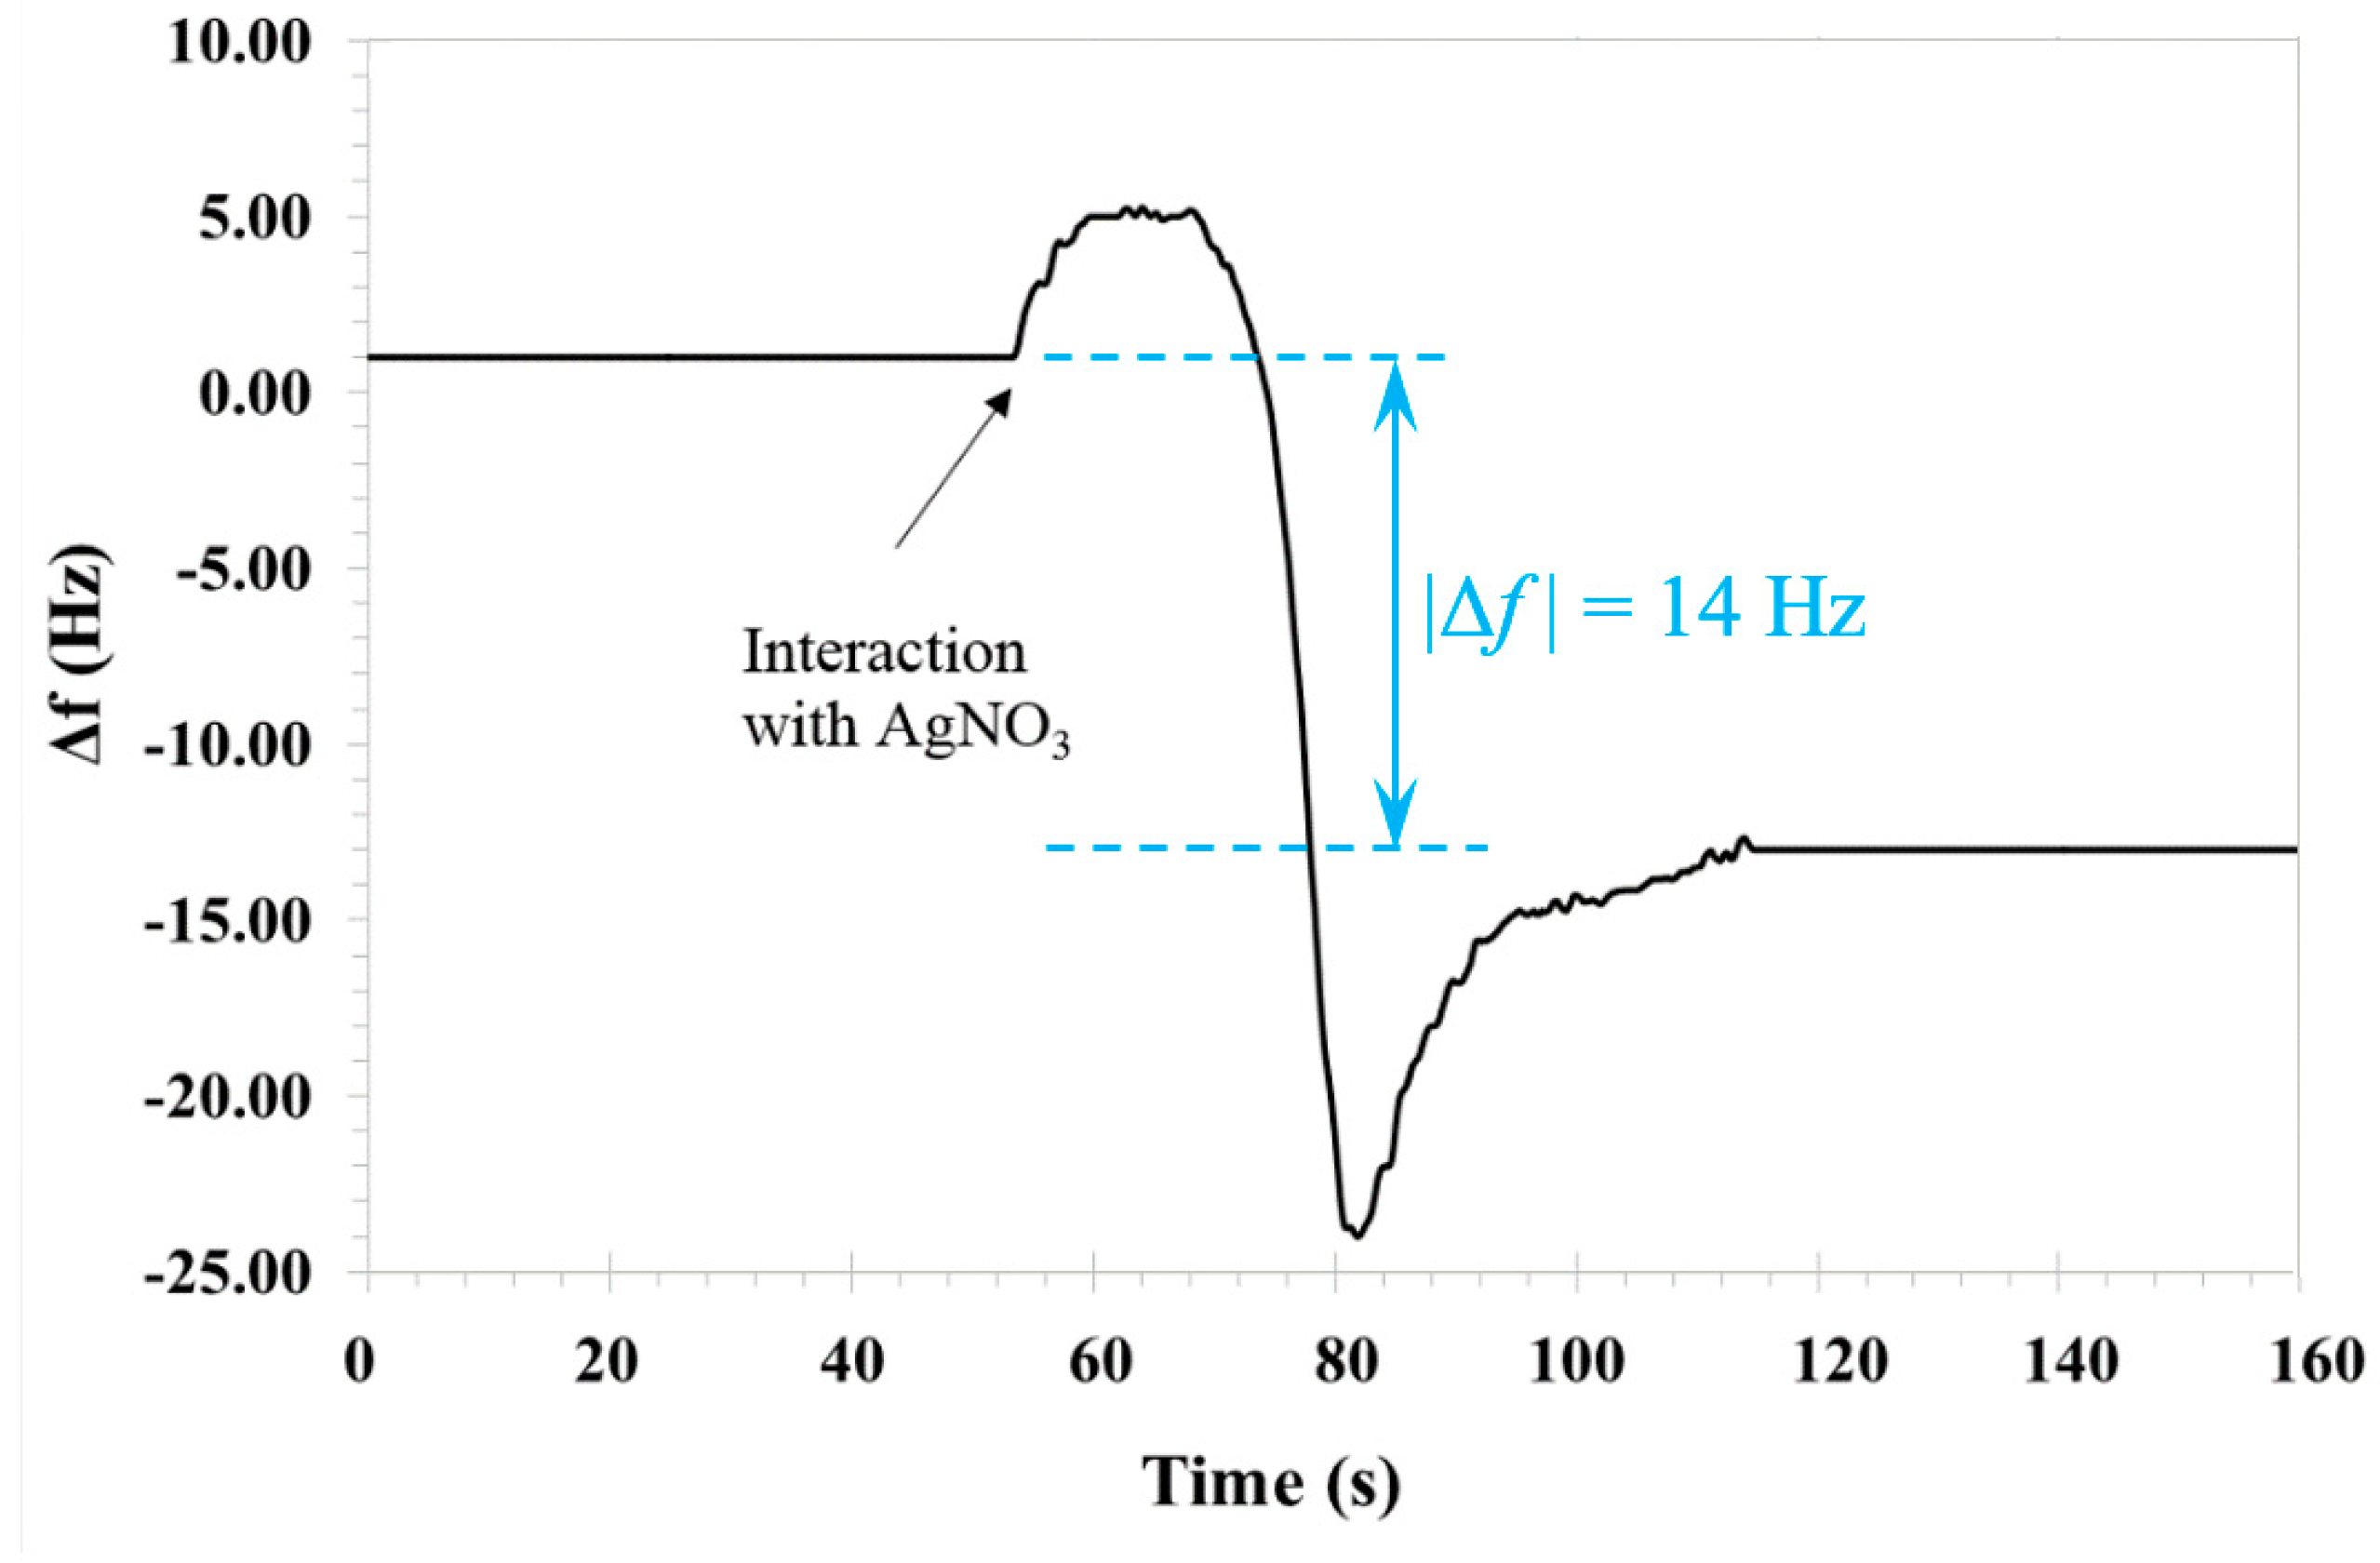
3.1. QCM
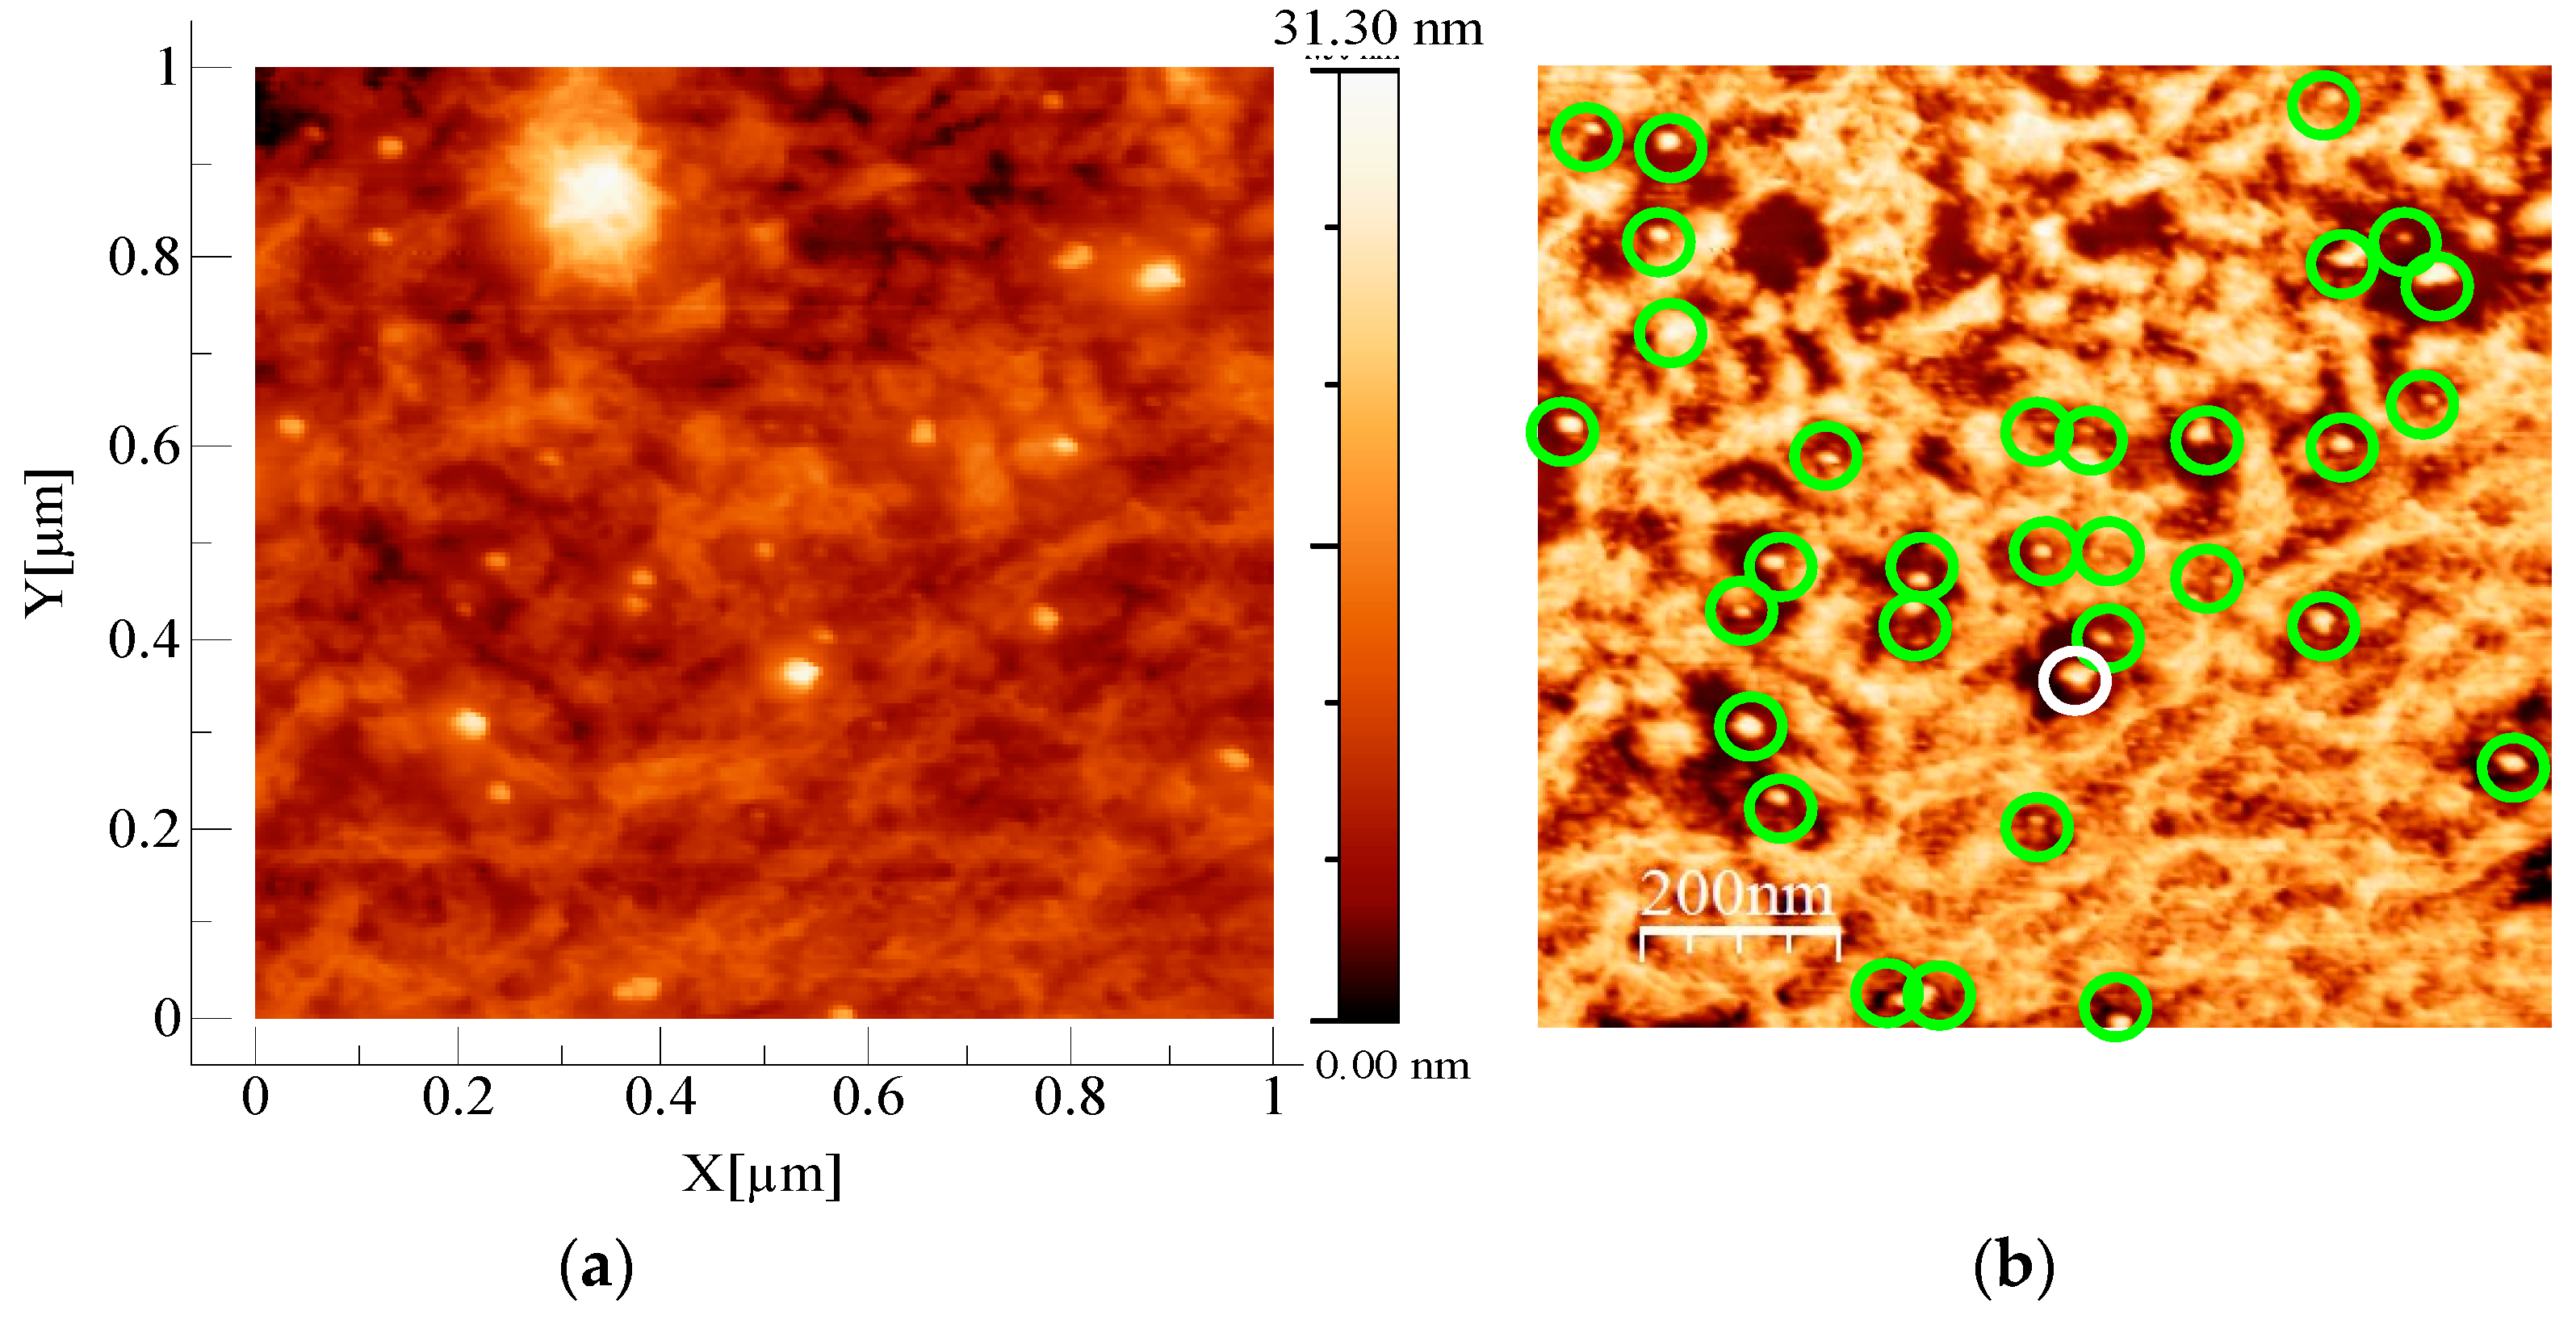
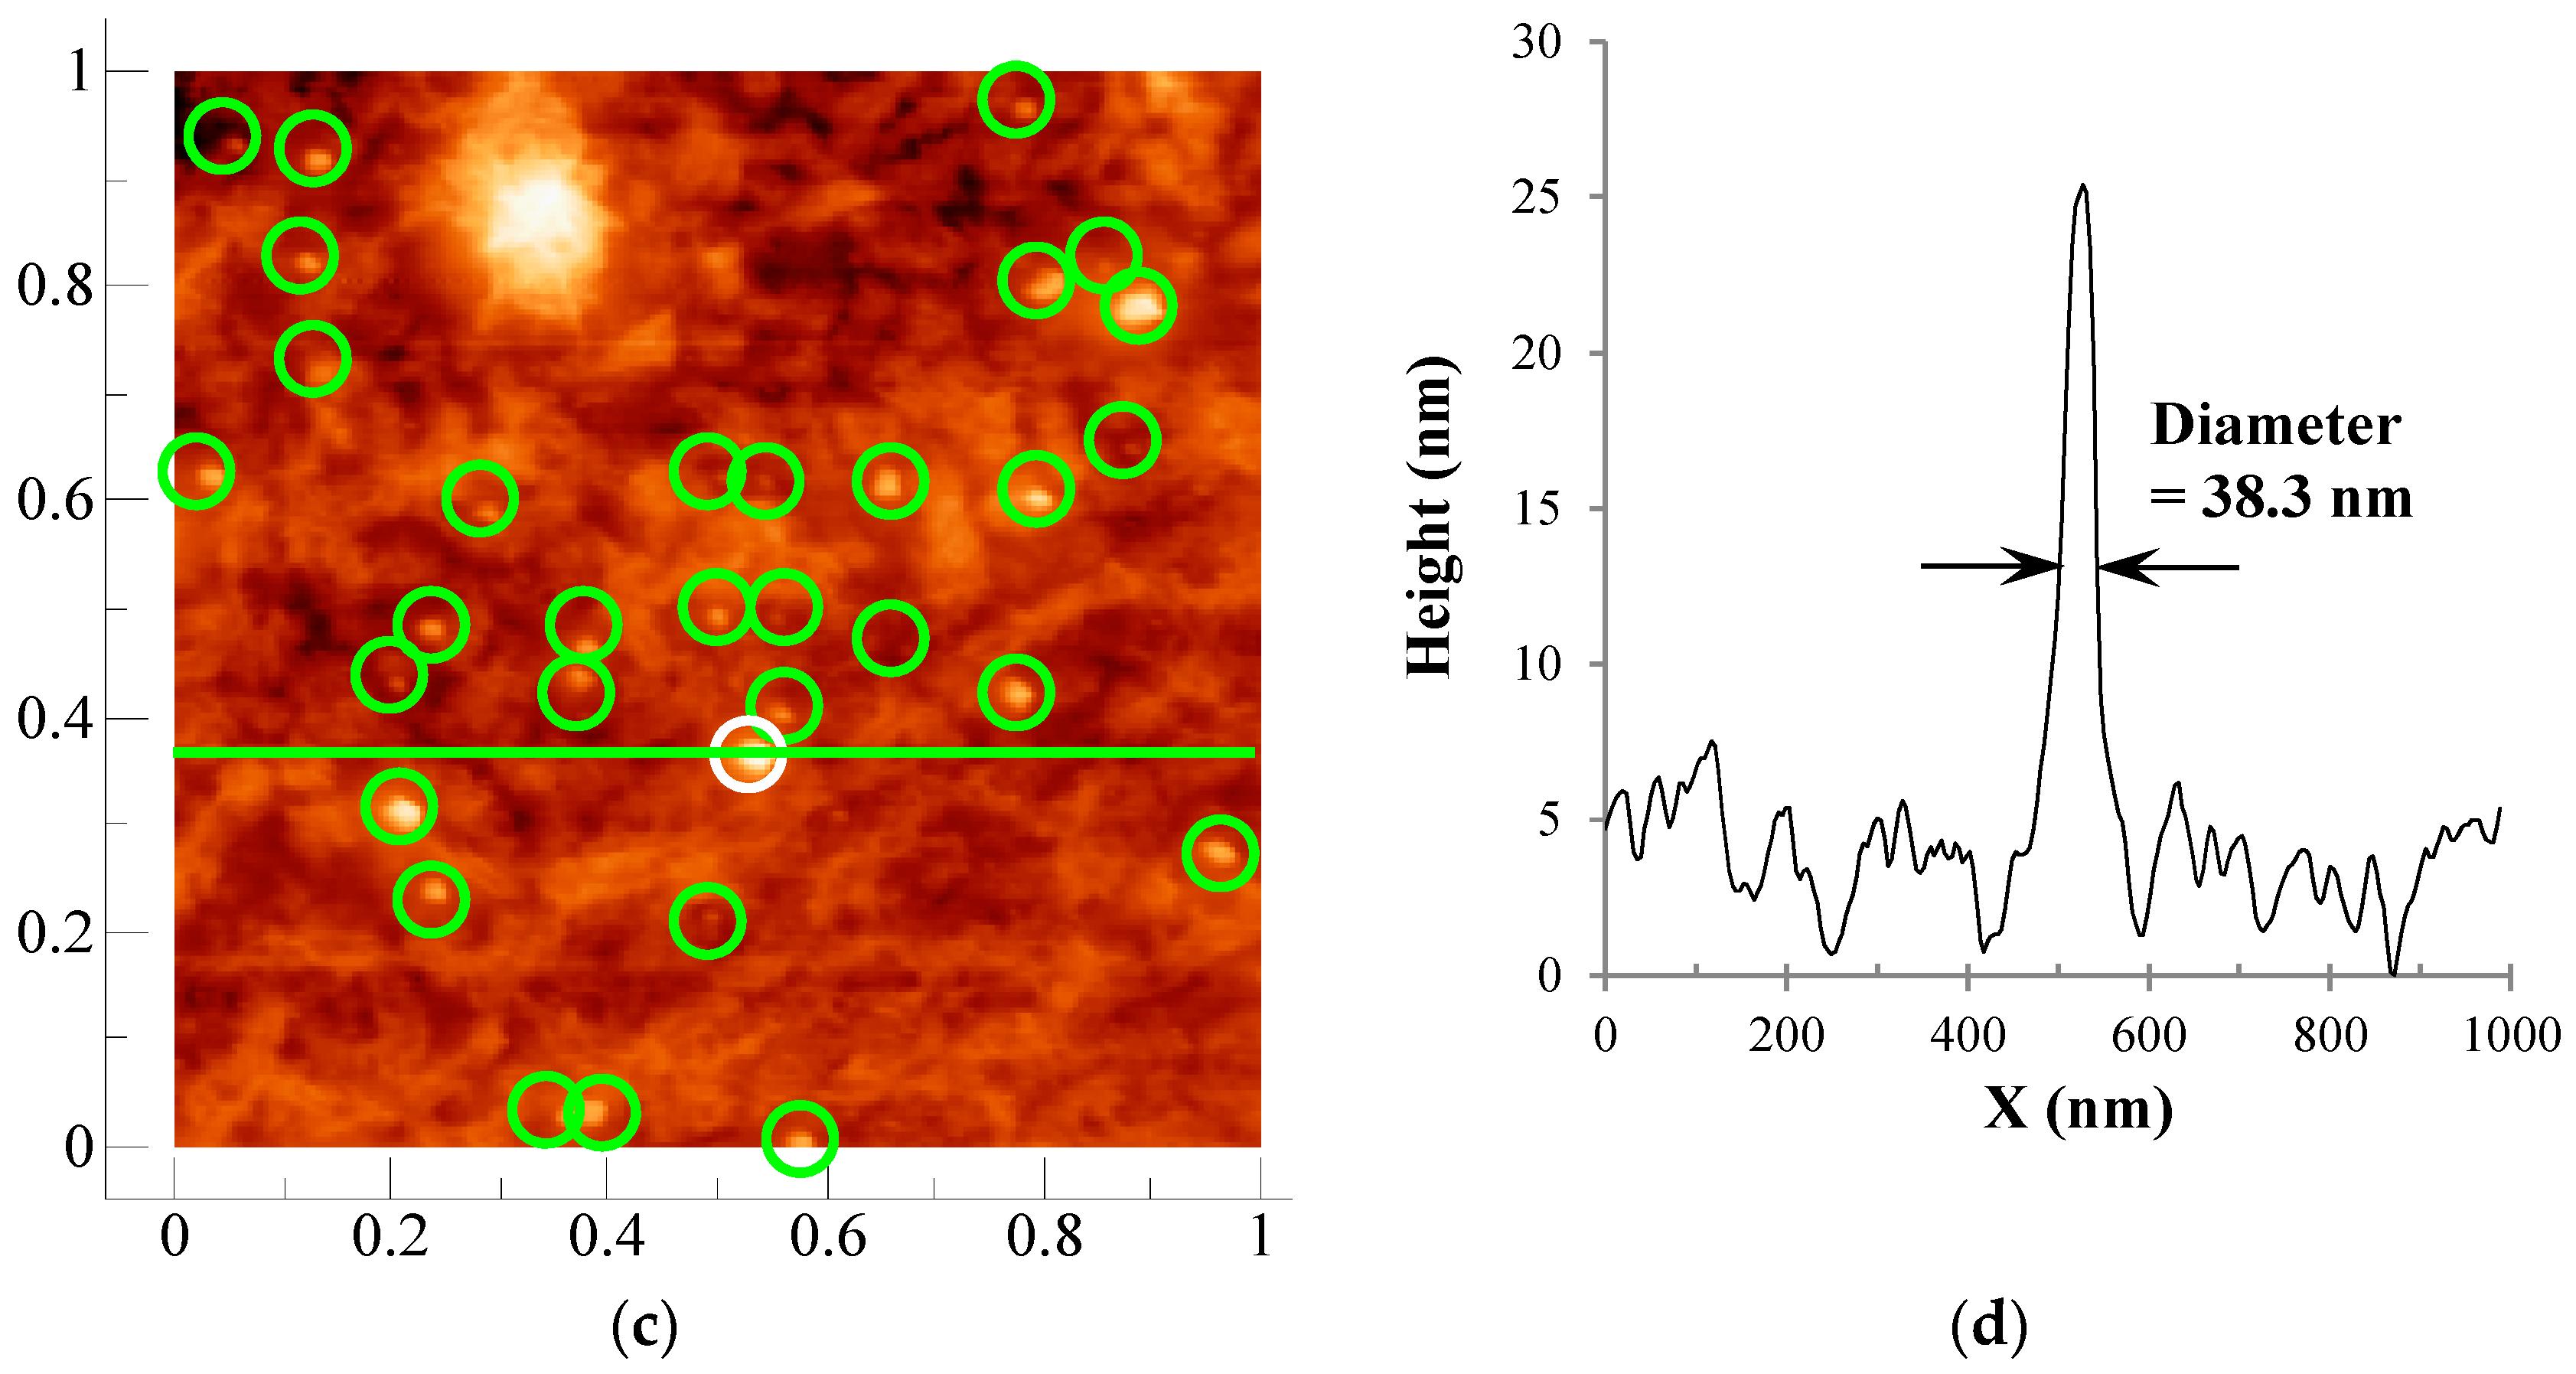
3.2. AFM
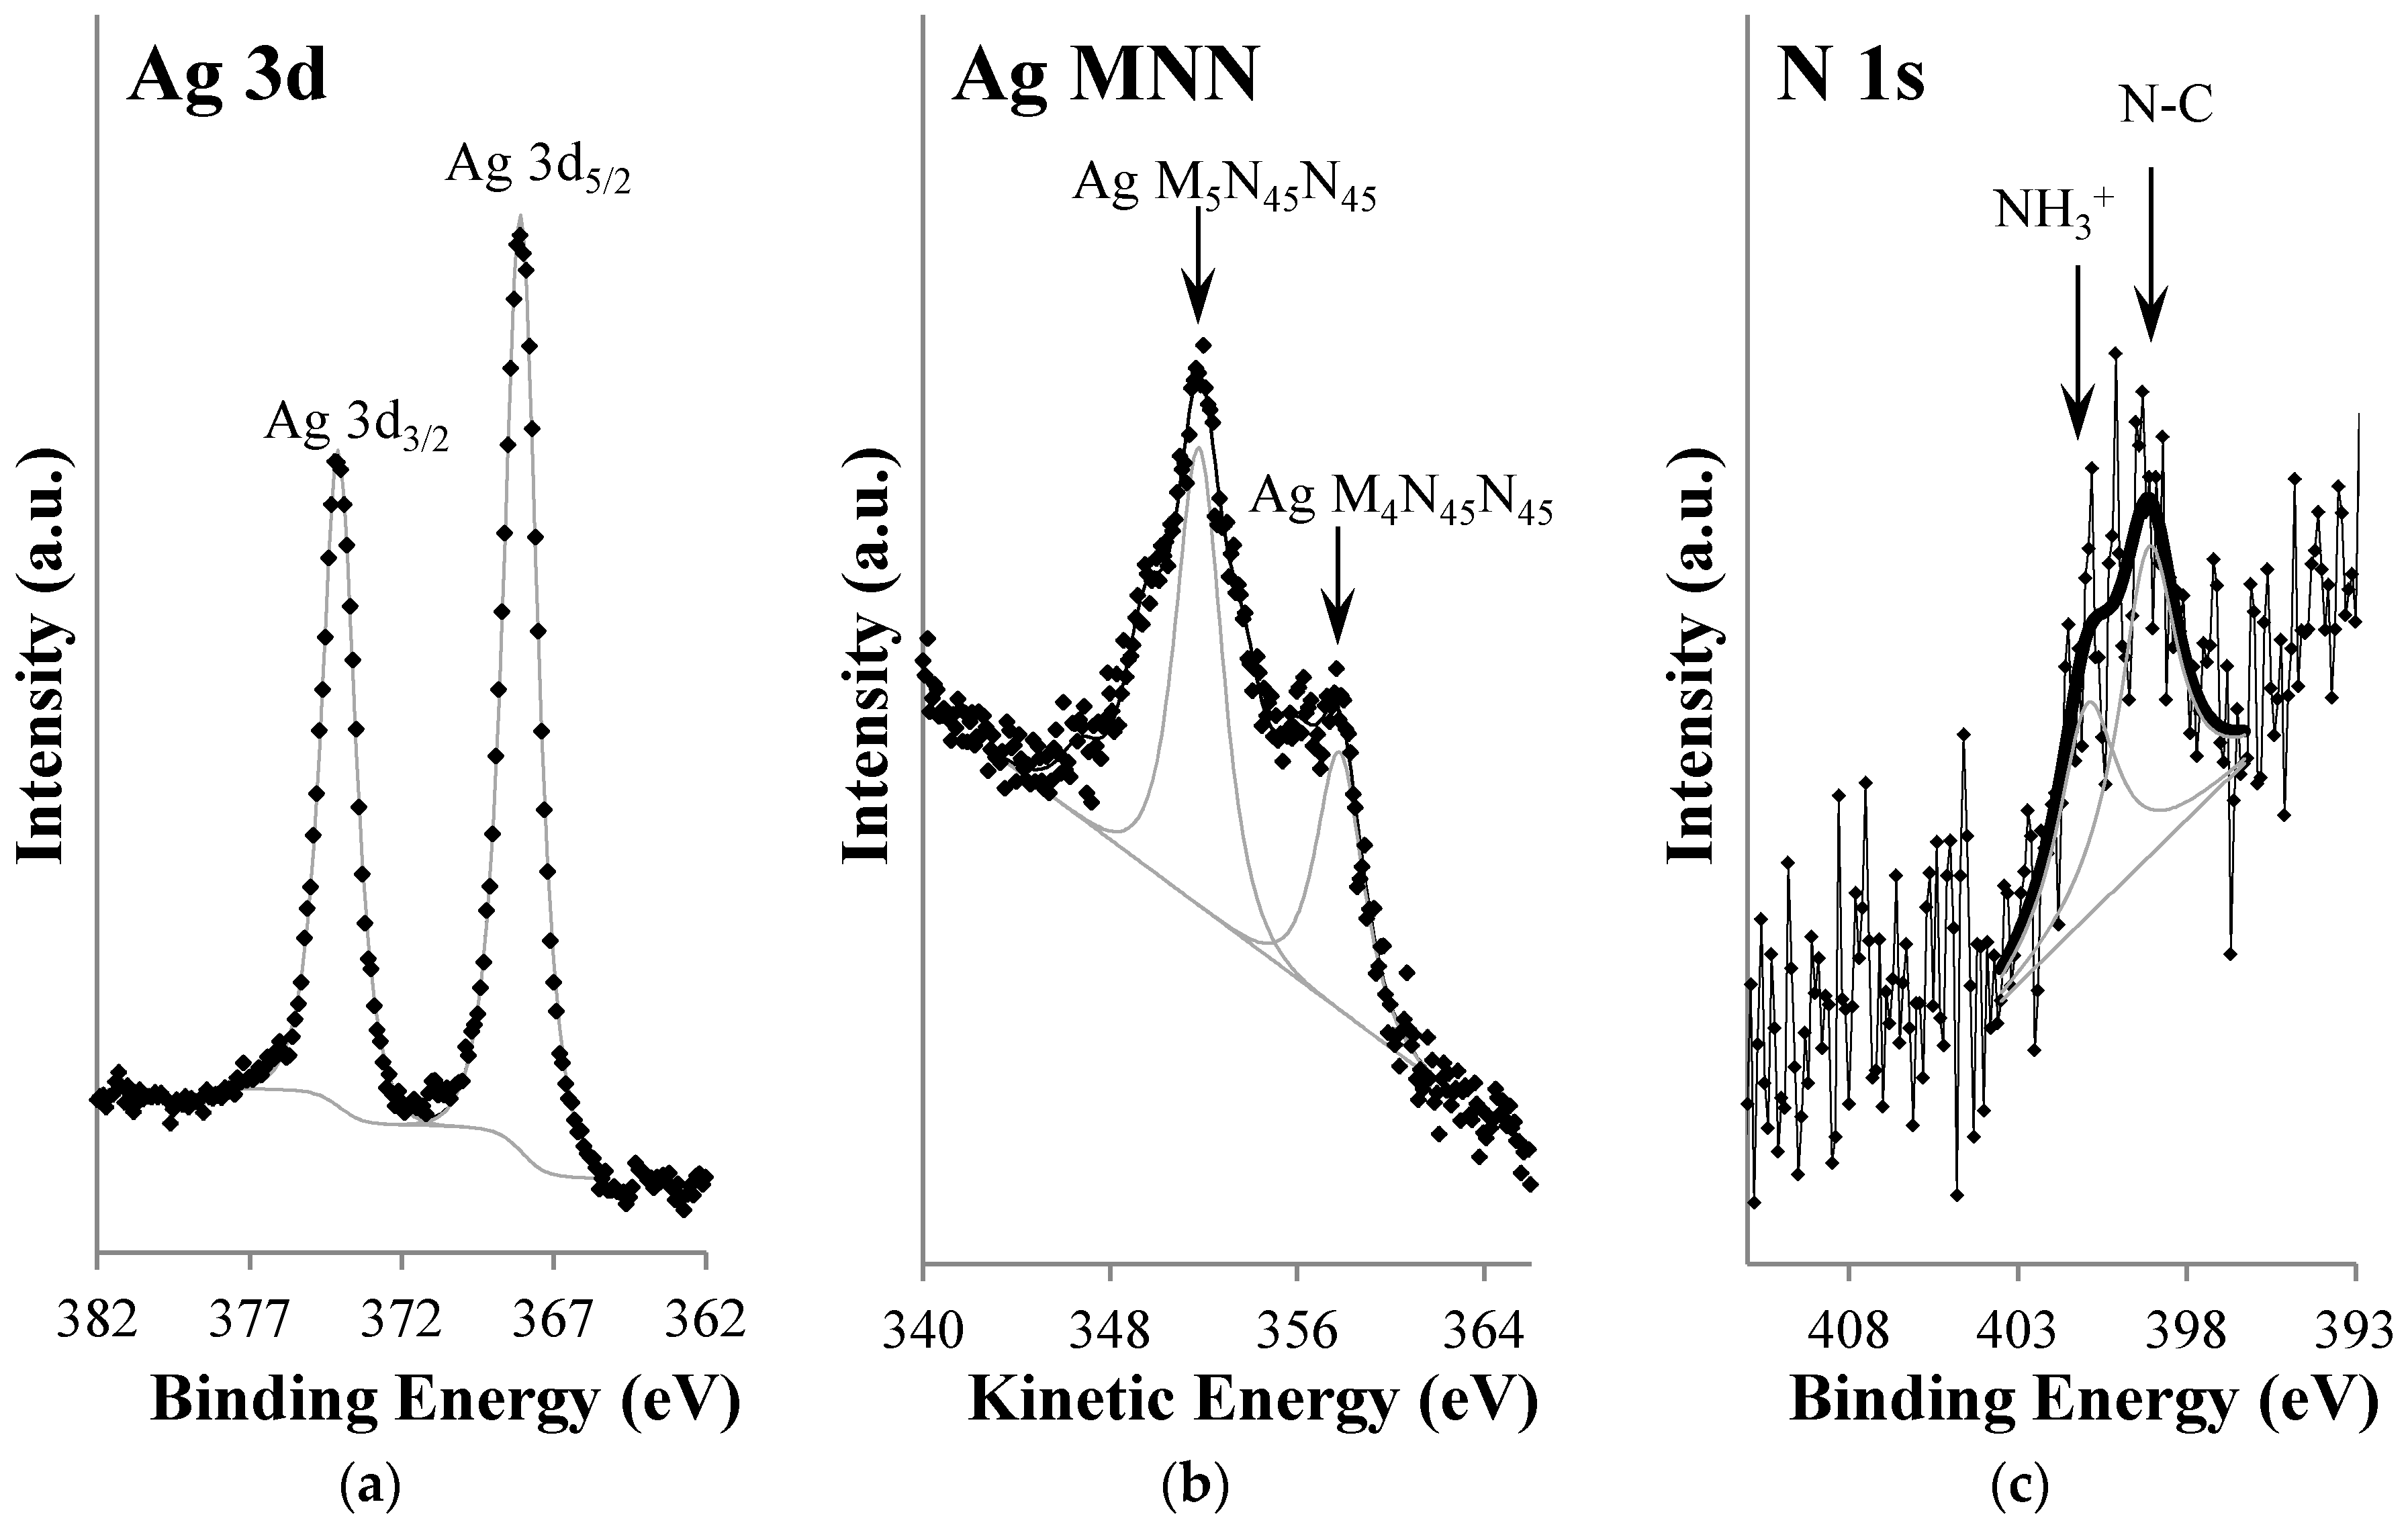
3.3. XPS
4. Discussion and Conclusions
Author Contributions
Funding
Conflicts of Interest
References
- Popescu, M.; Velea, A.; Lőrinczi, A. Biogenic Production of Nanoparticles. Dig. J. Nanomater. Biostruct. 2010, 5, 1035–1040. Available online: http://www.chalcogen.ro/1035_Popescu.pdf (accessed on 3 January 2019).
- Baruwati, B.; Polshettiwar, V.; Varma, R.S. Glutathione promoted expeditious green synthesis of silver nanoparticles in water using microwaves. Green Chem. 2009, 11, 926–930. [Google Scholar] [CrossRef]
- Le Ouay, B.; Stellacci, F. Antibacterial activity of silver nanoparticles: A surface science insight. Nano Today 2015, 10, 339–354. [Google Scholar] [CrossRef]
- Pugazhendhi, A.; Prabakar, D.; Jacob, J.M.; Karuppusamy, I.; Saratale, R.G. Synthesis and characterization of silver nanoparticles using Gelidium amansii and its antimicrobial property against various pathogenic bacteria. Microb Pathog 2018, 114, 41–45. [Google Scholar] [CrossRef] [PubMed]
- Besinis, A.; Hadi, S.D.; Le, H.R.; Tredwin, C.; Handy, R.D. Antibacterial activity and biofilm inhibition by surface modified titanium alloy medical implants following application of silver, titanium dioxide and hydroxyapatite nanocoatings. Nanotoxicology 2017, 11, 327–338. [Google Scholar] [CrossRef] [PubMed]
- GhavamiNejad, A.; Rajan Unnithan, A.; Ramachandra Kurup Sasikala, A.; Samarikhalaj, M.; Thomas, R.G.; Jeong, Y.Y.; Nasseri, S.S.; Murugesan, P.; Wu, D.; Park, C.H.; et al. Mussel-inspired electrospun nanofibers functionalized with size-controlled silver nanoparticles for wound dressing application. ACS Appl. Mater. Interfaces 2015, 7, 12176–12183. [Google Scholar] [CrossRef] [PubMed]
- Pinto, R.J.; Marques, P.A.; Neto, C.P.; Trindade, T.; Daina, S.; Sadocco, P. Antibacterial activity of nanocomposites of silver and bacterial or vegetable cellulosic fibers. Acta Biomater. 2009, 5, 2279–2289. [Google Scholar] [CrossRef] [PubMed]
- Boufi, S.; Ferraria, A.M.; Botelho do Rego, A.M.; Battaglini, N.; Herbst, F.; Rei Vilar, M. Surface functionalisation of cellulose with noble metals nanoparticles through a selective nucleation. Carbohydr. Polym. 2011, 86, 1586–1594. [Google Scholar] [CrossRef]
- Ferraria, A.M.; Boufi, S.; Battaglini, N.; Botelho do Rego, A.M.; Rei Vilar, M. Hybrid systems of silver nanoparticles generated on cellulose surfaces. Langmuir 2010, 26, 1996–2001. [Google Scholar] [CrossRef] [PubMed]
- Carapeto, A.P.; Ferraria, A.M.; Botelho do Rego, A.M. Hybrid systems of gold and silver nanoparticles generated on cellulose surfaces. Microsc. Microanal. 2013, 19, 119–120. [Google Scholar] [CrossRef]
- Ferraria, A.M.; Carapeto, A.P.; Boufi, S.; Rei Vilar, M.; Botelho do Rego, A.M. Ion reduction in metallic nanoparticles nucleation and growth on cellulose films: Does substrate play a role? Cellulose 2015, 22, 173–186. [Google Scholar] [CrossRef]
- Carapeto, A.P.; Ferraria, A.M.; Botelho do Rego, A.M. Unraveling the reaction mechanism of silver ions reduction bychitosan from so far neglected spectroscopic features. Carbohydr. Polym. 2017, 174, 601–609. [Google Scholar] [CrossRef] [PubMed]
- Carapeto, A.P.; Ferraria, A.M.; Botelho do Rego, A.M. Trimethylsilylcellulose synthesis revisited. Polym. Test. 2017, 58, 236–240. Available online: https://doi.org/j.polymertesting.2017.01.008 (accessed on 7 December 2018). [CrossRef]
- Serro, A.P.; Carapeto, A.P.; Paiva, G.; Farinha, J.P.S.; Colaço, R.; Saramago, B. Formation of an intact liposome layer adsorbed on oxidized gold confirmed by three complementary techniques: QCM-D, AFM and confocal fluorescence microscopy. Surf. Interface Anal. 2012, 44, 426–433. [Google Scholar] [CrossRef]
- Horcas, I.; Fernández, R.; Gomez-Rodriguez, J.M.; Colchero, J.; Gómez-Herrero, J.; Baro, A.M. WSXM: A software for scanning probe microscopy and a tool for nanotechnology. Rev. Sci. Instrum. 2007, 78, 013705. [Google Scholar] [CrossRef] [PubMed]
- Vilar, M.R.; Boufi, S.; Ferraria, A.M.; Botelho do Rego, A.M. Chemical Modification of Semiconductor Surfaces by Means of Nanometric Cellulose Films. J. Phys. Chem. C 2007, 111, 12792–12803. [Google Scholar] [CrossRef]
- Ferraria, A.M.; Carapeto, A.P.; Botelho do Rego, A.M. X-ray photoelectron spectroscopy: Silver salts revisited. Vacuum 2012, 86, 1988–1991. [Google Scholar] [CrossRef]
- Tanuma, S.; Powell, C.J.; Penn, D.R. Calculations of electron inelastic mean free paths (IMFPS). IV. Evaluation of calculated IMFPs and of the predictive IMFP formula TPP-2 for electron energies between 50 and 2000 eV. Surf. Interface Anal. 1993, 20, 77–89. [Google Scholar] [CrossRef]


| AFM | QCM | |||
|---|---|---|---|---|
| Number of NPs | 32 | Δf | −12.5 ± 2.1 Hz | |
| Computed from measured diameters | Computed from measured heights | ∆m | 0.22 ± 0.04 µg/cm2 | |
| Ag NPs volume/Area | 225,000 nm3/µm2 | 199,000 nm3/µm2 | 210,331 ± 35,694 nm3/µm2 | |
© 2019 by the authors. Licensee MDPI, Basel, Switzerland. This article is an open access article distributed under the terms and conditions of the Creative Commons Attribution (CC BY) license (http://creativecommons.org/licenses/by/4.0/).
Share and Cite
Carapeto, A.P.; Ferraria, A.M.; Botelho do Rego, A.M. Silver Nanoparticles on Cellulose Surfaces: Quantitative Measurements. Nanomaterials 2019, 9, 780. https://doi.org/10.3390/nano9050780
Carapeto AP, Ferraria AM, Botelho do Rego AM. Silver Nanoparticles on Cellulose Surfaces: Quantitative Measurements. Nanomaterials. 2019; 9(5):780. https://doi.org/10.3390/nano9050780
Chicago/Turabian StyleCarapeto, Ana Patrícia, Ana Maria Ferraria, and Ana Maria Botelho do Rego. 2019. "Silver Nanoparticles on Cellulose Surfaces: Quantitative Measurements" Nanomaterials 9, no. 5: 780. https://doi.org/10.3390/nano9050780
APA StyleCarapeto, A. P., Ferraria, A. M., & Botelho do Rego, A. M. (2019). Silver Nanoparticles on Cellulose Surfaces: Quantitative Measurements. Nanomaterials, 9(5), 780. https://doi.org/10.3390/nano9050780