Article

Asynchronous Evolution of Nanoporous Silver on Dual-Phase Ag–Sn Alloys by Potentiostatic Dealloying in Hydrochloric Acid Solution

1
College of Materials Science and Engineering and Tech Institute for Advanced Materials, Nanjing Tech University, Nanjing 210009, China
2
State Key Lab of Advanced Metals and Materials, University of Science and Technology Beijing, Beijing 110083, China
3
State Key Laboratory of Metal Material for Marine Equipment and Application, Anshan 114021, China
4
School of Materials Science and Engineering, Nanjing University of Science and Technology, Nanjing 210094, China
*
Authors to whom correspondence should be addressed.
Nanomaterials 2019, 9(5), 743; https://doi.org/10.3390/nano9050743
Submission received: 26 April 2019 / Revised: 8 May 2019 / Accepted: 9 May 2019 / Published: 14 May 2019

Abstract

:
Evolution behavior of the nanoporous architectures has been investigated via potentiostatic electrochemical dealloying of dual-phase AgxSn100−x (x = 20, 30, 40 at.%) alloys, which consist of β-Sn and ε-Ag3Sn phases with different volume fractions in 1.2 M HCl solution. The results show that the open-circuit potentials and corrosion potentials of dual-phase Ag–Sn alloys are determined by the less noble β-Sn phases rather than chemical compositions of the Ag–Sn precursor alloys. The potentiodynamic polarization curves show that the anodic dissolution of Ag–Sn alloys is divided into two stages including the first preferential dissolution of β-Sn phases and secondary dealloying of ε-Ag3Sn phases, which is associated with the order of the nanoporous evolution. Nanoporous silver (NPS) can be fabricated by potentiostatic dealloying of dual-phase Ag–Sn alloys in HCl solution. The dealloying of two phases is asynchronous: The less noble β-Sn phases are preferentially etched to generate the larger pores, and then the more noble ε-Ag3Sn phases are dealloyed to form the finer nanoporous structure. The significant surface diffusion of Ag adatoms at the applied potential higher than the pitting potential of ε-Ag3Sn phases during the dealloying results in the coarsening of nanoporous ligaments with a time dependence of d(t) t0.1. The fractions and the difference in electrochemical stabilities of the β-Sn and ε-Ag3Sn phases in dual-phase AgxSn100−x (x = 20, 30, 40 at.%) precursor alloys determines the final nanoporous structure.

Graphical Abstract

1. Introduction

Nanoporous metals (NPMs) with high specific surface areas have attracted great attention in a wide variety of applications including catalysis, sensors, actuators, and surface-enhanced Raman scattering (SERS) [1,2,3,4,5,6,7,8]. Chemical or electrochemical dealloying referring to the selective dissolution of binary or multi-component alloys has commonly been used to fabricate NPMs [9,10,11,12,13,14,15]. The dealloying method can simply and flexibly modulate the microstructure and length scale of NPMs via designing the chemical compositions and microstructures of the precursor alloys [9,10], changing the dealloying solution [11,12], dealloying time [13] and temperature [14], and using post-dealloying treatments [15]. As the dealloying can be affected by many factors, the mechanism of dealloying has been discussed. Forty and Durkin [16,17] constructed a terrace-ledge-kink model to explain the selective dissolution of Ag element and surface diffusion of Au element during the dealloying of Ag–Au alloys. Erlebacher et al. [18] have succeeded in unveiling nanoporosity evolution during dealloying of Ag–Au alloys by a kinetic Monte Carlo model. It is generally accepted that the formation of NPMs during dealloying involves selective dissolution of the less noble metal atoms or phases and simultaneous arrangements of the more noble metal atoms to form the ligaments under the driving force of surface diffusion [9,11,18]. The underlying dealloying mechanism of precursor alloys with multi-phase microstructures is so far ambiguous and urgently needs further investigation. Numerous studies have revealed that the initial microstructure of precursor alloys has an important influence on the final nanoporous structures of NPMs obtained by dealloying [10,19,20]. For example, nanoporous nickel (NP-Ni) fabricated from the Mn62Ni38 precursor alloys has a bimodal structure because of the different dealloying behavior of the coexisting NiMn and NiMn2 intermetallics during the electrochemical dealloying [21]. Therefore, exploring the dealloying behavior of related precursor alloy systems would be meaningful to further understand the dealloying mechanism, and can be used to design the microstructure of the precursor alloys and predict the final nanoporous structures. Early studies on dealloying behavior and mechanism mainly focused on the binary precursor alloys with a single-phase solid state, such as Ag–Au [14,15,16,17,18,22,23,24], Mn–Cu [25], and Cu–Pt [26]. Those precursors are generally considered to be advantageous for obtaining ideal and isotropic bi-continuous nanoporous structures. In addition, amorphous precursor alloys, such as Ti–Cu [12], Mg–Cu–Y [11,13], and Pd–Cu–Ni–P [20], have been introduced into dealloying because they are homogenous in chemical compositions and microstructure without defects such as grain boundary. The fine and uniform nanoporous copper (NPC) and nanoporous palladium (NP-Pd) have been fabricated from amorphous precursors mentioned above. However, it should be noted that many alloy systems consist of two or more phases in nanocrystalline or coarsening crystalline alloys in the ordinary solidification conditions. Several dual-phase or multi-phase alloys, such as Al–Au [19,27], Al–Cu [10], and Zn–Cu [28], have been successfully used to produce corresponding NPMs. The nanoporous structures obtained from the aforementioned precursors are usually affected by the disparities in chemical compositions and structure between coexistent phases, especially intermetallics, and this leads to the complexity in dealloying process. For example, Liu [29] has found the structural evolution from nanoporous Mg2Cu intermetallics (NP-Mg2Cu) to the NPC with bimodal or unimodal nanopore distributions during the dealloying of dual-phase Mg–Cu alloys. Thus, it is necessary to determine the dealloying behavior of each coexistent phase in these dual-phase or multi-phase precursor alloys.
Nanoporous silver (NPS) is an important kind of NPMs due to its potential applications in molecular adsorptions, ion exchange, medical materials, and heterogeneous catalysis [30]. Recently, several alloy systems including crystalline Al–Ag [27], Mg–Ag [9], Zn–Ag [30], and amorphous Ca–Ag [31], Ag–Cu–Si [32] have been successfully developed to fabricate NPS through chemical or electrochemical dealloying. Compared to chemical dealloying, electrochemical dealloying has certain advantages in shorting dealloying duration, modulating nanoporous structures by potential or current control, and etching some inert intermetallics that are not easily dealloyed by chemical dealloying methods [10,15,20,21,26,28,30].
In this work, the dual-phase Ag–Sn alloys have been chosen to fabricate the NPS through potentiostatic electrochemical dealloying in HCl solution. The electrochemical properties of the Ag–Sn alloys have been discussed based upon open-circuit potential measurements and potentiodynamic polarization analysis. The dealloying behavior of dual-phase Ag–Sn alloys has been investigated via observing the microstructure evolution, constitution of the phases and chemical compositions, and change in ligament/pore size during electrochemical dealloying. In addition, the coarsening mechanism of nanoporous ligaments has been discussed from the perspective of surface diffusion of Ag adatoms, and the surface diffusivity of Ag adatoms during dealloying has also been evaluated.

2. Experimental Procedure

The AgxSn100−x (x = 20, 30, 40 at.%) alloys with nominal compositions of Ag20Sn80, Ag30Sn70, and Ag40Sn60 (at.%) were prepared by arc-melting pure Ag (99.99 wt.%) and Sn (99.99 wt.%) under a high-purity argon atmosphere. The ribbons with a thickness of 20 μm and a width of 6 mm were produced from Ag–Sn alloys by the single roller melt spinning technique in an argon atmosphere. The reference ε-Ag3Sn intermetallic ribbons were also produced by the same process mentioned above. Single-phase β-Sn (99.99 wt.%) and fcc Ag (99.99 wt.%) foils were purchased from Beijing Central New Metallic Mateials Technology Co. Lit. (Beijing, China).
Electrochemical experiments were performed in a conventional three electrode cell in 1.2 M HCl solution at room temperature. The Ag–Sn ribbons were used as the work electrode, and an Ag/AgCl electrode in 3.33 M KCl solution as the reference electrode and the Pt plate as the counter electrode. All the potential was referred to the Ag/AgCl (3.33 M KCl) electrode unless otherwise stated. The electrochemical properties of Ag–Sn alloys and reference foils were characterized by the measurements of open circuit potentials and potentiodynamic polarization curves. The scan rate for potentiodynamic polarization was 1 mV s−1. Potentiostatic dealloying was performed at different applied potentials for different times to study the dealloying mechanism and fabricate NPS. The phase constitution and microstructure of as-spun and as-dealloyed ribbons was confirmed by an X-ray diffractometer (XRD, Rigaku, RINT-4200, Tokyo, Japan) and a transmission electron microscope (TEM, JEOL, JEM-2100F, Tokyo, Japan). The mean sizes of nanopores and ligaments were obtained by measuring over 125 sites on the SEM images by using single-chord method. The TEM samples were prepared by ion milling method. The surface morphology and composition of the as-dealloyed ribbons was observed by a scanning electron microscope (SEM, FEI, QUANTA 250 FEG, Hillsboro, OR, USA) with an energy dispersive X-ray analyzer (EDX, FEI, QUANTA 250 FEG, Hillsboro, OR, USA).

3. Results

3.1. Effect of Phase Constitutions of Ag–Sn Precursor Alloys on the Electrochemical Behavior

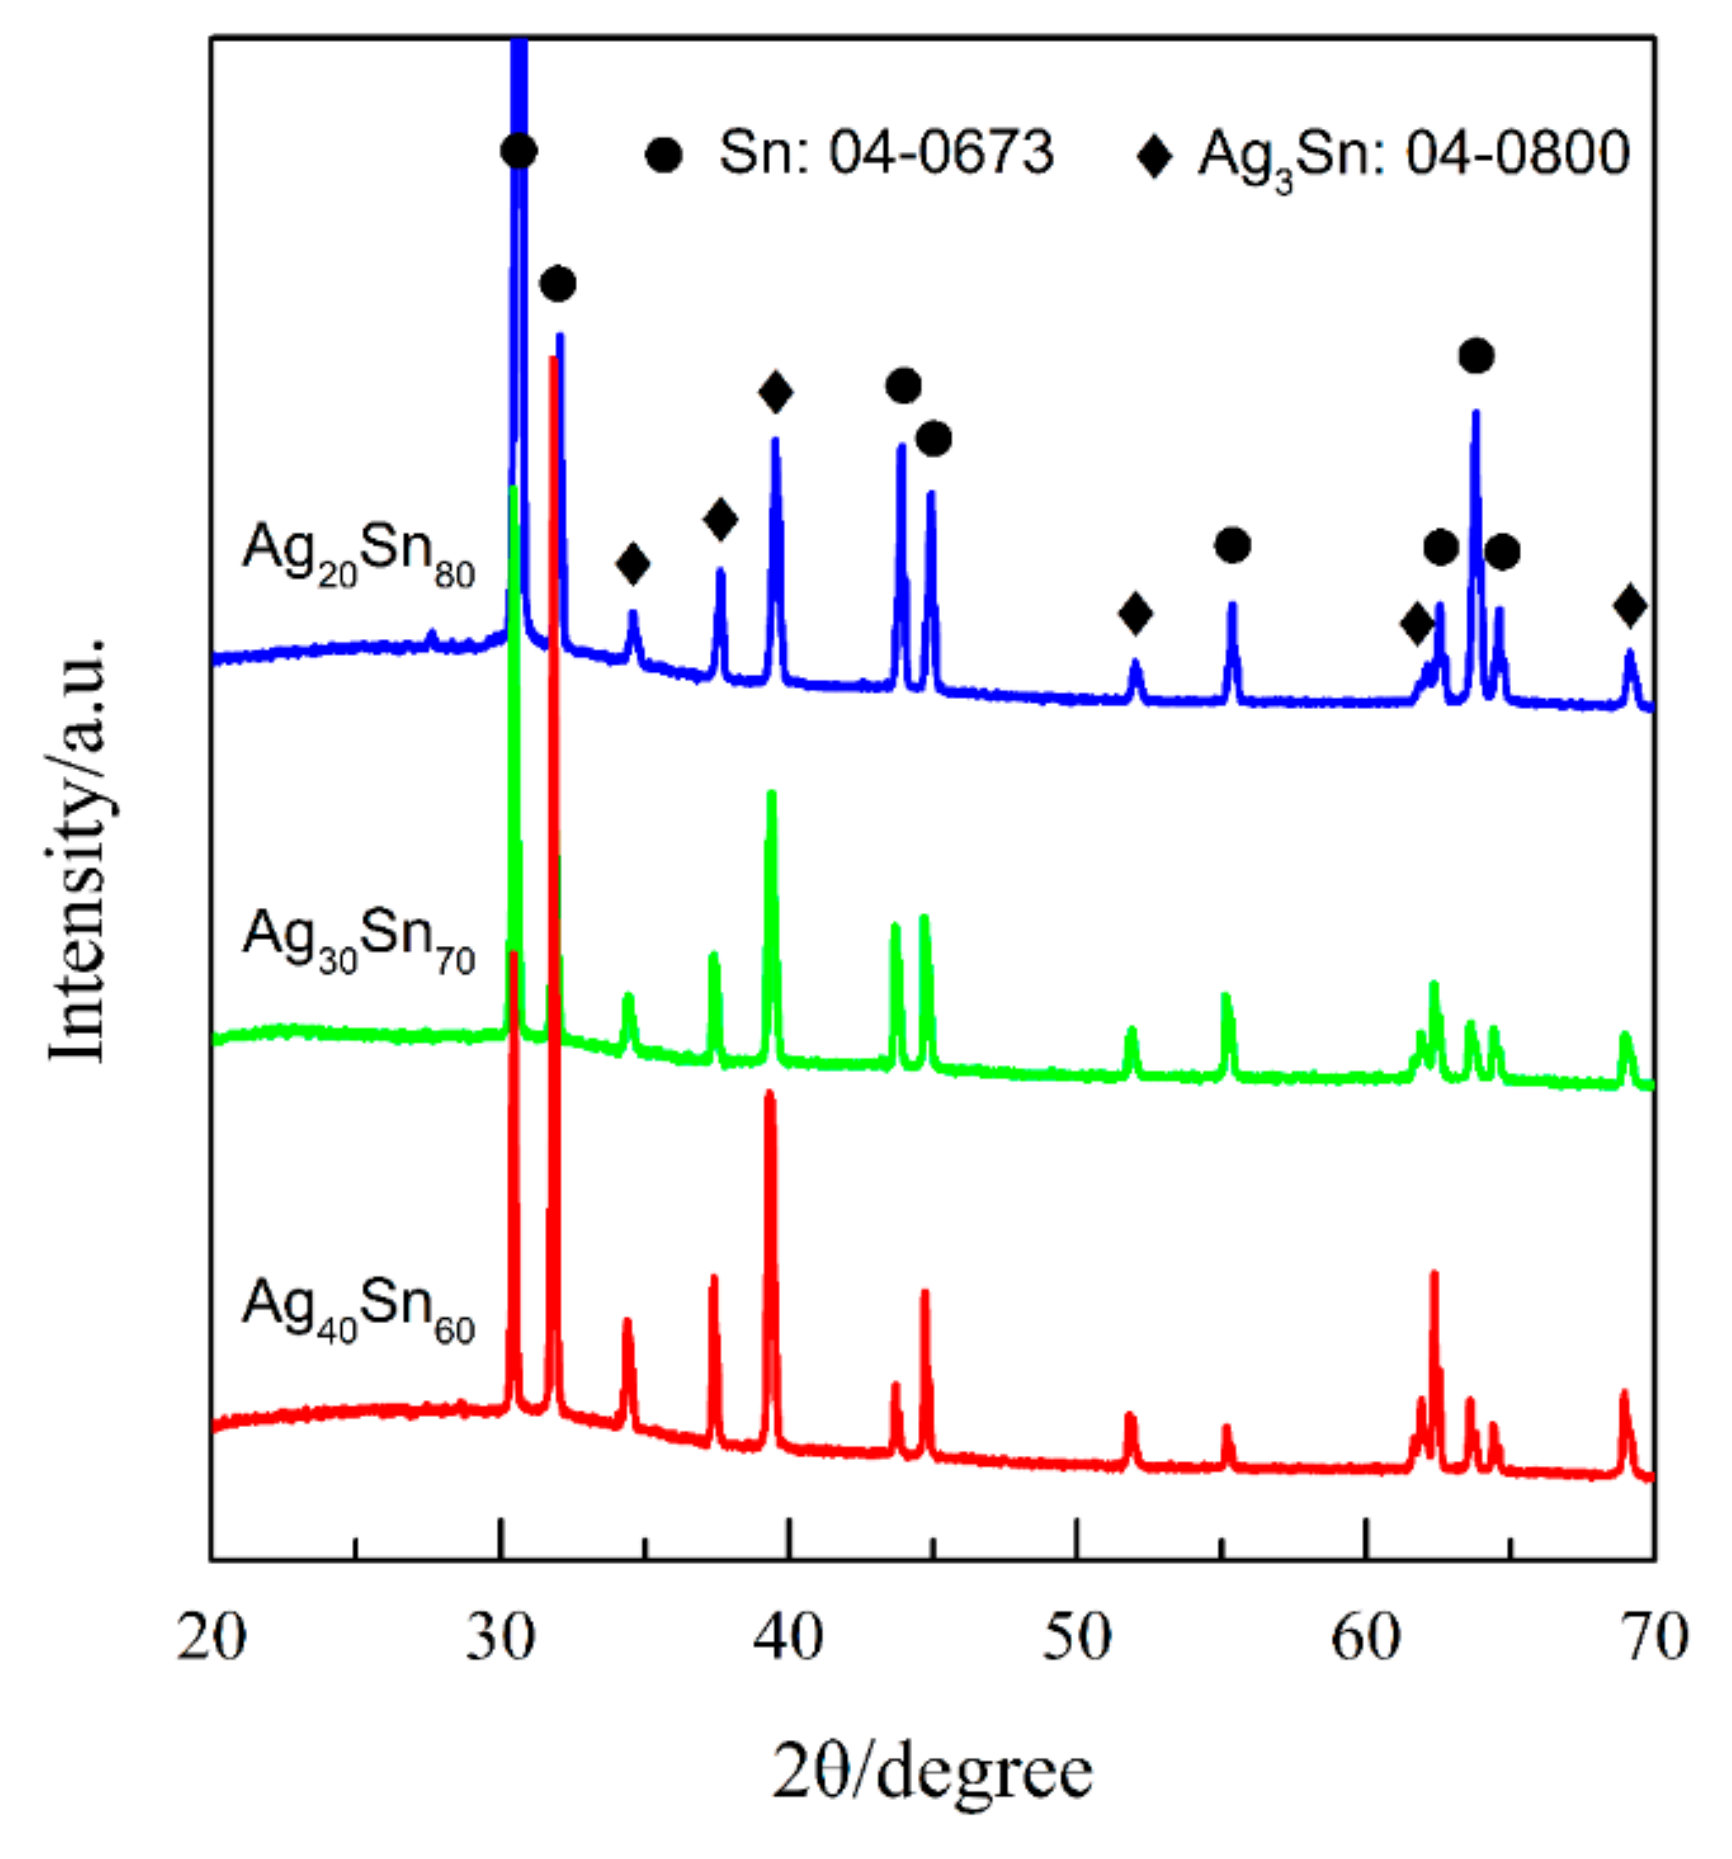
Figure 1 shows the top-view back-scattering electron images of Ag40Sn60 ribbons. It is found that two phases coexist in the matrix, where the camber-like Ag-rich phase is enveloped by the Sn-rich phase. XRD patterns of as-spun Ag20Sn80, Ag30Sn70, and Ag40Sn60 ribbons are shown in Figure 2. The result in Figure 1 and Figure 2 indicate that Ag–Sn alloys are composed of two phases including a tetragonal β-Sn (JCPDS 04-0673; Space group: I41/amd) phase and an orthorhombic ε-Ag3Sn (JCPDS 04-0800; Space group: pmmn) intermetallic phase. According to the binary Ag–Sn phase diagram [33], the ε-Ag3Sn phase and β-Sn/ε-Ag3Sn eutectic phase will appear in all of Ag20Sn80, Ag30Sn70, and Ag40Sn60 alloys. Therefore, the Ag-rich and Sn-rich phases in Figure 1 are ε-Ag3Sn phase and β-Sn/ε-Ag3Sn eutectic phases, respectively. According to the Ag–Sn phase diagram, the β-Sn phases are only able to form when the Sn concentration exceeds 99.91 at.%, which indicated that the volume fraction of the β-Sn phases is very limited [33]. In addition, the molar ratios of ε-Ag3Sn phases and β-Sn/ε-Ag3Sn eutectic phases are confirmed as about 1.03, 0.58, and 0.29 in Ag40Sn60, Ag30Sn70, and Ag20Sn80 alloys on the basis of Ag–Sn phase diagram [33], respectively. Therefore, the volume fractions of ε-Ag3Sn phases in the as-spun AgxSn100−x (x = 20, 30, 40 at.%) ribbons are considered to increase with the increase of Ag concentrations.
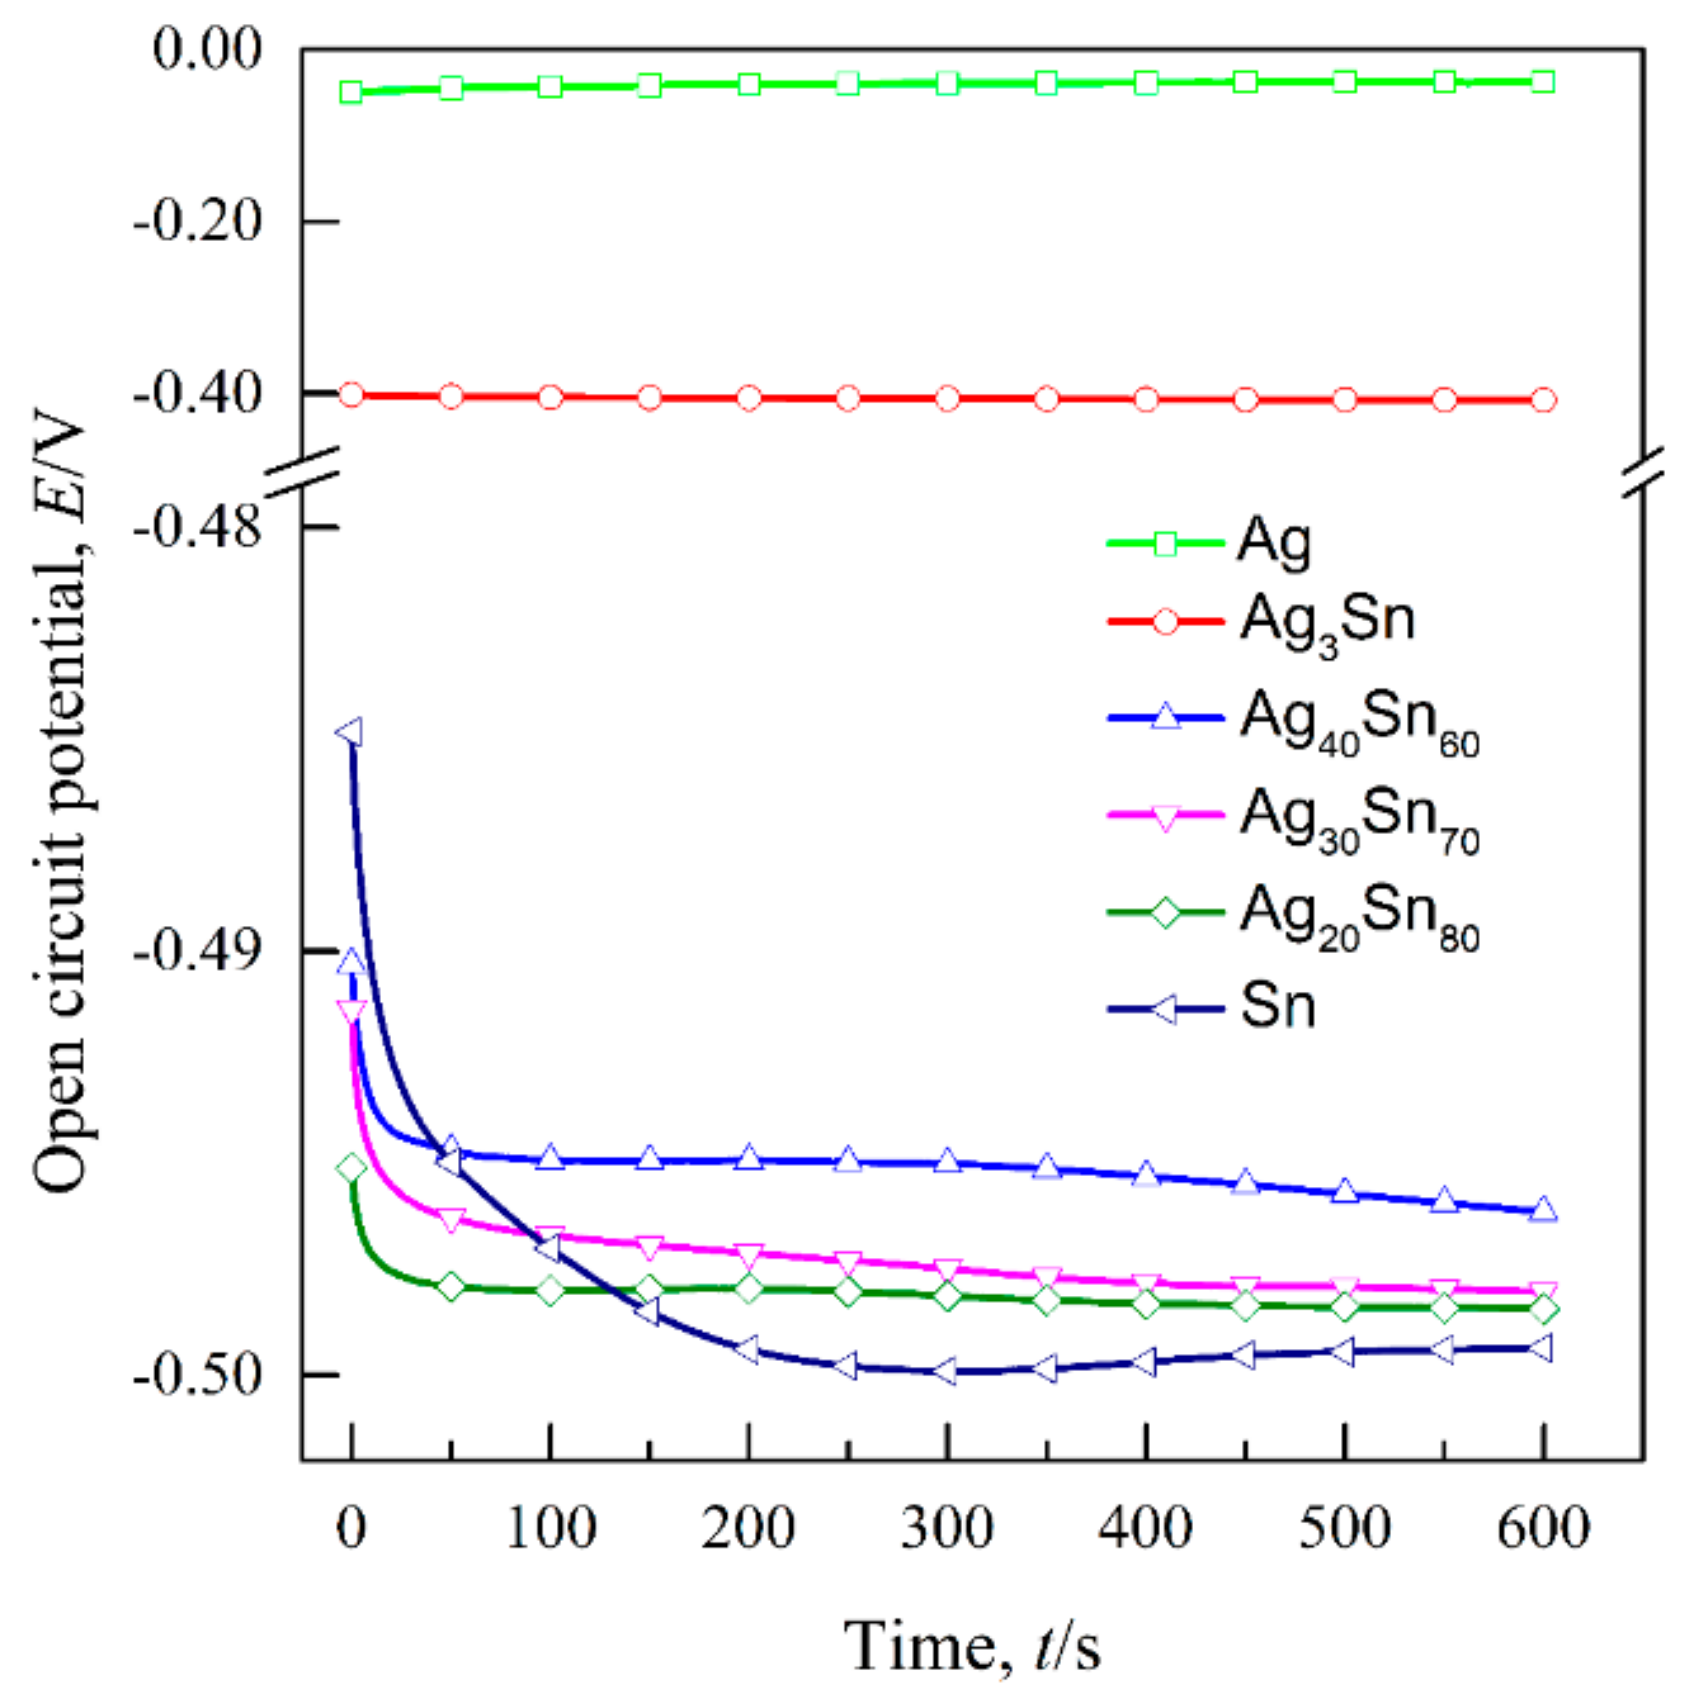
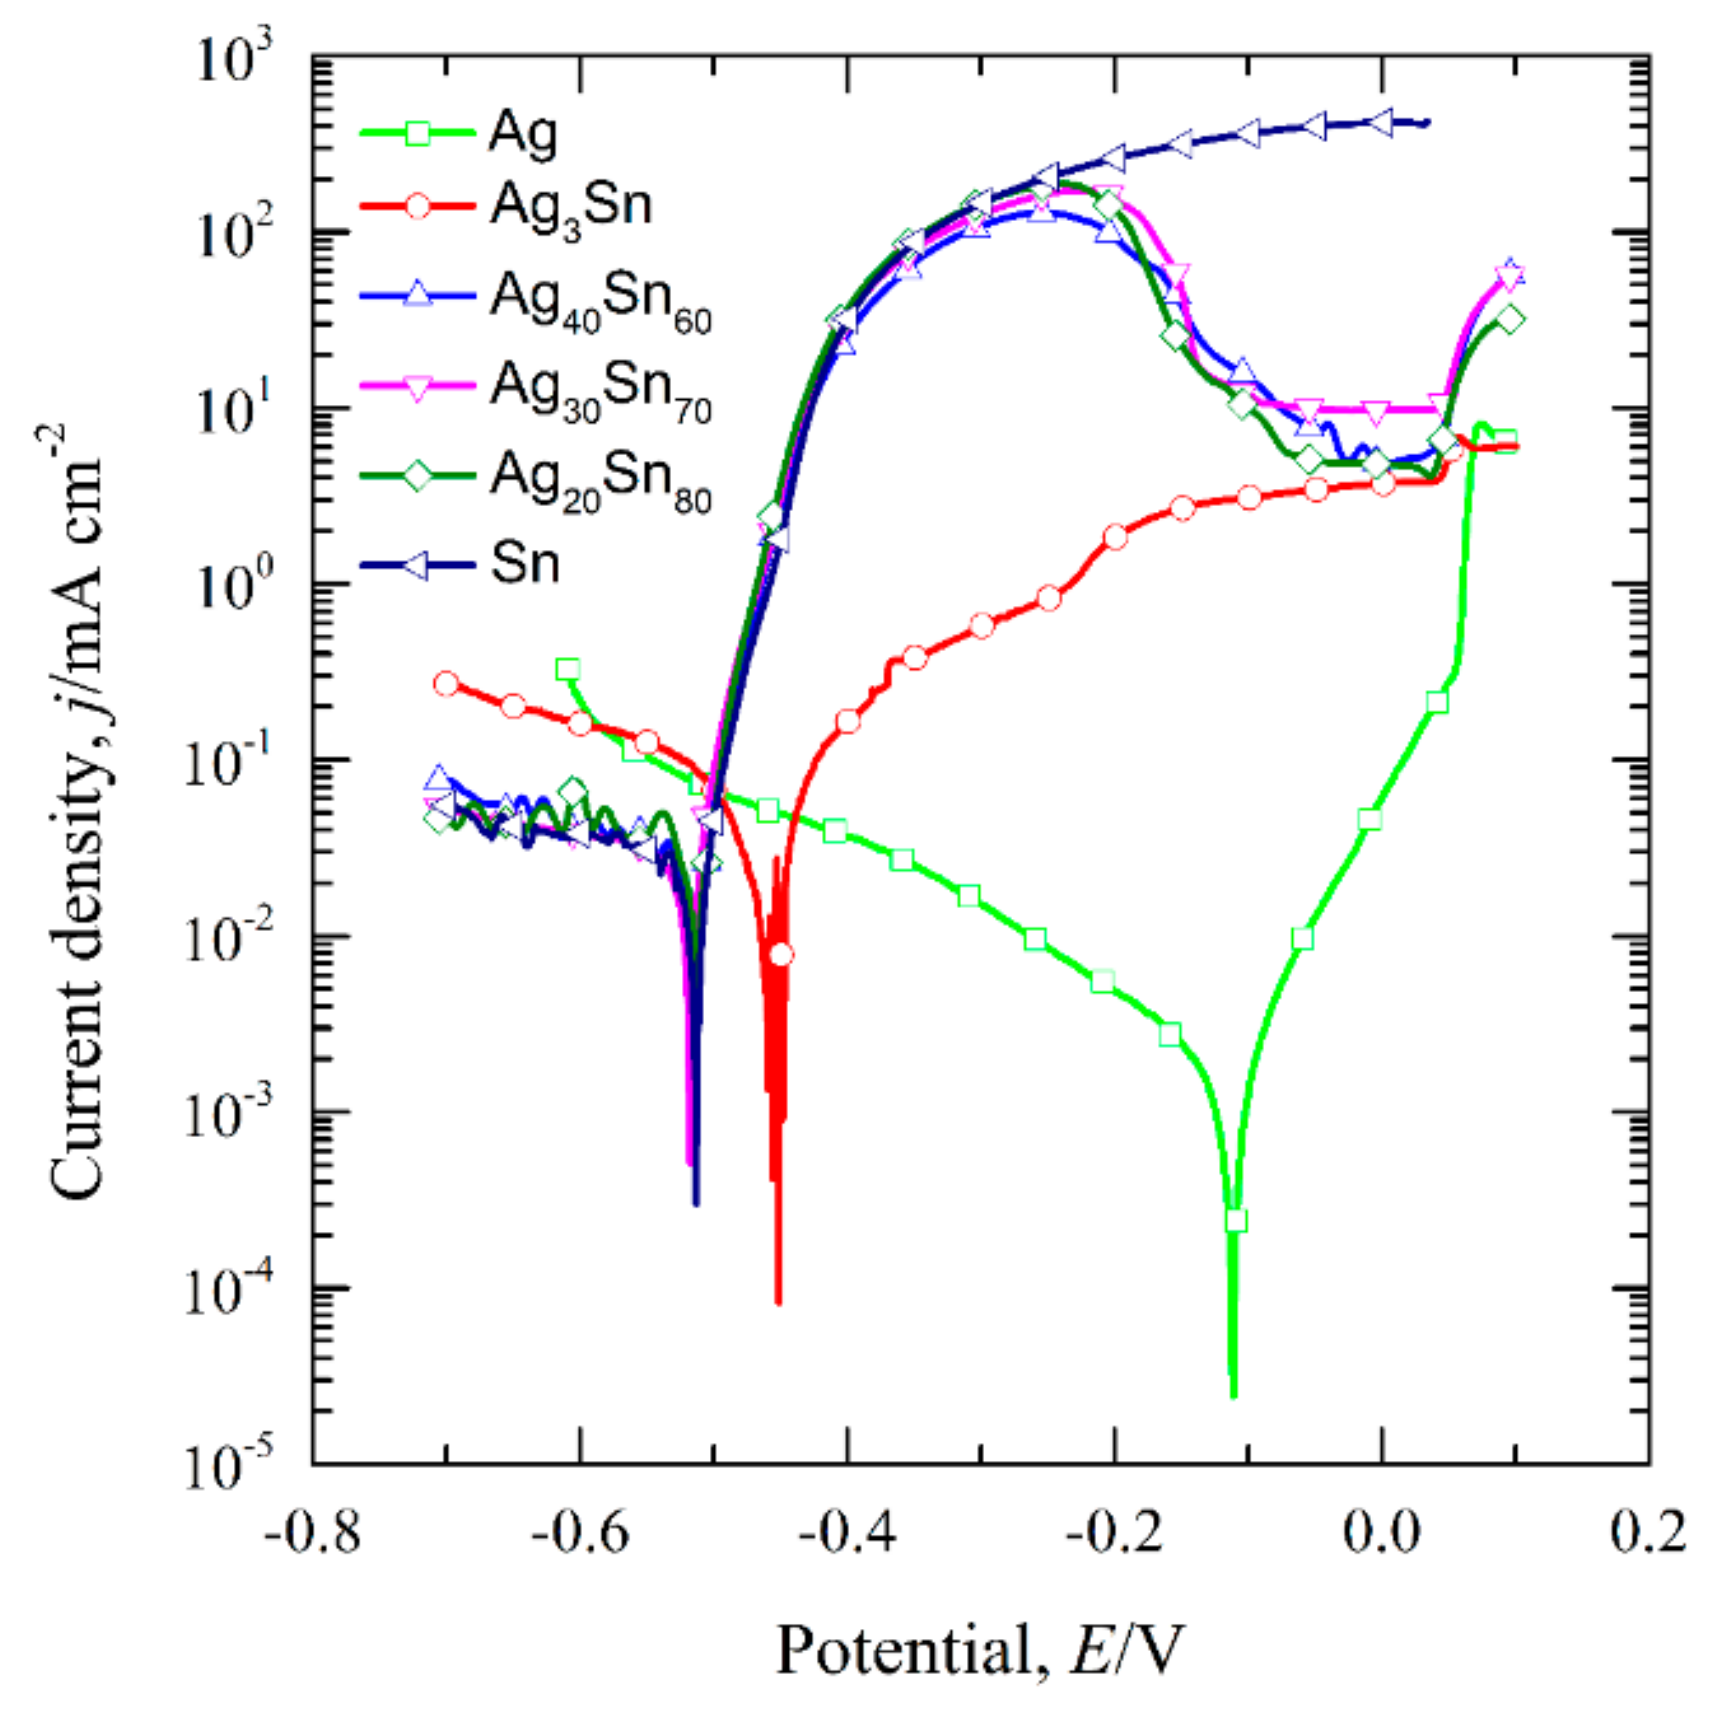
The transient curves of the open-circuit potential (Eocp) of the dual-phase Ag–Sn alloys, single-phase ε-Ag3Sn, β-Sn, and Ag in 1.2 M HCl solutions are shown in Figure 3. The Eocp were determined by calculating the average values of potentials during 300–600 s and are given in Table 1. It can be seen that the Eocp of Ag20Sn80, Ag30Sn70, and Ag40Sn60 alloys are close to that of β-Sn, and are about 90 mV and 460 mV lower than that of ε-Ag3Sn and Ag, respectively. Figure 4 shows the potentiodynamic polarization curves of as-spun alloys and fiols in 1.2 M HCl solution. The corrosion potential (Ecorr) was measured by the Tafel method [34]. All the Ecorr are also listed in Table 1. The Ecorr of ε-Ag3Sn and Ag are about 60 mV and 400 mV higher than those of dual-phase Ag–Sn alloys and β-Sn, respectively. As shown in Figure 4, a peak in the potential range of −0.51 V~−0.10 V and a plateau at −0.10 V~0.04 V were observed on the polarization curves of Ag20Sn80, Ag30Sn70, and Ag40Sn60 alloys. The currents increased again at potentials of above 0.04 V. The peak current densities at about −0.24 V were 187 mA cm−2, 172 mA cm−2, and 129 mA cm−2 for Ag20Sn80, Ag30Sn70, and Ag40Sn60 alloys, respectively. The current plateaus were maintained in the range of 5~10 mA cm−2. The polarization curves of Sn foils coincided with those of Ag–Sn alloys at potentials of below −0.24 V, but the current increased continuously at potentials above −0.24 V. The currents of ε-Ag3Sn phases went through a slower increase in the potential range of −0.46 V~0.04 V, followed by a sharp increase at potentials above 0.04 V. As to the polarization curve of Ag foils, a less obvious passivation region appeared in the potential range of −0.11 V~0.04 V. It was also observed in the previous reports [27]. The present results show that the open-circuit potentials and corrosion potentials are mainly determined by the less noble β-Sn phase in dual-phase Ag–Sn alloys, rather than the alloy compositions.

3.2. Morphological Characteristics of Nanoporous Silver after Potentiostatic Dealloying of Dual-Phase Ag–Sn Alloys

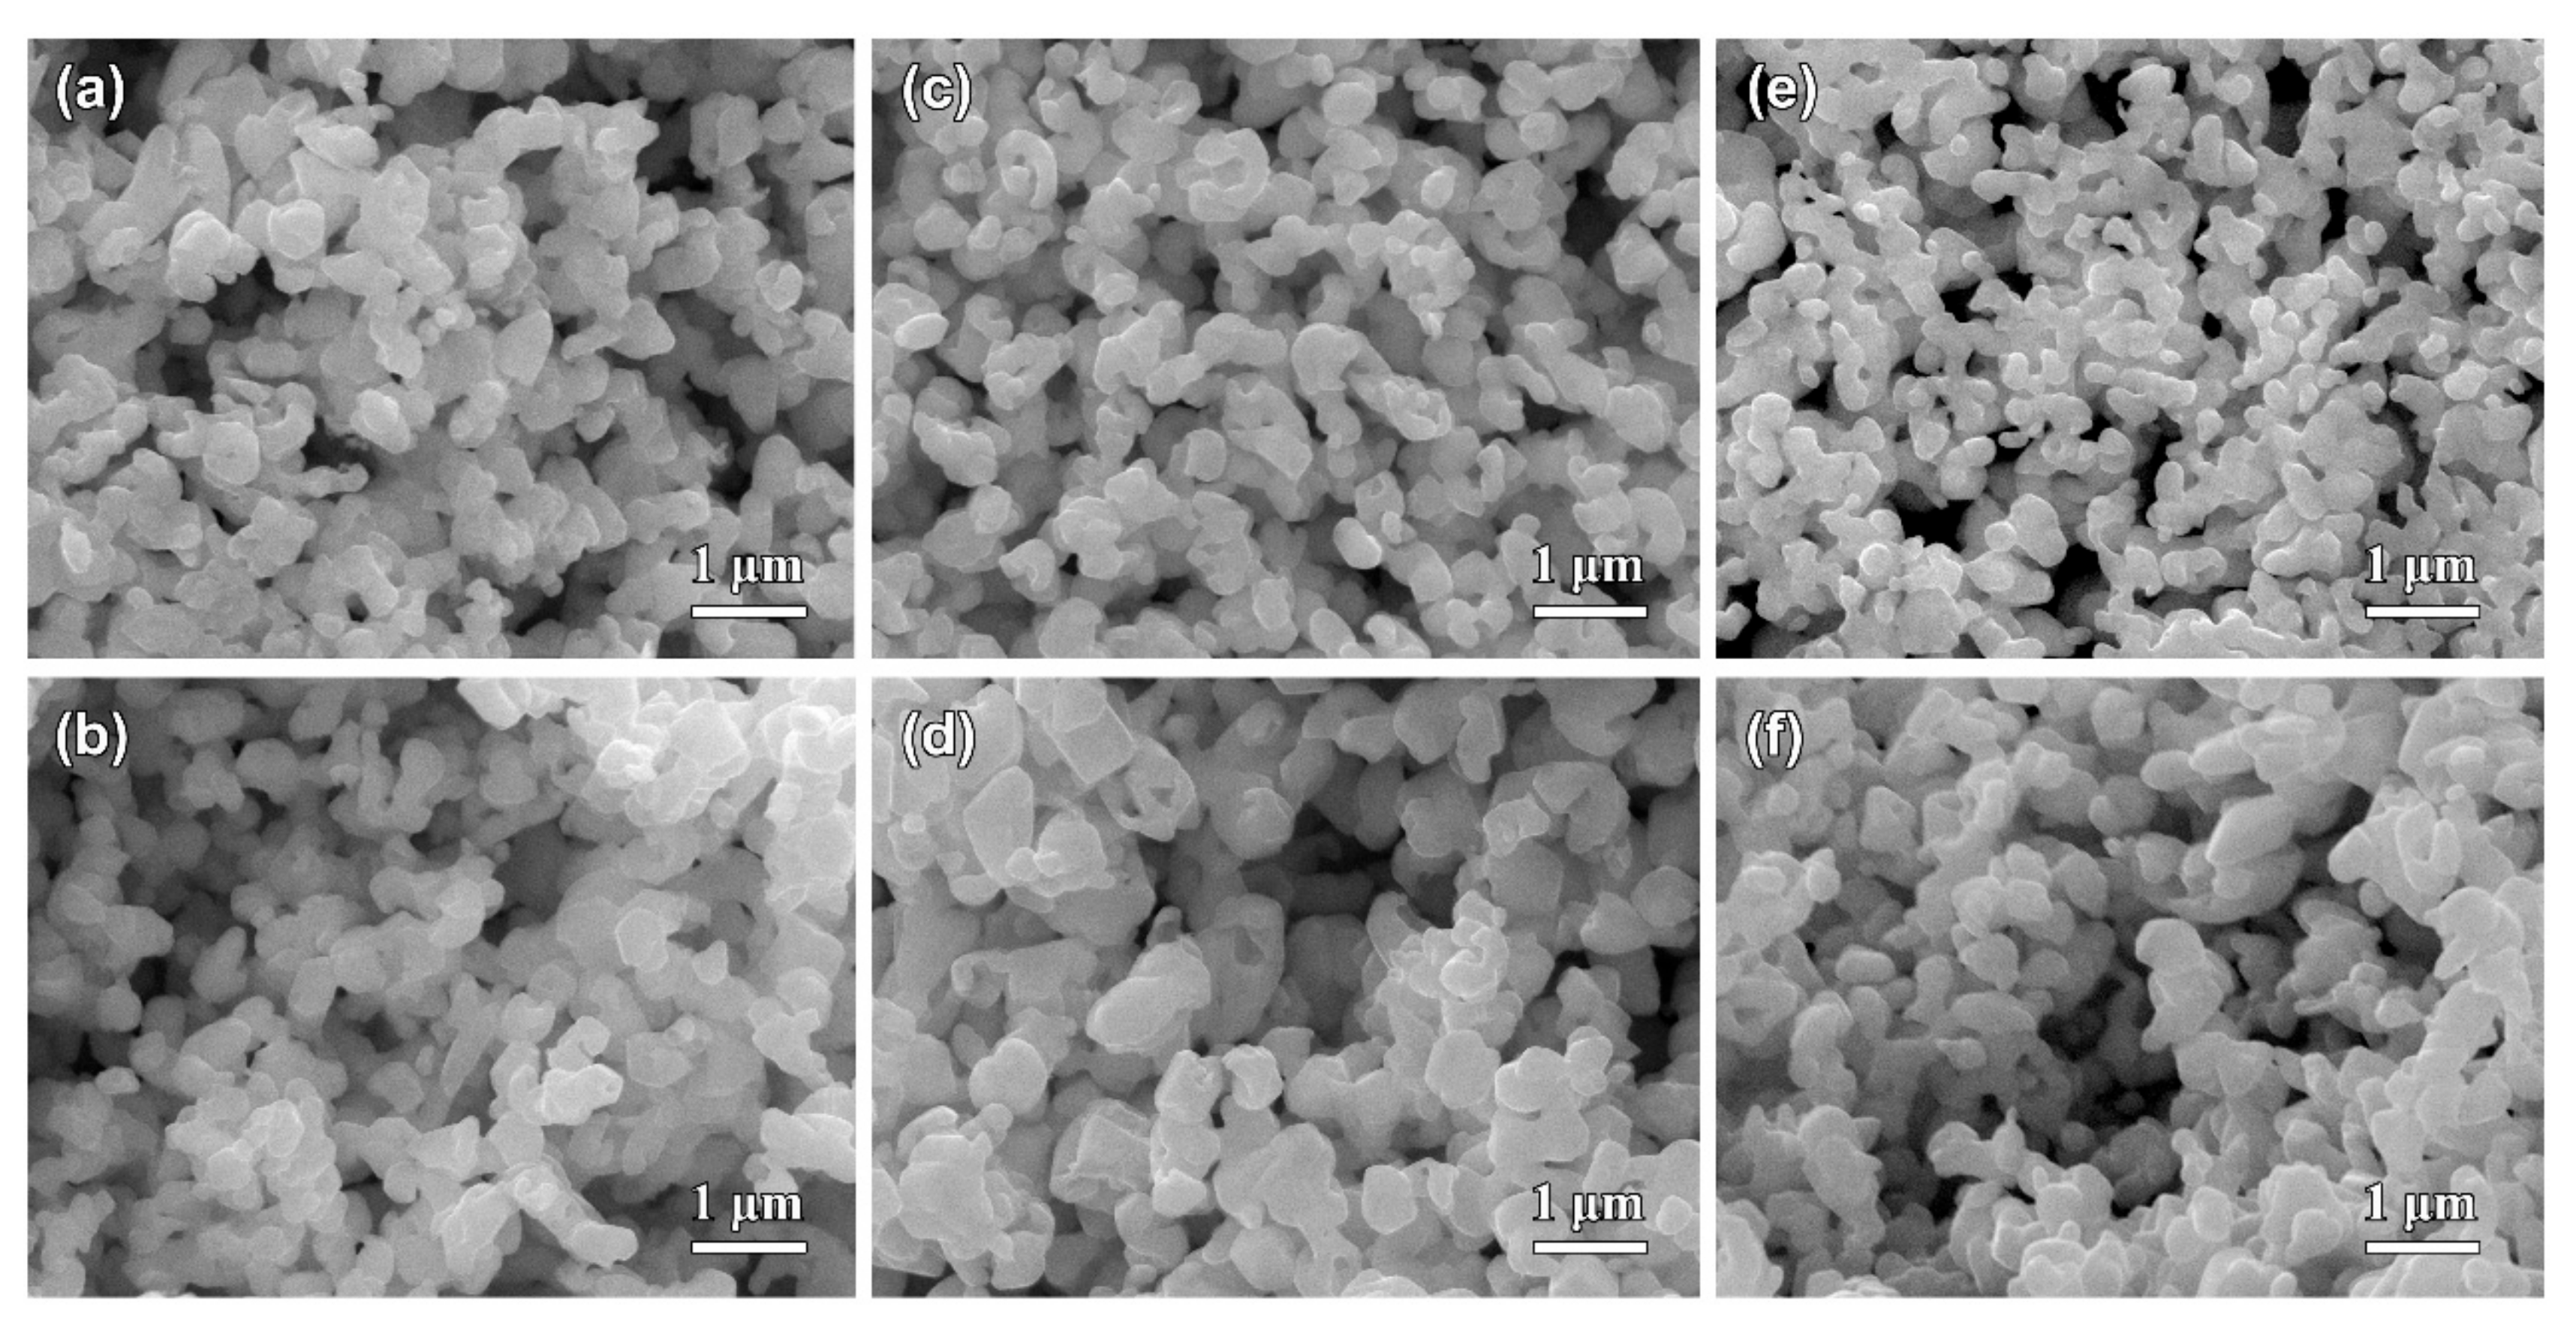
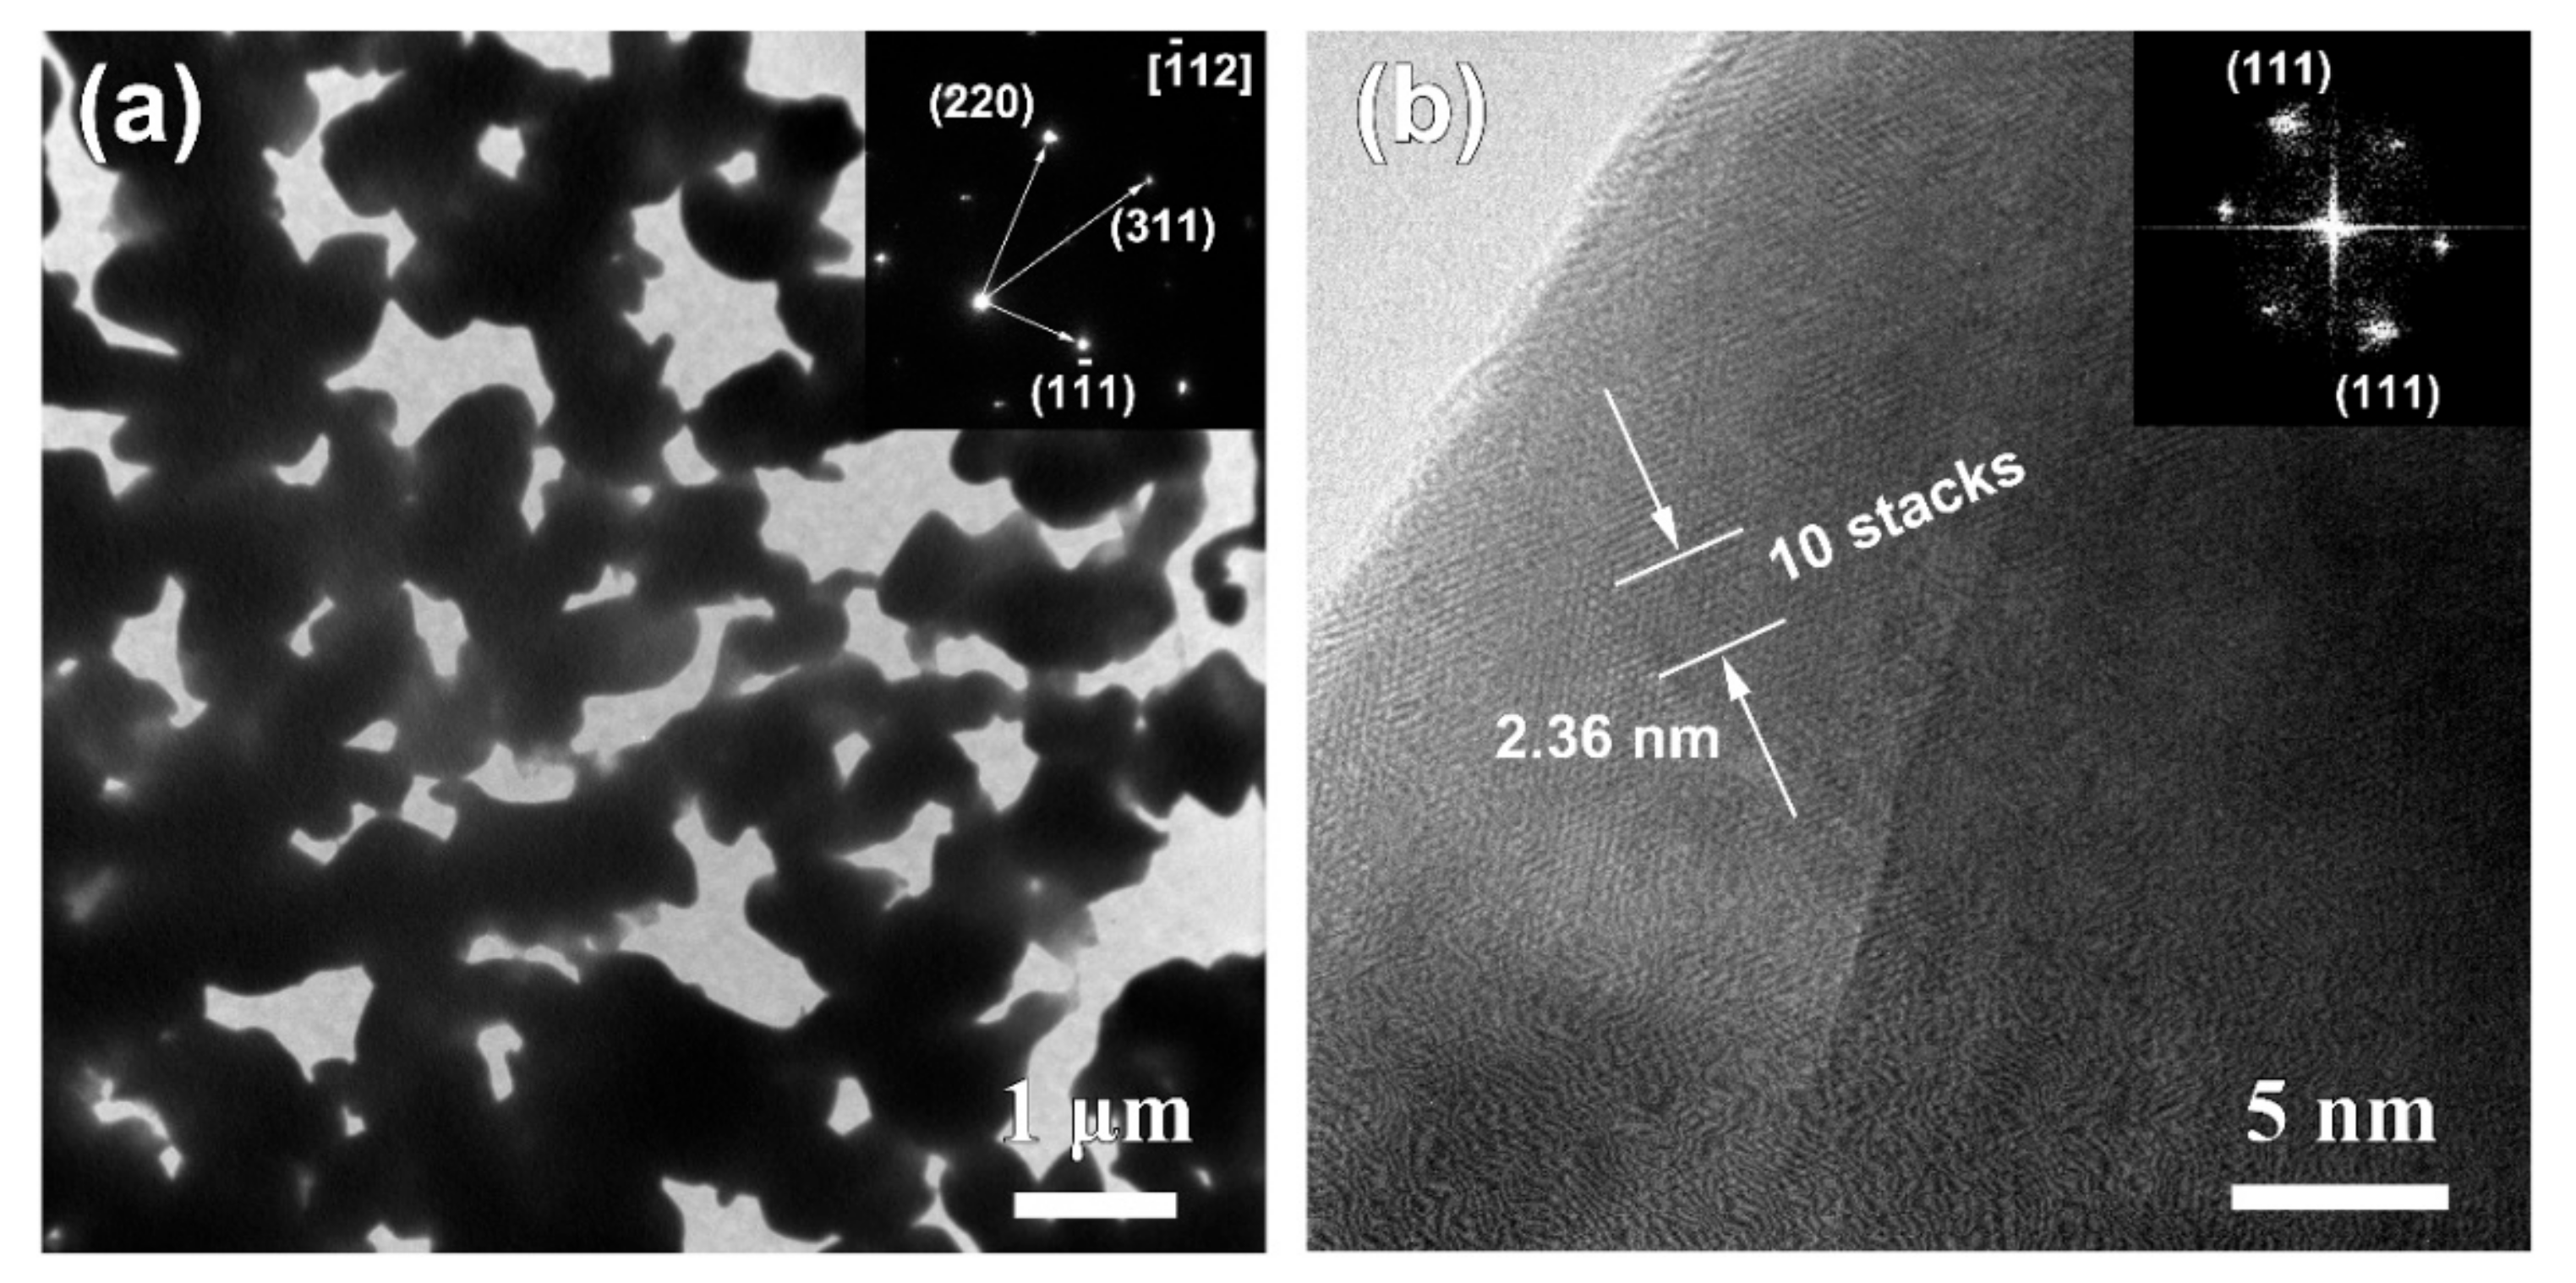
Figure 5 shows the top-view and cross-sectional SEM images of Ag20Sn80, Ag30Sn70, and Ag40Sn60 ribbons after potentiostatic dealloying at potential of −50 mV in 1.2 M HCl solution. The dealloying conditions are given in Table 2. As shown in Figure 5, bi-continuous nanoporous structure with the open-cell pores and ligaments, typical of nanoporous metals [9,27,30], formed in all as-dealloyed ribbons. The mean sizes of the ligaments and pores are summarized in Table 2. The nanoporous structures of as-dealloyed Ag20Sn80, Ag30Sn70, and Ag40Sn60 ribbons had a ligament size of 182 ± 38 nm, 213 ± 33 nm, and 252 ± 32 nm and a pore size of 301 ± 49 nm, 249 ± 39 nm, and 222 ± 54 nm. In addition, the residual Sn in as-dealloyed ribbons were detected by EDX. The EDX results indicated the residual Sn were 2.60 at.%, 0.81 at.%, and 1.17 at.% in as-dealloyed Ag20Sn80, Ag30Sn70, and Ag40Sn60 ribbons, respectively. XRD patterns of dual-phase Ag20Sn80, Ag30Sn70, and Ag40Sn60 ribbons after dealloying is similar to that shown by the lowest one in Section 3.3. The strong diffraction peaks at 2θ = 38.1°, 44.3°, and 64.4° were assigned to Ag (111), (200), and (220), while a weak diffraction peak at 2θ = 39.5° was attributed to ε-Ag3Sn (111). The present EDX and XRD results show that the as-dealloyed ribbons are dominantly composed of fcc Ag phase and trace undealloyed ε-Ag3Sn phase. The residual ε-Ag3Sn phase is expected to be trapped inside the Ag ligaments and cannot be dealloyed [35,36]. The nanoporous structure obtained by dealloying Ag40Sn60 ribbon at −50 mV was characterized by TEM as shown in Figure 6. As shown in Figure 6a, the nanoporous structure had a bi-channel structure with ligaments and pores. The SAED pattern (inset of Figure 6a) indicates that the selected area in the ligaments is in a single crystalline state and can be indexed to the fcc Ag viewed along the [ 1 ¯ 12] zone axis. The HRTEM image in Figure 6b shows that the lattice fringes extended throughout the whole ligaments, further indicating the existence of the single crystalline phase in the ligaments. The interplanar distance between the adjacent fringes was confirmed to be about 2.36 nm for 10 stacks of the lattice panels of fcc Ag (111). The bright diffraction spots in the fast Fourier transform (FFT) pattern (inset of Figure 6b) are also attributed to fcc Ag (111).
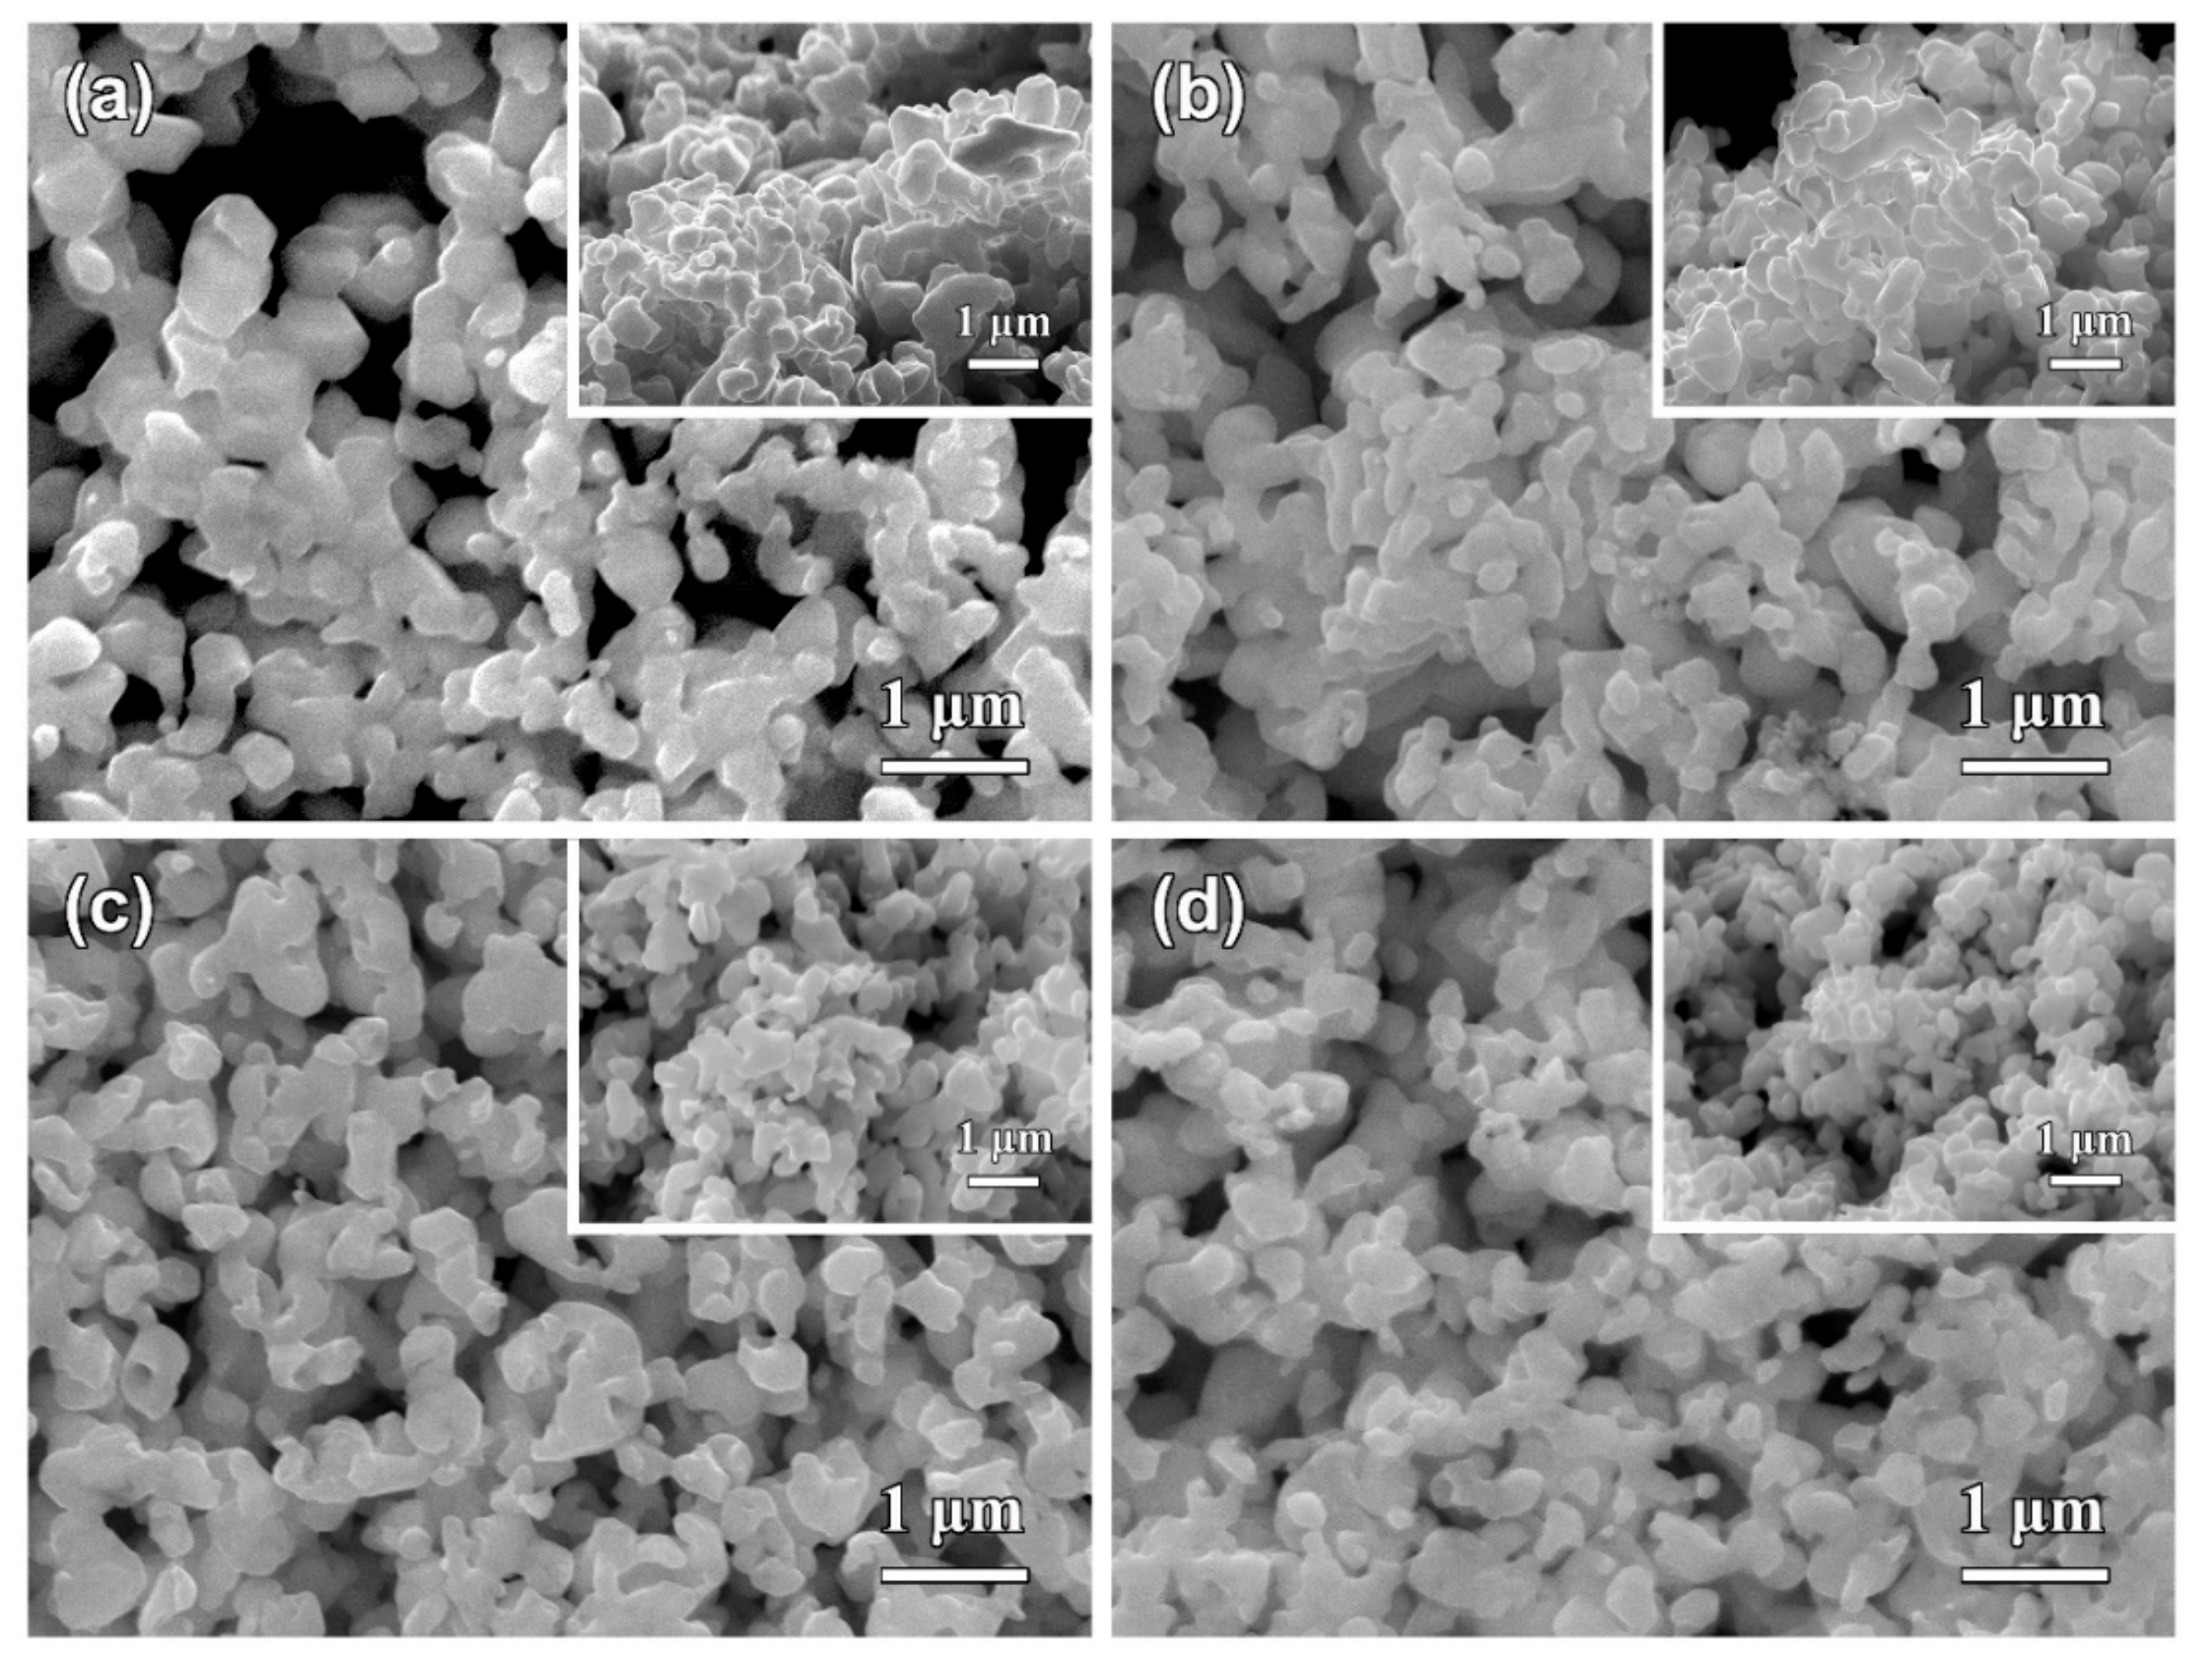
The SEM images of Ag40Sn60 ribbons after potentiostatic dealloying at potential of 0, −25, −75, and −100 mV in 1.2 M HCl solution are shown in Figure 7. The similar nanoporous structures can be observed in the as-dealloyed ribbons. The ligament sizes of nanoporous structures obtained by dealloying at 0, −25, −75, and −100 mV were 306 ± 50 nm, 278 ± 55 nm, 210 ± 32 nm, and 190 ± 29 nm, and the pore sizes were 295 ± 42 nm, 250 ± 34 nm, 190 ± 20 nm, and 165 ± 39 nm. The increase of the ligament sizes with increasing applied potential is attributed to coarsening by the large driving force from the high applied dealloying potentials and concentrated HCl solutions. The EDX results demonstrate that all Sn was leached away for the ribbon dealloyed at 0 mV and the residual Sn were 0.29 at.%, 1.22 at.%, and 1.33 at.% in ribbons dealloying at −25, −75, and −100 mV, respectively. Moreover, the applied potentials have a significant influence on the dealloying duration, which was much different at various applied potential, as listed in Table 2. For example, the dealloying duration was 36745 s at the potential of −100 mV but was only 1924 s at the potential of 0 mV. Therefore, it is of a great importance to select the suitable applied potential to prepare NPS by potentiostatic dealloying dual-phase Ag–Sn precursor alloys. The higher applied potential can effectively shorten the dealloying time but is not conducive to the formation of smaller ligaments and pores.

3.3. Nanoporous Structures and Phase Changes during Potentiostatic Dealloying

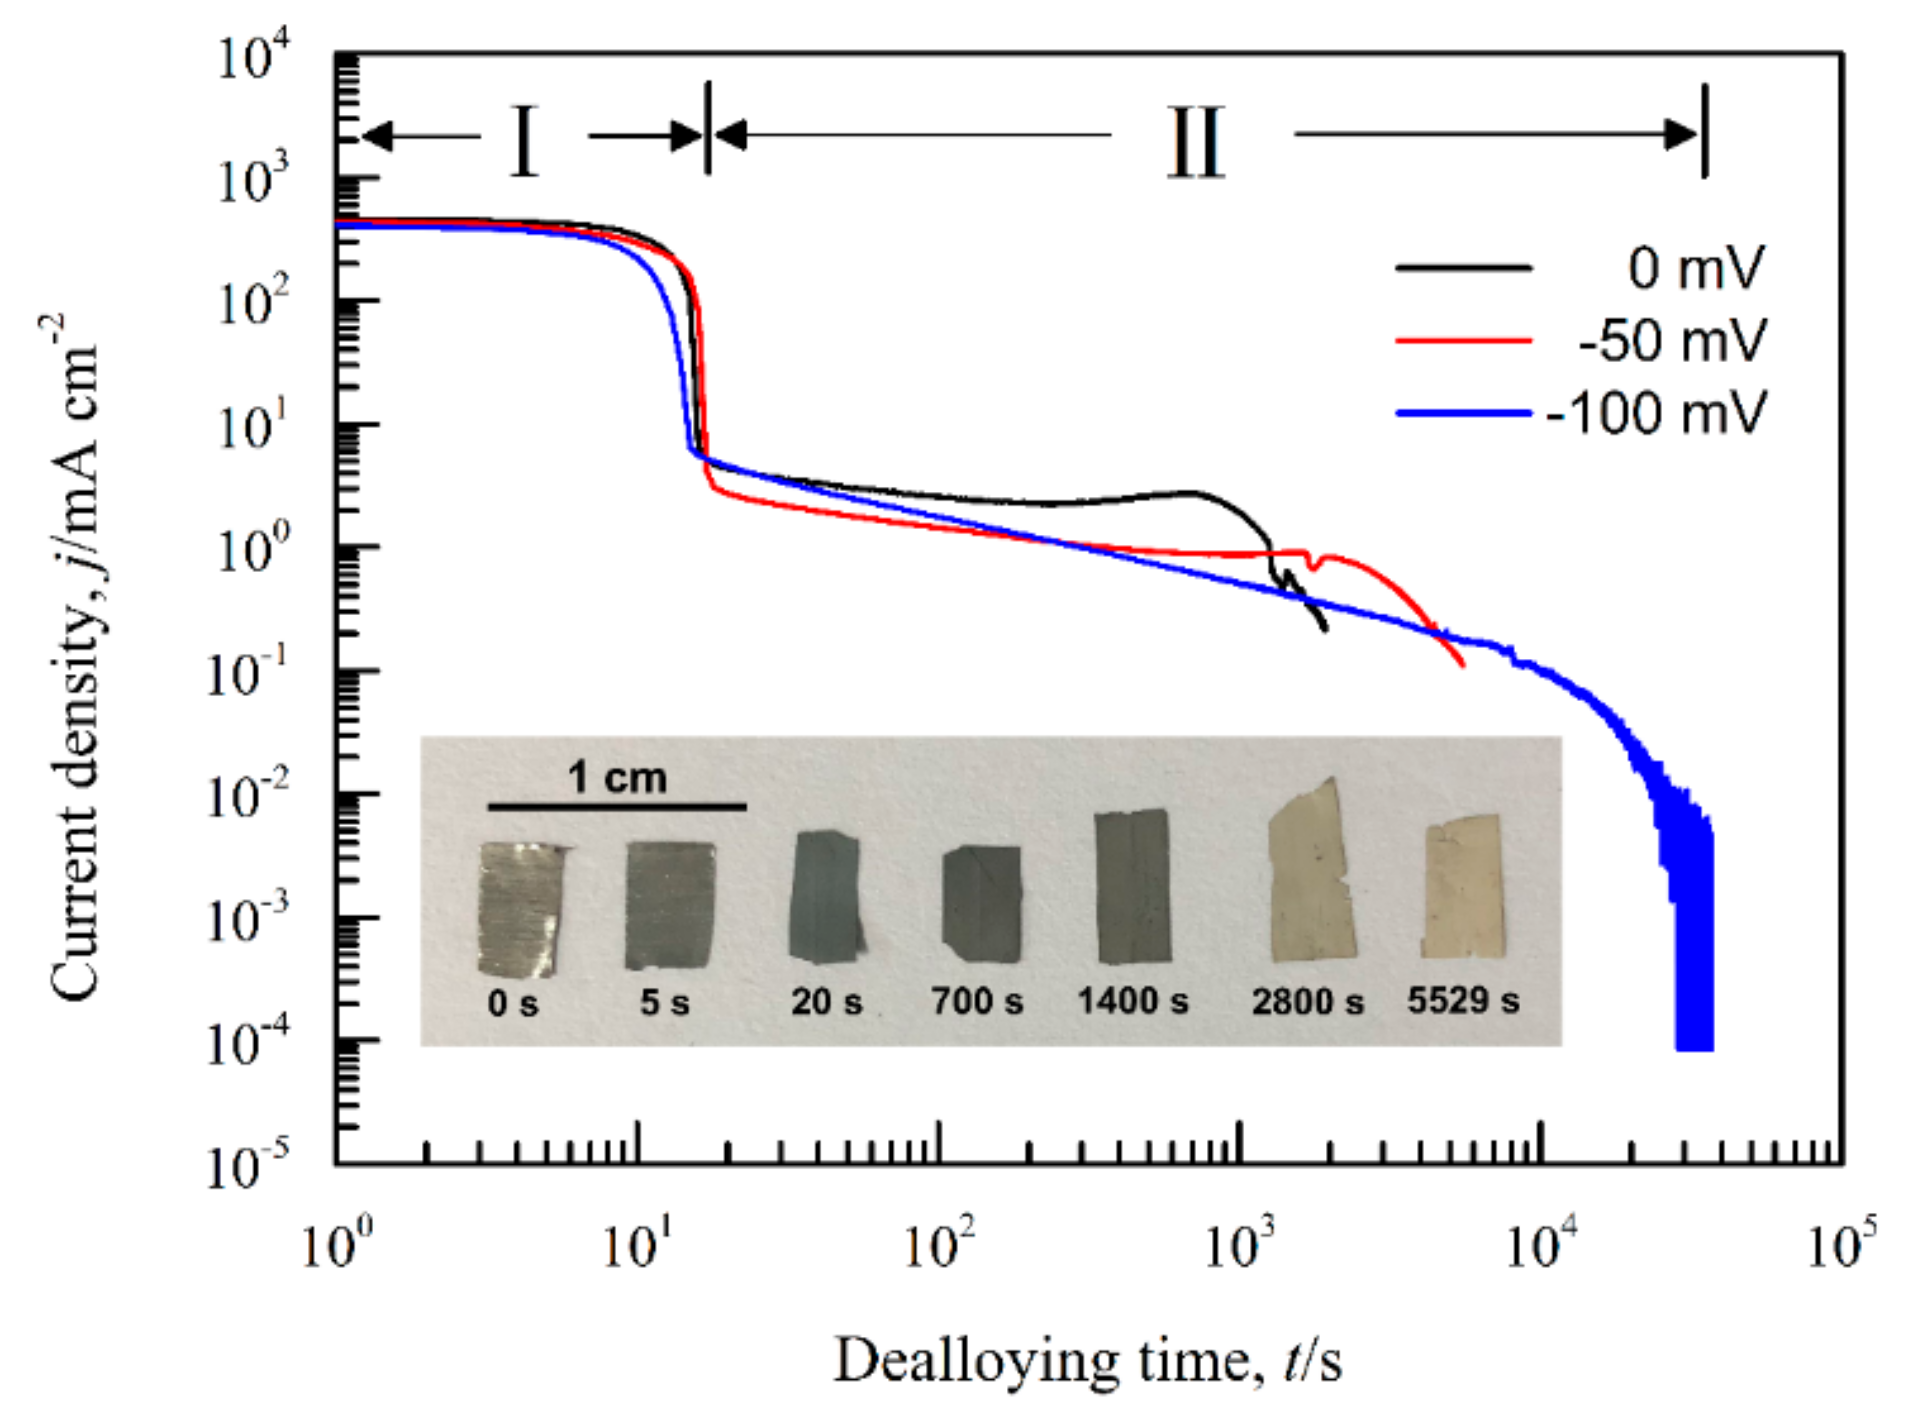
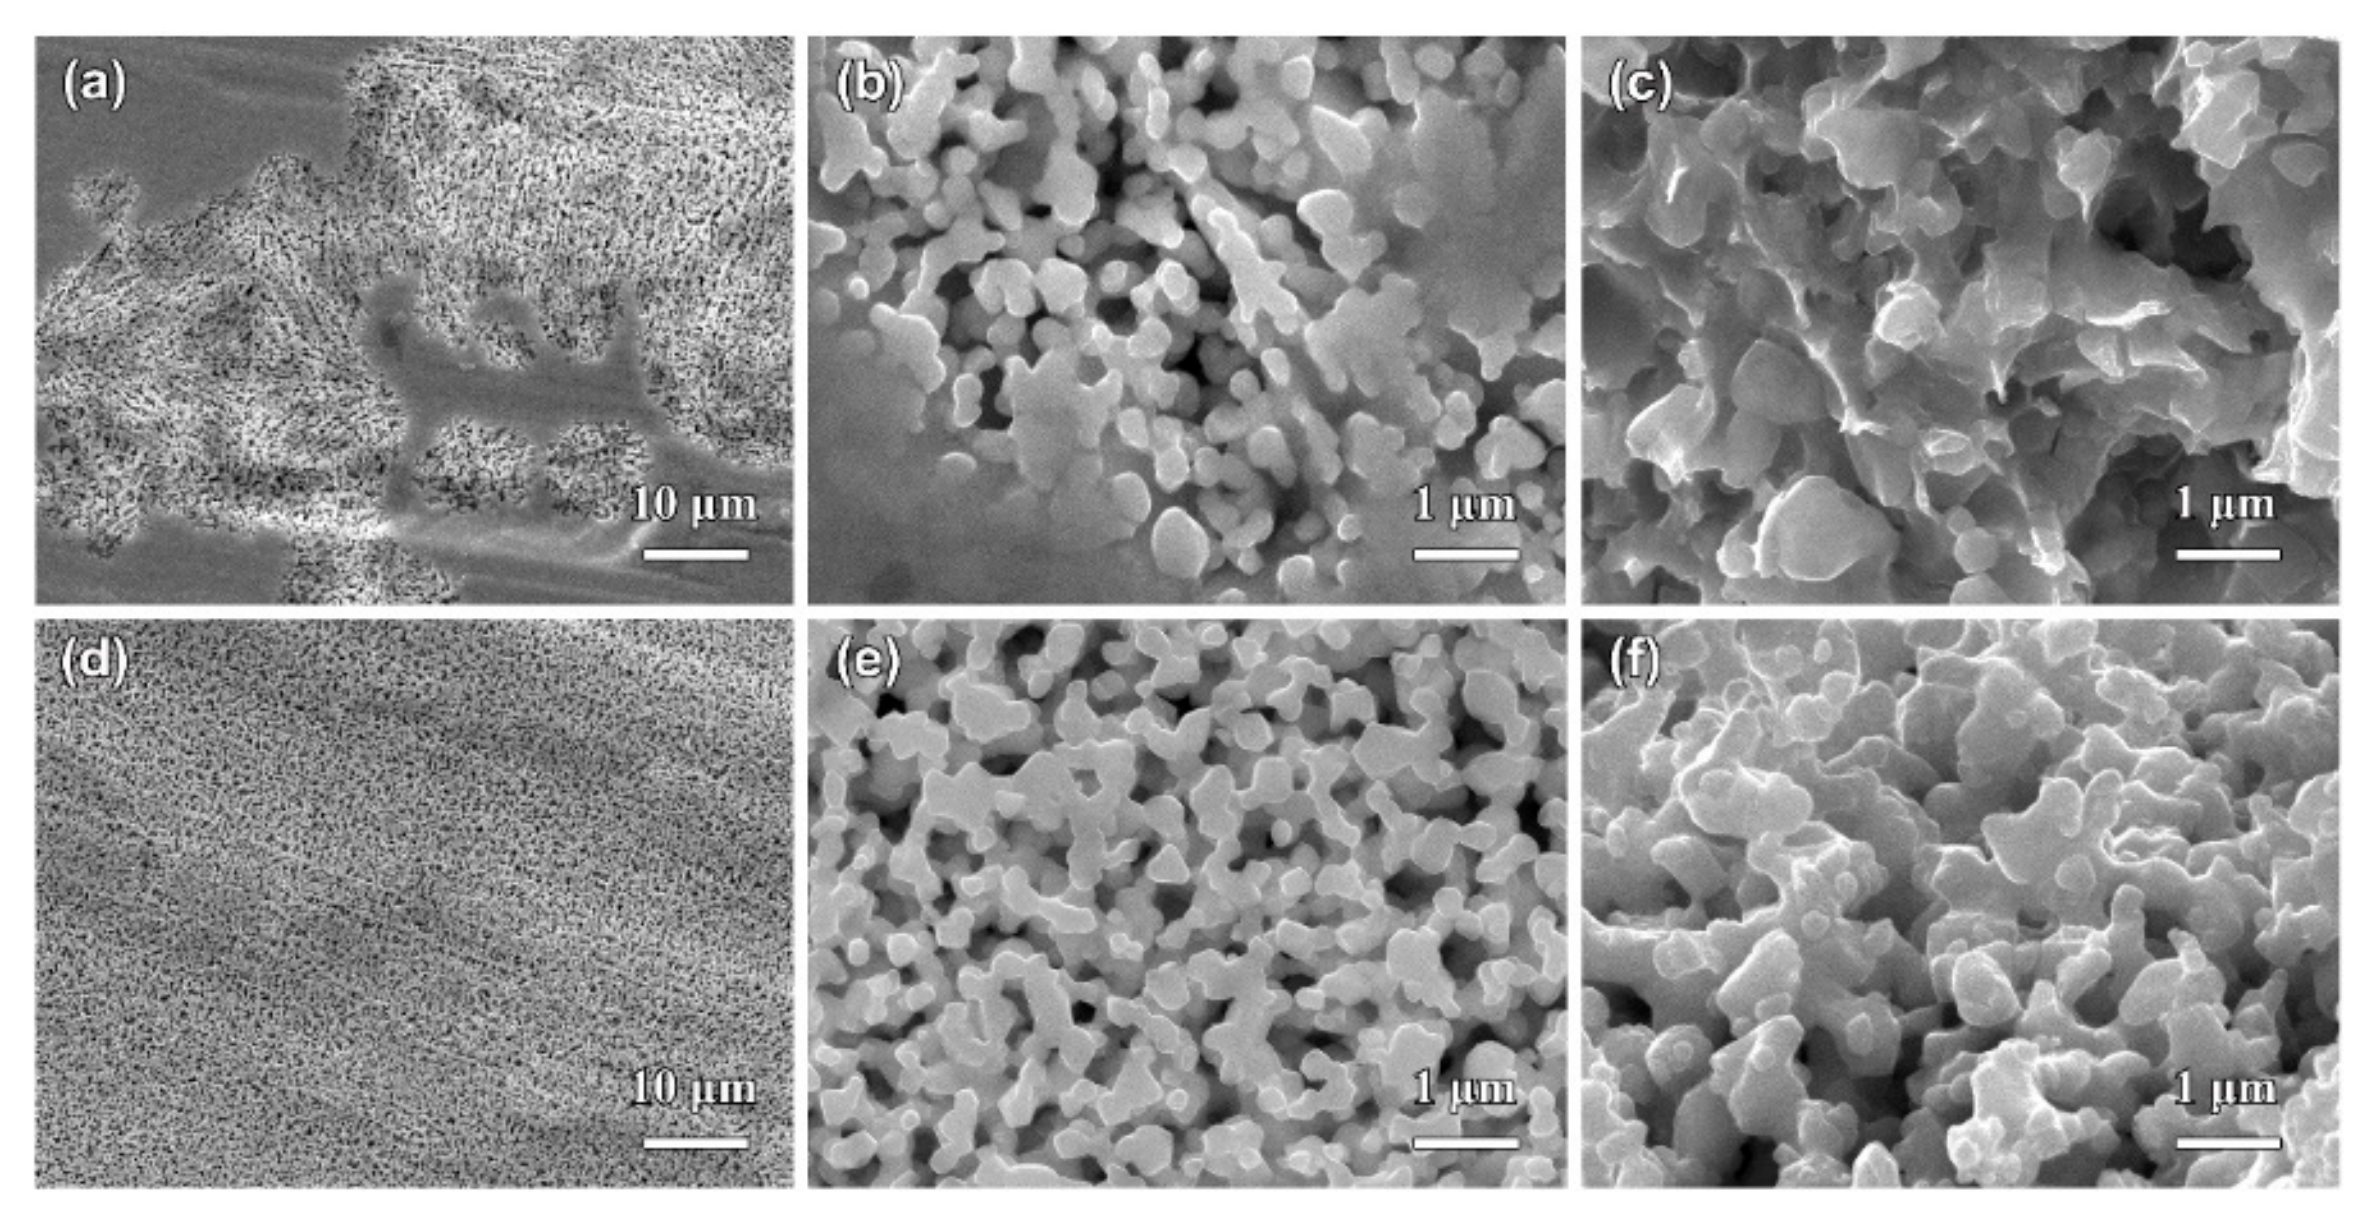
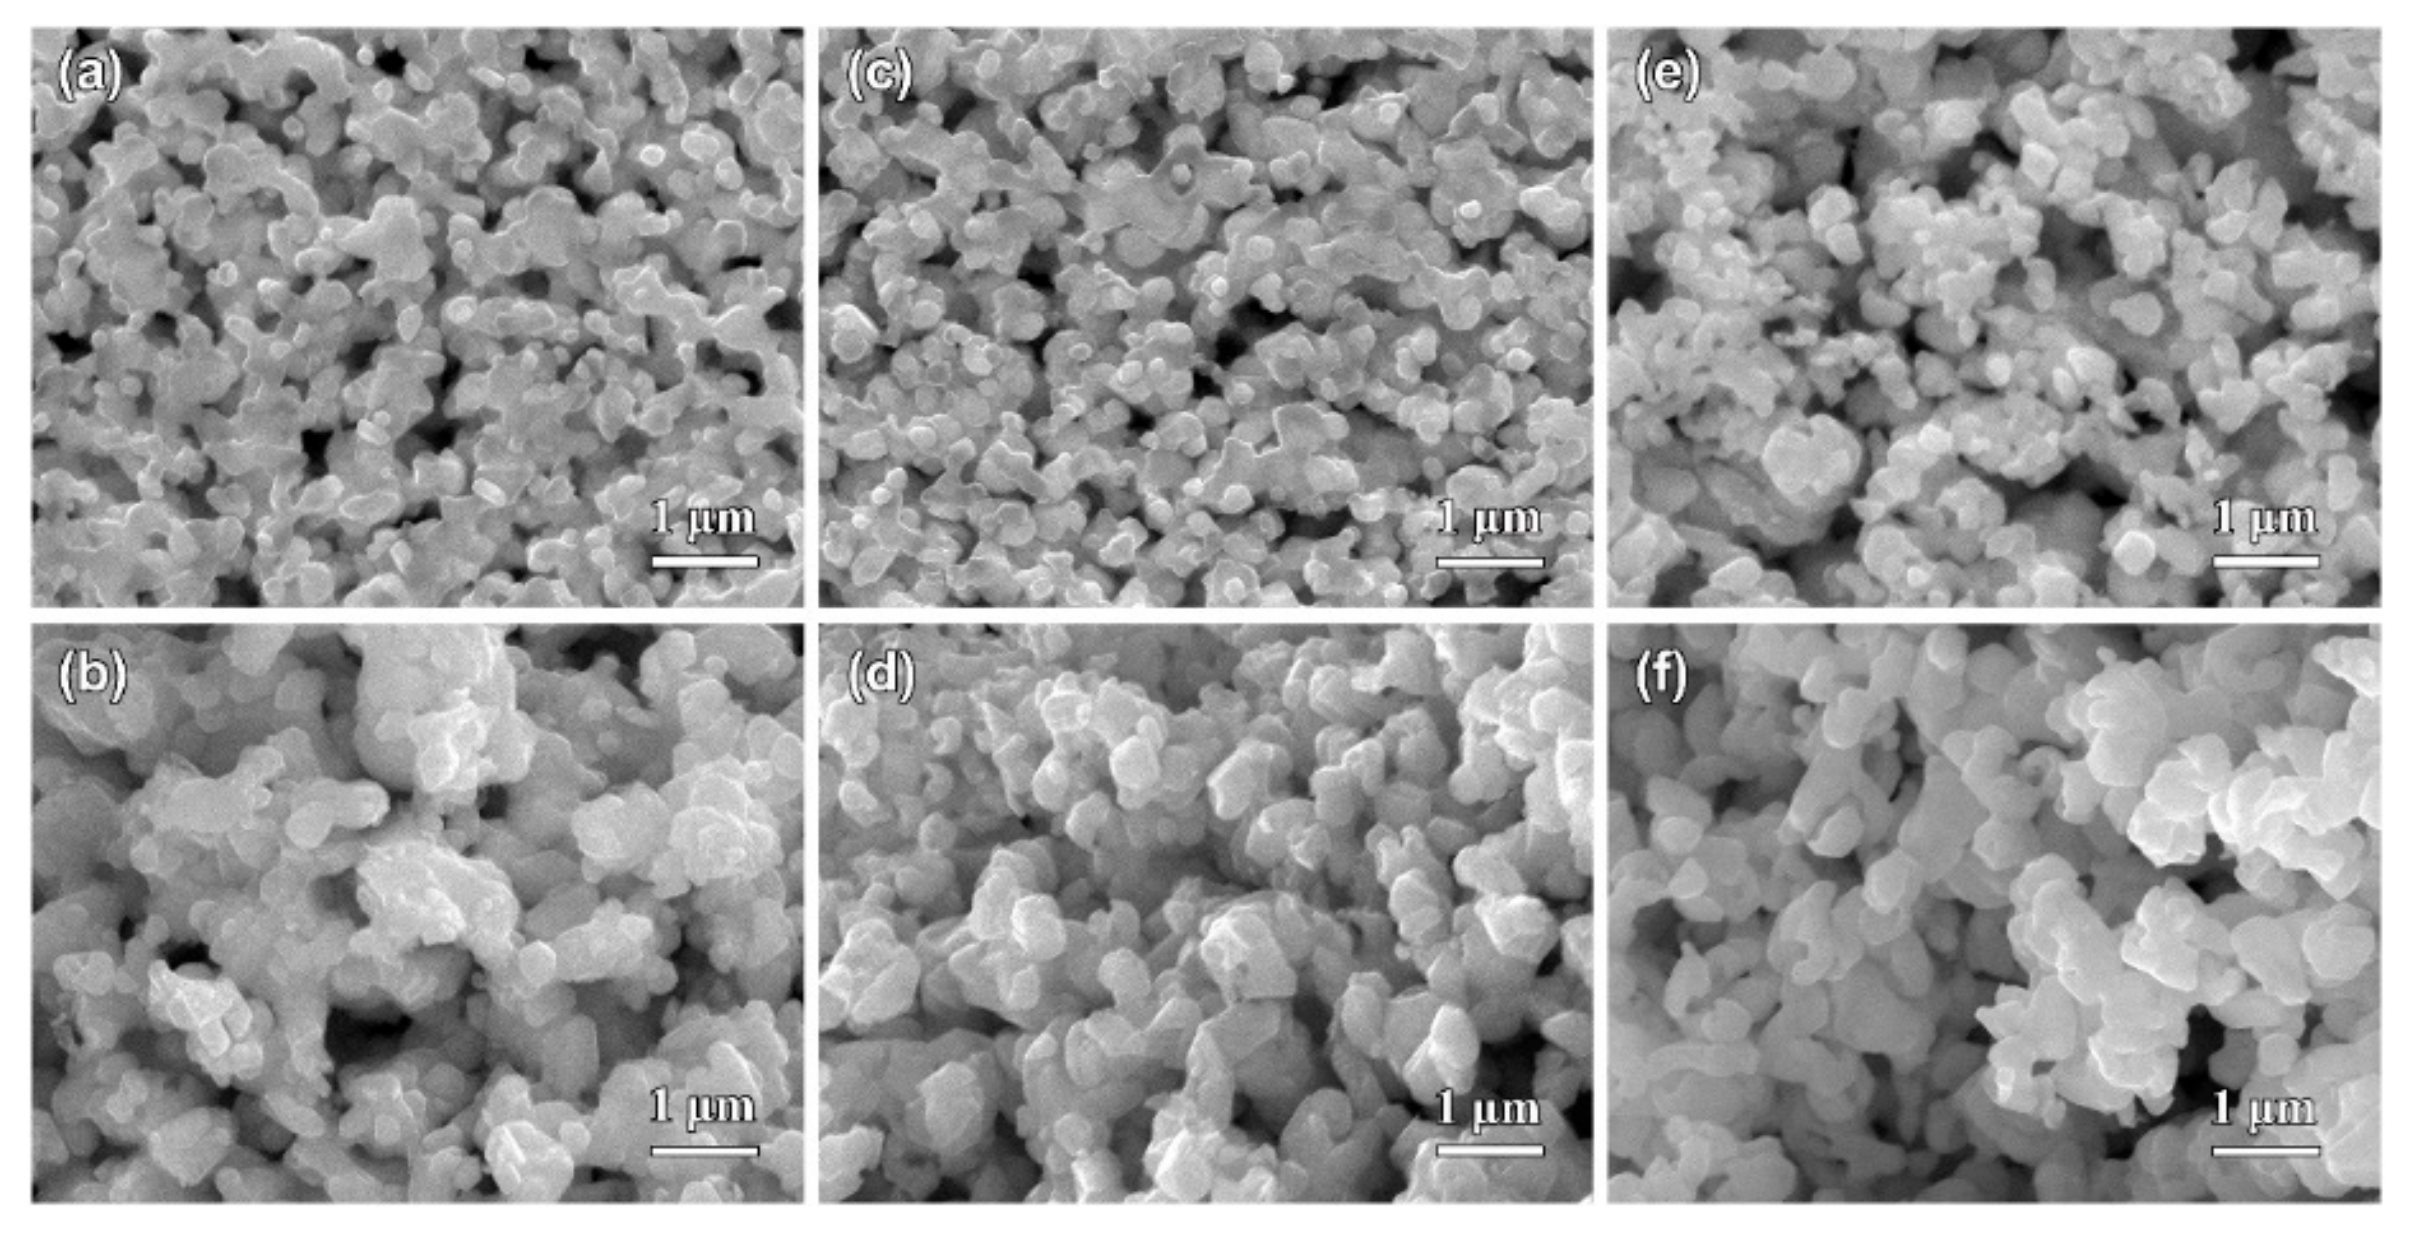
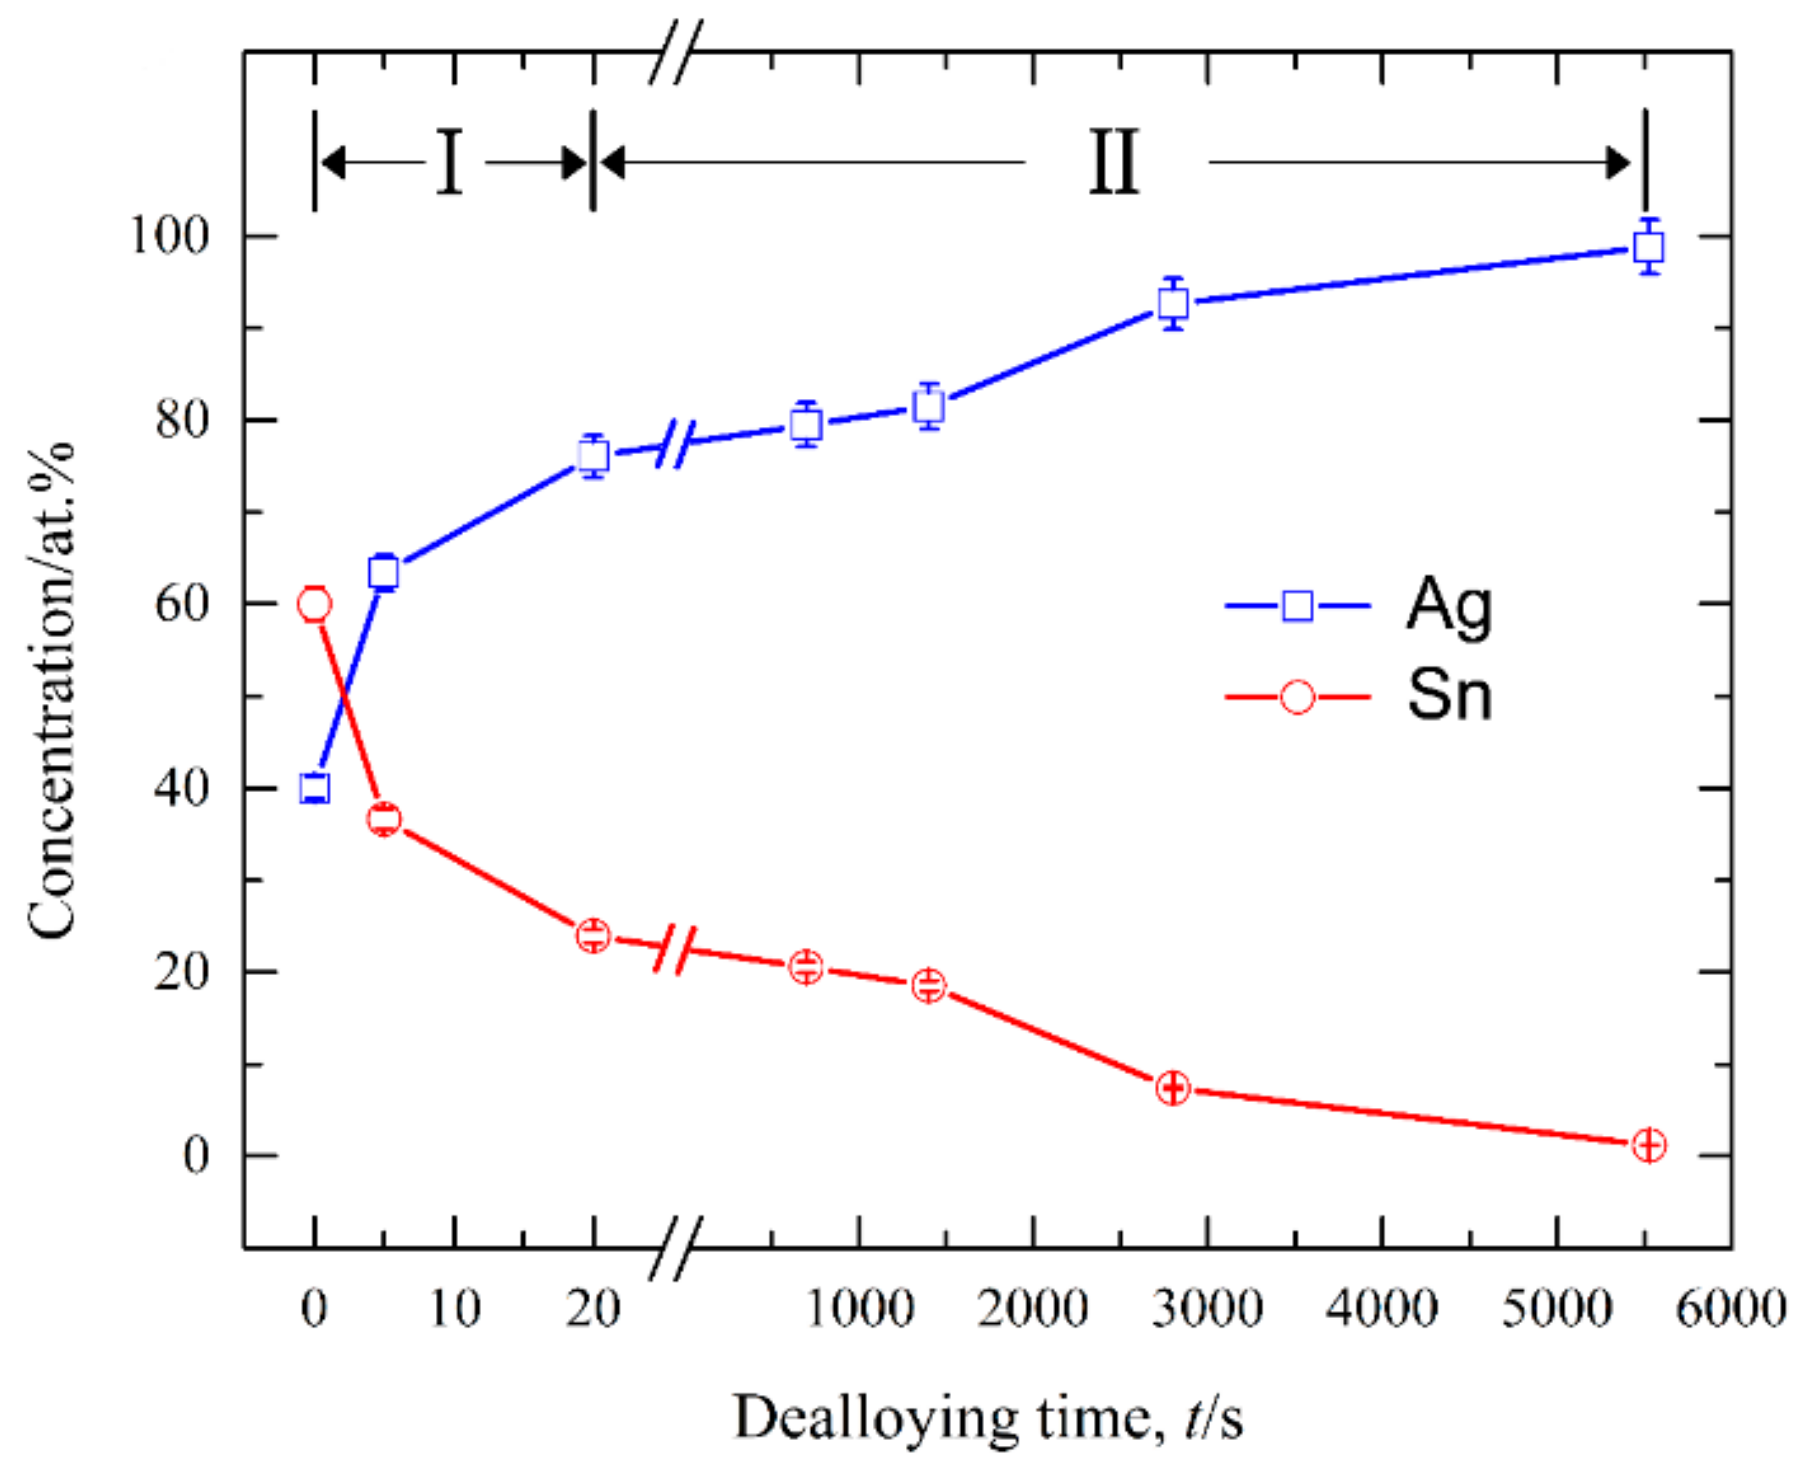
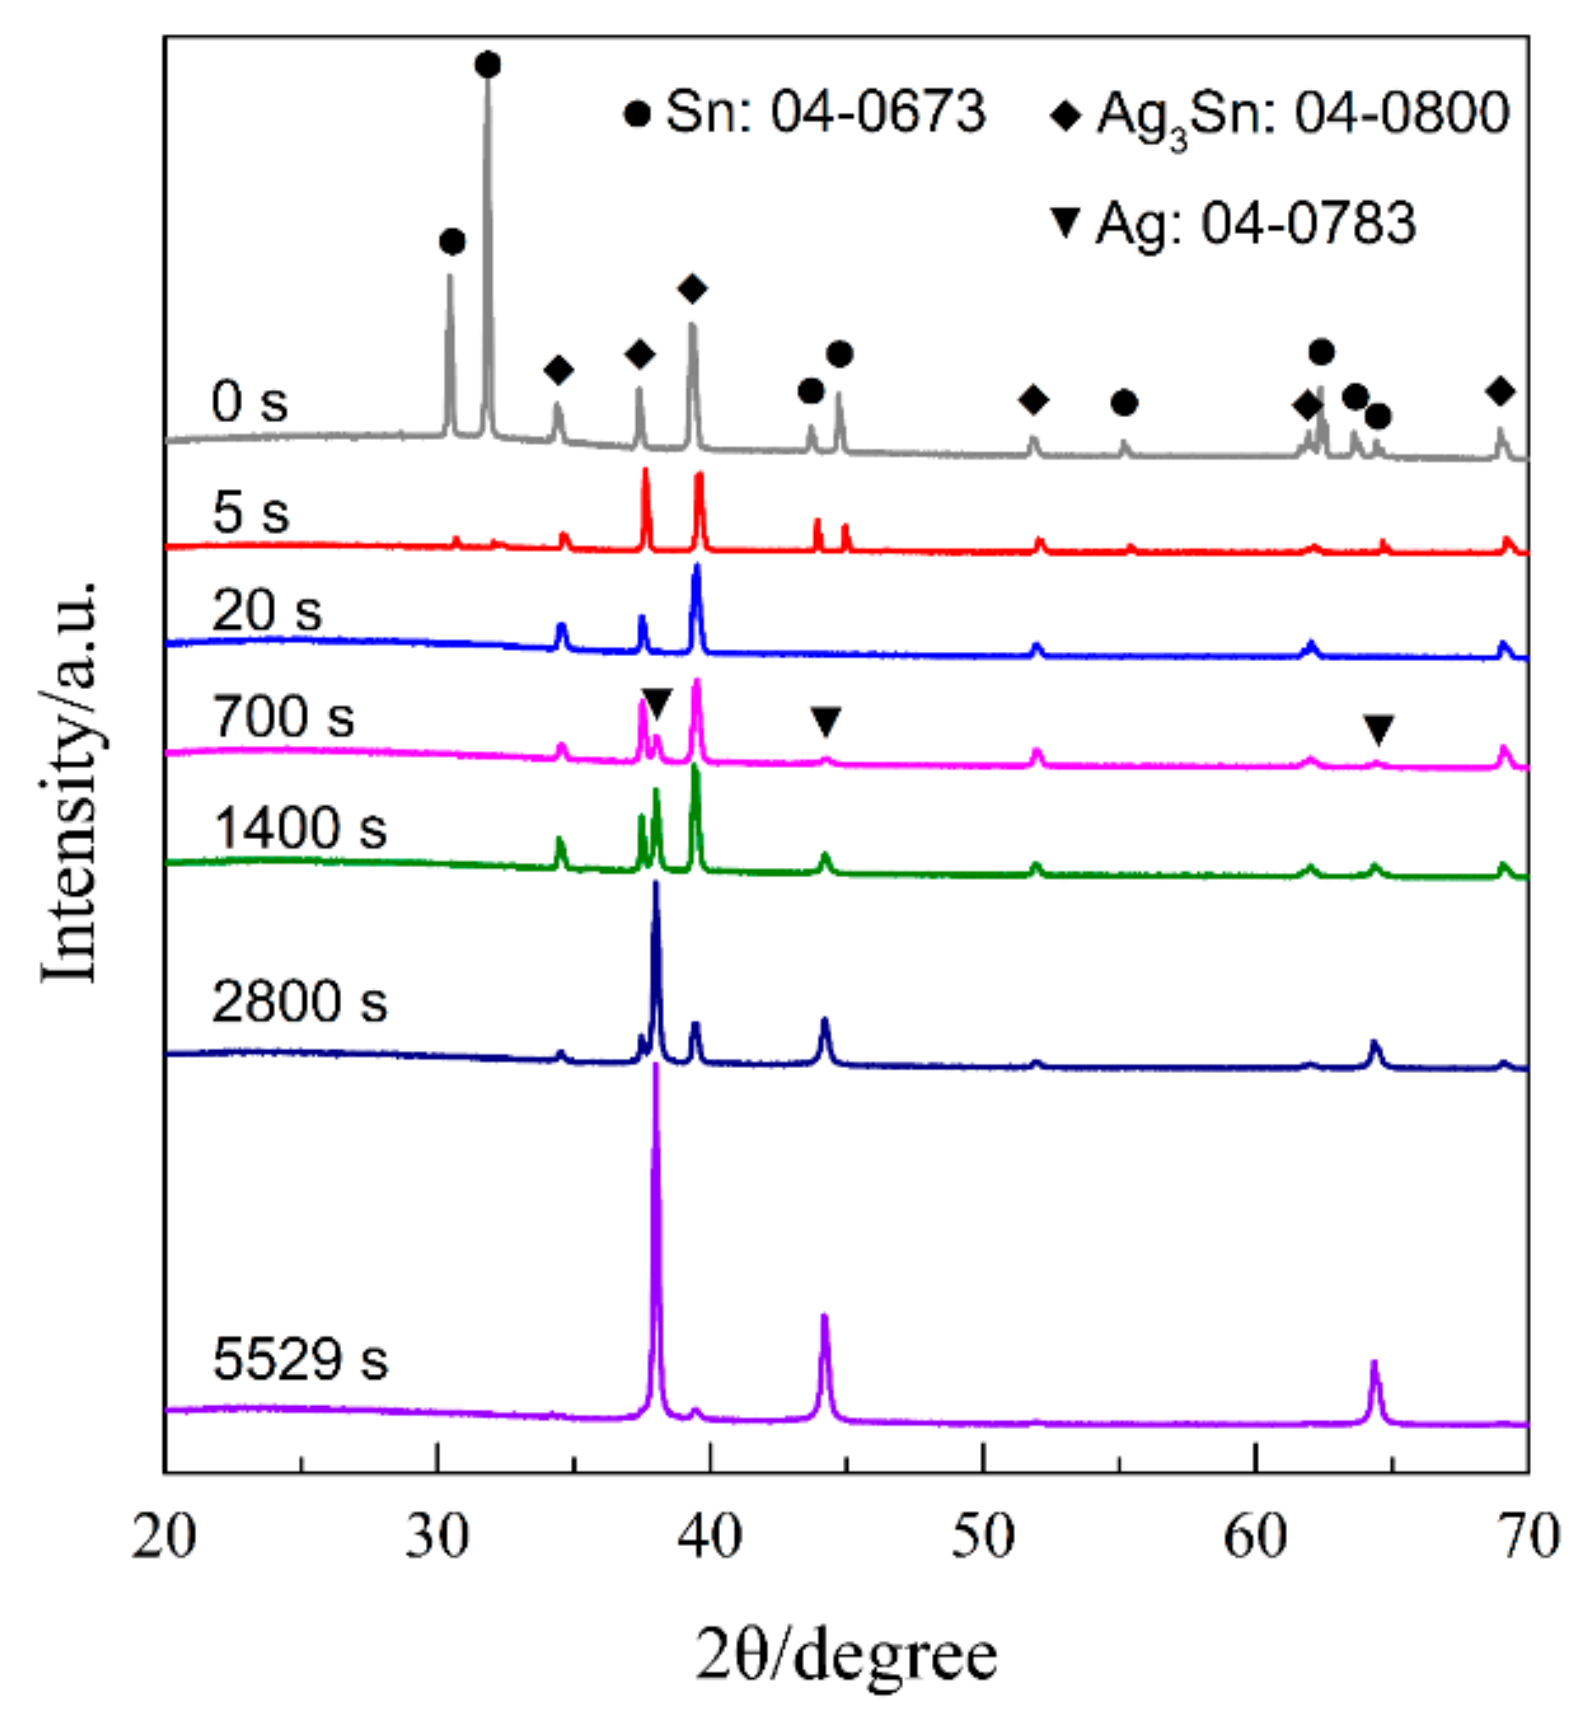
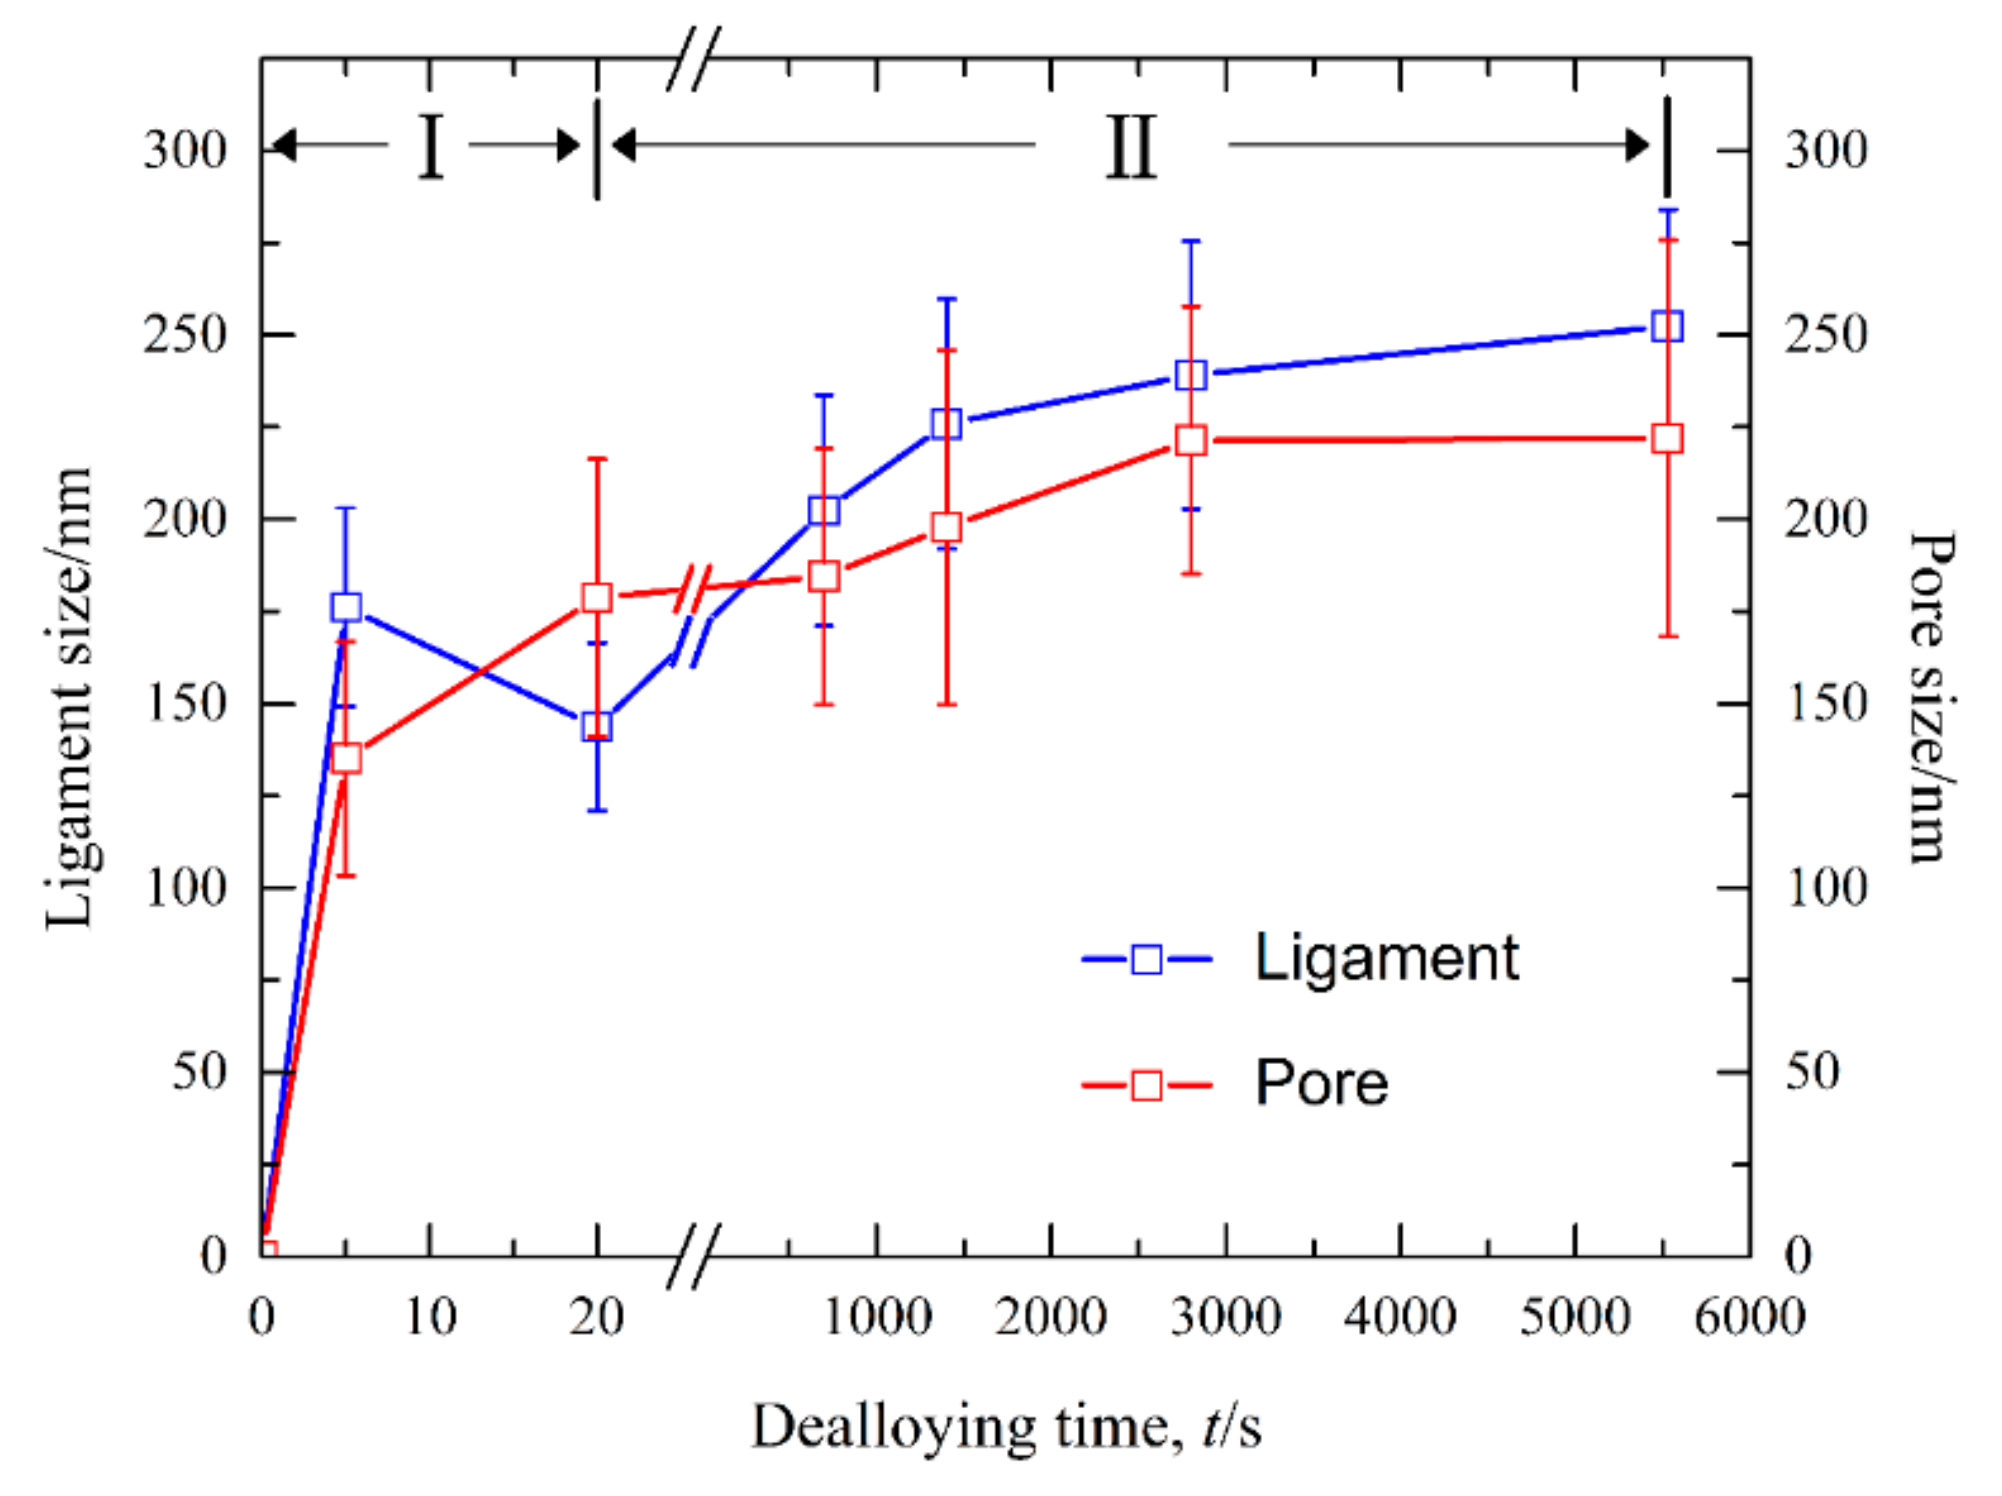
Figure 8 shows the current responses of Ag40Sn60 ribbons during potentiostatic dealloying at applied potential of 0, −50, and −100 mV in 1.2 M HCl solution. The curves were plotted on double logarithmic coordinates. The chronoamperometric curves show a typical dealloying process of dual-phase precursor alloys [27,37]. The current densities sharply fell from more than 400 mA cm−2 to about 5 mA cm−2 in the initial 20 s, which are consistent with the current densities at −0.1 V in Figure 4. It is considered that the selective dissolution of intermetallic phases in the subsequent periods went into a relatively steady stage. The higher the applied potential is, the higher the resulting current density in the steady stage is, indicating the higher the dissolution rates of Sn. In each case, the current densities quickly attenuated at the end of the response. It is noticed that the various trends of current response were consistent regardless of both the chemical compositions of the precursor alloys and applied potential, which suggest that an identical dealloying behavior for Ag–Sn alloys in this work is determined by the phase constitutions of ε-Ag3Sn and β-Sn phases in the matrix. It is worth noting that the transient curves of the dealloying currents for all Ag–Sn precursors are similar. On the basis of the transient characteristics of the dissolution currents of dual-phase Ag–Sn ribbons at different applied dealloying potential, the dealloying process is considered to divide into two stages: Stage I for the preferential dissolution of β-Sn phases at the beginning periods of about 20 s and Stage II for the continuous dissolution of ε-Ag3Sn phases to form the nanoporous silver. The potentiostatic dealloying of Ag40Sn60 ribbons at the potential of −50 mV was selected to investigate the dealloying behavior due to its suitable applied potential and dealloying duration. As shown in the insets of Figure 8, the Ag40Sn60 ribbon was bright silvery white and quickly became black after dealloying and gradually turned to silvery gray in Stage II. The micrograph of Ag40Sn60 ribbons before and after dealloying for different time is shown in Figure 9. Figure 9a–c shows the SEM images of Ag40Sn60 ribbon after potentiostatic dealloying at potential of −50 mV for 5 s. The top-view images in Figure 9a,b demonstrate that the nanoporous structure was partially formed on the surface of the ribbons instead of the whole surface. The cross-sectional image in Figure 9c further suggests bi-continuous nanoporous structure has not yet formed throughout the whole ribbons. After dealloying of 20 s, the uniform porous structure has formed in the surface. Meanwhile, the cross-sectional SEM images show that the porous structure has formed in the whole matrix, which is regarded to be resulted from the total dissolution of β-Sn phases in the matrix. Figure 10 shows the morphological evolution of nanoporous structures obtained by potentiostatic dealloying Ag40Sn60 ribbons at −50 mV for 700, 1400, and 2800 s in Stage II. The color change in the insets of Figure 8 also proved the change of the chemical composition of dealloyed ribbons. The EDX analysis has been performed on all as-dealloyed ribbons, and atomic ratio of Ag and Sn elements are summarized in Figure 11. The EDX analysis listed in Figure 11 determined the elemental composition of the ribbon after dealloying for 5 s were 63.37 at.% Ag and 36.63 at.% Sn, respectively. The XRD patterns of the series as-dealloyed ribbons are shown in Figure 12. The diffraction peaks corresponding to β-Sn phase in XRD pattern distinctly weakened after potentiostatic dealloying for 5 s. When the Ag40Sn60 ribbon was dealloyed for 20 s, as shown in Figure 9d–f, the uniform nanoporous structure was obtained across the whole section of the ribbons. The atomic percentage of Ag and Sn was confirmed to be close to 3:1 (specifically, 76.05 at.% for Ag atoms and 23.95 at.% for Sn atoms). Combined with the XRD pattern in Figure 12, it can be confirmed that the Ag–Sn ribbons were only composed of ε-Ag3Sn phases after dealloying of 20 s. The residual Sn in as-dealloyed ribbons decreased to 20.54 at.% after 700 s, 18.52 at.% after 1400 s and 7.39 at.% after 2800 s. As shown in Figure 12, with the dealloying process, the diffraction peaks corresponding to ε-Ag3Sn phase gradually weakened, while that corresponding to fcc Ag phase appeared and became gradually stronger. Additionally, the mean sizes of the ligaments and pores in as-dealloyed ribbons are summarized in Figure 13. The nanoporous structure obtained after dealloying for 5 s had a ligament size of 176 ± 27 nm and a pore size of 135 ± 32 nm, which is different from that obtained after dealloying for 20 s (ligament size was 144 ± 23 nm and pore size was 179 ± 38 nm). This change is due to the complete leaching out of the β-Sn phases. During the potentiostatic dealloying, the ligaments and pores increased in size to 202 ± 31 nm and 184 ± 35 nm after 700 s, 226 ± 34 nm and 198 ± 48 nm after 1400 s, 239 ± 36 nm and 221 ± 36 nm after 2800 s, and became as large as 252 ± 32 nm and 222 ± 54 nm. On the basis of above results, the dealloying of β-Sn solid solution and ε-Ag3Sn intermetallic are determined to be asynchronous in dual-phase Ag–Sn alloy. The sharp decrease in current responses mainly corresponds to the selective dissolution of the less noble β-Sn phases, and the steady stage is associated with the dealloying of the more noble ε-Ag3Sn phases.

4. Discussion

For the Ag–Sn alloy, the peak and plateau were observed on the potentiodynamic polarization curves in Figure 4. Similar polarization phenomenon has been reported in the previous researches [20,30]. Zhang [30] studied the polarization curves of Ag20Zn80 and Ag30Zn70 alloys in 5 wt.% HCl or 1 M NaCl solution and thought that two peaks and one plateau in curves may be correlated with the change of atomic ratios on alloy surface during potentiodynamic polarization process. Two plateaus and one peak were found in the polarization curve of amorphous Pd42.5Cu30Ni7.5P20 alloy in our former work, which were caused by the anodic dissolution or oxidation of Cu or Pd elements occurred at different potentials [20]. Obviously, the polarization behavior under anodic polarizations is closely related to the surface state of the electrodes. The polarization behavior of Ag–Sn alloys has been clarified by the phase evolution on alloy surface during potentiodynamic scanning process. When the potential was swept to −0.51 V, the β-Sn phase was forced to ionize as Sn2+ ions [38] and stripped of the outer surface into the electrolyte. The ε-Ag3Sn phases started to dissolve and transformed to fcc Ag phase as the potential was further swept to −0.46 V. It should be noted that the dissolution of β-Sn phase was dominant in the potential range of −0.46 V~−0.10 V due to low reaction rate of ε-Ag3Sn phases indicated by the polarization curves in Figure 4, although both phases dissolved. The decrease in current density from −0.24 V was attributed to the depletion of β-Sn phases on the outer surfaces of the precursor alloys based on the distribution profiles of β-Sn and ε-Ag3Sn phases in Figure 1 and Figure 2, the transient of the current densities during potentiostatic dealloying of Ag40Sn60 ribbon at applied potential of 0, −50, and −100 mV in 1.2 M HCl solution in Figure 8, the morphological change in Figure 9 and the change of phase distribution during dealloying from the XRD patterns in Figure 12. The occlusion by inert ε-Ag3Sn phases on surface prevented embedded β-Sn phases to dissolve. Additionally, the more inert Ag layer on ε-Ag3Sn surface prevented the dissolution of the latter. Because of the complete consumption of β-Sn phase on the outer surface, only ε-Ag3Sn phases were dissolved at lower rates, resulting in the current plateau at about 5~10 mA cm−2 in the potential range of −0.10 V~0.04 V corresponding to the anodic dissolution of ε-Ag3Sn phases. The increase in the current density at potential of higher than 0.04 V was caused by the anodic polarization of surface Ag-rich layer. The anodic dissolution of residual ε-Ag3Sn phase also took place in this potential region. The polarization behavior of Ag20Sn80 and Ag30Sn70 alloys can also be explained by the processes described above. Compared to the Ag40Sn60 alloy, the advantage of β-Sn phases in Ag20Sn80 and Ag30Sn70 alloys led to the higher peak current densities at about −0.24 V.
It is well established that the formation of nanoporous structure during dealloying involves the etching of the less noble metal by selective dissolution and the coarsening of the more noble metal by surface diffusion [9,11,18]. The results in Figure 5, Figure 6 and Figure 7 show that NPS can be obtained by potentiostatic dealloying of Ag–Sn alloys. According to the non-equilibrium solidification theory, primary ε-Ag3Sn phase first precipitated during rapid solidification of Ag20Sn80, Ag30Sn70, and Ag40Sn60 alloys, and then β-Sn/ε-Ag3Sn eutectic phase formed in the remaining liquids (Figure 1 and Figure 2). It should be noticed that the ε-Ag3Sn in the eutectic state is traced due to the very right eutectic point (96.2 at.% Sn) [33]. Therefore, the primary ε-Ag3Sn phase is considered to be surrounded by β-Sn phases. It has been confirmed that the dealloying of β-Sn and ε-Ag3Sn were asynchronous (Figure 9, Figure 10, Figure 11 and Figure 12). This asynchronous dealloying in dual-phase alloy is usually achieved with the greatest difference in electrochemical activities between coexisting phases [29,37]. As shown in Figure 3 and Figure 4, the electrochemical activity of β-Sn phases is much higher than that of ε-Ag3Sn. Thus, micro-coupling cells formed between β-Sn and ε-Ag3Sn phases in dual-phase precursor alloys in the free immersion conditions, in which β-Sn would act as an anode while ε-Ag3Sn would act as a cathode leading to a galvanic corrosion [10,29]. During the initial potentiostatic dealloying, β-Sn phases under the strong anodic polarized conditions were quickly excavated out of dual-phase Ag–Sn alloys due to its extremely high electrochemical activity. In Stage II, ε-Ag3Sn phases were conserved into as-dealloyed ribbons to form nanoporous Ag3Sn (NP-Ag3Sn) in the intermediate periods as shown in Figure 9d–f. The current densities at −50 mV in Table 1 and Figure 4 and dealloying currents in Figure 8 were very similar, which supports the division of the asynchronous dissolution of β-Sn phases in Stage I and ε-Ag3Sn phases in Stage II. The preferential dealloying phenomenon of the less noble phase in alloys were also found in dual-phase Mg84.5Cu15.5 precursors consisting of α-Mg and Mg2Cu phases and Al85Cu15 alloys with coexistence of both α-Al and Al2Cu phases in previous research [29]. With increasing dealloying time, ε-Ag3Sn phases in NP-Ag3Sn ribbons were further etched and gradually formed the NPS with uniform porous structure, as shown in Figure 10.
The increase of nanostructures in size with time in Figure 13 shows a coarsening trend of nanoporous ligaments during the evolution from NP-Ag3Sn to NPS. In the dealloying of the Au–Ag system, Erlebacher [18] predicted that the characteristic length scales (d) of nanoporous gold (NPG) is the function of the surface diffusivity (Ds) of Au atoms:
d ( D s / V 0 ) μ
where V0 is the velocity of a flat alloy surface with no gold accumulated on it and μ is a constant. Qian and Chen [14] proposed the following relationship to predict the coarsening mechanism of nanoporous ligaments in dealloying:
d ( t ) n   =   KtD s
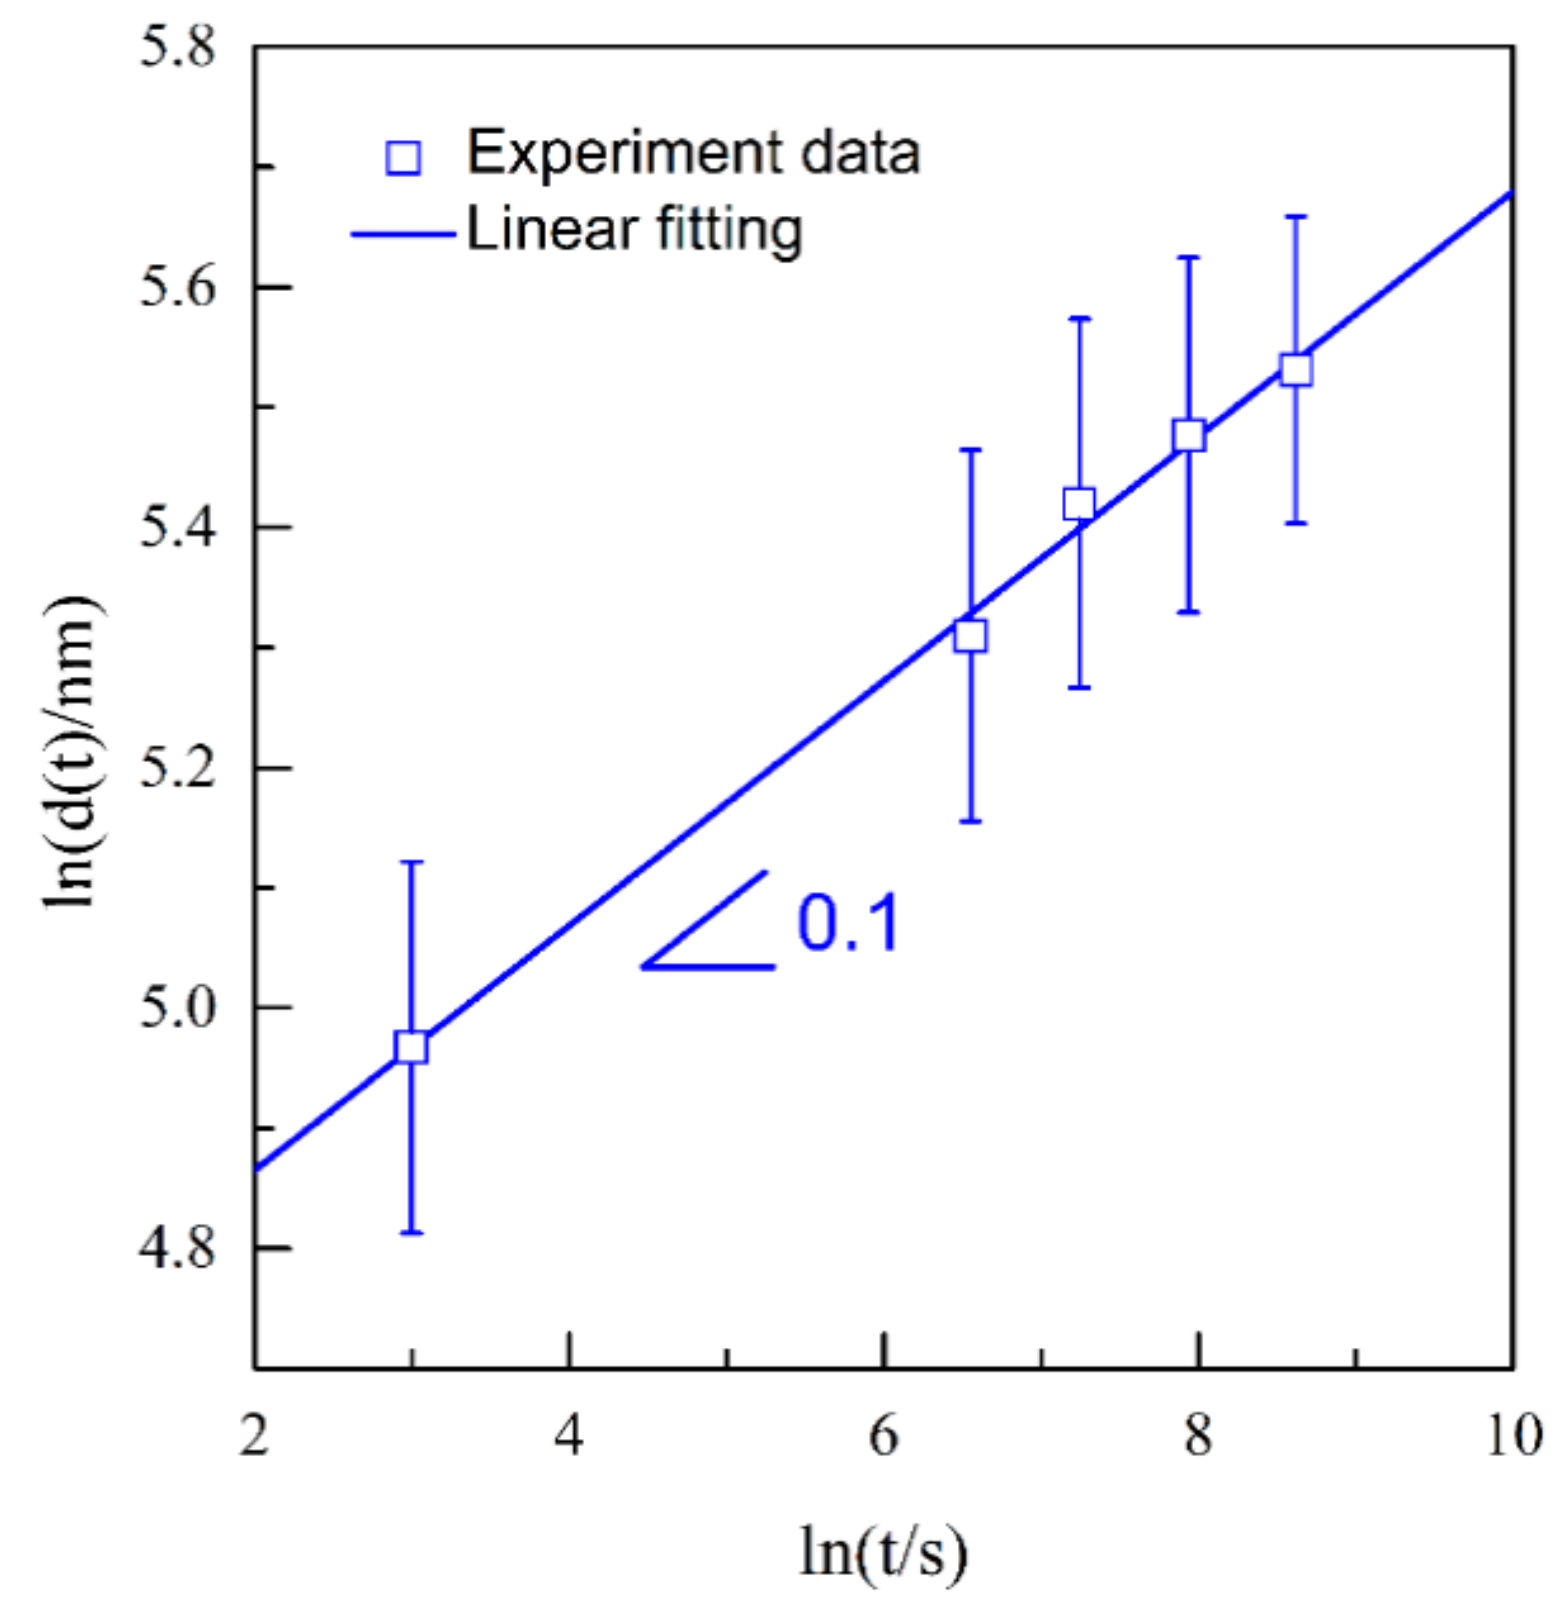
where Ds is the surface diffusivity of the nobler metal atoms, K is a constant, t is the dealloying time, d(t) is the ligament size at the dealloying time t, and n is the coarsening exponent. The coarsening exponent n can be directly measured by plotting ln[d(t)] vs. lnt, as shown in Figure 14. The result shows a dependency of ligament size on dealloying time as:
d ( t )     t 0 . 1
Thus, the n value for the coarsening of NPS is determined to be 0.1. The excellent linear relation between ln[d(t)] and lnt further verified the logarithmic coarsening mechanism of NPS. These facts indicate that the formation of the NPS is controlled by the surface diffusion of Ag adatoms. In the dealloying process of NP-Ag3Sn, the surface diffusion of Ag adatoms on ligaments are beneficial for the Sn atoms to be exposed to the electrolyte and then to be dissolved, leading to the coarsening of the existing ligaments. The coarsening exponent, 0.1, smaller than the theoretical value of 0.25, is considered to be due to the high electrochemical stability of ε-Ag3Sn phases as indicated in Figure 4. Based on the surface diffusion-controlled coarsening mechanism, the surface diffusivity (Ds) of Ag adatoms along alloy/electrolyte interfaces can be estimated by the equation [11,14,30,34]:
D s   =   d ( t ) 4 kT 32 γ t α 4
where k is the Boltzmann constant (1.3806 × 10⁻²³ J K−1), T is the absolute temperature (298 K), γ is the surface energy (1.302 J m−2) [39], and α is the lattice parameter of Ag (4.09 × 10⁻¹⁰ m). The calculated Ds values with different alloy compositions and applied potentials are listed in Table 2. The present Ds values of Ag adatoms are calculated to be 1.2 × 10⁻¹² to 1.6 × 10⁻¹⁰ cm2 s−1, which are comparable the values (3.3 × 10⁻¹² to 9.9 × 10⁻¹¹ cm2 s−1) of Ag adatoms reported by Zhang [30] and are about 3 to 5 orders of magnitude greater than the value (2.0 × 10⁻¹⁵ cm2 s−1) of Au adatoms reported by Qian and Chen [14]. For the same alloys, the surface diffusivity of Ag adatoms increases with increasing applied potential from −100 mV to 0 mV. These results are in agreement with previous reports [30,34]. The influence of applied potential on the surface diffusivity of adatoms at the alloy/electrolyte interfaces has been explained as the consequence of an accumulation of charges on the electrode surface, which modifies the enthalpy of formation of surface moving entities and the formation of adsorbed bonds between neighboring sites due to electron transfer reactions [40,41]. Apart from the influence of applied potential, the adsorption of Cl ions can effectively accelerate the surface diffusion of the Ag adatoms during electrochemical dealloying in this work [28,31]. The high surface diffusivity of Ag adatoms eventually resulted in the formation of uniform NPS with unimodal porosity distributions during the electrochemical dealloying of NP-Ag3Sn ribbon. This is a great disparate with the NPG with bimodal pore distributions prepared by chemical dealloying Al–Au alloys, in which the excavation of the α-Al phases out of the alloy forms the large-sized pores and the dealloying of the Al2Au phase results in the small-sized pores on the walls of the large-sized ligaments [19]. If the dealloying parameters, such as dealloying potential, concentration of the dealloying solutions, and the introduction of the inhibitor agents for the surface diffusions are well adjusted, the bi-modal or ultrafine nanoporous silver can be achieved in future.

5. Conclusions

Nanoporous silver with a bi-continuous nanoporous structure were successfully fabricated through potentiostatic dealloying of dual-phase AgxSn100−x (x = 20, 30, 40 at.%) alloys in 1.2 M HCl solution. Both open-circuit potentials and corrosion potentials of the dual-phase Ag–Sn alloys are mainly determined by the less noble β-Sn phase, rather than their chemical compositions. The open-circuit potential and corrosion potential of the β-Sn phase are lower than those of the ε-Ag3Sn phase by about 90 mV and 60 mV, respectively. The potentiodynamic polarization behavior of dual-phase Ag–Sn alloys are highly similar, independent of the chemical composition and volume fractions of two coexisting phases in the precursor alloys. The electrochemical dealloying of the β-Sn and ε-Ag3Sn phases is confirmed to be asynchronous. In the initial dealloying stages, the less noble β-Sn phases are preferentially etched due to high electrochemical activity and the galvanic corrosion. The subsequent dealloying of more noble ε-Ag3Sn phase is associated with the surface diffusion of Ag adatoms. Nanoporous ligaments become coarsened gradually with a time dependence of d(t) ∝ t0.1. The existing surface diffusivity of Ag adatoms are about 3 to 5 orders of magnitude greater than that of Au adatoms, which can be affected by the applied potential and halogen ions. This study not only develops a new alloy system for the preparation of NPS via potentiostatic dealloying, but also provides guidance for the design of dealloying process of similar alloy systems in the future.

Author Contributions

Conceptualization, Z.D. and F.Q.; methodology, Z.D. and Y.Y.; validation, Y.Y.; investigation, Z.D. and Y.Y.; writing—original draft preparation, Z.D. and Y.Y.; writing—review and editing, Z.D., Y.Y., Y.L. and Y.W.; supervision, H.C.; project administration, Z.D.; funding acquisition, Y.L. and Y.W.

Funding

This work is financially supported by the Natural Science Foundation of China (Grant No. 51671106), Natural Science Foundation of Jiangsu Province (Grants No. BK20171424), National Defense Basic Scientific Research Program of China (Grant No. JCKY08414C020), State Key Lab of Advanced Metals and Materials (Grants No. 2018-ZD04), and State Key Laboratory of Metal Material for Marine Equipment and Application (Grant No. HG-SKL(2018)06).

Acknowledgments

The authors would also like to acknowledge Jiangsu Collaborative Innovation Center for Advanced Inorganic Function Composites and Priority Academic Program Development of Jiangsu Higher Education Institution (PAPD).

Conflicts of Interest

The authors declare no conflict of interest.

References

  1. Bond, G.C.; Thompson, D.T. Catalysis by gold. Catal. Rev. Sci. Eng. 1999, 41, 319–388. [Google Scholar] [CrossRef]
  2. Weissmüller, J.; Viswanath, R.N.; Kramer, D.; Zimmer, P.; Wurschum, R.; Gleiter, H. Charge-induced reversible strain in a metal. Science 2003, 300, 312–315. [Google Scholar] [CrossRef]
  3. Ding, Y.; Chen, M.W.; Erlebacher, J. Metallic mesoporous nanocomposites for electrocatalysis. J. Am. Chem. Soc. 2004, 126, 6876–6877. [Google Scholar] [CrossRef] [PubMed]
  4. Joo, S.H.; Choi, S.J.; Oh, I.; Kwak, J.; Liu, Z.; Terasaki, O.; Ryoo, R. Ordered nanoporous arrays of carbon supporting high dispersions ofplatinum nanoparticles. Nature 2001, 412, 169–172. [Google Scholar] [CrossRef] [PubMed]
  5. Kramer, D.; Viswanath, R.N.; Weissmüller, J. Surface-stress induced macroscopic bending of nanoporous gold cantilevers. Nano Lett. 2004, 4, 793–796. [Google Scholar] [CrossRef]
  6. Ruffato, G.; Romanato, F.; Garoli, D.; Cattarin, S. Nanoporous gold plasmonic structures for sensing applications. Opt. Express 2011, 19, 13164–13170. [Google Scholar] [CrossRef] [PubMed]
  7. Kucheyev, S.O.; Hayes, J.R.; Biener, J.; Huser, T.; Talley, C.E.; Hamza, A.V. Surface-enhanced Raman scattering on nanoporous Au. Appl. Phys. Lett. 2006, 89, 053102. [Google Scholar] [CrossRef]
  8. Chen, L.Y.; Lang, X.Y.; Fujita, T.; Chen, M.W. Nanoporous gold for enzyme-free electrochemical glucose sensors. Scr. Mater. 2011, 65, 17–20. [Google Scholar] [CrossRef]
  9. Ji, H.; Wang, X.G.; Zhao, C.C.; Zhang, C.; Xu, J.L.; Zhang, Z.H. Formation, control and functionalization of nanoporous silver through changing dealloying media and elemental doping. CrystEngComm 2011, 13, 2617–2628. [Google Scholar] [CrossRef]
  10. Song, T.; Yan, M.; Shi, Z.; Atrens, A.; Qian, M. Creation of bimodal porous copper materials by an annealing-electrochemical dealloying approach. Electrochim. Acta 2015, 164, 288–296. [Google Scholar] [CrossRef]
  11. Dan, Z.H.; Qin, F.X.; Yamaura, S.; Xie, G.Q.; Makino, A.; Hara, N. Refinement of nanoporous copper by dealloying MgCuY amorphous alloys in sulfuric acids containing polyvinylpyrrolidone. J. Electrochem. Soc. 2014, 161, C120–C125. [Google Scholar] [CrossRef]
  12. Dan, Z.H.; Qin, F.X.; Hara, N. Polyvinylpyrrolidone macromolecules function as a diffusion barrier during dealloying. Mater. Chem. Phys. 2014, 146, 277–282. [Google Scholar] [CrossRef]
  13. Qin, F.X.; Dan, Z.H.; Hara, N.; Li, W.R.; Li, Y.D. Selective dissolution of an amorphous Mg65Cu25Y10 alloy in organic acids and dilute HCl solution. Mater. Chem. Phys. 2016, 179, 27–34. [Google Scholar] [CrossRef]
  14. Qian, L.H.; Chen, M.W. Ultrafine nanoporous gold by low-temperature dealloying and kinetics of nanopore formation. Appl. Phys. Lett. 2007, 91, 083105. [Google Scholar] [CrossRef]
  15. Qi, Z.; Weissmüller, J. Hierarchical nested-network nanostructure by dealloying. ACS Nano 2013, 7, 5948–5954. [Google Scholar] [CrossRef]
  16. Forty, A.J. Corrosion micromorphology of noble metal alloys and depletion gilding. Nature 1979, 282, 597–598. [Google Scholar] [CrossRef]
  17. Forty, A.J.; Durkin, P. A micromorphological study of the dissolution ofsilver-gold alloys in nitric acid. Philos. Mag. A 1980, 42, 295–318. [Google Scholar] [CrossRef]
  18. Erlebacher, J.; Aziz, M.J.; Karma, A.; Dimitrov, N.; Sieradzki, K. Evolution of nanoporosity in dealloying. Nature 2001, 410, 450–453. [Google Scholar] [CrossRef] [PubMed]
  19. Zhang, Z.H.; Wang, Y.; Qi, Z.; Lin, J.K.; Bian, X.F. Nanoporous gold ribbons with bimodal channel size distributions by chemical dealloying of Al-Au alloys. J. Phys. Chem. C 2009, 113, 1308–1314. [Google Scholar] [CrossRef]
  20. Dan, Z.H.; Qin, F.X.; Wada, T.; Yamaura, S.; Xie, G.Q.; Sugawara, Y.; Muto, I.; Makino, A.; Hara, N. Nanoporous palladium fabricated from an amorphous Pd42.5Cu30Ni7.5P20 precursor and its ethanol electro-oxidation performance. Electrochim. Acta 2013, 108, 512–519. [Google Scholar] [CrossRef]
  21. Dan, Z.H.; Qin, F.X.; Sugawara, Y.; Muto, I.; Hara, N. Bimodal nanoporous nickel prepared by dealloying Ni38Mn62 alloys. Intermetallics 2012, 31, 157–164. [Google Scholar] [CrossRef]
  22. Grillo, R.; Torrisi, V.; Ruffino, F. Nanoporous Au: An experimental study on the porosity of dealloyed AuAg Leafs. Superlattices Microst. 2016, 100, 780–791. [Google Scholar] [CrossRef]
  23. Ruffino, F.; Torrisi, V.; Grillo, R.; Cacciato, G.; Zimbone, M.; Piccitto, G.; Grimaldi, M.G. Nanoporous Au structures by dealloying Au/Ag thermal-or laser-dewetted bilayers on surfaces. Superlattices Microst. 2017, 103, 28–47. [Google Scholar] [CrossRef]
  24. Wang, D.; Schaaf, P. Nanoporous gold nanoparticles. J. Mater. Chem. 2012, 22, 5344–5348. [Google Scholar] [CrossRef]
  25. Keir, D.S.; Pryor, M.J. The dealloying of copper-manganese alloys. J. Electrochem. Soc. 1980, 127, 2138–2144. [Google Scholar] [CrossRef]
  26. Pugh, D.V.; Dursun, A.; Corcoran, S.G. Electrochemical and morphological characterization of Pt-Cu dealloying. J. Electrochem. Soc. 2005, 152, B455–B459. [Google Scholar] [CrossRef]
  27. Zhang, Q.; Zhang, Z.H. On the electrochemical dealloying of Al-based alloys in a NaCl aqueous solution. Phys. Chem. Chem. Phys. 2010, 12, 1453–1472. [Google Scholar] [CrossRef]
  28. Lin, Y.W.; Tai, C.C.; Sun, I.W. Electrochemical preparation of porous copper surfaces in zinc chloride-1-ethyl-3-methyl imidazolium chloride ionic liquid. J. Electrochem. Soc. 2007, 154, D316–D321. [Google Scholar] [CrossRef]
  29. Liu, W.B.; Zhang, S.C.; Li, N.; Zheng, J.W.; An, S.S.; Xing, Y.L. A general dealloying strategy to nanoporous intermetallics, nanoporous metals with bimodal, and unimodal pore size distributions. Corros. Sci. 2012, 58, 133–138. [Google Scholar] [CrossRef]
  30. Zhang, C.; Sun, J.Z.; Xu, J.L.; Wang, X.G.; Ji, H.; Zhao, C.C.; Zhang, Z.H. Formation and microstructure of nanoporous silver by dealloying rapidly solidified Zn-Ag alloys. Electrochim. Acta 2012, 63, 302–311. [Google Scholar] [CrossRef]
  31. Jin, Y.; Li, R.; Zhang, T. Formation of nanoporous silver by dealloying Ca-Ag metallic glassesin water. Intermetallics 2015, 67, 166–170. [Google Scholar] [CrossRef]
  32. Zhang, M.; Junior, A.M.J.; Pang, S.J.; Zhang, T.; Yavari, A.R. Fabrication of nanoporous silver with open pores. Scr. Mater. 2015, 100, 21–23. [Google Scholar] [CrossRef]
  33. Karakaya, I.; Thompson, W.T. The Ag-Sn (silver-tin) system. Bull. Alloy Phase Diagr. 1987, 8, 340–347. [Google Scholar] [CrossRef]
  34. Xu, J.L.; Wang, Y.; Zhang, Z.H. Potential and concentration dependent electrochemical dealloying of Al2Au in sodium chloride solutions. J. Phys. Chem. C 2012, 116, 5689–5699. [Google Scholar] [CrossRef]
  35. Sieradzki, K.; Corderman, R.R.; Shukla, K. Computer simulations of corrosion: Selective dissolution of binary alloys. Philos. Mag. A 1989, 59, 713–746. [Google Scholar] [CrossRef]
  36. Dixon, M.C.; Daniel, T.A.; Hieda, M.; Smilgies, D.M.; Chan, M.H.W.; Allara, D.L. Preparation, structure, and optical properties of nanoporous gold thin films. Langmuir 2007, 23, 2414–2422. [Google Scholar] [CrossRef]
  37. Zhao, C.C.; Wang, X.G.; Qi, Z.; Ji, H.; Zhang, Z.H. On the electrochemical dealloying of Mg-Cu alloys in a NaCl aqueous solution. Corros. Sci. 2010, 52, 3962–3972. [Google Scholar] [CrossRef]
  38. Straumanis, M.E.; Dutta, M. The divalency of tin ions formed during anodic dissolution and the behavior of the tin anode. Inorg. Chem. 1966, 5, 992–995. [Google Scholar] [CrossRef]
  39. Mezey, L.Z.; Giber, J. The surface free energies of solid chemical elements: Calculation from internal free enthalpies of atomization. Jpn. J. Appl. Phys. Part 1 1982, 21, 1569–1571. [Google Scholar] [CrossRef]
  40. Doña, J.M.; González-Velasco, J. The dependence of the surface diffusion coefficients of gold atoms on the potential: Its influence on reconstruction of metal lattices. Surf. Sci. 1992, 274, 205–214. [Google Scholar] [CrossRef]
  41. Doña, J.M.; González-Velasco, J. Mechanism of surface diffusion of gold adatoms in contact with an electrolytic solution. J. Phys. Chem. 1993, 97, 4714–4719. [Google Scholar] [CrossRef]
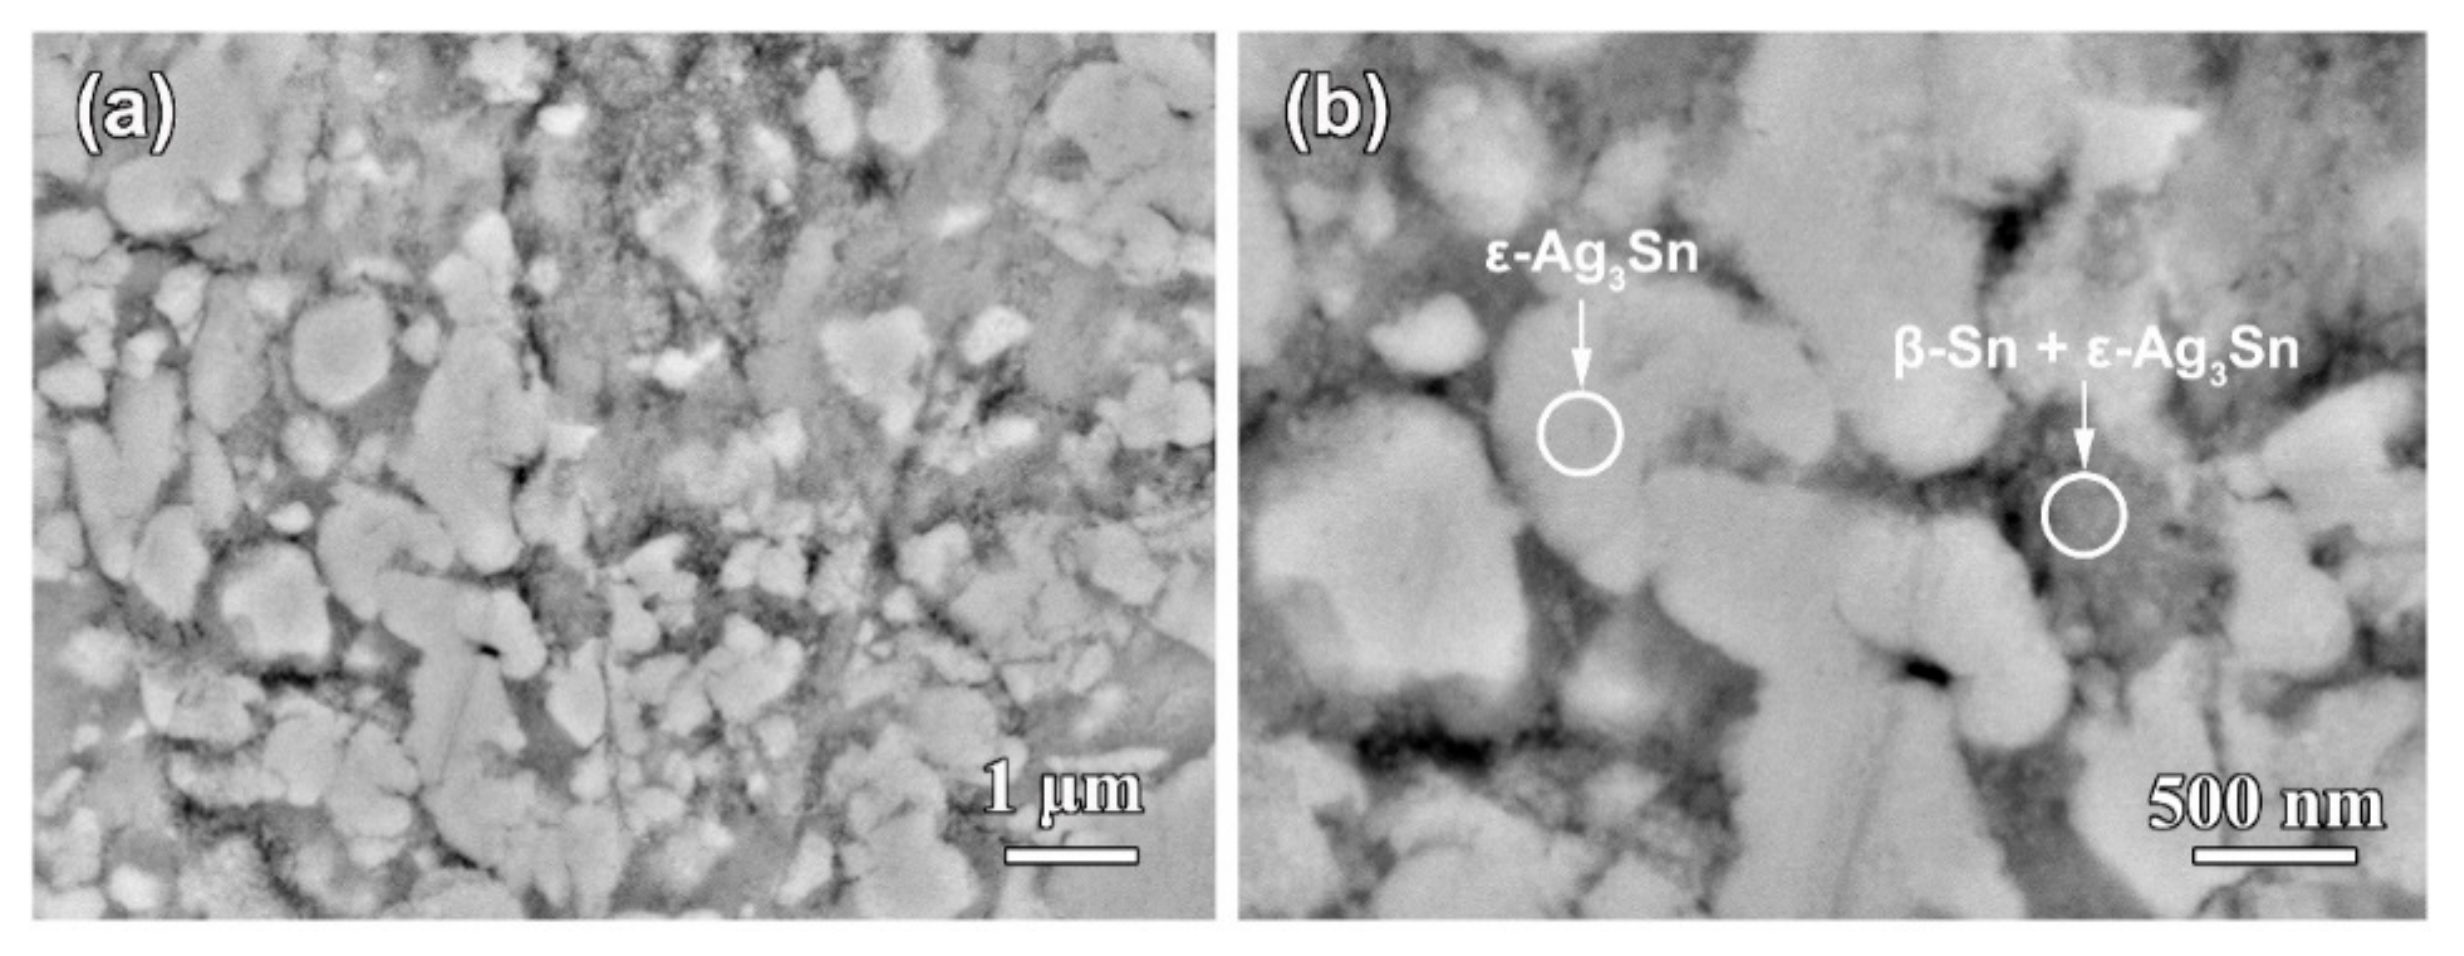
Figure 1. Low-magnified (a) and high-magnified (b) top-view backscattered electrons (BSE) images of Ag40Sn60 alloy ribbons.
Nanomaterials 09 00743 g001
Figure 2. XRD patterns of as-spun Ag20Sn80, Ag30Sn70, and Ag40Sn60 ribbons.
Nanomaterials 09 00743 g002
Figure 3. Open-circuit potential of single-phase β-Sn and Ag foils, ε-Ag3Sn intermetallic and dual-phase Ag20Sn80, Ag30Sn70, Ag40Sn60 ribbons in 1.2 M HCl solution.
Nanomaterials 09 00743 g003
Figure 4. Potentiodynamic polarization curves of dual-phase Ag20Sn80, Ag30Sn70, Ag40Sn60 ribbons and reference materials of single-phase β-Sn and Ag foils, ε-Ag3Sn intermetallic ribbons in 1.2 M HCl solution. Scan rate: 1 mV s−1.
Nanomaterials 09 00743 g004
Figure 5. The top-view (a,c,e) and cross-sectional (b,d,f) SEM images of Ag20Sn80 (a,b), Ag30Sn70 (c,d), and Ag40Sn60 (e,f) ribbons after dealloying at −50 mV in 1.2 M HCl solution.
Nanomaterials 09 00743 g005
Figure 6. Bright-field TEM image (a), high-resolution TEM image (b) of Ag40Sn60 ribbons after dealloying of 5529 s at −50 mV in 1.2 M HCl solution. Insets in (a,b) are selected area diffraction pattern and FFT pattern.
Nanomaterials 09 00743 g006
Figure 7. The top-view SEM images of Ag40Sn60 ribbons after dealloying at 0 mV (a), −25 mV (b), −75 mV (c), and −100 mV (d) in 1.2 M HCl solution. Insets in (ad) showing the cross-sectional SEM images of as-dealloyed ribbons.
Nanomaterials 09 00743 g007
Figure 8. Chronoamperometric curves of Ag40Sn60 alloy ribbons at 0 mV, −50 mV, and −100 mV in 1.2 M HCl solution. Insets show the optical photos of Ag40Sn60 ribbons before and after dealloying at −50 mV for different times in 1.2 M HCl solution.
Nanomaterials 09 00743 g008
Figure 9. The top-view (a,b,d,e) and cross-sectional (c,f) SEM images of Ag40Sn60 ribbons after dealloying at −50 mV for 5 s (ac) and 20 s (df) in 1.2 M HCl solution.
Nanomaterials 09 00743 g009
Figure 10. The top-view (a,c,e) and cross-sectional (b,d,f) SEM images of Ag40Sn60 ribbons after dealloying at −50 mV for 700 s (a,b), 1400 s (c,d), and 2800 s (e,f) in 1.2 M HCl solution.
Nanomaterials 09 00743 g010
Figure 11. The change of the atomic ratios of Ag and Sn elements after dealloying of Ag40Sn60 ribbons for different duration times at −50 mV in 1.2 M HCl solution.
Nanomaterials 09 00743 g011
Figure 12. XRD patterns of Ag40Sn60 ribbons after dealloying at −50 mV for different times in 1.2 M HCl solution.
Nanomaterials 09 00743 g012
Figure 13. Mean sizes of the nanopores and ligaments after dealloying of Ag40Sn60 ribbons at −50 mV in 1.2 M HCl solution.
Nanomaterials 09 00743 g013
Figure 14. Double logarithmic plot of ln(d(t)) vs. lnt of Ag40Sn60 ribbons after dealloying at −50 mV in 1.2 M HCl solution.
Nanomaterials 09 00743 g014
Table 1. Comparison of the open-circuit potentials (Eocp), corrosion potentials (Ecorr), and current densities (j−50mV) of Ag20Sn80, Ag30Sn70, and Ag40Sn60 alloys and Ag and Sn reference materials in 1.2 M HCl solution.
Alloys/MetalsOpen-Circuit Potential (Eocp, mV)Corrosion Potential (Ecorr, mV)Current Density at −50 mV (j−50mV, mA cm−2)
Ag−38−1110.0126
Ag3Sn−407−4563.43
Ag40Sn60−496−5137.34
Ag30Sn70−498−5189.91
Ag20Sn80−498−5155.00
Sn−500−513397
Table 2. Summary of dealloying duration, ligament/pore sizes, and surface diffusivity of Ag adatoms during the potentiostatic dealloying of Ag–Sn alloys ribbons at the applied potential in 1.2 M HCl solution.
AlloyApplied Potential, mVDealloying Duration, sLigament Size, nmPore Size, nmSurface Diffusivity/Ds, cm2 s−1
Ag20Sn80−504673182 ± 38301 ± 498.3 × 10⁻¹²
Ag30Sn70−504979213 ± 33249 ± 391.5 × 10⁻¹¹
Ag40Sn6001924306 ± 50295 ± 421.6 × 10⁻¹⁰
Ag40Sn60−253611278 ± 55250 ± 345.8 × 10⁻¹¹
Ag40Sn60−505529252 ± 32222 ± 542.6 × 10⁻¹¹
Ag40Sn60−7517,597210 ± 32190 ± 203.9 × 10⁻¹²
Ag40Sn60−10036745190 ± 29165 ± 391.2 × 10⁻¹²