Yttrium Residues in MWCNT Enable Assessment of MWCNT Removal during Wastewater Treatment


Abstract
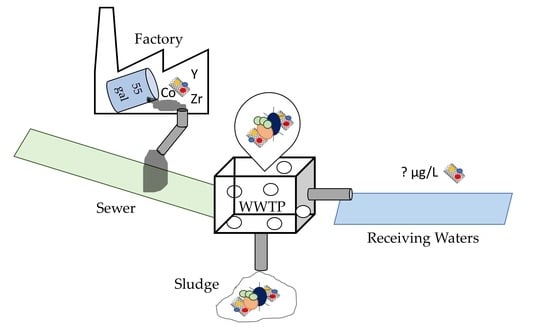
1. Introduction
2. Materials and Methods
2.1. Preparation of MWCNT Solutions
2.2. Return Activated Sludge (RAS) Stock Preparation
2.3. Quantification Techniques for MWCNTs
2.3.1. Light Scattering Detection and Programmed Thermal Analysis of MWCNTs
2.3.2. Microwave Digestion of MWCNTs
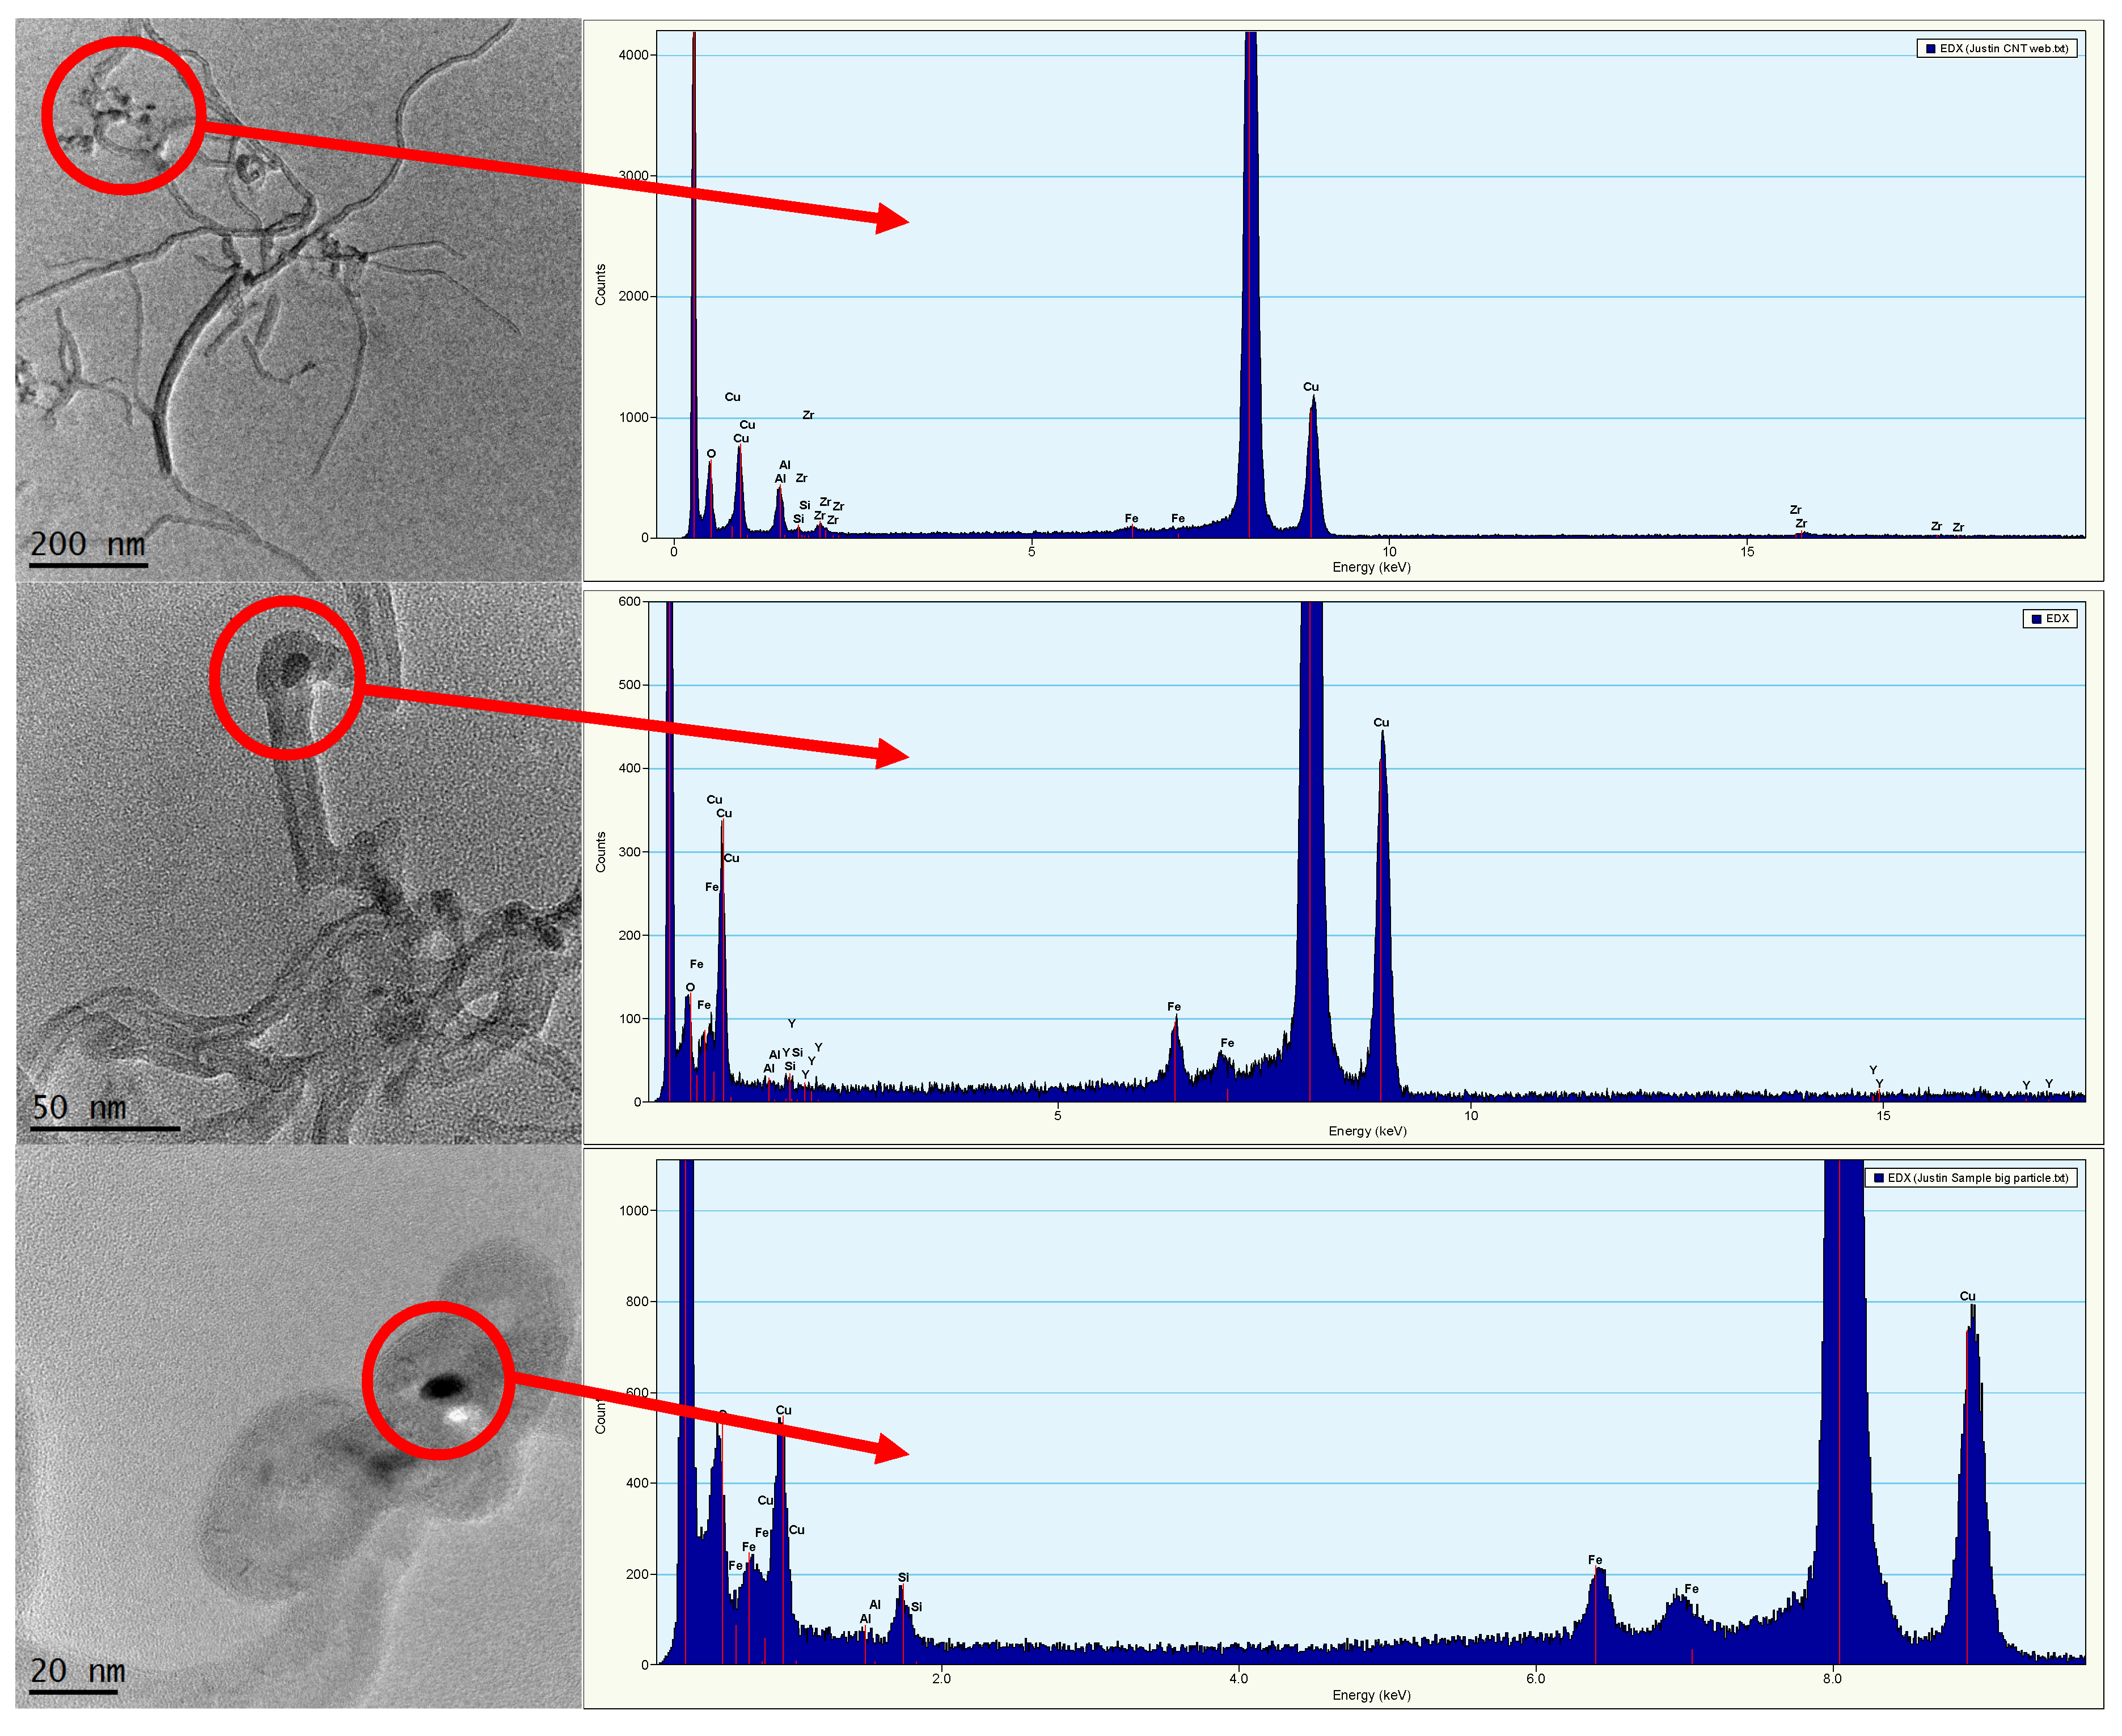
2.3.3. Dissolution Tests and TEM Imaging to Assess Residual Metal Association with MWCNTs
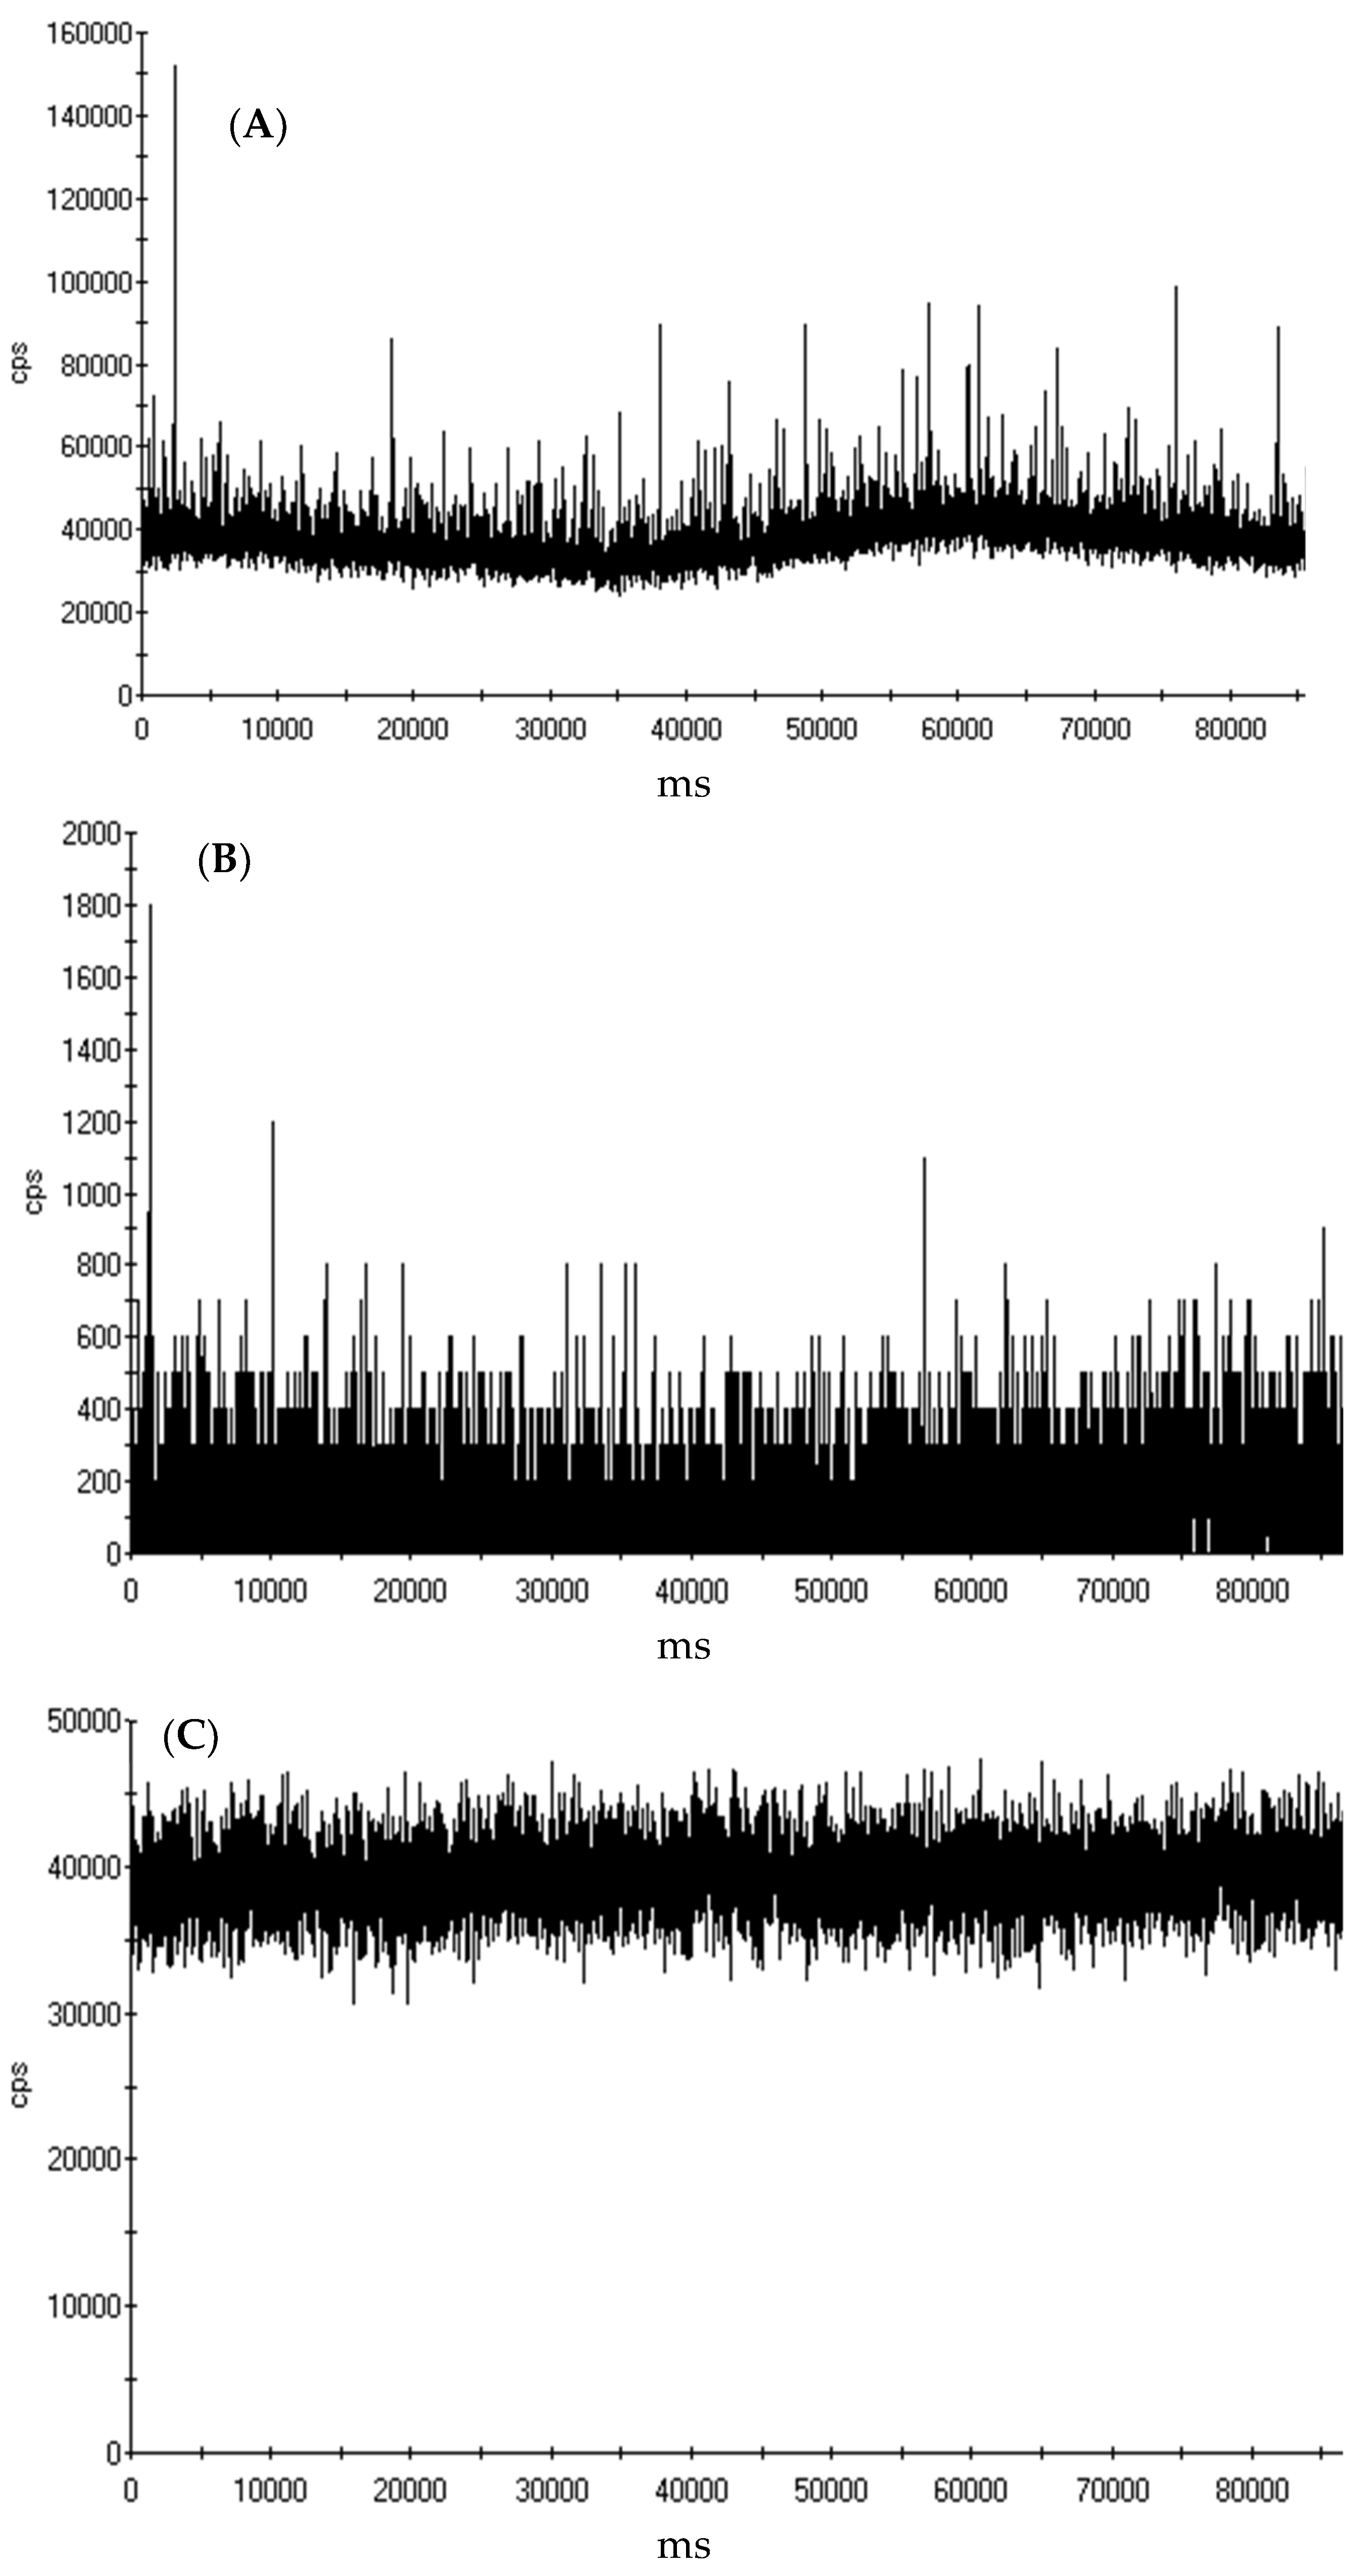
2.3.4. Single Particle ICP-MS and ICP-MS Analysis of Yttrium
2.4. MWCNT-RAS Batch Interaction Experiments
3. Results and Discussion
3.1. Characterization of MWCNTs and the Trace Metal Residuals Associated with MWCNTs
3.2. Association of Yttrium with MWCNTs
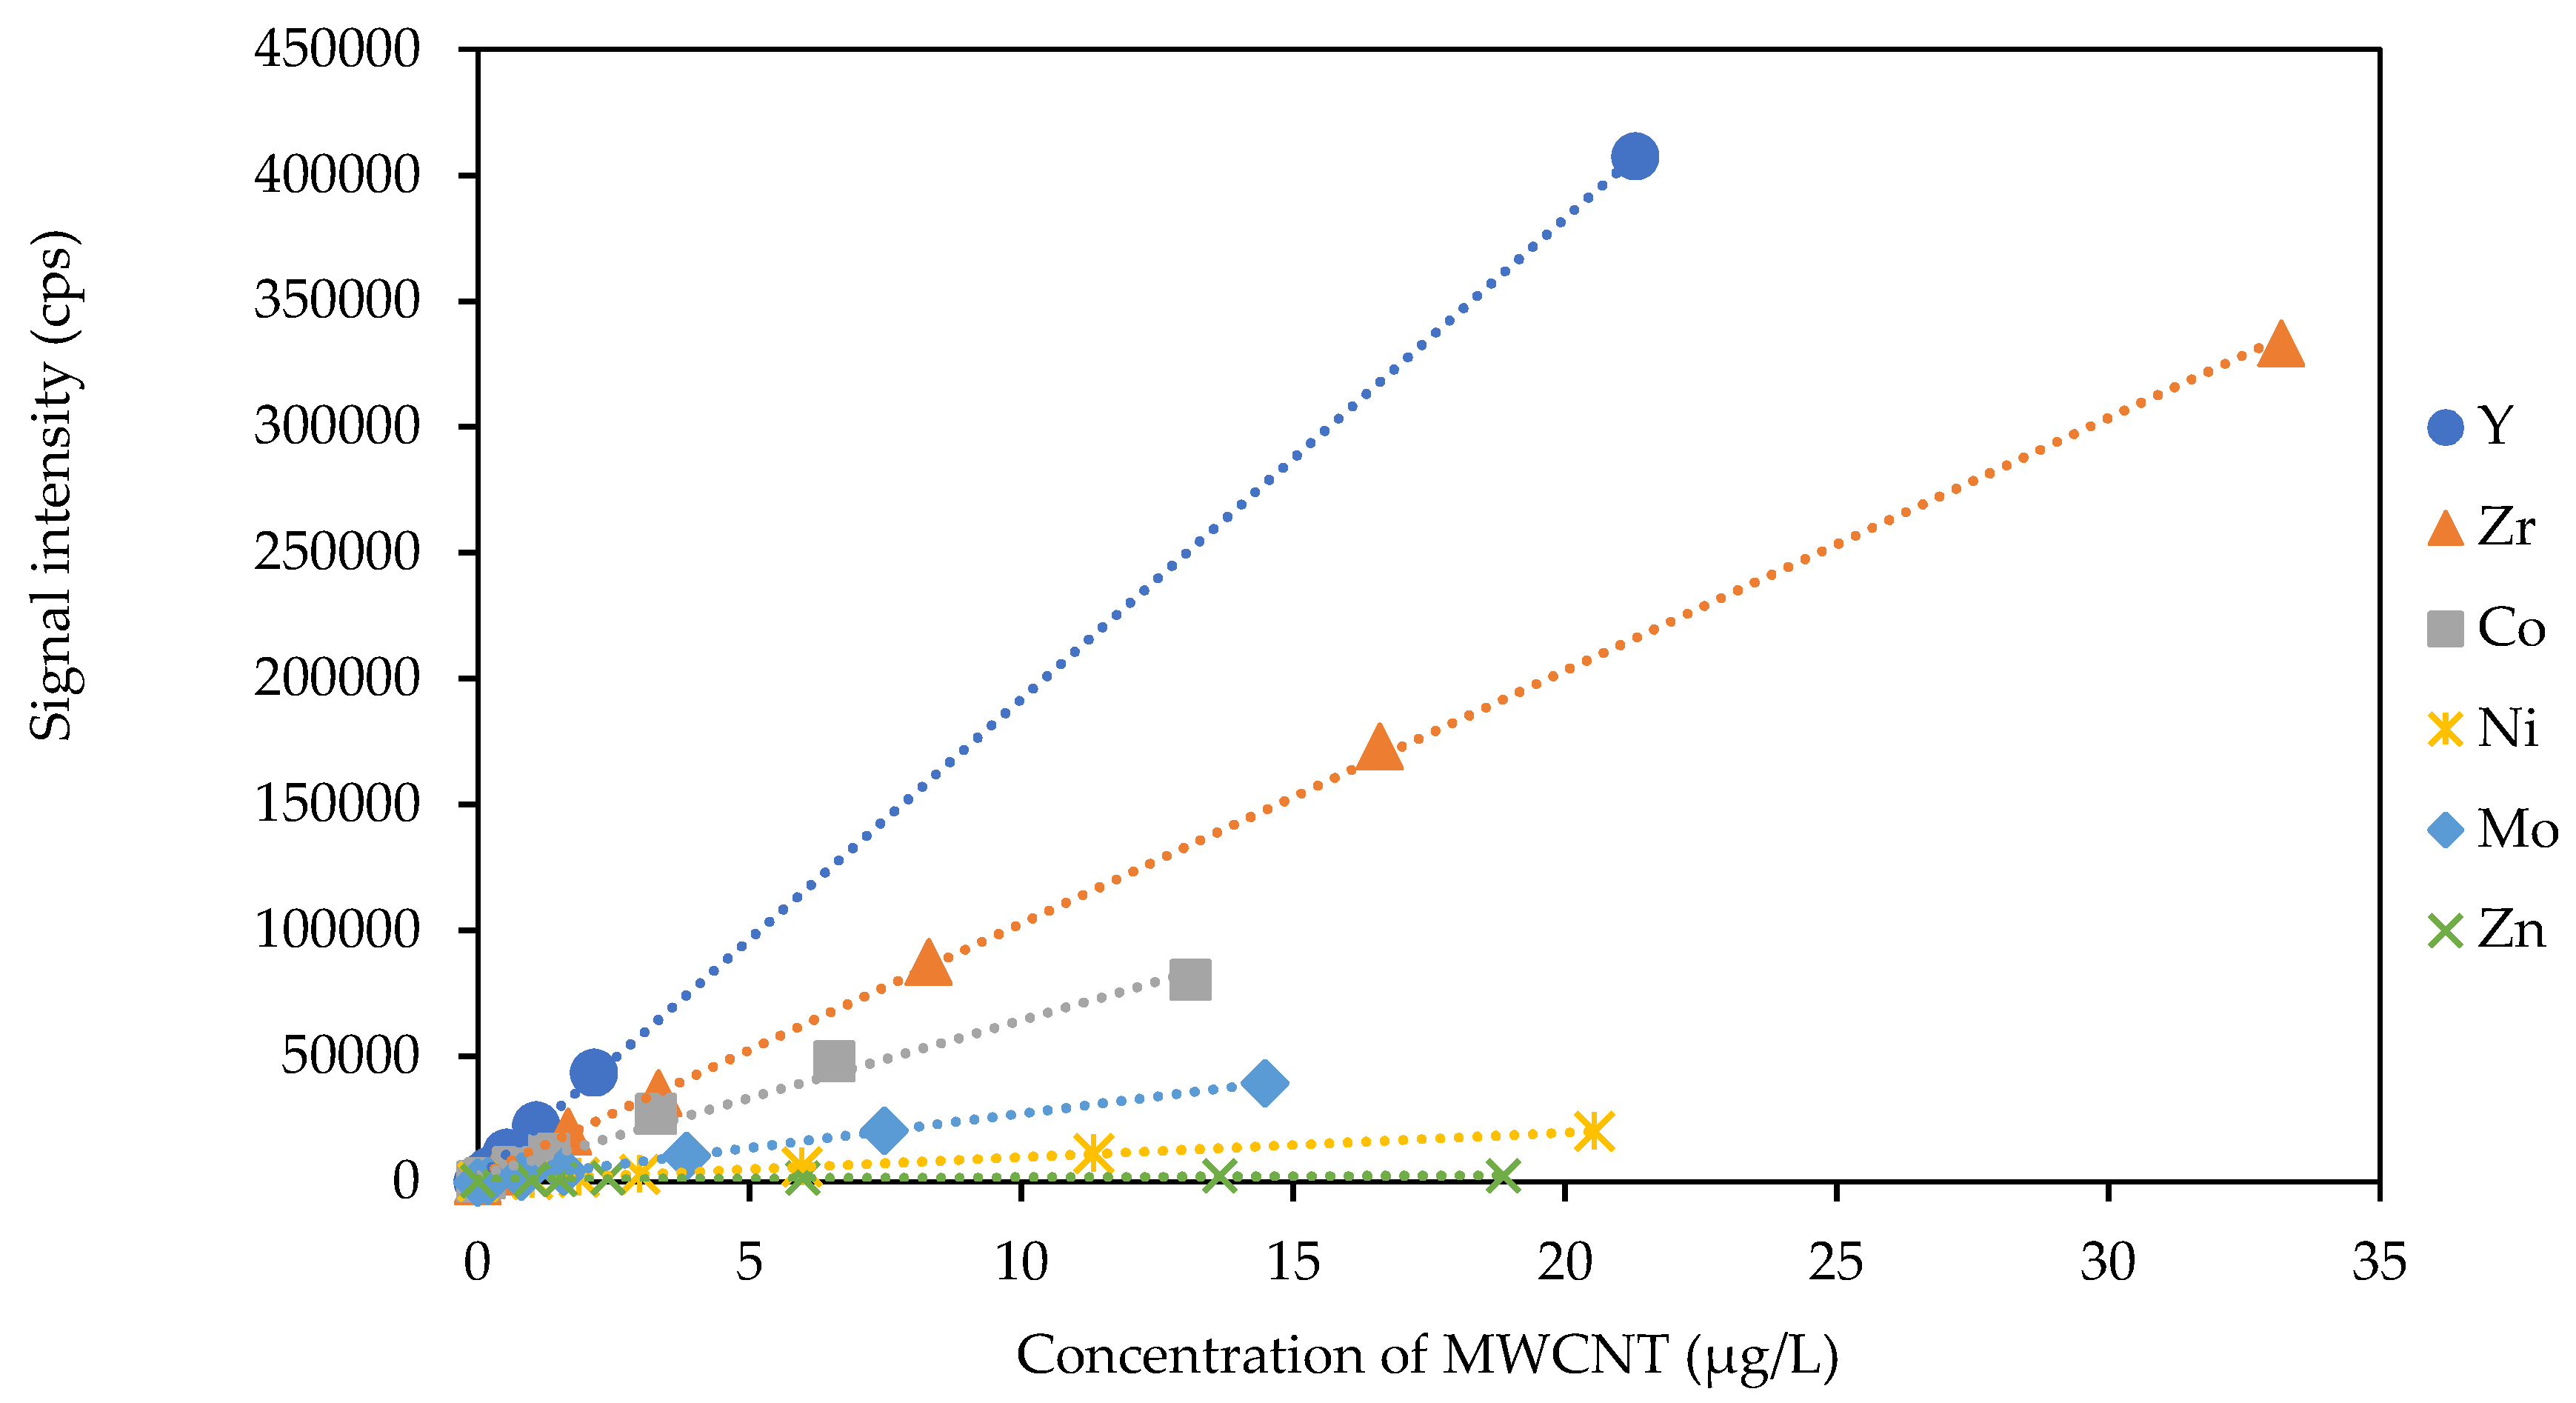
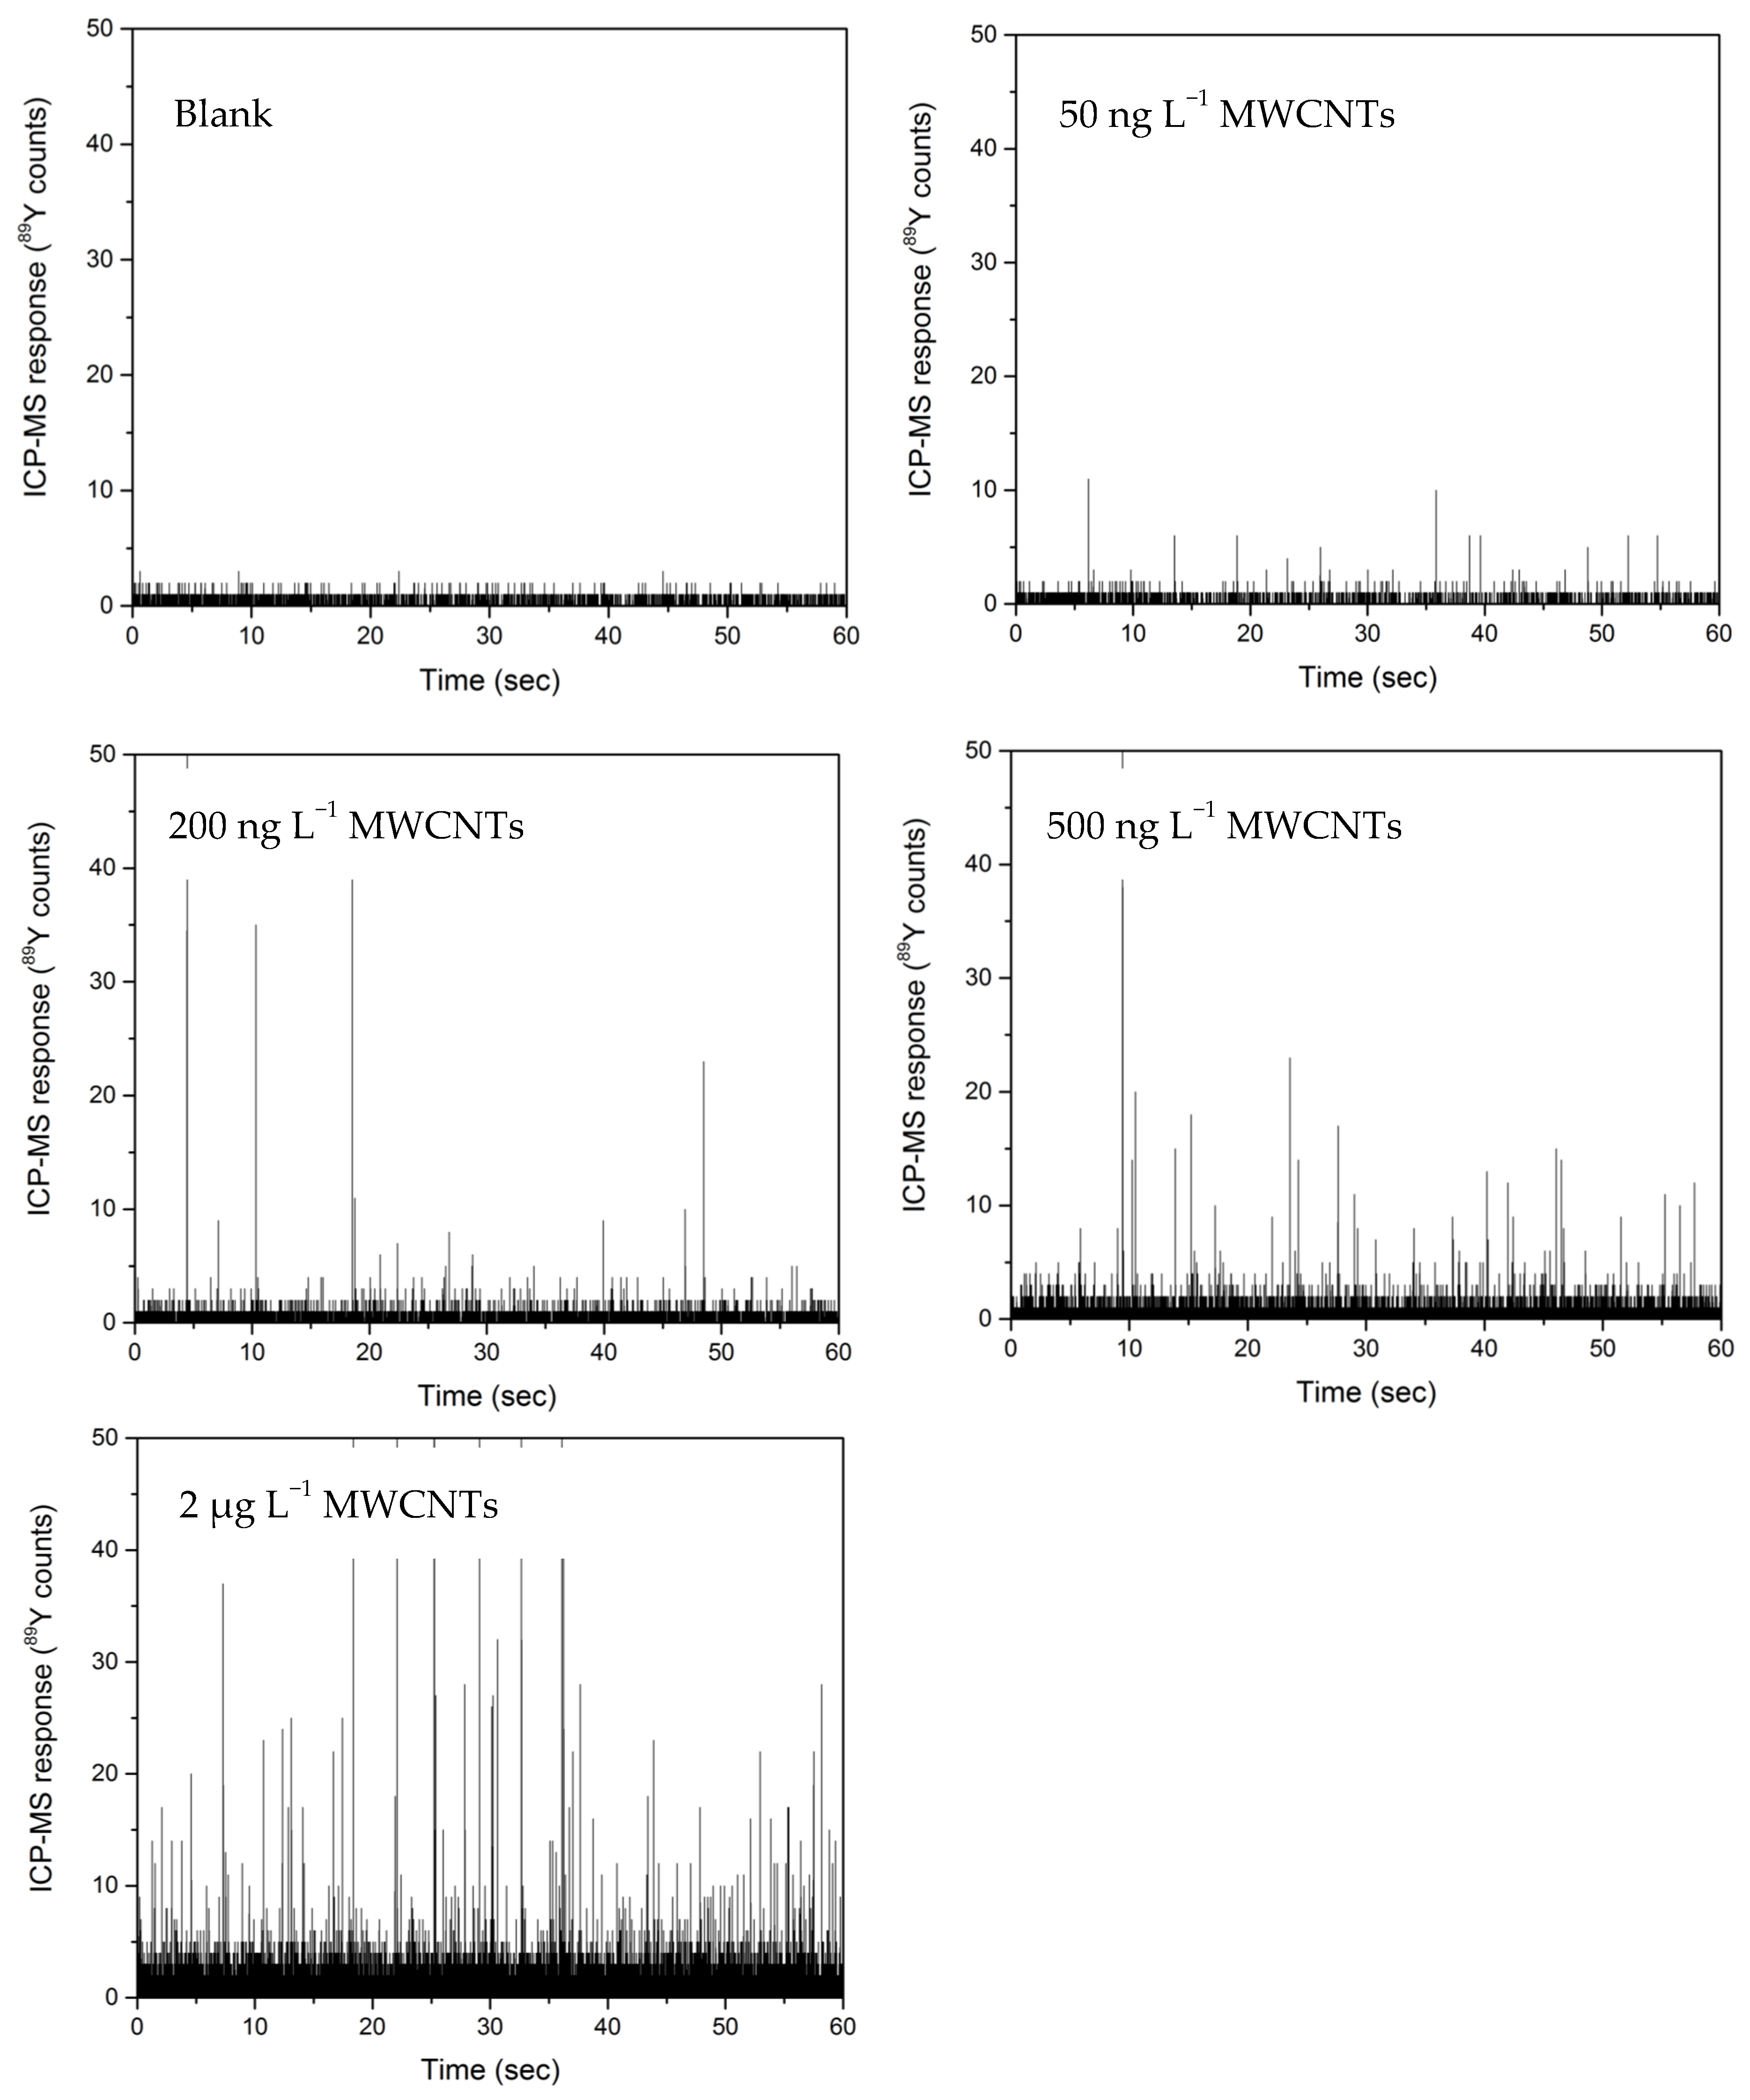
3.3. Quantification of Yttrium in MWCNT by spICP-MS and ICP-MS
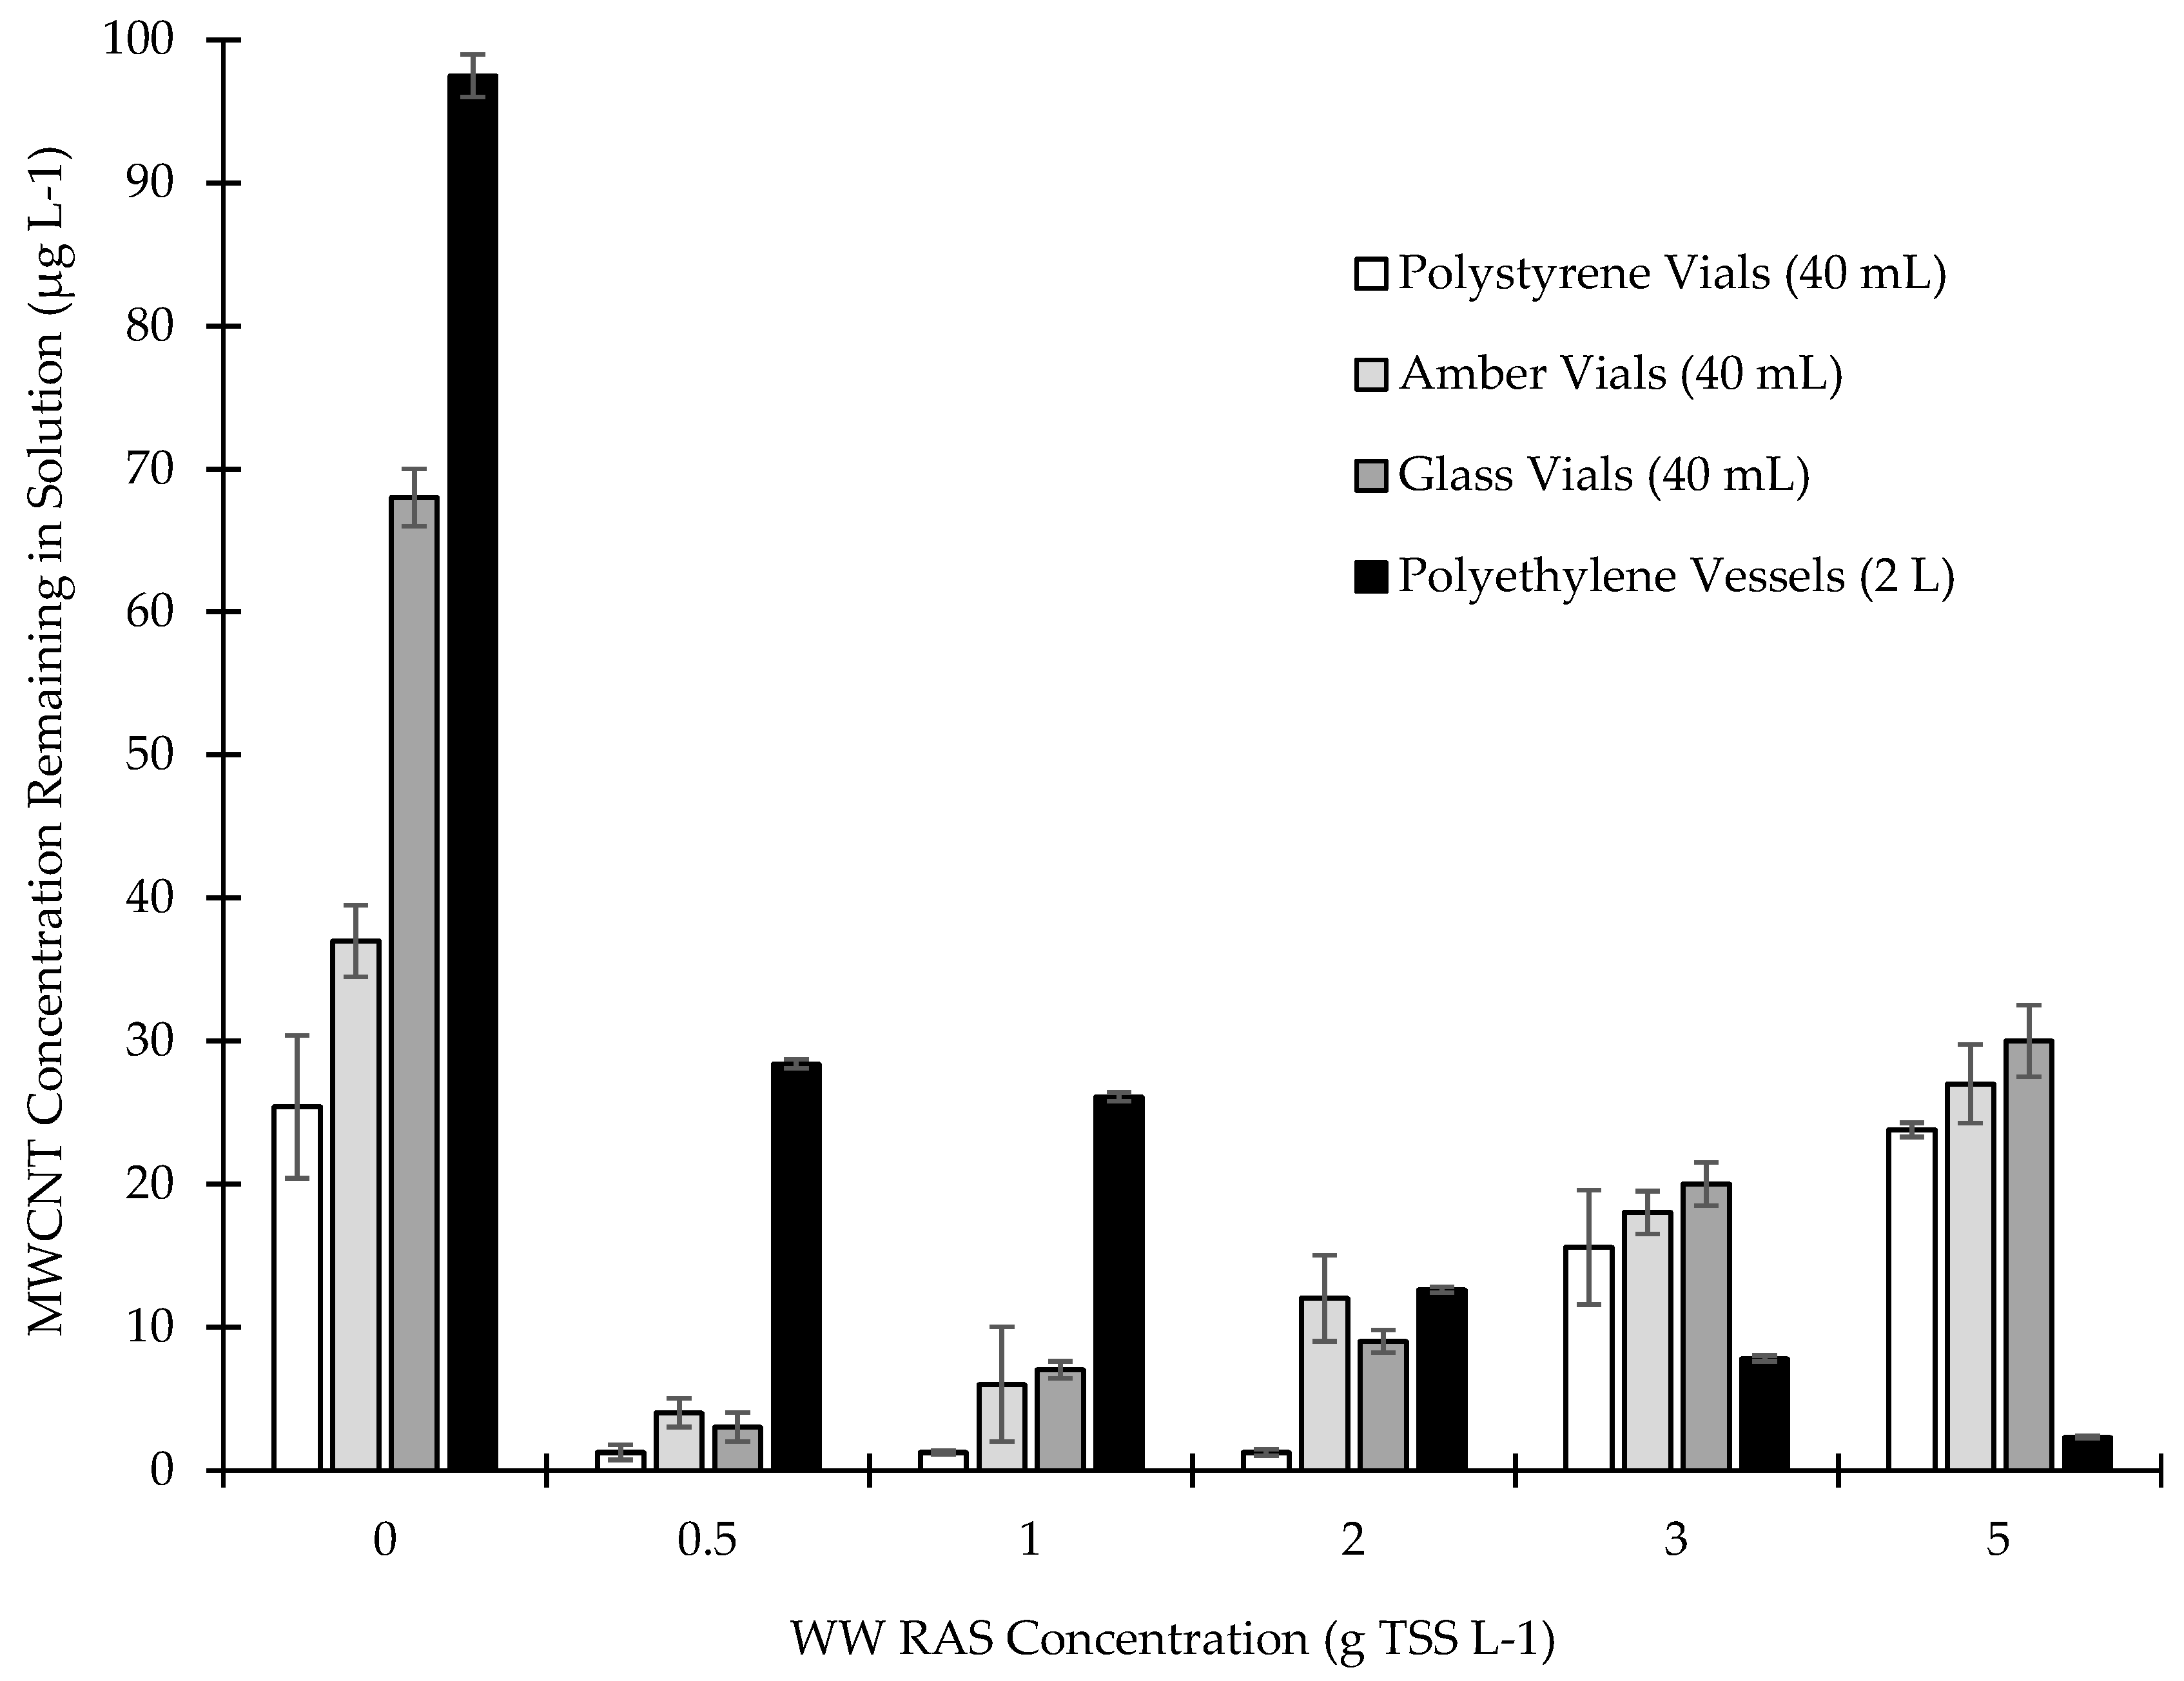
3.4. Removal Efficiency of MWCNTs by Return Activated Sludge
3.5. Implications of Using Yttrium as a Trace Residual Metal to Quantify MWCNT Removal by Wastewater Biomass
4. Conclusions
Supplementary Materials
Author Contributions
Funding
Conflicts of Interest
References
- Mohammadzadeh, F.; Jahanshahi, M.; Rashidi, A. Preparation of nanosensors based on organic functionalized MWCNT for H2S detection. Appl. Surf. Sci. 2012, 259, 159–165. [Google Scholar] [CrossRef]
- Dorraji, S.; Ahadzadeh, I.; Rasoulifard, M. Chitosan/polyaniline/ MWCNT nanocomposite fibers as an electrode material for electrical double layer capacitors. Int. J. Hydrog. Energy 2014, 39, 9350–9355. [Google Scholar] [CrossRef]
- Asmatulu, R.; Mahmud, G.A.; Hille, C.; Misak, H.E. Effects of UV degradation on surface hydrophobicity, crack, and thickness of MWCNT-based nanocomposite coatings. Prog. Org. Coat. 2011, 72, 553–561. [Google Scholar]
- Kuznetzov, A.A.; Lee, S.B.; Zhang, M.; Baughman, R.H.; Zakhidov, A. Electron field emission from transparent multiwalled carbon nanotube sheets for inverted field emission displays. Carbon 2010, 48, 41–46. [Google Scholar] [CrossRef]
- Mueller, N.; Nowack, B. Exposure modelling of engineered nanoparticles in the environment. Environ. Sci. Technol. 2008, 15, 4447–4453. [Google Scholar] [CrossRef]
- Gottschalk, F.; Sonderer, T.; Scholz, R.; Nowack, B. Modeled environmental concentrations of engineered nanomaterials (TiO2, ZnO, Ag, CNT, Fullerenes) for different regions. Environ. Sci. Technol. 2009, 43, 9216–9222. [Google Scholar] [CrossRef] [PubMed]
- Petersen, E.; Zhang, L.; Mattison, N.; O’Carroll, D.; Whelton, A.; Uddin, N.; Nguyen, T.; Huang, Q.; Henry, T.; Holbrook, D.; et al. Potential Release Pathways, Environmental Fate, and Ecological Risks of Carbon Nanotubes. Environ. Sci. Technol. 2011, 45, 9837–9856. [Google Scholar] [CrossRef]
- Garner, K.; Suh, S.; Lenihan, H.; Keller, A. Species sensitivity distributions for engineered nanomaterials. Environ. Sci. Technol. 2015, 49, 5753–5759. [Google Scholar] [CrossRef]
- Jackson, P.; Jacobsen, N.; Baun, A.; Birkedal, R.; Kuhnel, D.; Jensen, K.; Vogel, U.; Wallin, H. Biaccumulation and ecotoxicity of carbon nanotubes. Chem. Cent. J. 2013, 7, 154–175. [Google Scholar] [CrossRef]
- Kiser, M.A.; Ladner, D.A.; Hristovski, K.D.; Westerhoff, P. Nanomaterial transformation and association with fresh and freeze-dried wastewater activated sludge: Implications for testing protocol and environmental fate. Environ. Sci. Technol. 2012, 46, 7046. [Google Scholar] [CrossRef]
- Kiser, M.A.; Westerhoff, P.; Benn, T.; Wang, Y.; Pérez-Rivera, J.; Hristovski, K. Titanium nanomaterial removal and release from wastewater treatment plants. Environ. Sci. Technol. 2009, 43, 6757–6763. [Google Scholar] [CrossRef] [PubMed]
- Westerhoff, P.K.; Kiser, M.A.; Hristovski, K. Nanomaterial removal and transformation during biological wastewater treatment. Environ. Eng. Sci. 2013, 30, 109–117. [Google Scholar] [CrossRef]
- Yang, Y.; Yu, Z.; Nosaka, T.; Doudrick, K.; Hristovski, K.; Herckes, P.; Westerhoff, P. Interaction of carbonaceous nanomaterials with wastewater biomass. Front. Environ. Sci. Eng. 2015, 9, 823–831. [Google Scholar] [CrossRef]
- Petersen, E.; Cervantes, D.; Bucheli, T.; Elliott, L.; Fagan, J.; Gogos, A.; Hanna, S.; Mansfield, E.K.R.; Bustos, A.; Plata, D.; et al. Quantification of carbon nanotubes in environmental matrices: Current capabilities, cases studies and future prospects. Environ. Sci. Technol. 2016, 50, 4587–4605. [Google Scholar] [CrossRef]
- Wang, J.; Lankone, R.; Reed, R.; Fairbrother, H.; Ranville, J. Analysis of single-walled carbon nanotubes using spICP-MS with microsecond dwell time. NanoImpact 2016, 1, 65–72. [Google Scholar] [CrossRef]
- Rasmussen, P.E.; Avramescu, M.; Jawawardene, I.; Gardner, D. Detection of Carbon Nanotubes in Indoor Workplaces Using Elemental Impurities. Environ. Sci. Technol. 2015, 49, 12888–12896. [Google Scholar] [CrossRef]
- Lim, J.H.; Bairi, V.G.; Fong, A. Quantification of impurities in carbon nanotubes: Development of ICP-MS sample preparation methods. Mater. Chem. Phys. 2017, 198, 324–330. [Google Scholar] [CrossRef]
- Goodwin, D.G.; Adeleye, A.; Sung, L.; Ho, K.; Burgess, R.; Petersen, E. Detection and Quantification of Graphene-Family Nanomaterials in the Environment. Environ. Sci. Technol. 2018, 52, 4491–4513. [Google Scholar] [CrossRef]
- Avramescu, M.L.; Rasmussen, P.E.; Chenier, M. Determination of Metal Impurities in Carbon Nanotubes Sampled Using Surface Wipes. J. Anal. Methods Chem. 2016, 2016, 3834292. [Google Scholar] [CrossRef]
- Wohlleben, W.; Kingston, C.; Carter, J.; Sahle-emessie, E.; Vazquez-Campos, S.; Acrey, B.; Chen, C.; Walton, E.; Egenolf, H.; Muller, P.; et al. NanoRelease: Pilot interlaboratory comparison of a weathering protocol applied to resilient and labile polymers with and without embedded carbon nanotubes. Carbon 2017, 113, 346–360. [Google Scholar] [CrossRef] [PubMed]
- Tromp, P.C.; Kuijpers, E.; Bekker, C.; Godderis, L.; Lan, Q.; Jedynska, A.D.; Vermeulen, R.; Pronk, A. A New Approach Combining Analytical Methods for Workplace Exposure Assessment of Inhalable Multi-Walled Carbon Nanotubes. Ann. Work Expo. Health 2017, 61, 759–772. [Google Scholar] [CrossRef]
- Kato, N.; Nagaya, T.; Matsui, Y.; Yoneda, M. Exposure assessment of carbon nanotubes at pilot factory focusing on quantitative determination of catalytic metals. J. Occup. Health 2017, 59, 521–528. [Google Scholar] [CrossRef]
- Reed, R.B.; Goodwin, D.G.; Marsh, K.L.; Capracotta, S.S.; Higgins, C.P.; Fairbrother, D.H.; Ranville, J.F. Detection of single walled carbon nanotubes by monitoring embedded metals. Environ. Sci. Process. Impacts 2013, 15, 204–213. [Google Scholar] [CrossRef] [PubMed]
- Montano, M.D.; Badiei, H.R.; Bazargan, S.; Ranville, J. Improvements in the detection and characterization of engineered nanoparticles using spICP-MS with microsecond dwell times. Environ. Sci. Nano 2014, 1, 338–346. [Google Scholar] [CrossRef]
- Kiser, M.A.; Ryu, H.; Jang, H.; Hristovski, K.; Westerhoff, P. Biosorption of nanoparticles to heterotrophic wastewater biomass. Water Res. 2010, 44, 4105–4114. [Google Scholar] [CrossRef]
- Doudrick, K.; Herckes, P.; Westerhoff, P. Detection of carbon nanotubes in environmental matrices using programmed thermal analysis. Environ. Sci. Technol. 2012, 46, 12246–12253. [Google Scholar] [CrossRef]
- Corredor, C.; Hou, W.; Klein, S.; Moghadam, B.; Goryll, M.; Doudrick, K.; Westerhoff, P.; Posner, J. Disruption of model cell membranes by carbon nanotubes. Carbon 2013, 60, 67. [Google Scholar] [CrossRef] [PubMed]
- Silva, R.M.; Doudrick, K.; Franzi, L.M.; TeeSy, C.; Anderson, D.S.; Wu, Z.; Pinkerton, K.E. Instillation versus inhalation of multiwalled carbon nanotubes: Exposure-related health effects, clearance, and the role of particle characteristics. ACS Nano 2014, 8, 8911–8931. [Google Scholar] [CrossRef] [PubMed]
- Doudrick, K.; Nosaka, T.; Herckes, P.; Westerhoff, P. Quantification of graphene and graphene oxide in complex organic matrices. Environ. Sci. Nano 2015, 2, 60–67. [Google Scholar] [CrossRef]
- Ge, C.; Lao, F.; Li, W.; Li, Y.; Chen, C.; Qiu, Y.; Mao, X.; Li, B.; Chai, Z.; Zhao, Y. Quantitative Analysis of Metal Impurities in Carbon Nanotubes: Efficacy of Different Pretreatment Protocols for ICPMS Spectroscopy. Anal. Chem. 2008, 80, 9426–9434. [Google Scholar] [CrossRef]
- Lee, S.; Bi, X.; Reed, R.; Ranville, J.; Herckes, P.; Westerhoff, P. Nanoparticle size detection limits by single particle ICP-MS for 40 elements. Environ. Sci. Technol. 2014, 48, 10291–10300. [Google Scholar] [CrossRef]
- Bi, X.; Lee, S.; Ranville, J.F.; Sattigeri, P.; Spanias, A.; Herckes, P.; Westerhoff, P. Quantitative resolution of nanoparticle sizes using single particle inductively coupled plasma mass spectrometry with the K-means clustering algorithm. J. Anal. Spectrom. 2014, 29, 1630–1639. [Google Scholar] [CrossRef]
- Mitrano, D.M.; Ranville, J.F.; Bednar, A.; Kazor, K.; Hering, A.S.; Higgins, C.P. Tracking dissolution of silver nanoparticles at environmentally relevant concentrations in laboratory, natural, and processed waters using single particle ICP-MS (spICP-MS). Environ. Sci. Nano 2014, 1, 248–259. [Google Scholar] [CrossRef]
- Westerhoff, P.; Lee, S.; Yang, Y.; Gordon, G.; Hristovski, K.; Halden, R.; Herckes, P. Characterization, recovery opportunities, and valuation of metals in municipal sludges from US wastewater treatment plants nationwide. Environ. Sci. Technol. 2015, 49, 9479–9488. [Google Scholar] [CrossRef]
- Pace, H.; Rogers, N.; Jarolimek, C.; Coleman, V.; Higgins, C.; Ranville, J. Determining transport efficiency for the purpose of counting and sizing nanoparticles via single particle inductively coupled plasma mass spectrometry. Anal. Chem. 2011, 83, 9361–9369. [Google Scholar] [CrossRef] [PubMed]
- Bouchard, D.; Knightes, C.; Chang, X.; Avant, B. Simulating multiwalled carbon nanotube transport in surface water systems using the water quality analysis simulation program (wasp). Environ. Sci. Technol. 2017, 51, 11174–11184. [Google Scholar] [CrossRef]
- Gottschalk, F.; Nowack, B. The release of engineered nanomaterials to the environment. J. Environ. Monit. 2011, 13, 1145–1155. [Google Scholar] [CrossRef] [PubMed]
- Eatemadi, A.; Daraee, H.; Karimkhanloo, H.; Kouhi, M.; Zarghami, N.; Akbarzadeh, A.; Abasi, M.; Hanifehpour, Y.; Joo, S. Carbon nanotubes: Properties, synthesis, purification, and medical applications. Nanoscale Res. Lett. 2014, 9, 393–406. [Google Scholar]
- Kateb, B.; Yamamoto, V.; Alizadeh, D.; Zhang, L.; Manohara, H.; Bronikowski, M.; Badie, B. Multi-walled carbon nanotube (MWCNT) synthesis, preparation, labeling, and functionalization. Methods Mol. Biol. 2010, 651, 307–317. [Google Scholar]


| Metal | Concentration (μg gMWCNT−1) | * Sensitivity Regression Equation | * Sensitivity R2 Value |
|---|---|---|---|
| Fe | 9363 ± 578 | - | - |
| Y | 76.19 ± 5.93 | 19,000 X + 1100 | 0.99 |
| Zr | 1253 ± 75.31 | 10,000 X + 2400 | 0.99 |
| Co | 153.3 ± 6.47 | 6200 X + 2600 | 0.99 |
| Zn | 10.47 ± 5.32 | 91 X + 970 | 0.78 |
| Ni | 5.06 ± 0.41 | 970 X + 182 | 0.99 |
| Mo | 1.19 ± 0.07 | 270 X + 4 | 0.99 |
© 2019 by the authors. Licensee MDPI, Basel, Switzerland. This article is an open access article distributed under the terms and conditions of the Creative Commons Attribution (CC BY) license (http://creativecommons.org/licenses/by/4.0/).
Share and Cite
Kidd, J.; Bi, Y.; Hanigan, D.; Herckes, P.; Westerhoff, P. Yttrium Residues in MWCNT Enable Assessment of MWCNT Removal during Wastewater Treatment. Nanomaterials 2019, 9, 670. https://doi.org/10.3390/nano9050670
Kidd J, Bi Y, Hanigan D, Herckes P, Westerhoff P. Yttrium Residues in MWCNT Enable Assessment of MWCNT Removal during Wastewater Treatment. Nanomaterials. 2019; 9(5):670. https://doi.org/10.3390/nano9050670
Chicago/Turabian StyleKidd, Justin, Yuqiang Bi, David Hanigan, Pierre Herckes, and Paul Westerhoff. 2019. "Yttrium Residues in MWCNT Enable Assessment of MWCNT Removal during Wastewater Treatment" Nanomaterials 9, no. 5: 670. https://doi.org/10.3390/nano9050670
APA StyleKidd, J., Bi, Y., Hanigan, D., Herckes, P., & Westerhoff, P. (2019). Yttrium Residues in MWCNT Enable Assessment of MWCNT Removal during Wastewater Treatment. Nanomaterials, 9(5), 670. https://doi.org/10.3390/nano9050670