Article

Measurement of Radial Elasticity and Original Height of DNA Duplex Using Tapping-Mode Atomic Force Microscopy

1
College of Engineering, Northeast Agricultural University, Harbin 150030, China
2
State Key Laboratory of Robotics, Shenyang Institute of Automation, Chinese Academy of Sciences, Shenyang 110016, China
*
Authors to whom correspondence should be addressed.
Nanomaterials 2019, 9(4), 561; https://doi.org/10.3390/nano9040561
Submission received: 4 March 2019 / Revised: 28 March 2019 / Accepted: 30 March 2019 / Published: 6 April 2019

Abstract

:
Atomic force microscopy (AFM) can characterize nanomaterial elasticity. However, some one-dimensional nanomaterials, such as DNA, are too small to locate with an AFM tip because of thermal drift and the nonlinearity of piezoelectric actuators. In this study, we propose a novel approach to address the shortcomings of AFM and obtain the radial Young’s modulus of a DNA duplex. The elastic properties are evaluated by combining physical calculations and measured experimental results. The initial elasticity of the DNA is first assumed; based on tapping-mode scanning images and tip–sample interaction force simulations, the calculated elastic modulus is extracted. By minimizing the error between the assumed and experimental values, the extracted elasticity is assigned as the actual modulus for the material. Furthermore, tapping-mode image scanning avoids the necessity of locating the probe exactly on the target sample. In addition to elasticity measurements, the deformation caused by the tapping force from the AFM tip is compensated and the original height of the DNA is calculated. The results show that the radial compressive Young’s modulus of DNA is 125–150 MPa under a tapping force of 0.5–1.3 nN; its original height is 1.9 nm. This approach can be applied to the measurement of other nanomaterials.

1. Introduction

After the DNA origami technique was developed [1], DNA and assembled structures [2,3,4,5] have been suggested as connections for other nanostructures to construct high-order devices and systems [6,7] because they offer high yield and strong attachment to metals [8], semiconductors [9], and biomaterials [10,11]. To stabilize such systems and devices, understanding the elastic properties of DNA duplexes is necessary. Atomic force microscopy (AFM) [12], used to characterize the geometric [13] and mechanical properties of nanomaterials [14,15,16,17,18,19], was the primary tool used to measure the axial Young’s modulus of DNA via the force–distance curve method [20,21,22,23]. However, obtaining the radial Young’s modulus of such a one-dimensional (1D) nanomaterial was impeded by the difficulty of placing the probe exactly on such a small specimen, particularly considering thermal drift and the nonlinearity of the piezoelectric actuators used in AFM probe tips. Vibrating scanning polarization force microscopy (VSPFM) [24], invented by Hu et al., measures charged tip-induced dielectric polarization forces on sample surfaces; it has been used to measure the radial elasticity of λ-DNA. The compression elasticity of a single-strand DNA (ssDNA) chain varies with the tip–sample interaction force, which is ≈20–70 MPa under a tapping force of 0.4 nN. With increasing tapping force, the elastic modulus increases to more than 100 MPa. The VSPFM method is effective in air, but not in a liquid environment. Pang et al. [25] calculated the compressive Young’s modulus of ssDNA in the radial direction with the Hertz model by using the theoretical height of DNA (2 nm) and assuming that all cantilever bending energy was transferred to DNA deformation. However, some physical phenomena, such as thermal distortion and plastic deformation, consume some energy, inducing errors. Furthermore, this method is not applicable for nanowires of unknown original heights.
In this study, by simulating tip–sample interactions and measuring the experimental height of a DNA duplex, a new assumption–calculation method (ACM), which minimizes the error between the assumed and calculated Young’s moduli of DNA, is developed to characterize the radial Young’s modulus of DNA. Moreover, the original height of a DNA duplex was calculated by compensating for the indentation caused by the tapping force from the AFM probe tip.

2. Materials and Methods

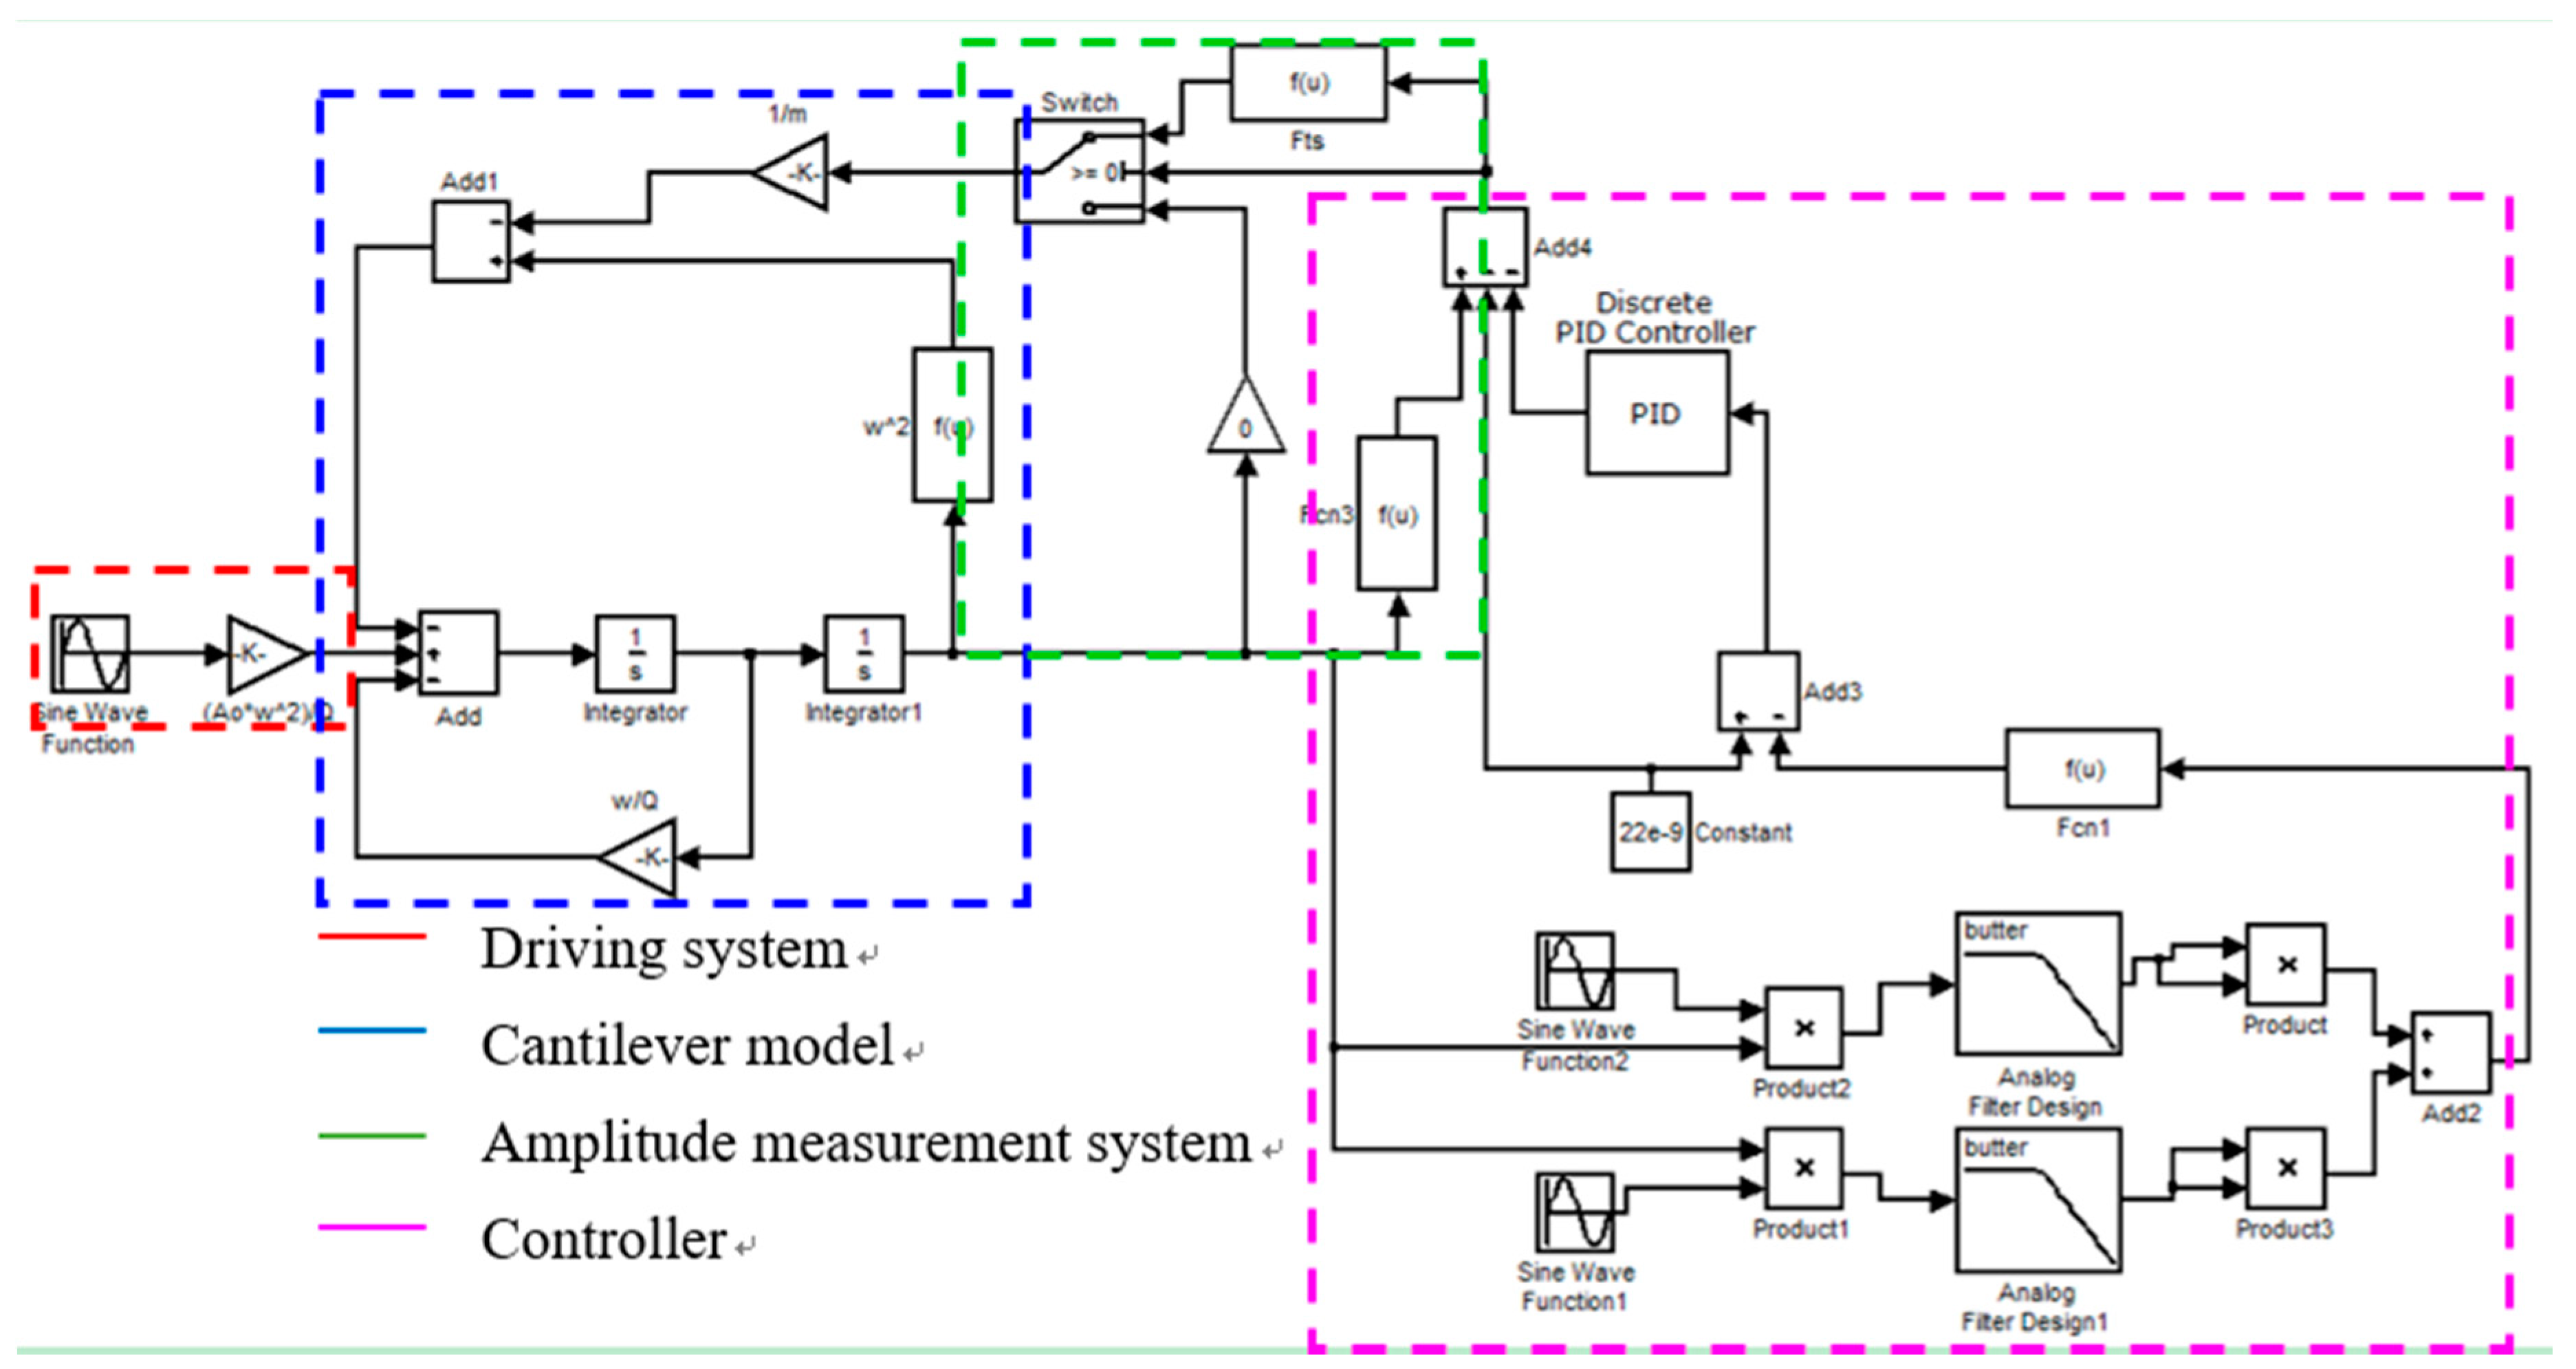
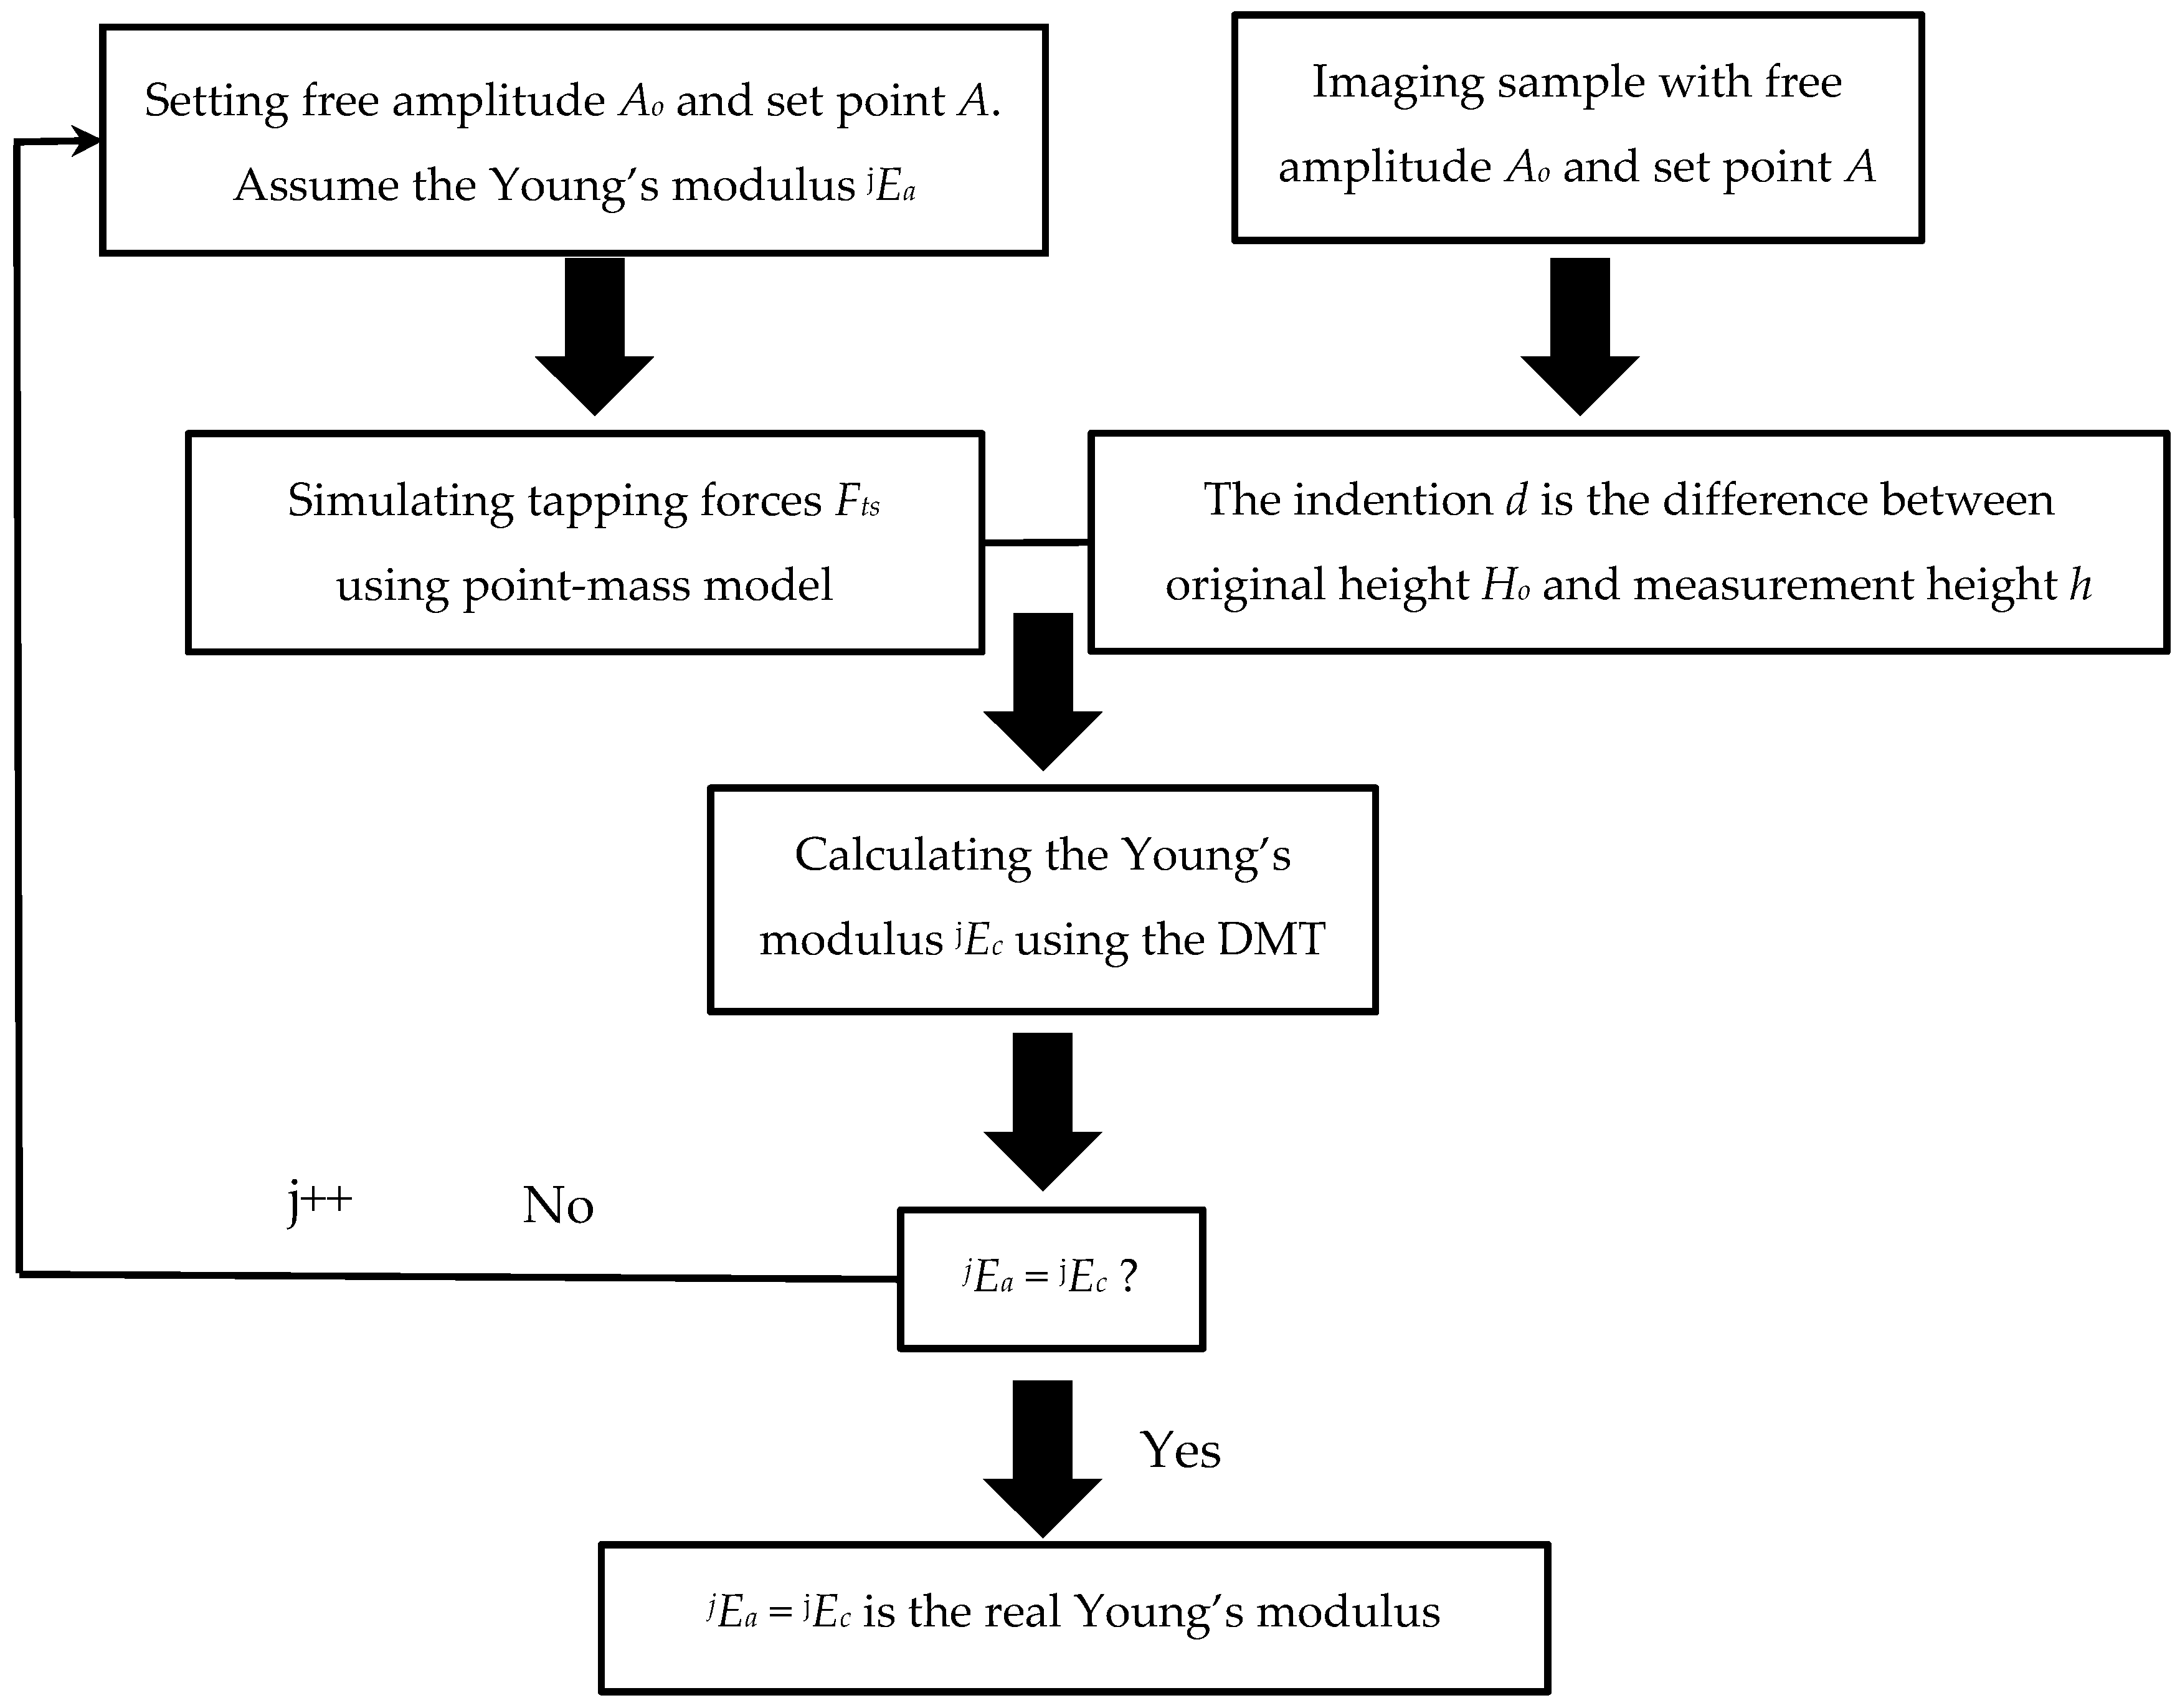
2.1. Assumption–Calculation Method (ACM)

In tapping-mode AFM, the dynamics of the AFM tip can be described using the point-mass model [26], as shown in Equation (1):
k ω o 2 x ¨ + k Q ω o x ˙ + k x = k A o Q c o s ( ω o t ) + F t s
where x is the AFM tip position relative to substrate surface, k is the spring constant of the AFM cantilever, ω o is the resonant frequency of the cantilever, k A o / Q is the external force acting on the cantilever from the crystal oscillator that drives the tip vibration with the free amplitude Ao, and Q   is the quality factor of the cantilever. Fts is the tip–sample interaction force, which is described by the Derjaguin–Müller–Toporov (DMT) model in Equation (2):
F t s = { H R 6 a o 2 < d H R 6 a o 2 + 4 3 E * R ( a o d ) 3 2 a o d
where H, R, ao, and d are the Hamaker constant, tip radius, intermolecular distance, and indentation of the sample surface caused by the AFM tip, respectively. E* is the effective elastic modulus of the tip and sample, which is expressed using Equation (3):
E * = ( v 1 E 1 + v 2 E 2 ) 1
where v1 and v2 are the Poisson ratios of the sample and AFM tip, respectively; E 1 and E 2 are the Young’s moduli of the sample and AFM tip, respectively.
According to the dynamic Equation (1), the scanning process can be simulated with MATLAB software after providing the parameters mentioned above [27]. As shown in Figure 1, the numerical simulation schematic includes the cantilever drive, a cantilever model containing the tip–sample force model and the amplitude measurement model, and a feedback loop with a proportional-integral-derivative (PID) controller. From the simulation, we can obtain information on tip vibration, tip–sample interaction, and sample indentation. The time-varying tapping process image indicates that the maximum indentation d of the sample occurs at the peak tapping force in one cycle when the tip approaches the bottom.
To obtain the physical properties of unfamiliar materials, we can assume the Young’s modulus as Ea and simulate the peak tapping force Fmax at different free amplitudes Ao and the set point amplitude A. Simultaneously, scanning experiments of the sample can be implemented with AFM under the same parameters as those used in the simulation, including the scanning parameters and the tip and sample properties. After scanning, the measured height h of the sample is obtained for different free amplitudes and set point amplitudes corresponding with the simulation. However, the measured height h is not the real sample height because the indentation d is induced under tip contact with the sample at the tapping force. Therefore, the original height Ho is the sum of the indentation d and the measurement height h, i.e., Ho = d + h. Using the peak tapping force Fmax, original height Ho, and other parameters in the DMT model, we can obtain the calculated Young’s modulus Ec. In comparing Ec with Ea, if the assumed Young’s modulus Ea is the real elastic modulus of the sample, it should be equal to the calculated Young’s modulus Ec. If Ea is not equal to Ec, we assume another Young’s modulus and repeat the same steps mentioned above until reaching Ec = Ea, which is the real Young’s modulus of the sample. The specific steps of the ACM are shown in Figure 2.

2.2. AFM Experiments

2.2.1. Sample Preparation
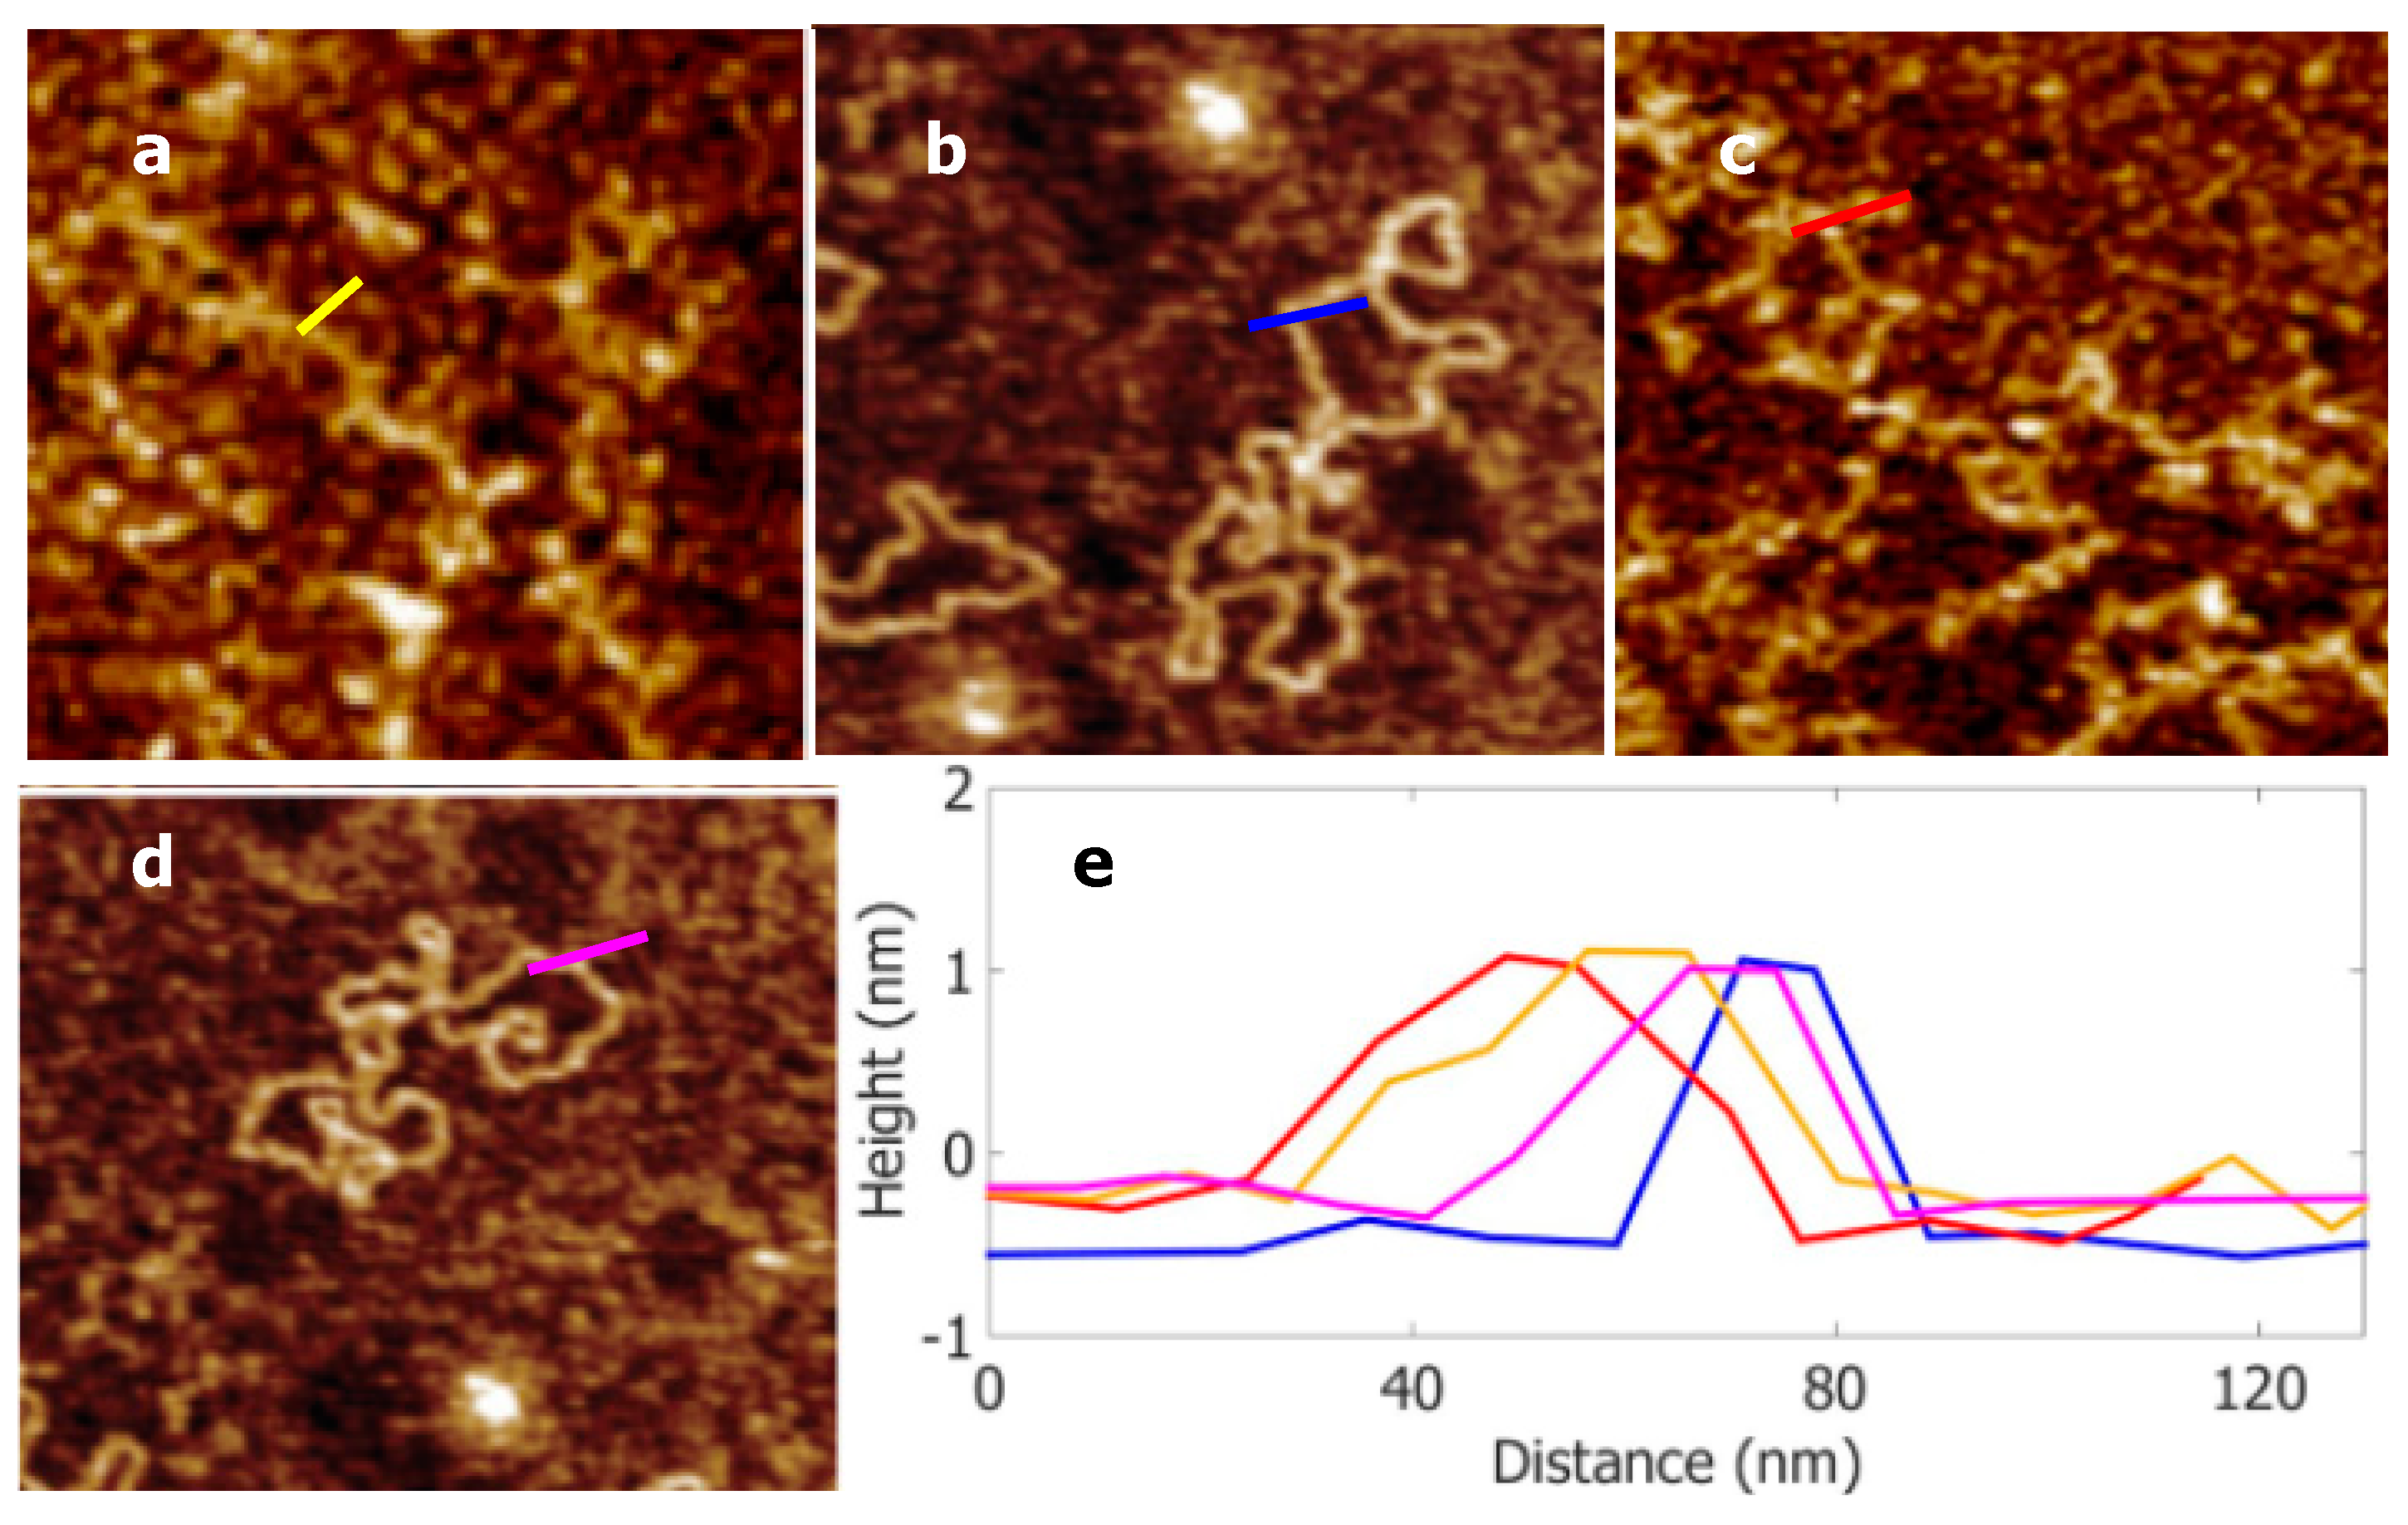
ChR plasmid DNA (878 ng μL−1), purchased from Takara Company (Dalian, China), was diluted to 0.3 μmol L−1 with a buffer solution comprising 20 mM Tris-HCl at pH 7.6, 1 mM ethylenediaminetetraacetic acid (EDTA), and 10–20 mM MgCl2 (TE/Mg2+, Takara Company). A droplet of 3 μL DNA solution was dropped on freshly cleaved mica and held for 5 min. The mica was then dried in compressed air for 3 min before 15 μL TE/Mg2+ buffer solution was dropped on the dried sample. The sample was then placed on the AFM stage for imaging.

2.2.2. AFM Images

The images of samples in a liquid environment were obtained using a Multimode AFM (Bruker, Santa Barbara, CA, USA) with an E scanner head in tapping mode. A silicon nitride probe (DNP-10, Bruker) was selected for scanning; it had quality factor Q of 20, resonant frequency fo of 8.5 kHz, tip radius R of 3 nm, Young’s modulus Etip of 310 GPa, and Poisson ratio v of 0.3. The spring constant k was measured at 0.12 N/m with the thermal tune method [28] in NanoScope software (V1.5, Bruker). The intermolecular distance ao was estimated to be 2 × 10⁻¹⁰ m [29], and the Hamaker constant H was calculated to be 2 × 10⁻²⁰ J [29,30] with H ( H t t H l l ) × ( H D D H l l ) , where H t t , H l l   , and H D D   are the Hamaker constants of the tip, liquid, and DNA, respectively. Here, we replaced the H of DNA with that of proteins. The matrix Afs provides the parameters for tip amplitude used in the experiments, where the superscript f depicts the free amplitude of the cantilever and the subscript s indicates the set point amplitude used in scanning (nm). After scanning, the measurement height Hfs under Afs was calculated from each scanning picture by averaging the values iHfs of five DNA duplexes, which were used to calculate the Young’s modulus of DNA; the superscript i depicts the number of DNA duplexes (1–5). During scanning, 512 × 512 sample points were used to obtain high-resolution AFM images; Figure 3 shows examples of AFM images and height measurements. The matrix Hfs provides the measured heights of the DNA duplexes.
A s f = [ A 25 38 A 23 38 A 21 38 A 19 38 A 17 38 A 21 30 A 19 30 A 17 30 A 15 30 A 13 30 A 17 22 A 15 22 A 13 22 A 11 22 A 9 22 A 14 16 A 12 16 A 10 16 A 8 16 A 6 16 ]
H s f = [ H 25 38 H 23 38 H 21 38 H 19 38 H 17 38 H 21 30 H 19 30 H 17 30 H 15 30 H 13 30 H 17 22 H 15 22 H 13 22 H 11 22 H 9 22 H 14 16 H 12 16 H 10 16 H 8 16 H 6 16 ] = [ 1.3 1.2 1.1 1.1 1.1 1.3 1.3 1.2 1.1 1.2 1.4 1.3 1.3 1.2 1.3 1.5 1.4 1.3 1.2 1.3 ]

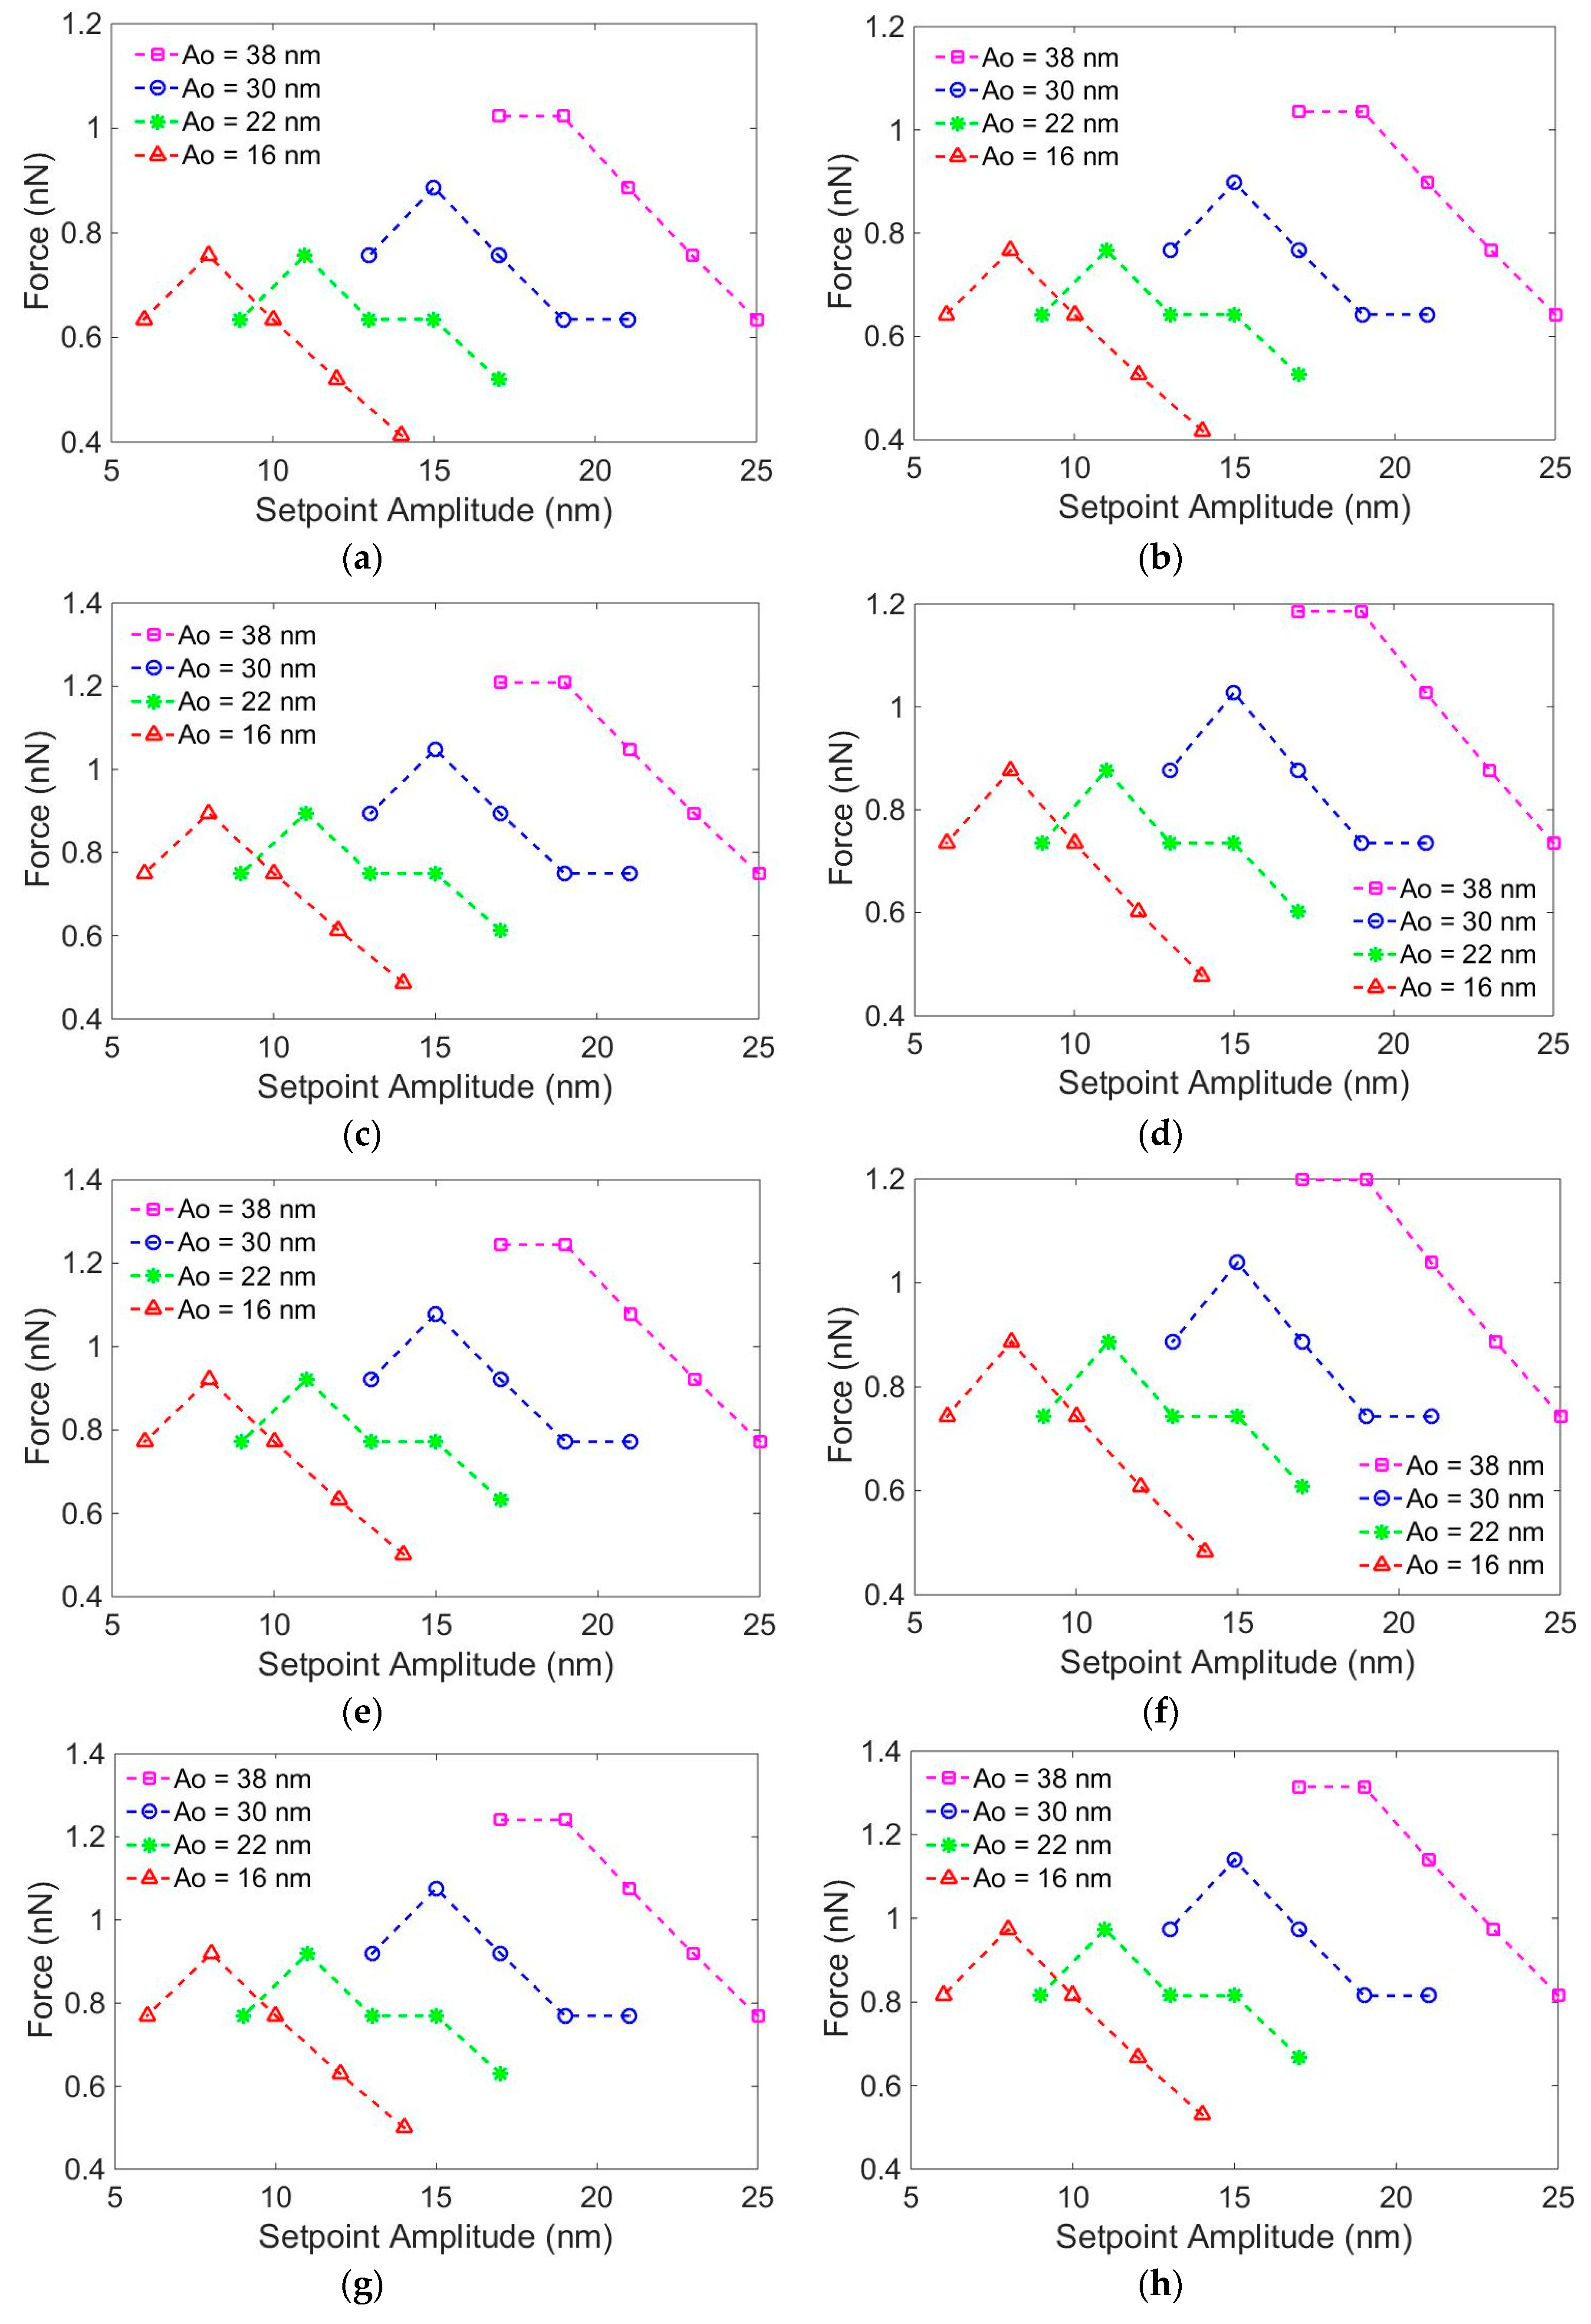
3. Results and Discussion

With the measurement height of DNA duplexes H s f , the maximal sample indentation d s f from the tip–sample interaction under the tip contact with the sample during scanning can be calculated using d s f = H o H s f . Using the scanning amplitudes A s f and the mechanical properties of the DNP AFM tip mentioned above, the tip–sample interaction force F j s f could be simulated using the point-mass model (Equation (1)) with the assumed Young’s modulus Ea of 50–250 MPa at 25-MPa increments. The maximal tapping force F j s f at the free amplitude and set-point amplitude of A s f   are shown in Figure 4, where the superscript j is the assumed Young’s modulus used in the simulation.
By using the simulated tapping force F j s f and the indentation of sample d s f = H o H s f in the DMT model (Equation (2)), we obtain Equation (4):
F j s f = H R 6 a 2 + 4 3 ( v 1 E j c + v 2 E 2 ) 1 R 1 2 ( a o ( H o j H s f ) ) 3 2
where E j c represents the calculated Young’s modulus corresponding to the assumed Young’s modulus E j a . H o j is the calculated original height. From Equation (4), for each matrix jFsf, we obtained the calculated Young’s modulus matrix E j c and the original height matrix H o j .
E c j = [ E 25 38 j E 23 38 j E 21 38 j E 19 38 j E 17 38 j E 21 30 j E 19 30 j E 17 30 j E 15 30 j E 13 30 j E 17 22 j E 15 22 j E 13 22 j E 11 22 j E 9 22 j E 14 16 j E 12 16 j E 10 16 j E 8 16 j E 6 16 j ]   H o j = [ H o j 25 38 H o j 23 38 H o j 21 38 H o j 19 38 H o j 17 38 H o j 21 30 H o j 19 30 H o j 17 30 H o j 15 30 H o j 13 30 H o j 17 22 H o j 15 30 H o j 13 30 H o j 11 30 H o j 9 30 H o j 14 16 H o j 12 16 H o j 10 16 H o j 8 16 H o j 6 16 ]
For each assumed Young’s modulus E j a , we obtained the calculated Young’s modulus and its standard deviation by averaging the calculated Young’s modulus matrix E j c . The same information for original height was obtained via the same method. Thus, the calculated Young’s modulus matrix E c and the original height matrix H o were obtained.
E c = [ E 50 c E 75 c E 100 c E 125 c E 150 c E 175 c E 200 c E 225 c E 250 c ]
H o = [ H o 50 H o 75 H o 100 H o 125 H o 150 H o 175 H o 200 H o 225 H o 250 ]
The tapping forces F s f j used in Equation (4) were simulated according to the assumed Young’s moduli E j a , and the measurement heights H s f   were obtained experimentally under parameters equal to those in the simulation, except for the Young’s modulus. If the simulated tapping force obtained with the assumed Young’s modulus was not equal to the experimental tapping force caused by the real Young’s modulus, the calculated Young’s modulus E j c solved using Equation (4) with the simulated tapping force and measurement height was not equal to the assumed Young’s modulus. Therefore, neither the assumed nor calculated Young’s modulus were the real elasticity of the sample. Otherwise, if the assumed value was equal to the calculated one, both of them were the real Young’s modulus of sample. We plot the calculated Young’s moduli points in Figure 5. The horizontal and vertical axes represent the assumed and calculated Young’s modulus values, respectively. The points on the red line indicate x = y and the points on the blue curve are the calculated Young’s moduli values from our experiments. According to our method, the points at the intersection of the red line x = y and the blue curve are meaningful for us because they denote E j a = E j c   , which indicates a matching of the assumed and calculated Young’s moduli. From Figure 5, the red line intersects with the E 125 a and E 150 a   columns. This indicates that the radial Young’s modulus of the DNA duplex was between 125 MPa and 150 MPa, and that the tapping force value was between 0.5 nN and 1.3 nN. The original height of the DNA duplex was approximately 1.9 nm, which is smaller than the theoretical value; this may be attributed to the electrostatic force between the DNA and the mica surface in liquid.
The stiffness of the DNA duplex obtained with our method was higher than that measured by other researchers [31], which is about 5–30 MPa in the force range of ≈60–160 pN. This discrepancy is likely from two primary reasons. One is that other studies used weaker acting forces than that in our experiments. Furthermore, the change in the mechanical properties of DNA with different loading forces has been demonstrated. Another reason is the stronger substrate effect experienced by the samples in our experiments using the mica surface, as opposed to those experienced with DNA origami surfaces in Reference [31].
Obviously, by measuring the Young’s modulus of the DNA duplex with our approach, both the mechanical property and original height could be obtained. However, the values under the pico-newton scale of tapping forces would be difficult to measure because small tapping forces cannot obtain quality scanning AFM images in the tapping mode. However, multi-harmonic atomic force microscopy is a good choice for obtaining the mechanical properties at the pico-newton scale [32,33,34]. Furthermore, our approach is more suitable for measuring the mechanical properties of soft nanomaterials because the measured height values of hard materials differ slightly under similar tapping forces.

4. Conclusions

In this study, an AFM tapping-mode scanning-based method was proposed to measure the radial elasticity and original height of DNA duplexes through a combination of theoretical calculation and experimental measurements. These are suitable for materials that cannot be characterized by the force curve method. With the proposed method, the Young’s modulus was obtained not by performing a shot-plot curve exactly over the sample surface, but through the scanning of several images with assorted free and set-point amplitudes. The critical prerequisite for the ability of accurately positioning the tip is thus avoided. The indentation of the sample caused by the tapping force exerted by the AFM probe tip can be compensated for, thus allowing for calculation of the original height of DNA. The experimental results show that the Young’s modulus of DNA was 125–150 MPa under a tapping force of 0.5–1.3 nN, while the original height was 1.9 nm. These results agree with other DNA elasticity measurements obtained using other methods. The obtained Young’s modulus and original height of the DNA duplexes demonstrate the effectiveness and validity of the proposed method. The presented method is simpler and applicable to other nanomaterials.

Author Contributions

Conceptualization and methodology, L.L. and L.Q.L.; software, L.L.; validation, L.L., H.C., and L.Q.L.; formal analysis, H.W.; data curation, X.Z., H.W., and Q.L.; writing—review and editing, L.L.; project administration, H.C. and L.Q.L.; funding acquisition, L.L. and Q.L.

Funding

This research was supported by the National Natural Science Foundation of China (31701311), University Nursing Program for Young Scholars with Creative Talents in Heilongjiang Province (UNPYSCT-2017016), and China Postdoctoral Science Foundation (2017M621234).

Acknowledgments

The authors thank colleagues in Northeast Agricultural University and Shenyang Institute of Automation for giving good suggestions regarding experiments and the manuscript.

Conflicts of Interest

The authors declare no conflict of interest.

References

  1. Rothemund, P.W.K. Folding DNA to create nanoscale shapes and patterns. Nature 2006, 440, 297–302. [Google Scholar] [CrossRef] [Green Version]
  2. Hong, F.; Zhang, F.; Liu, Y.; Yan, H. DNA origami: Scaffolds for creating higher order structures. Chem. Rev. 2017, 117, 12584–12640. [Google Scholar] [CrossRef] [PubMed]
  3. Han, D.; Pal, S.; Nangreave, J.; Deng, Z.; Liu, Y.; Yan, H. DNA origami with complex curvatures in three-dimensional space. Science 2011, 332, 342–346. [Google Scholar] [CrossRef] [PubMed]
  4. Douglas, S.M.; Dietz, H.; Liedl, T.; Högberg, B.; Graf, F.; Shih, W.M. Self-assembly of DNA into nanoscale three-dimensional shapes. Nature 2009, 459, 414. [Google Scholar] [CrossRef] [PubMed]
  5. Maune, H.T.; Han, S.P.; Barish, R.D.; Bockrath, M.; Goddard, W.A., III; Rothemund, P.W.; Winfree, E. Self-assembly of carbon nanotubes into two-dimensional geometries using DNA origami templates. Nat. Nanotechnol. 2010, 5, 61. [Google Scholar] [CrossRef]
  6. Tasciotti, E. Smart cancer therapy with DNA origami. Nat. Biotechnol. 2018, 36, 234. [Google Scholar] [CrossRef]
  7. Bui, H.; Shah, S.; Mokhtar, R.; Song, T.; Garg, S.; Reif, J. Localized DNA hybridization chain reactions on DNA origami. ACS Nano 2018, 12, 1146–1155. [Google Scholar] [CrossRef]
  8. Ding, B.; Deng, Z.; Yan, H.; Cabrini, S.; Zuckermann, R.N.; Bokor, J. Gold nanoparticle self-similar chain structure organized by DNA origami. J. Am. Chem. Soc. 2010, 132, 3248–3249. [Google Scholar] [CrossRef]
  9. Yamashita, N.; Ma, Z.; Park, S.; Kawai, K.; Hirai, Y.; Tsuchiya, T.; Tabata, O. Formation of gold nanoparticle dimers on silicon by sacrificial DNA origami technique. Micro Nano Lett. 2017, 12, 854–859. [Google Scholar] [CrossRef]
  10. Saccà, B.; Meyer, R.; Erkelenz, M.; Kiko, K.; Arndt, A.; Schroeder, H.; Rabe, K.S.; Niemeyer, C.M. Orthogonal protein decoration of DNA origami. Angew. Chem. Int. Ed. Engl. 2010, 49, 9378–9383. [Google Scholar] [CrossRef]
  11. Baclayon, M.; Roos, W.H.; Wuite, G.J. Sampling protein form and function with the atomic force microscope. Mol. Cell Proteom. 2010, 9, 1678–1688. [Google Scholar] [CrossRef] [PubMed]
  12. Binnig, G.; Quate, C.F.; Gerber, C. Atomic force microscope. Phys. Rev. Lett. 1986, 56, 930. [Google Scholar] [CrossRef]
  13. Li, M.; Tang, H.X.; Roukes, M.L. Ultra-sensitive NEMS-based cantilevers for sensing, scanned probe and very high-frequency applications. Nat. Nanotechnol. 2007, 2, 114. [Google Scholar] [CrossRef]
  14. Gui, X.; Xing, Y.; Rong, G.; Cao, Y.; Liu, J. Interaction forces between coal and kaolinite particles measured by atomic force microscopy. Powder Technol. 2016, 301, 349–355. [Google Scholar] [CrossRef]
  15. Plunkett, M.A.; Feiler, A.; Rutland, M.W. Atomic force microscopy measurements of adsorbed polyelectrolyte layers. 2. Effect of composition and substrate on structure, forces, and friction. Langmuir 2003, 19, 4180–4187. [Google Scholar] [CrossRef]
  16. Butt, H.J.; Cappella, B.; Kappl, M. Force measurements with the atomic force microscope: Technique, interpretation and applications. Surf. Sci. Rep. 2005, 59, 1–152. [Google Scholar] [CrossRef] [Green Version]
  17. McConney, M.E.; Singamaneni, S.; Tsukruk, V.V. Probing soft matter with the atomic force microscopies: Imaging and force spectroscopy. Polym. Rev. 2010, 50, 235–286. [Google Scholar] [CrossRef]
  18. Tombler, T.W.; Zhou, C.; Alexseyev, L.; Kong, J.; Dai, H.; Liu, L.; Jayanthi, C.S.; Tang, M.; Wu, S.Y. Reversible electromechanical characteristics of carbon nanotubes underlocal-probe manipulation. Nature 2000, 405, 769. [Google Scholar] [CrossRef]
  19. Liu, Z.; Jiao, N.; Xu, K.; Wang, Z.; Dong, Z.; Liu, L. Nanodot deposition and its application with atomic force microscope. J. Nanopart. Res. 2013, 15, 1687. [Google Scholar] [CrossRef]
  20. Weisenhorn, A.L.; Hansma, P.K.; Albrecht, T.R.; Quate, C.F. Forces in atomic force microscopy in air and water. Appl. Phys. Lett. 1989, 54, 2651–2653. [Google Scholar] [CrossRef]
  21. Dessinges, M.N.; Maier, B.; Zhang, Y.; Peliti, M.; Bensimon, D.; Croquette, V. Stretching single stranded DNA, a model polyelectrolyte. Phys. Rev. Lett. 2002, 89, 248102. [Google Scholar] [CrossRef] [PubMed]
  22. Nguyen, T.H.; Lee, S.M.; Na, K.; Yang, S.; Kim, J.; Yoon, E.S. An improved measurement of dsDNA elasticity using AFM. Nanotechnology 2010, 21, 075101. [Google Scholar] [CrossRef]
  23. Zhang, N.H.; Chen, J.Z. Mechanical properties of double-stranded DNA biolayers immobilized on microcantilever under axial compression. J. Biomech. 2009, 42, 1483–1487. [Google Scholar] [CrossRef]
  24. Zhou, X.F.; Sun, J.L.; An, H.J.; Guo, Y.C.; Fang, H.P.; Su, C.; Xiao, X.D.; Huang, W.H.; Li, M.Q.; Shen, W.Q.; Hu, J. Radial compression elasticity of single DNA molecules studied by vibrating scanning polarization force microscopy. Phys. Rev. E 2005, 71, 062901. [Google Scholar] [CrossRef] [PubMed]
  25. Lin, Y.; Shen, X.; Wang, J.; Bao, L.; Zhang, Z.; Pang, D. Measuring radial Young’s modulus of DNA by tapping mode AFM. Chin. Sci. Bull. 2007, 52, 3189–3192. [Google Scholar] [CrossRef]
  26. Payton, O.D.; Picco, L.; Scott, T.B. High-speed atomic force microscopy for materials science. Int. Mater. Rev. 2016, 61, 473–494. [Google Scholar] [CrossRef]
  27. Legleiter, J. The effect of drive frequency and set point amplitude on tapping forces in atomic force microscopy: Simulation and experiment. Nanotechnology 2009, 20, 245703. [Google Scholar] [CrossRef] [PubMed]
  28. Hutter, J.L.; Bechhoefer, J. Calibration of atomic-force microscope tips. Rev. Sci. Instrum. 1993, 64, 1868–1873. [Google Scholar] [CrossRef]
  29. Cappella, B.; Dietler, G. Force-distance curves by atomic force microscopy. Surf. Sci. Ref. 1999, 34, 1–104. [Google Scholar] [CrossRef] [Green Version]
  30. Leite, F.L.; Bueno, C.C.; Da Róz, A.L.; Ziemath, E.C.; Oliveira, O.N. Theoretical models for surface forces and adhesion and their measurement using atomic force microscopy. Int. J. Mol. Sci. 2012, 13, 12773–12856. [Google Scholar] [CrossRef]
  31. Li, L.; Zhang, P.; Li, J.; Wang, Y.; Wei, Y.; Hu, J.; Zhou, X.F.; Xu, B.; Li, B. Measurement of Nanomechanical Properties of DNA Molecules by PeakForce Atomic Force Microscopy Base on DNA Origamis. Nanoscale 2019, 11, 4707–4711. [Google Scholar] [CrossRef] [PubMed]
  32. Raman, A.; Trigueros, S.; Cartagena, A.; Stevenson, A.P.Z.; Susilo, M.; Nauman, E.; Contera, S.A. Mapping nanomechanical properties of live cells using multi-harmonic atomic force microscopy. Nat. Nanotechnol. 2011, 6, 809. [Google Scholar] [CrossRef] [PubMed]
  33. Cartagena-Rivera, A.X.; Wang, W.H.; Geahlen, R.L.; Raman, A. Fast, multi-frequency, and quantitative nanomechanical mapping of live cells using the atomic force microscope. Sci. Rep. 2015, 5, 11692. [Google Scholar] [CrossRef] [Green Version]
  34. Cartagena, A.; Hernando-Pérez, M.; Carrascosa, J.L.; de Pablo, P.J.; Raman, A. Mapping in vitro local material properties of intact and disrupted virions at high resolution using multi-harmonic atomic force microscopy. Nanoscale 2013, 5, 4729–4736. [Google Scholar] [CrossRef] [PubMed]
Figure 1. Key components of numerical simulations, including the driving system, cantilever model, amplitude measurement, and feedback loop of the PID controller.
Nanomaterials 09 00561 g001
Figure 2. Flowchart of the assumption–calculation method. j represents the assumed Young’s modulus used in simulation.
Nanomaterials 09 00561 g002
Figure 3. AFM images of DNA duplexes on mica surface. (a) Free amplitude was 38 nm, set point was 21 nm, and measured height was 1.1 nm. (b) Free amplitude was 16 nm, set point was 14 nm, and measured height was 1.5 nm. (c) Free amplitude was 30 nm, set point was 21 nm, and measured height was 1.3 nm. (d) Free amplitude was 22 nm, set point was 17 nm, and measured height was 1.4 nm. (e) Section curves taken along the lines in (ad), as indicated by color.
Nanomaterials 09 00561 g003
Figure 4. Simulating the maximum tip–sample interaction forces with different assumed Young’s moduli and other parameters set equal to those used in the experiments: Ea = (a) 50 MPa, (b) 75 MPa, (c) 100 MPa, (d) 125 MPa, (e) 150 MPa, (f) 175 MPa, (g) 200 MPa, (h) 225 MPa, and (i) 250 MPa.
Nanomaterials 09 00561 g004aNanomaterials 09 00561 g004b
Figure 5. Elasticity of DNA. Red line: x = y. Blue line: Ec.
Nanomaterials 09 00561 g005

