Article

Photovoltaic Performance of Dye-Sensitized Solar Cells Containing ZnO Microrods

1
School of Advanced Materials and Chemical Engineering, Daegu Catholic University, Gyeongbuk 38430, Korea
2
Department of Organic Material Science and Engineering, Pusan National University, Busan 46241, Korea
3
Division of Energy Technology, Daegu Gyeongbuk Institute of Science and Technology (DGIST), Daegu 42988, Korea
*
Authors to whom correspondence should be addressed.
These authors contributed equally to this work.
Nanomaterials 2019, 9(12), 1645; https://doi.org/10.3390/nano9121645
Submission received: 3 November 2019 / Revised: 16 November 2019 / Accepted: 18 November 2019 / Published: 20 November 2019

Abstract

:
At an elevated temperature of 90 °C, a chemical bath deposition using an aqueous solution of Zn(NO3)2·6H2O and (CH2)6N4 resulted in the formation of both nanoflowers and microrods of ZnO on F-doped SnO2 glass with a seed layer. The nanoflowers and microrods were sensitized with dyes for application to the photoelectrodes of dye-sensitized solar cells (DSSCs). By extending the growth time of ZnO, the formation of nanoflowers was reduced and the formation of microrods favored. As the growth time was increased from 4 to 6 and then to 8 h, the open circuit voltage (Voc) values of the DSSCs were increased, whilst the short circuit current (Jsc) values varied only slightly. Changes in the dye-loading amount, dark current, and electrochemical impedance were monitored and they revealed that the increase in Voc was found to be due to a retardation of the charge recombination between photoinjected electrons and I3 ions and resulted from a reduction in the surface area of ZnO microrods. A reduced surface area decreased the dye contents adsorbed on the ZnO microrods, and thereby decreased the light harvesting efficiency (LHE). An increase in the electron collection efficiency attributed to the suppressed charge recombination counteracted the decreased LHE, resulting in comparable Jsc values regardless of the growth time.

1. Introduction

Photovoltaic cells convert solar energy into direct current electricity using p-type and n-type semiconductors. Traditionally, solid-state junction devices, usually made of silicon, have dominated this field, drawing on the experience and material availability arising from the semiconductor industry. The dominance of inorganic solid-state junction cells is being challenged by the advent of third-generation photovoltaic cells such as dye-sensitized solar cells (DSSCs), polymer solar cells, and perovskite solar cells [1,2,3]. DSSCs based on nanoporous TiO2 films have been extensively researched due to their comparable photovoltaic efficiency, potentially low production cost, low toxicity, and rapid manufacturing process. In addition, the advantages of DSSCs for real-world applications, including transparent and multicolor options, or both, easy architectural integration, and short energy payback time have drawn attention.
The general DSSC consists of a dye-adsorbed semiconductor electrode (i.e., TiO2 photoelectrode), an electrolyte, and a Pt-coated counter electrode [1,4]. The TiO2 photoelectrodes in the cells play an important role in the photovoltaic efficiency. Highly porous TiO2 films provide extended surface area for dye adsorption resulting in the enhanced light harvesting efficiency (LHE) of DSSCs. TiO2, as an n-type semiconductor, is also a good transporter of the electrons injected from the photoexcited dyes. As another n-type semiconductor, ZnO has a band gap energy of 3.3 eV, similar to that of TiO2 (3.2 eV), and has much higher electron diffusivity than TiO2. It also has a high electron mobility of 115–155 cm2 V−1 s−1, which is favorable for effective electron transport through the ZnO layer and for reduction of the charge recombination rate [5,6]. In addition, the diverse morphologies of ZnO including nanorods, nanowires, nanosheets, nanobolts, or nanoflowers allows for various designs of photoelectrodes for ZnO based DSSCs. The diverse morphology of ZnO is attributable to the anisotropic growth of ZnO, unlike the crystalline structure of TiO2 [5,6,7,8]. ZnO is thus considered to be a viable alternative to TiO2 in DSSCs.
The reported power conversion efficiencies (PCEs) of ZnO-based DSSCs range from under 1% to the highest value of 7.5% [5,6,9], mainly dependent on the deposition condition and the morphology of nano-structured ZnO. Extensive research on improving the PCE of DSSCs based on the nanostructure of ZnO has been conducted since the first report on dye-sensitized ZnO [10], but little attention has been given to the use of ZnO microrods. To the best of our knowledge, DSSCs with ZnO microrods as photoelectrodes have never been reported. In this study, ZnO microrods grown on F-doped SnO2 (FTO) glass were prepared through a chemical bath deposition. Dye-sensitized microrods were utilized as the photoelectrodes of DSSCs and their photovoltaic performance was examined.

2. Materials and Methods

2.1. Materials

Commercial FTO (sheet resistance ~7 Ω/square) glass (TCO22-7), N719 dye (Ruthenizer 535-bisTBA), hot-melt adhesive (SX1170-60PF, Surlyn), and iodide-based electrolytes (AN-50) were purchased from Solaronix. Zinc acetate dehydrate [Zn(CH3COO)2·2H2O], zinc nitrate hexahydrate [Zn(NO3)2·6H2O], and hexamethylenetetramine [HMTA, (CH2)N4] (Sigma-Aldrich Co.) were used to form ZnO microrods. We used Pt paste (PT-1, Dyesol-Timo) as the source for the counter electrode. All the above reagents and materials were used without further purification.

2.2. Preparation of DSSCs

To prepare the working ZnO/FTO electrodes, the FTO glass was cleaned in a detergent solution with sonication for 20 min and then thoroughly rinsed with deionized (DI) water and ethanol. To deposit a seed layer, we spin-coated a solution of Zn(CH3COO)2·2H2O in ethanol (5 mM) on the cleaned FTO glass at 500 rpm for 5 s, at 3000 rpm for 30 s, and at 500 rpm for 5 s. They were then dried on coated glass on a preheated hot plate at 150 °C for 15 min. After this process was repeated three times, the glass was annealed at 350 °C for 15 min. The FTO glass with the seed layer was immersed in an aqueous solution of Zn(NO3)2·6H2O (35 mM) and HMTA (35 mM) at 90 °C for 4–10 h to form ZnO microrods on the FTO substrate. The deposition area was adjusted by masking using Kapton tape. After the deposition, the films were taken out of the growth solution and rinsed with deionized water and ethanol. Subsequently, the ZnO microrods on the FTO glass were annealed at 450 °C for 30 min. Dye-sensitized ZnO/FTO photoelectrodes were prepared through the conventional soaking method, i.e., the ZnO/FTO films were soaked in a 0.5 mM dye (N719) solution (ethanol) for 20 min.
Two small holes were formed in the FTO glasses and the glasses were thoroughly cleaned with ultrasonification. Pt paste was coated on the cleaned FTO glass via the doctor-blade method and then calcined at 400 °C for 30 min. The resulting counter electrodes and the working ZnO/FTO electrodes were sealed using a 60 μm thick Surlyn. By injecting the electrolyte into the cells through one of the two small holes in the counter electrodes we could prepare ZnO-based DSSCs with a 25 mm2 active area. Figure 1 shows a schematic illustration of a ZnO-based DSSC and electron flow when the device is exposed to light.

2.3. Measurements

The morphology of the ZnO microrods was visualized by field emission scanning electron microscopy (FE-SEM; S-4800, Hitachi High-Technology, Tokyo, Japan). A CompactStat potentiostat (Ivium Technologies B.V., Eindhoven, The Netherlands) and a PEC-L01 solar simulator system equipped with a 150 W xenon arc lamp (Peccell Technologies, Inc., Yokohama, Japan) were used to measure the photocurrent and photovoltage. To adjust the light intensity to 1 sun (100 mW/cm2) a silicon photodiode (PEC-SI01, Peccell Technologies, Inc., Yokohama, Japan) was utilized. The UV-visible absorbance was measured using a spectrophotometer (NEOSYS 2000, Seoul, SINCO, Korea). An electrochemical analyzer (CompactStat, Ivium Technologies B.V., Eindhoven, The Netherlands) was used for the electrochemical impedance spectroscopic (EIS) analysis. The active area of the ZnO layer was measured using a digital microscope camera (OLYMPUS SZ61) equipped with image analysis software.

3. Results and Discussion

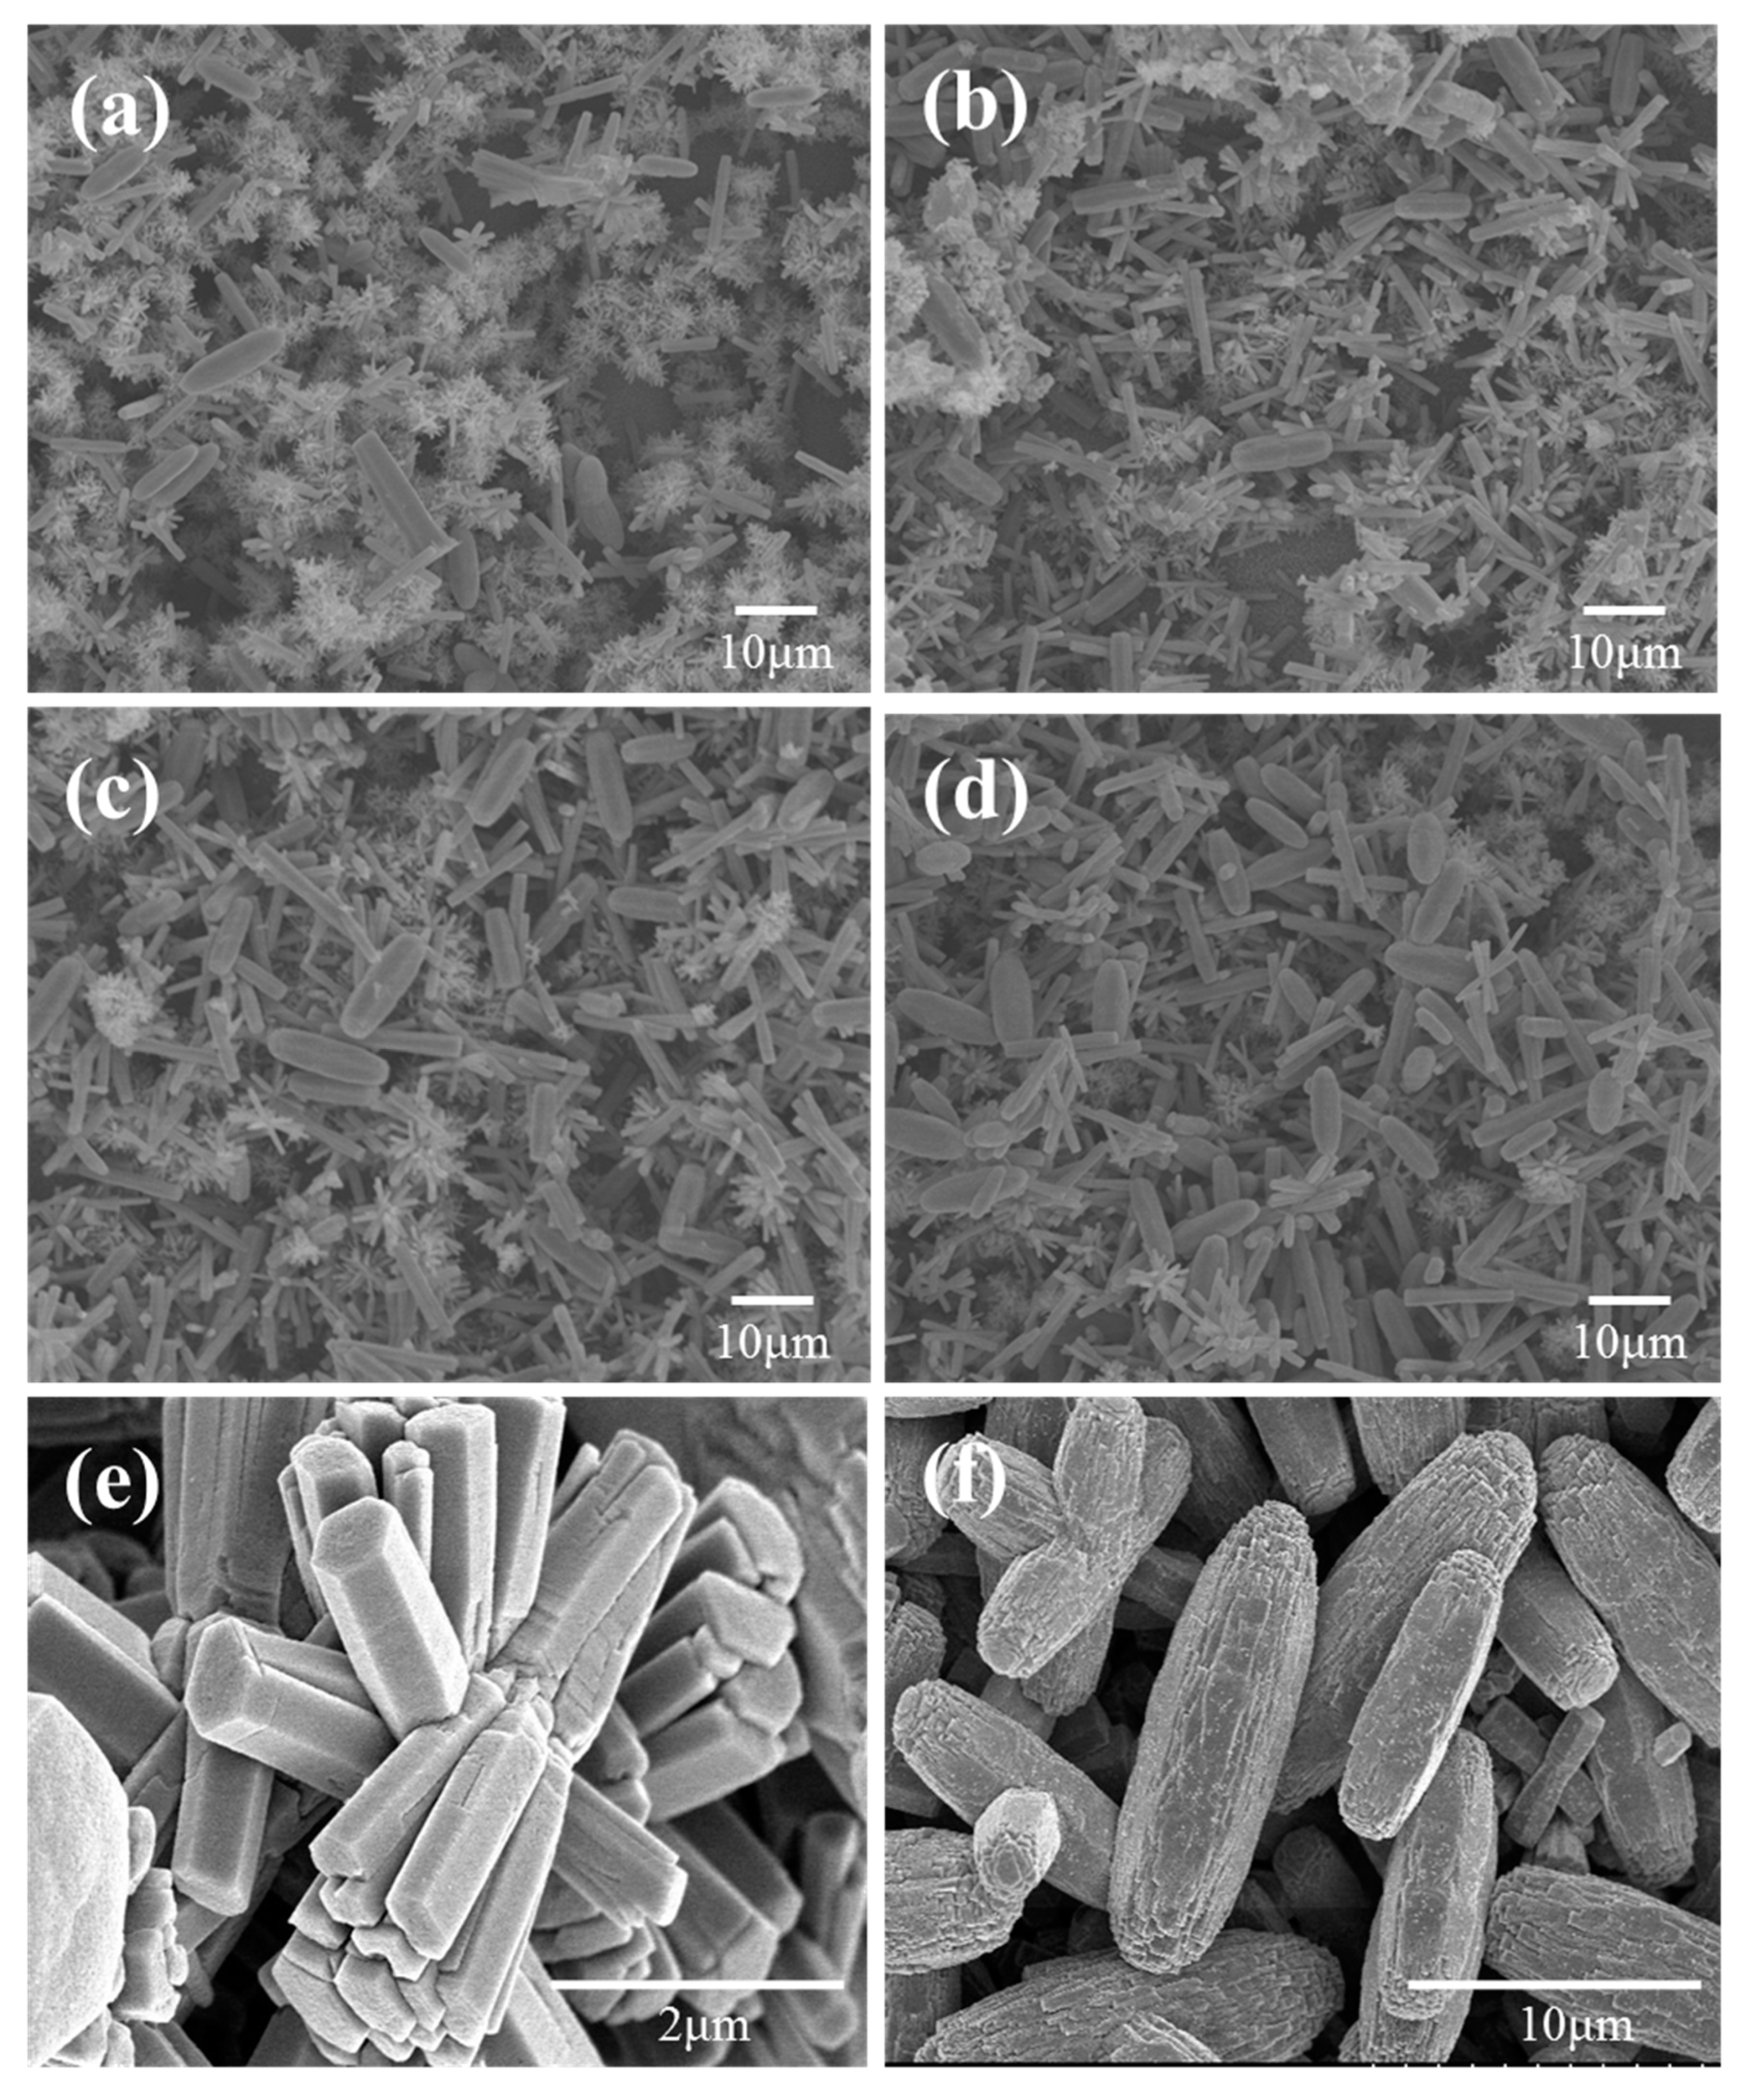
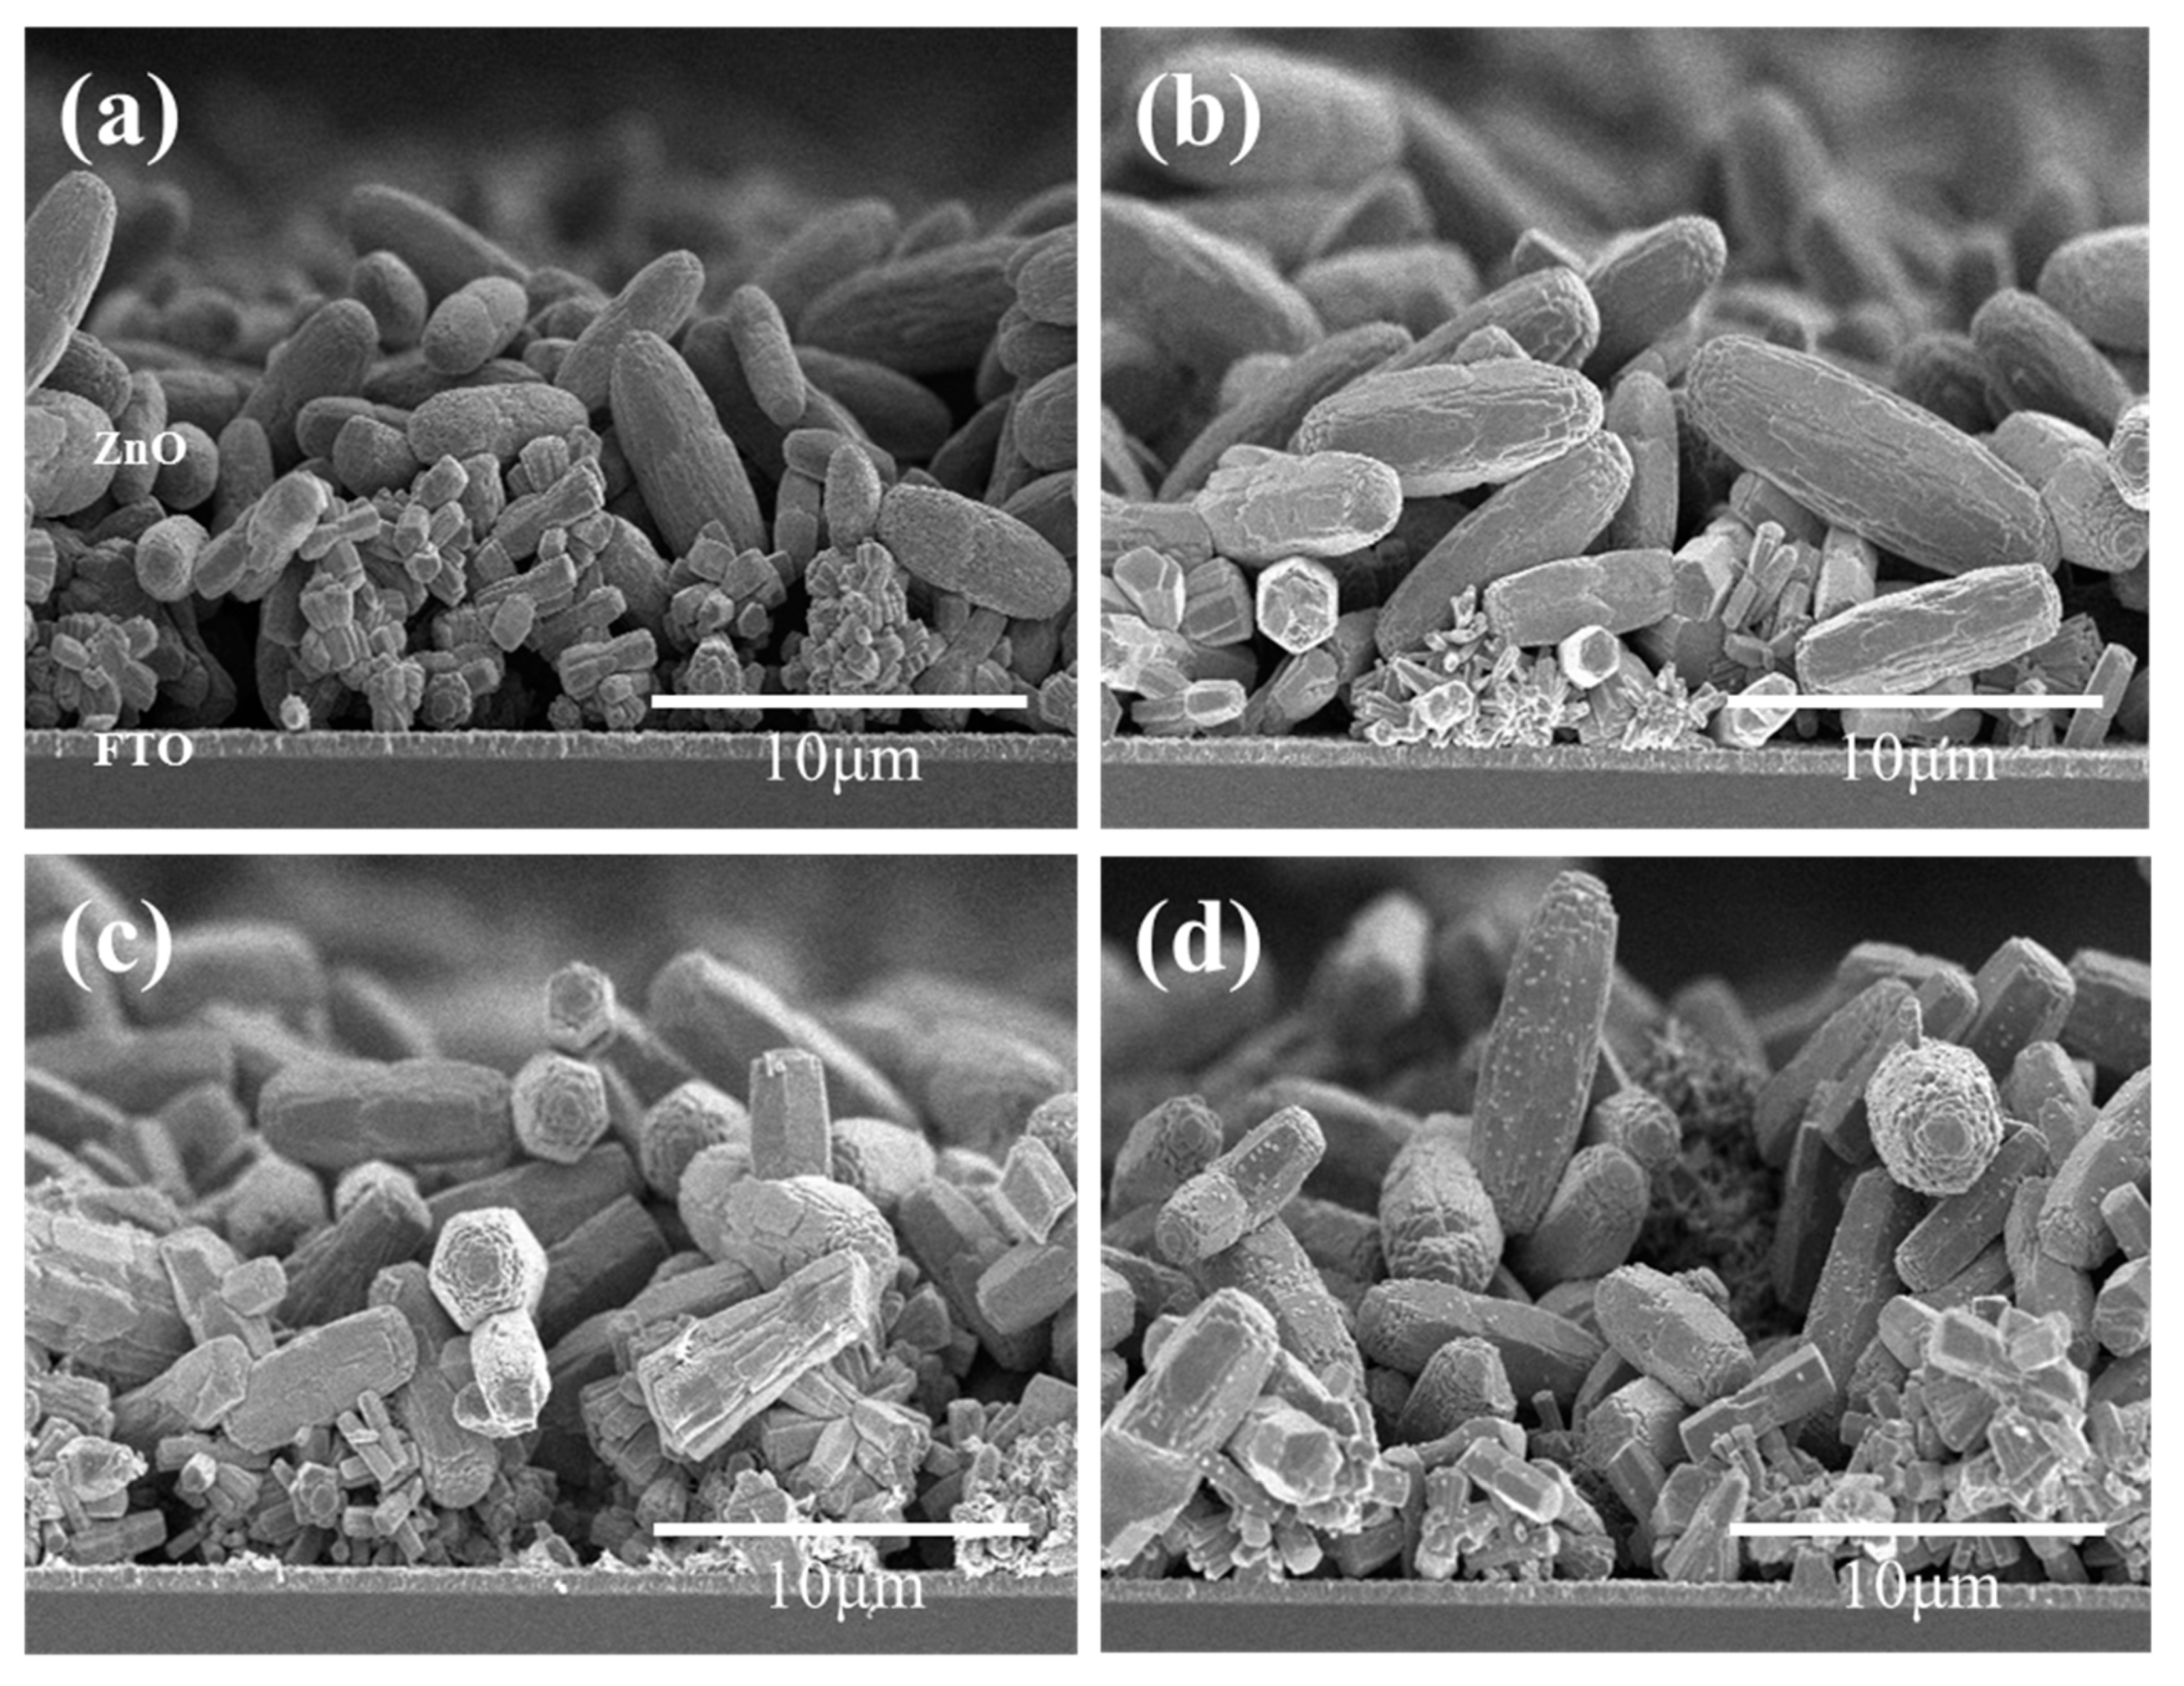
3.1. Morphological Characteristics of ZnO Layers with Growth Time

Nano- and micro-structured ZnO layers were formed through Equations (1)–(4) on the FTO substrates when the seeded FTO glass was immersed into the growth solution comprised of zinc nitrate and HMTA [(CH2)N4] at 90 °C.
(CH2)N4 (aq) + 6H2O (l) → 4NH3 (g) + 6HCHO (aq)
NH3 (g) + H2O (l) → NH4+ (aq) + OH (aq)
Zn2+ (aq) + 2OH (aq) → Zn(OH)2 (s)
Zn(OH)2 (s) → ZnO (s) + H2O (l)
HTMA was hydrolyzed, i.e., reacted with water, to yield HCHO and NH3. Zn(OH)2, precipitated through the reaction between the zinc ions (Zn2+) and hydroxide ions (OH) provided from zinc nitrate and ammonium hydroxide (see Equation (2)), respectively, and then dehydrated to form ZnO. Generally, the concentration of the CBD solution determines the density of a nanostructure, while temperature and growth time affect aspect ratio and morphology of the nanostructure [11,12,13,14,15].
Using a CBD solution comprising zinc nitrate (35 mM) and HMTA (35 mM), we fabricated a mixed layer of ZnO nanoflowers and microrods at an elevated temperature of 90 °C. Randomly distributed nanoflowers and microrods of ZnO were formed, as illustrated in Figure 2. As a reference, when the growth temperature was lowered to 75 °C, only ZnO nanorods, which were dense and vertically aligned, were formed on the FTO glass (not shown here). As the growth time was extended, the number of nanoflowers was reduced whilst the number of microrods increased. The nanoflowers exhibited a length of approximately 0.54–3.43 μm and a diameter of 350–650 nm. The length and diameter of the microrods were measured to be approximately 6.2–13.1 μm and 2.27–3.55 μm, respectively. A cross-sectional view of the ZnO layers on the FTO glass is shown in Figure 3. ZnO layers composed of nanoflowers and microrods were formed on the FTO glass with thicknesses of about 12, 16, 18, and 19 μm for growth times of 4, 6, 8, and 10 h, respectively.

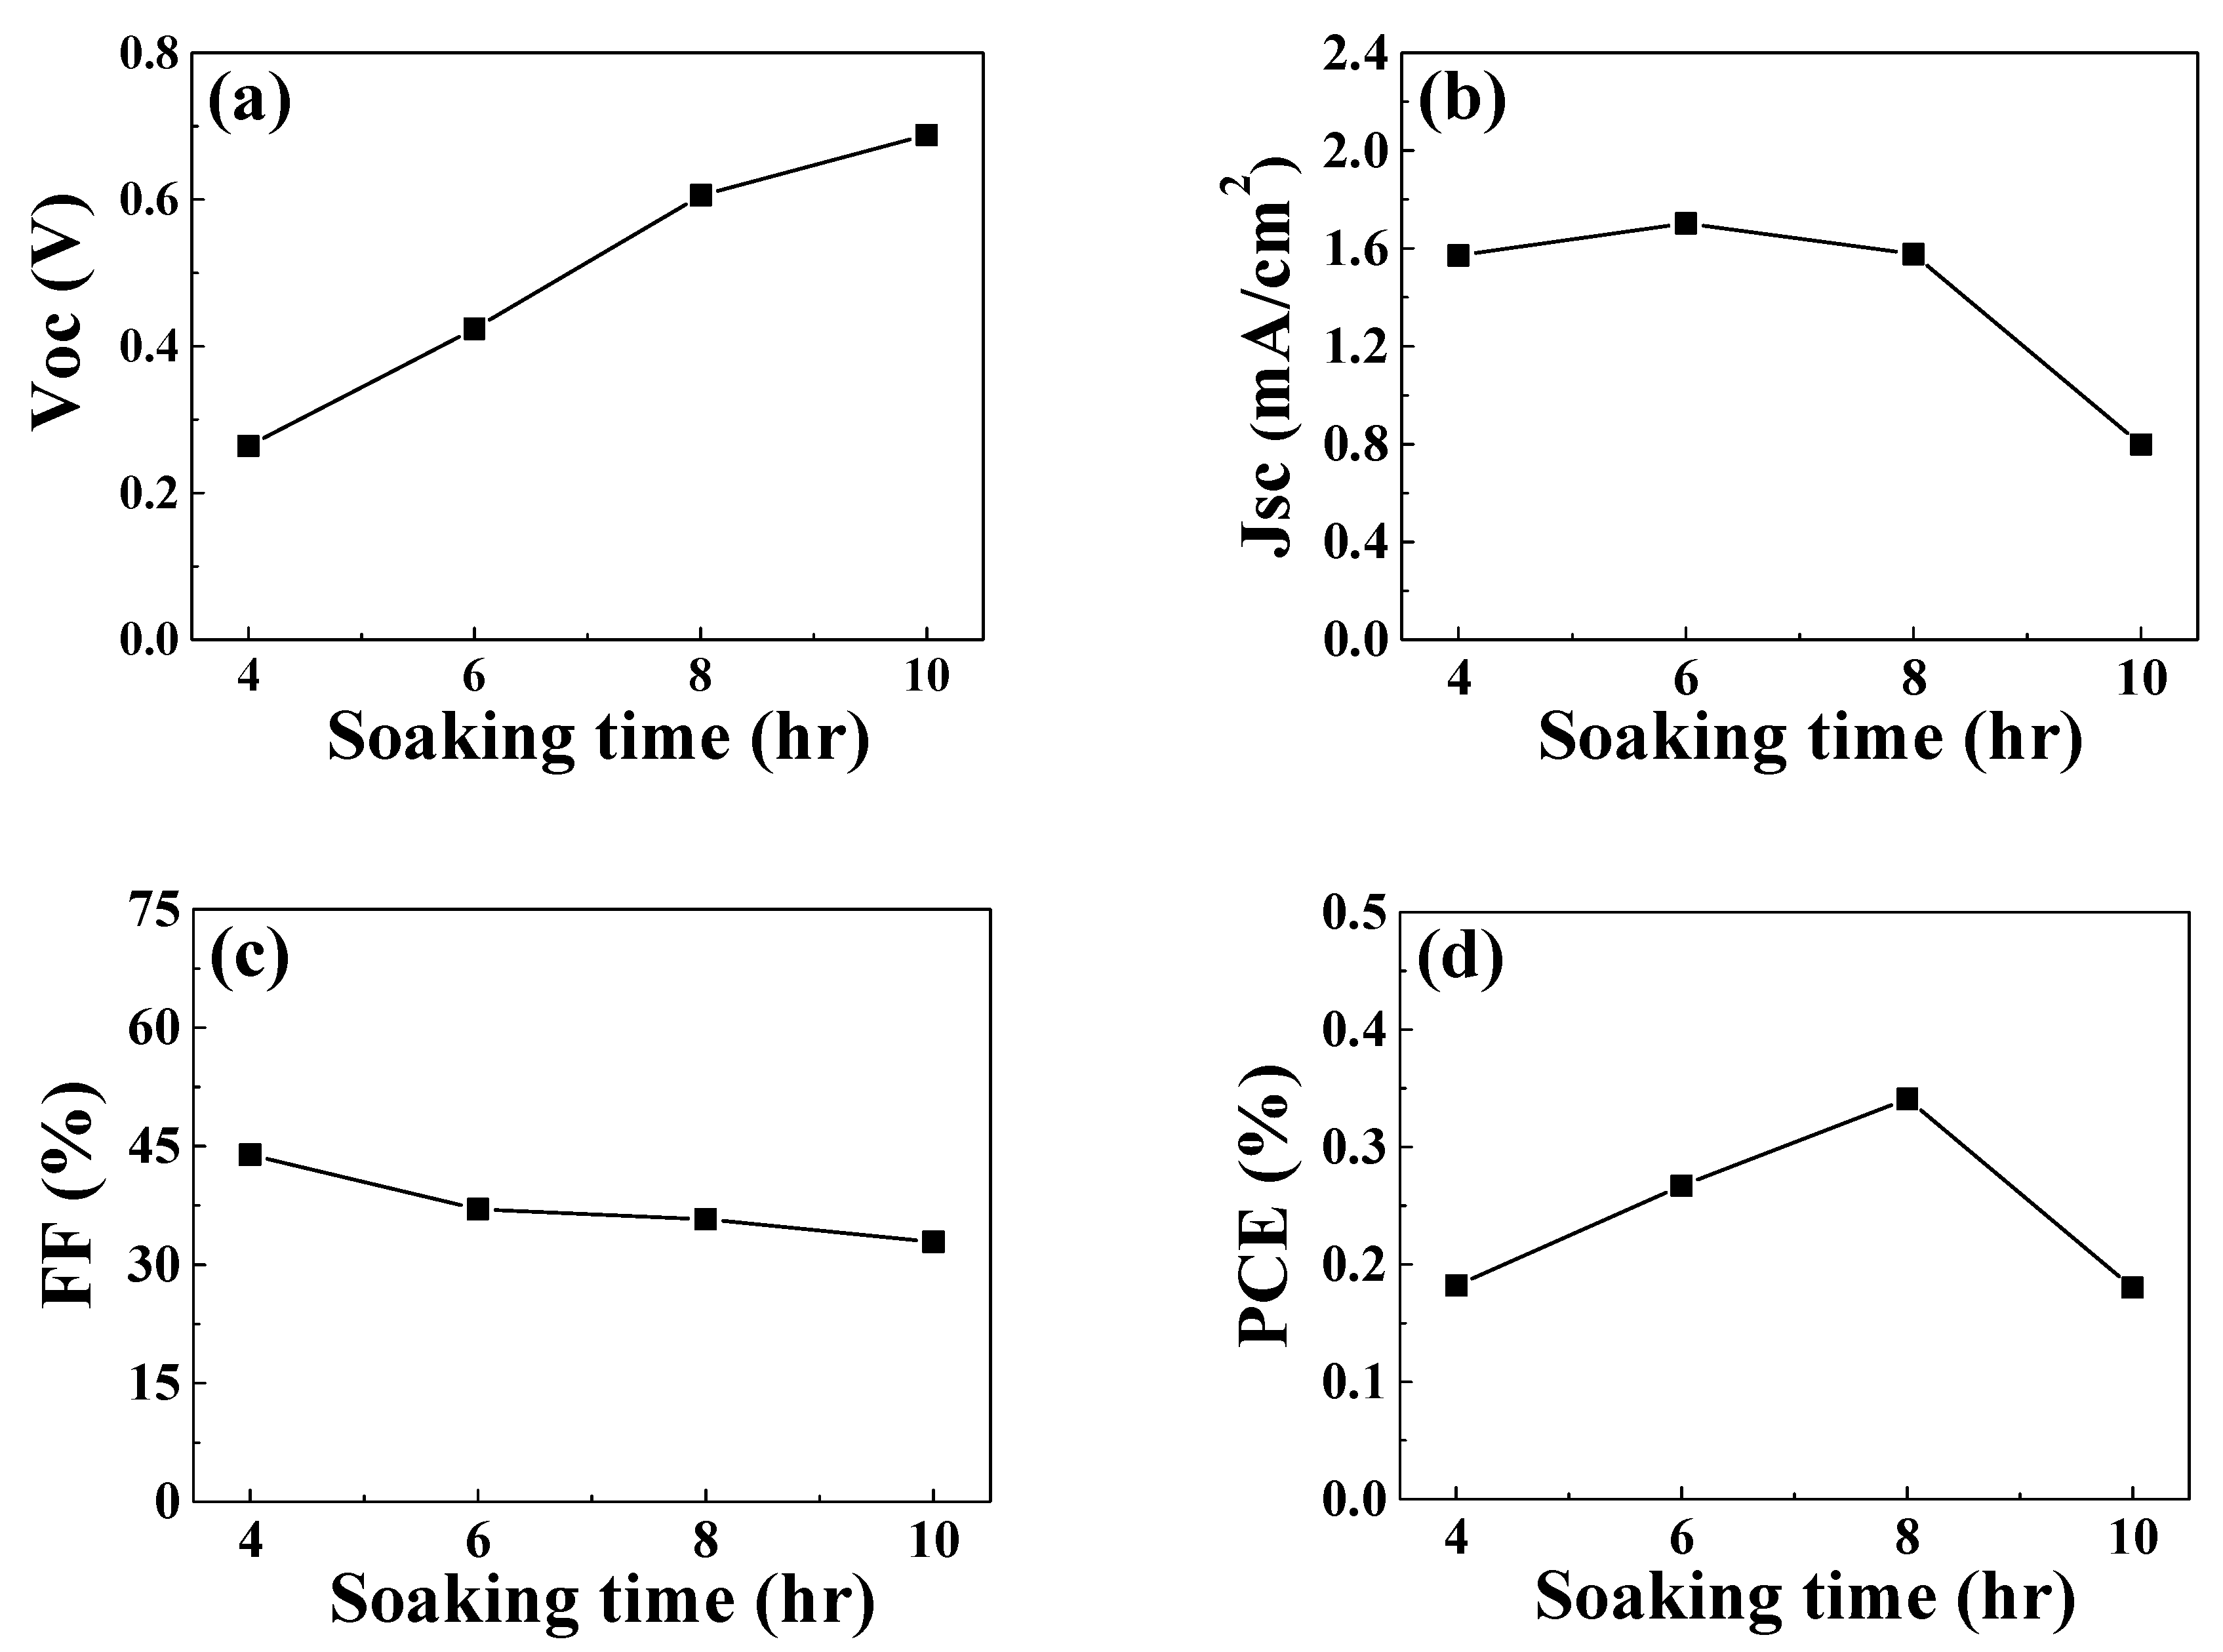
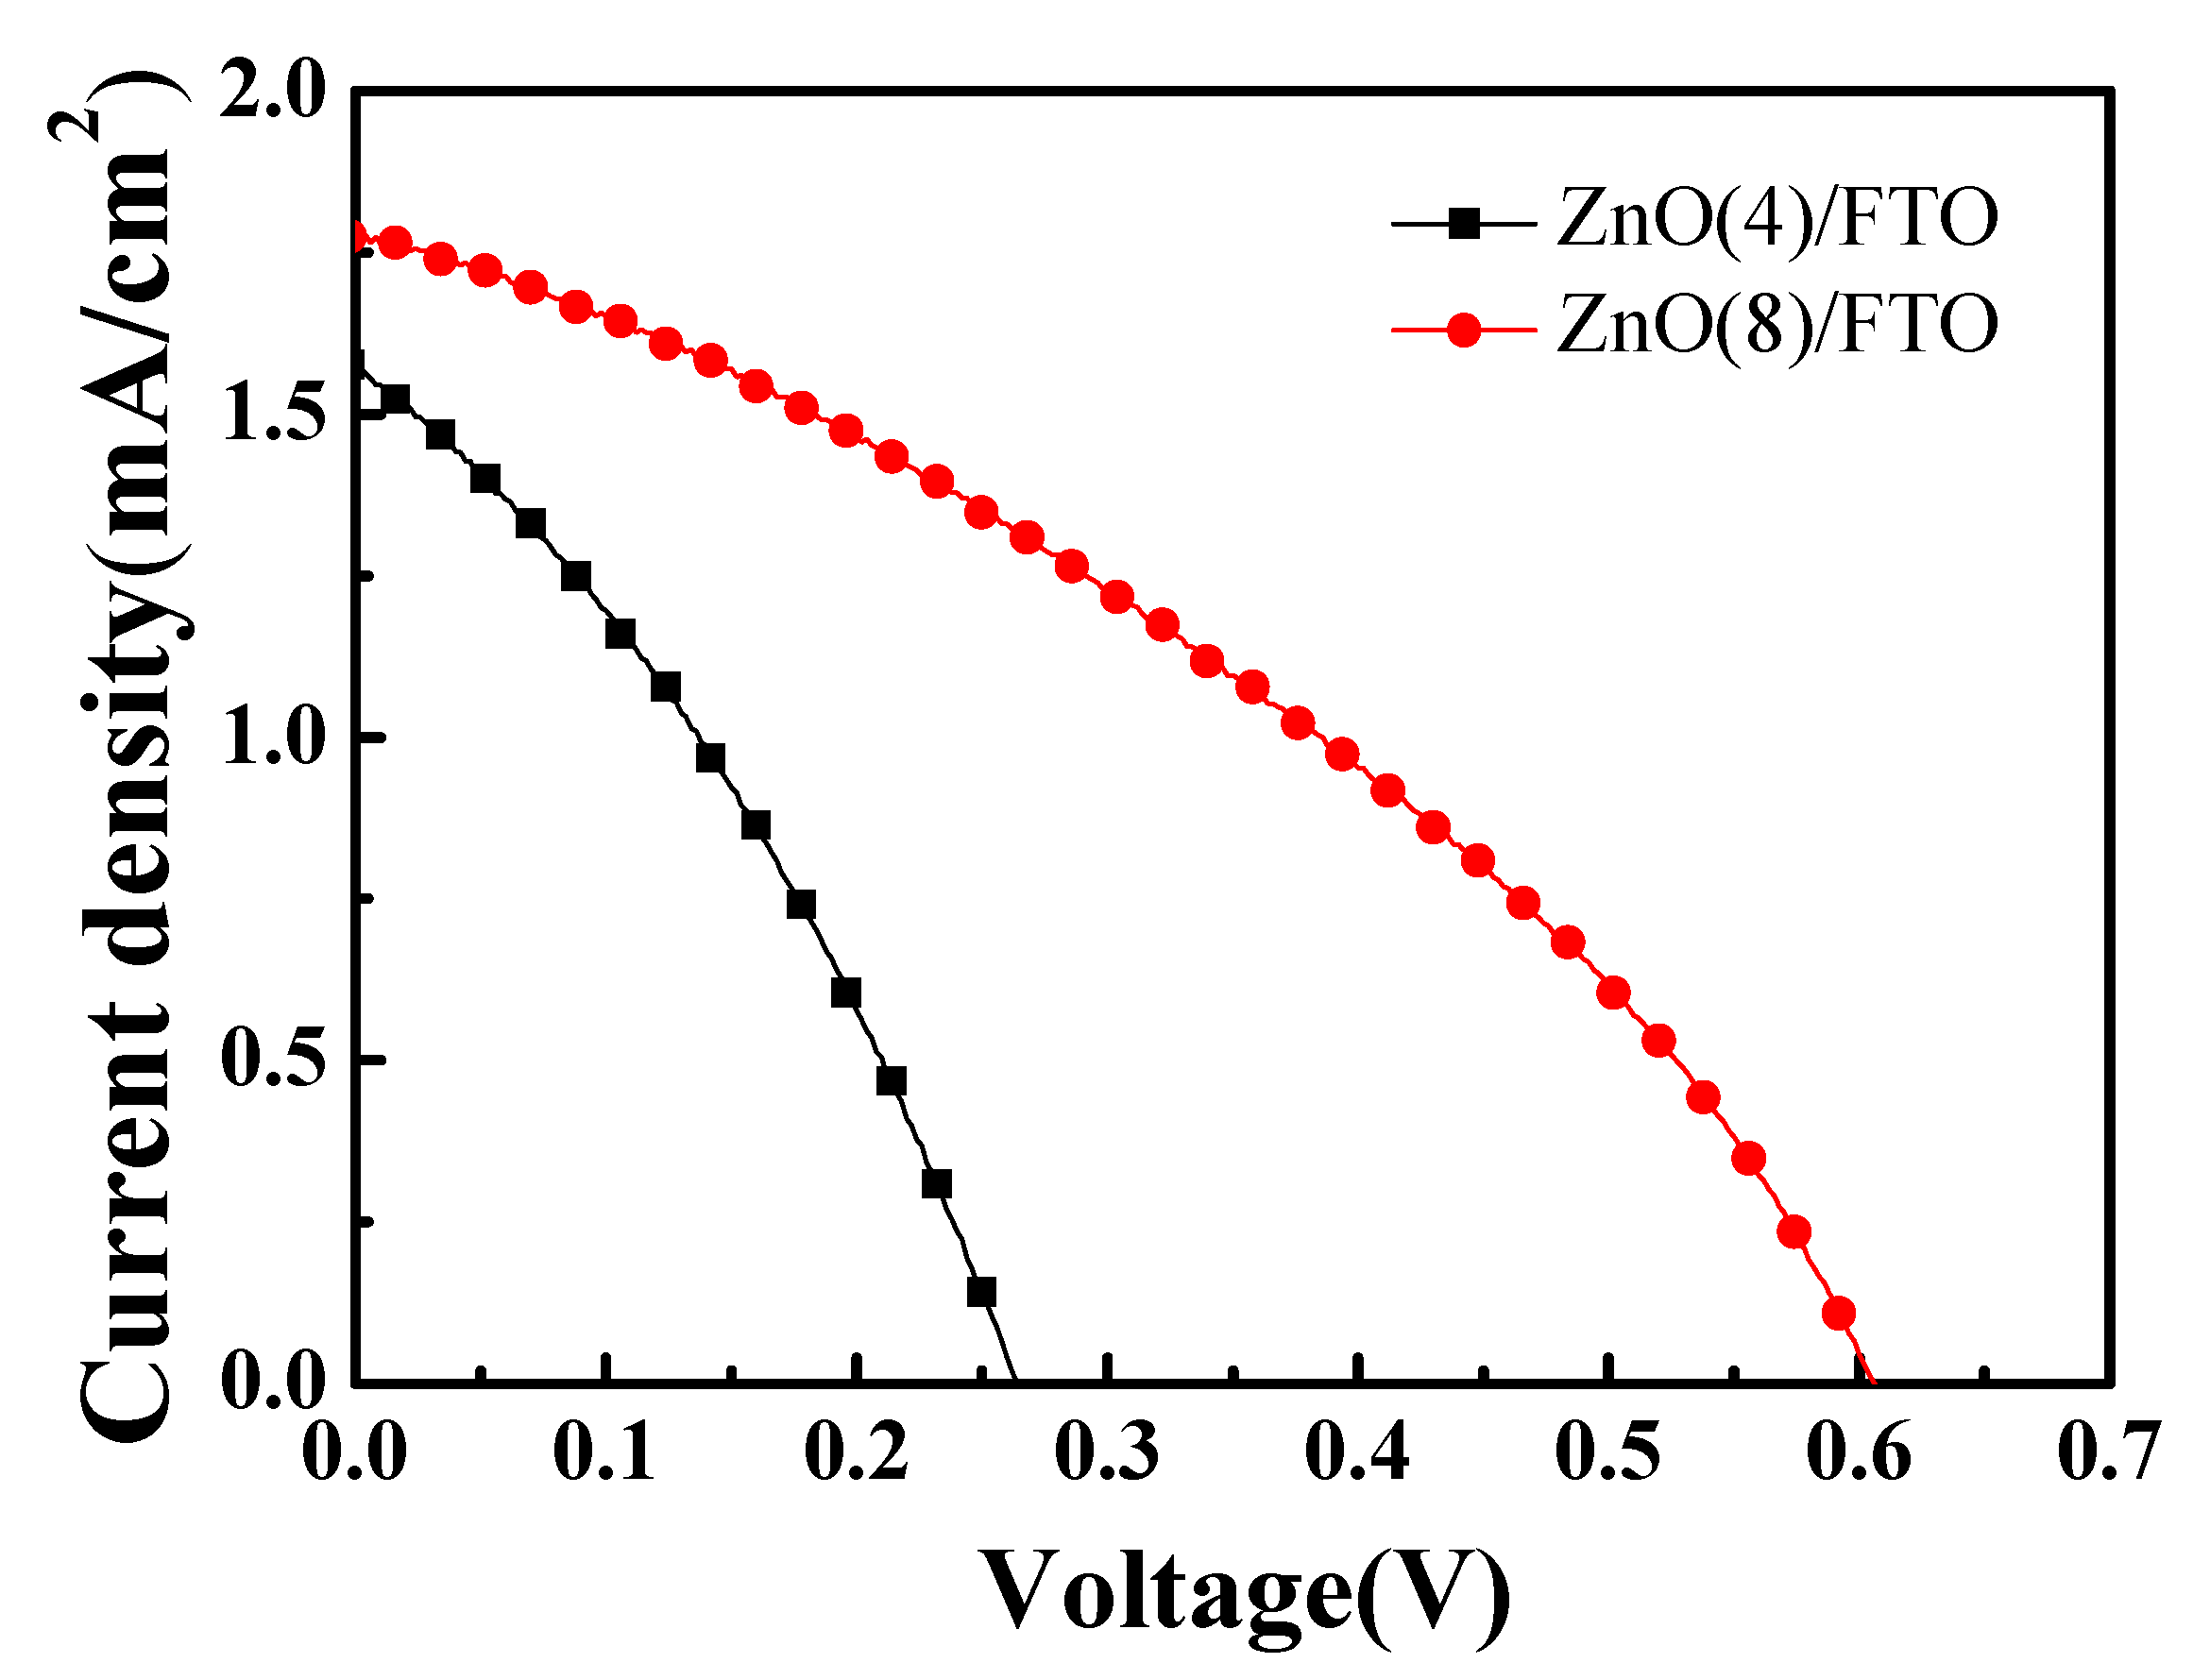
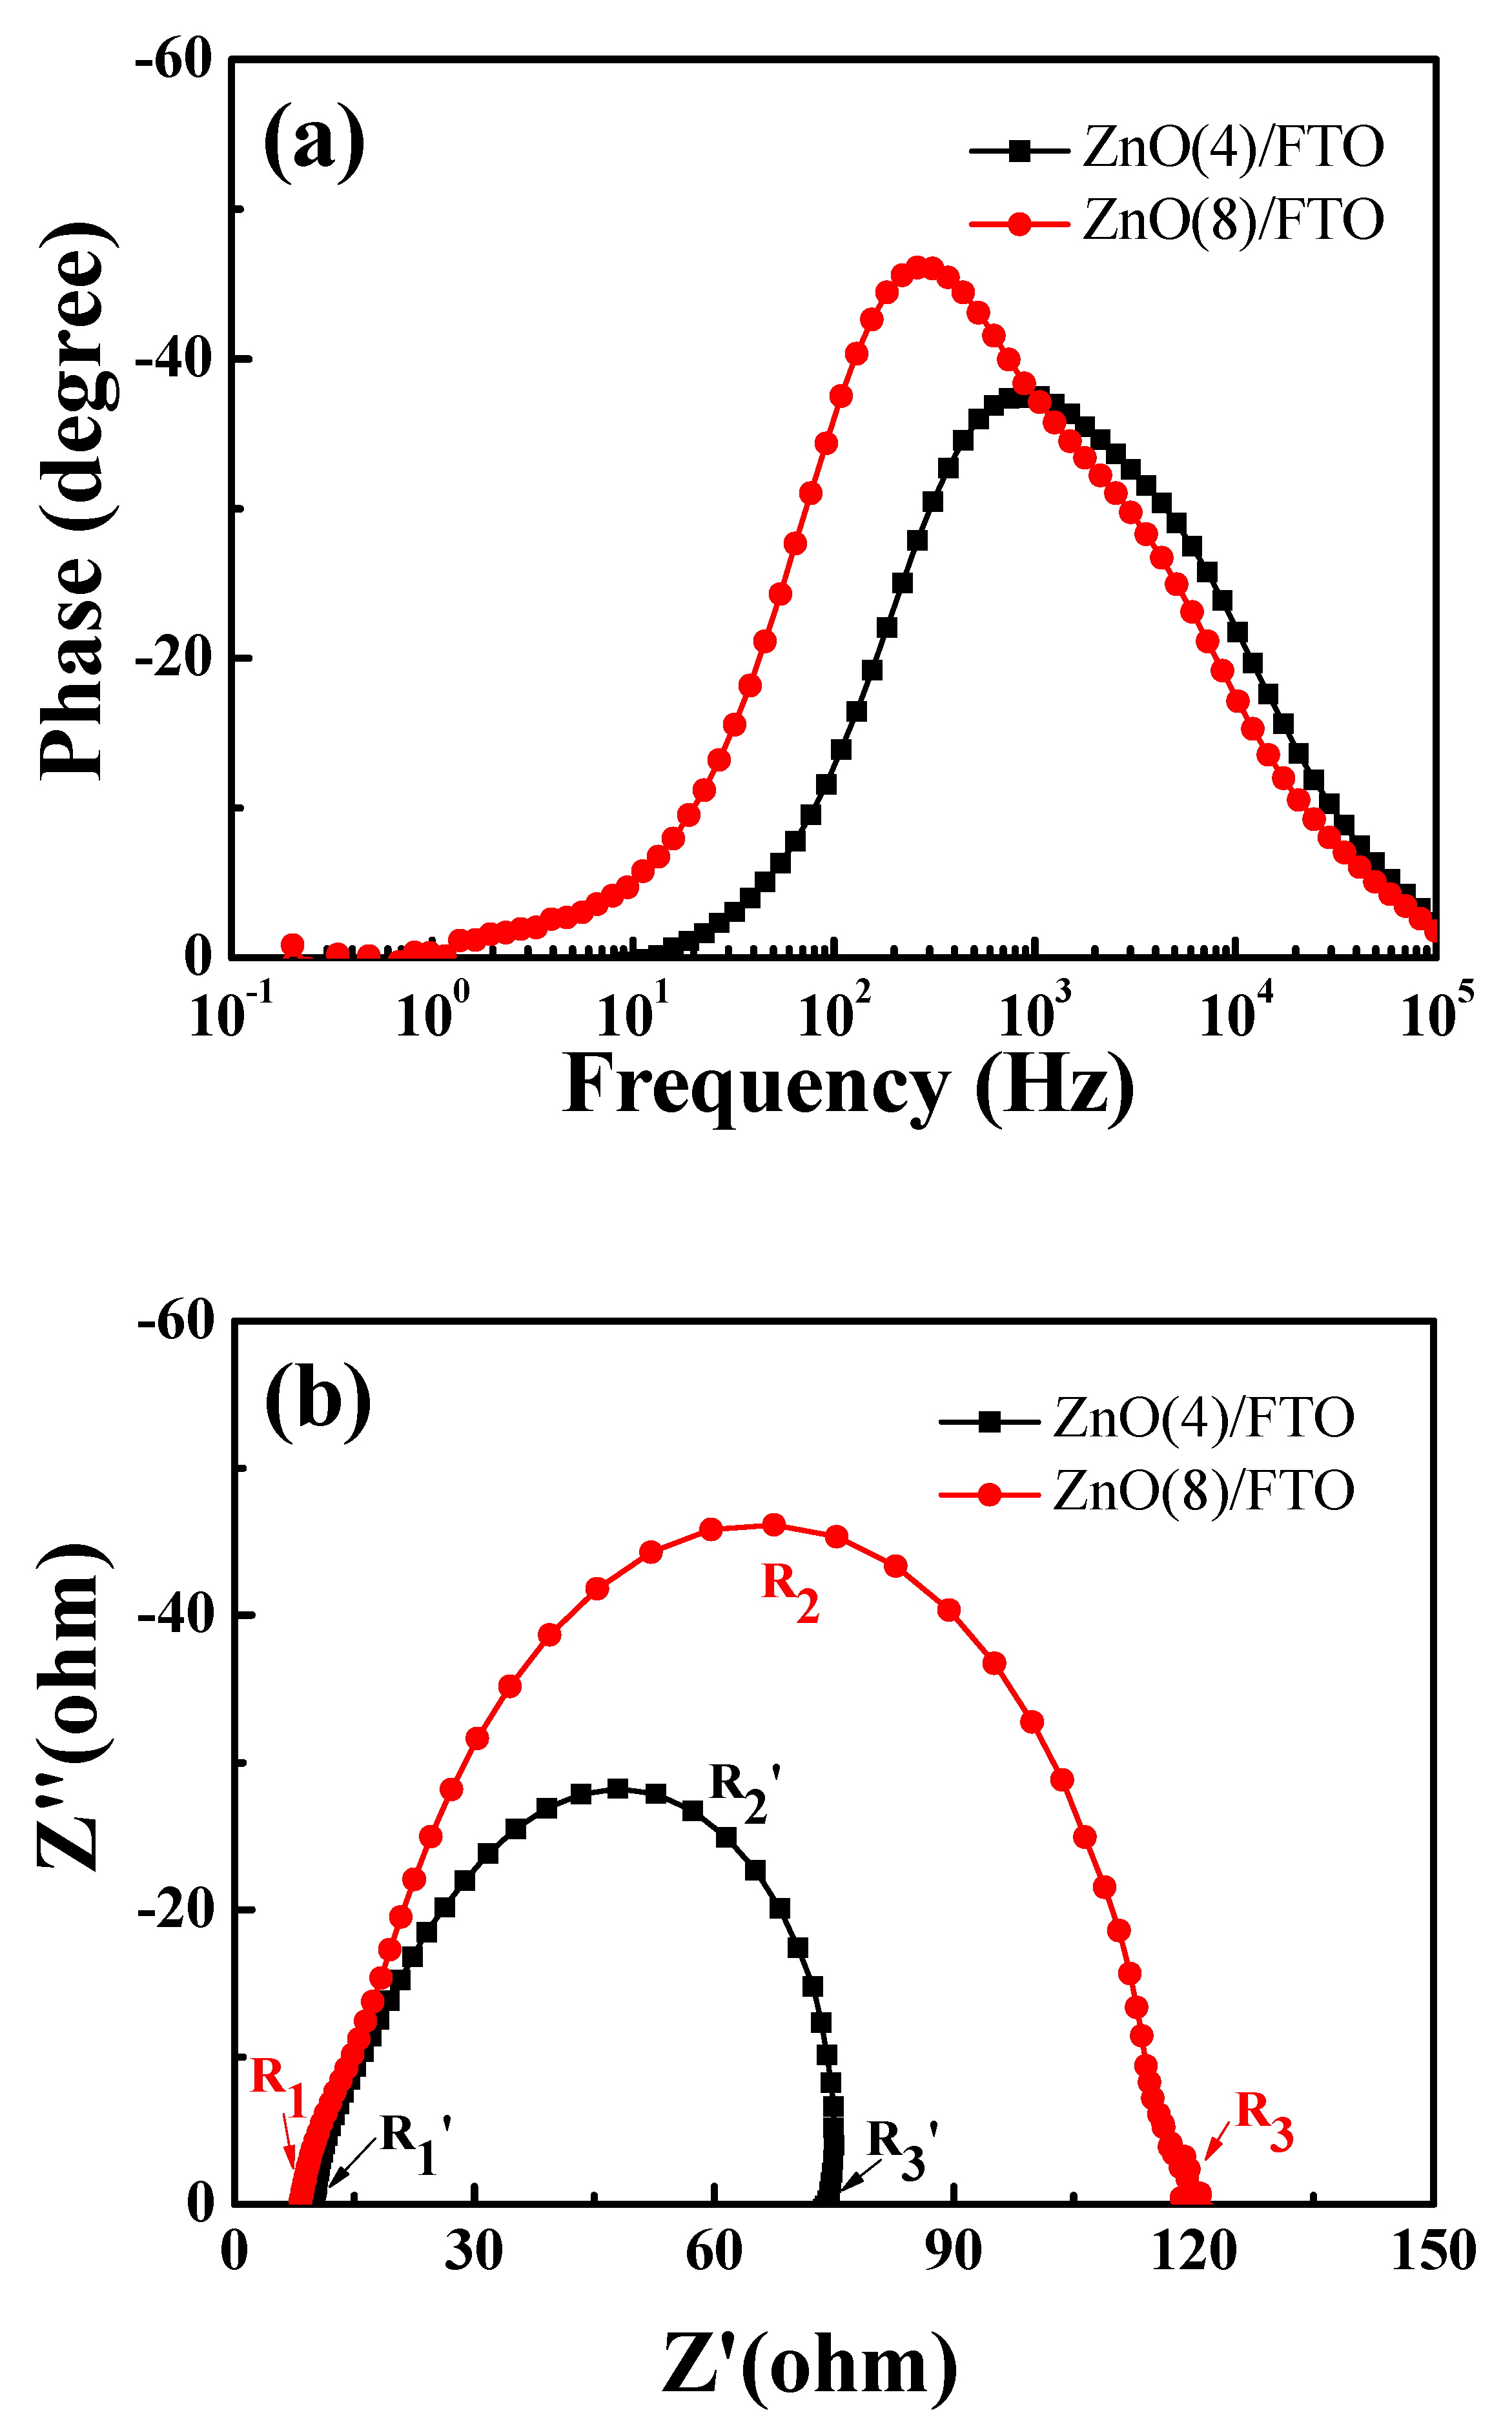
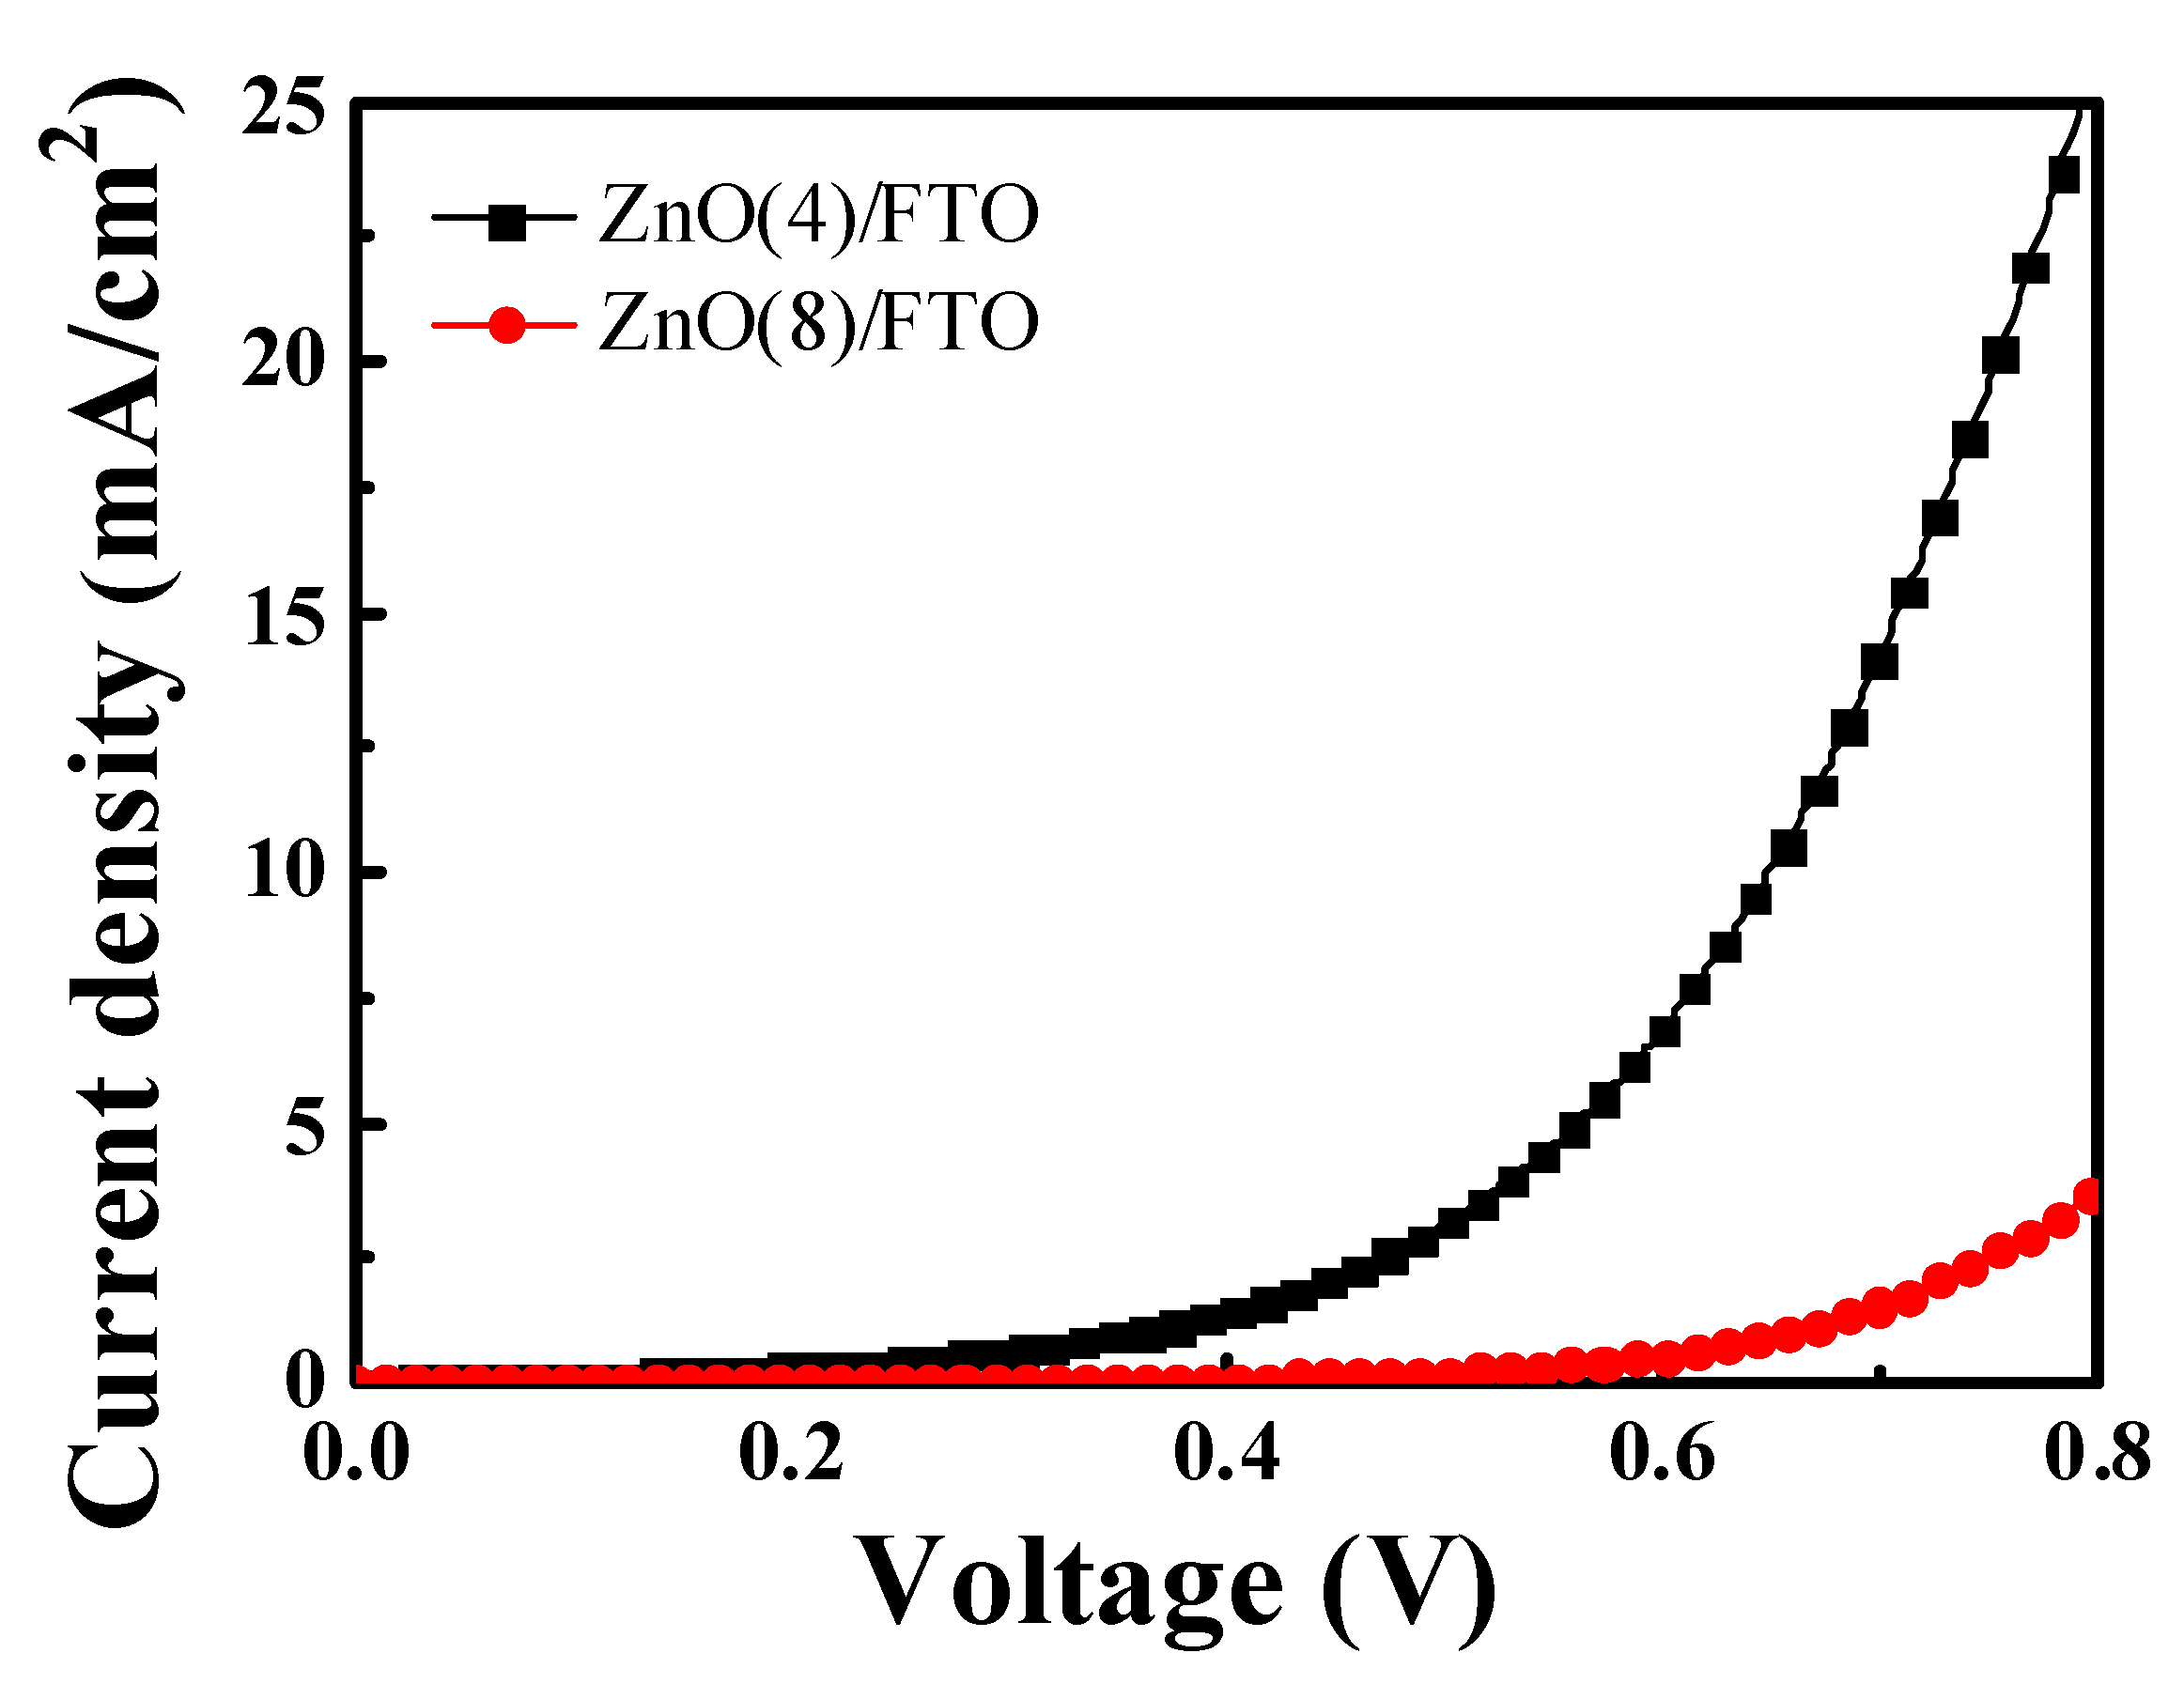
3.2. Photovoltaic Performance of DSSCs with ZnO Nanoflowers and Microrods

The ZnO-coated FTO glass was dipped in the ethanolic solution (0.05 mM) of N719 dyes, sensitizing the nanoflowers and microrods and thereby producing sensitized ZnO(4, 6, 8 or 10)/FTO photoelectrodes, where “(4)” indicates that the growth time of ZnO was 4 h. DSSCs were fabricated using the sensitized ZnO/FTO photoelectrodes, and the effects of the growth time on the cell performance were investigated. Four cells were fabricated for each growth time and the PCE of each cell was measured. Among the four cells fabricated for each growth time, one that showed a PCE similar to the averaged value was chosen. Variation curves of cell performance as a function of the growth time are illustrated in Figure 4. Detailed photovoltaic parameters are compared in Figure S1 and Table S1 in the Supplementary Information. Relatively low PCEs were recorded in the DSSCs based on the nanoflowers and microrods. This could be due to the randomly distributed ZnO layers that interrupted the transfer of photo-injected electrons to FTO electrodes compared to those that were vertically aligned. The open-circuit voltage (Voc) values increased with increased growth time, while the fill factor (FF) values were reduced. The Jsc value of the DSSCs remained similar for growth times of 4–8 h, but decreased sharply for 10 h growth time. Overall, the highest PCE value was observed at a growth time of 8 h. In order to explore the higher efficiency of the ZnO(8)/FTO DSSC, we set the ZnO(4)/FTO DSSC as a reference cell. This is because the ZnO(4)/FTO DSSC contains the largest number of nanoflowers among our ZnO/FTO samples.
Figure 5 presents the current density (J) and voltage (V) curves of the ZnO(8)/FTO and the ZnO(4)/FTO DSSCs. The DSSC performance is compared in Table 1. The DSSC with the ZnO(8)/FTO photoelectrode showed a PCE of 0.341%, while the reference cell with the ZnO(4)/FTO showed a PCE of 0.182%. The improved PCE was mostly due to the increment of the Voc. A significant increase in Voc of the ZnO(8)/FTO cell is notable compared to the reference cell. Under constant illumination, the Voc value of DSSCs can be expressed as a function of the quasi-Fermi level (EFn) and to the dark value (EF0). This is related to the thermal energy (kBT; 4.11 × 10⁻²¹ J at 25 °C), the Boltzmann constant (kB), the absolute temperature (T), the positive elementary charge (e; 1.602 × 10⁻¹⁹ C), the concentration in the dark (n0), and the free electron density in the ZnO photoelectrode (n), as represented in Equation (5) [16,17,18]:
Voc = (EFnEF0)/e = (kBT/e)·ln(n/n0)
It can be seen from Equation (5) that Voc and n are closely correlated. In addition, n is affected by both the electron injection from the photoexcited dyes to the ZnO conduction bands and the charge recombination between photoinjected electrons and triiodide anion in the electrolyte. Therefore, higher electron injection and lesser back electron transfer is necessary to increase n and thereby to improve Voc. To estimate electron injection in the ZnO/FTO photoelectrodes, we measured amounts of N719 dyes adsorbed on the surface of ZnO nanoflowers and microrods using the Beer–Lambert equation [19,20,21]. The adsorbed amounts of dyes, which were measured using 5 cells, for the ZnO(8)/FTO and the ZnO(4)/FTO photoelectrodes averaged 2.43 × 10⁻⁵ and 6.33 × 10⁻⁵ mol/cm3, respectively. About a 60% reduction in the dye-loading amount was observed in the ZnO(8)–ZnO/FTO compared to the ZnO(4)/FTO. A decrease in the adsorption of N719 dyes on the photoelectrodes could lead to generating fewer electrons and holes, reducing the total number of photoinjected electrons in the device and thus lowering the n value.
The reduced charge recombination on the interface of the nano- and micro-structured ZnO and electrolyte increased the n value and thereby the Voc value. To confirm this, we conducted EIS measurements. EIS is a powerful tool for investigating the charge transport kinetics and the charge recombination in DSSCs [22,23,24,25]. The results measured at −0.7 V in the dark are shown in Figure S2 in the Supplementary Information section. The Bode phase plots of the EIS spectra for the DSSCs with the ZnO(4)/FTO and the ZnO(8)/FTO electrodes are displayed in Figure 6a. The EIS Bode phase plots of the DSSCs with the ZnO(4)/FTO and the ZnO(8)/FTO gave peak frequencies (fmax) of 1060 and 277 Hz, respectively. The electron lifetime estimated from the equation (τn = 1/2πfmax) [23,24] was determined to be 0.150 and 0.575 ms for the DSSCs with the ZnO(4)/FTO and the ZnO(8)/FTO photoelectrodes, respectively. A prolonged lifetime (an approximately 380% increase) of the electrons injected to ZnO from the dyes was obtained for the ZnO(8)/FTO cell, as compared to that of the reference device. The Nyquist plots of the EIS spectra for the DSSCs are presented in Figure 6b. The Nyquist plots typically include three semicircles: the first semicircle (R1) corresponds to the redox reaction at the Pt counter electrode, the second one (R2) corresponds to the electron transfer at the ZnO/dye/electrolyte interface, and the third one (R1) corresponds to the carrier transport by ions in the electrolytes [24,25,26]. It was noted that by the extended growth time the impedance component of R2 in the medium-frequency region was increased. The larger semicircle of R2 indicates a more delayed charge recombination at the dye-sensitized ZnO/electrolyte interface [24,27]. This can be elucidated by the reduced surface area of the ZnO(8)/FTO, as compared in Figure 2. In other words, by extending the growth time from 4 to 8 h, the number of nanoflowers (high surface area) was decreased, whilst the number of microrods (relatively low surface area) was increased. The decreased surface area induced a reduction of contact area between ZnO layers and electrolytes, retarding the charge recombination reaction [2e (ZnO) + I3 → 3I].
The dark currents can be utilized to evaluate the interfacial charge recombination in DSSCs [27,28,29]. Increased growth time decreased the dark currents, as illustrated in Figure S3 in the Supplementary Information section. Figure 7 shows the dark currents of the ZnO(4)/FTO and the ZnO(8)/FTO DSSCs as a function of the applied potential. Throughout the range of measured potential, the dark currents of the ZnO(8)/FTO DSSC were lower than those of the reference cell. During measurements of dark currents, electrons injected from FTO to the ZnO conduction band transferred through the ZnO layer and then recombined with electrolytes. The lowered current density in the device with the ZnO(8)/FTO thus indicated that the charge recombination rate between injected electrons and triiodide ions was retarded compared with the rate of the reference cell with the ZnO(4)/FTO. The observation of the retarded charge recombination was consistent with the results of the EIS measurements. The prolonged electron lifetime (Bode plots) and the retardation of interfacial charge recombination (Nyquist plots and dark currents) thus indicated that the n value was increased with extended growth time and thereby the Voc value.
The Jsc value of the ZnO(8)/FTO DSSC (1.577 mA/cm2) is very similar to that of the reference device with the ZnO(4)/FTO (1.572 mA/cm2). The Jsc value is determined by Equation (6) [5,6]:
Jsc = ∫LHE(λ)·ηinj·ηcol
where LHE is the light harvesting efficiency of dyes at a given wavelength(λ), ηinj is the electron injection efficiency from excited dyes, and ηcoll is the electron collection efficiencies of the photoinjected electrons to the FTO electrode.
The LHE is related to the light absorbance (A) of the dyes adsorbed on the ZnO surface, i.e., LHE = 1 − 10−A [30,31]. Thus, the amount of adsorbed dyes should be measured to investigate the effects of the LHE on the Jsc value. As mentioned previously, the amount of N719 dyes adsorbed on the ZnO(8)/FTO decreased by approximately 60%, compared to the ZnO(4)/FTO, due to the decreased surface area of ZnO. This indicates that extended growth time could decrease the LHE.
The value of ηcol depends on the interfacial charge recombination of photoinjected electrons. In other words, more electrons can be collected on the transparent FTO electrode by reducing the charge recombination. As discussed above, EIS and dark current measurements show that by extending the growth time from 4 to 8 h, the lifetime of photoinjected electrons was prolonged and the charge recombination was retarded. This was favorable for increasing the ηcoll value. Therefore, the Jsc value of the cell with the ZnO(8)/FTO was similar to that of the reference device because the decrease in the LHE was offset by an increase in the ηcol.
By extending the growth time, the FF value of the DSSC decreased to 35.77% from 43.94% of the reference device. Generally, the FF value is influenced by the shunt (Rsh) and series (Rse) resistances. In other words, an increase of Rsh and a reduction of Rse, or both, could improve the FF value [32,33,34]. The Rsh and Rse values were acquired from the slope of the JV curves at Jsc and Voc, respectively [32,33], as compared in Table 1. The Rsh value of the DSSC with the ZnO(8)/FTO improved by 973.1 Ωcm2 compared to that of the reference cell (345.7 Ωcm2). The increase in Rsh can be explained by the delayed charge recombination between photo-injected electrons and triiodide ions in the device with the ZnO(8)/FTO [33,34], as demonstrated in both the EIS and the dark current measurements. Meanwhile, the Rse value of the cell with the ZnO(8)/FTO (131.4 Ωcm2) was measured to be higher than that of the reference device (97.8 Ωcm2). This can be better explained by the larger gaps between ZnO microrods in the ZnO(8)/FTO than those between nanoflowers in the ZnO(4)/FTO, causing interruption of electron transport. Thus, the elevation of Rse, as compared to the reference device, can be attributed to the decrease in the FF value of the ZnO(8)/FTO DSSC.

4. Conclusions

ZnO nanoflowers and microrods fabricated by CBD at 90 °C were sensitized with N719 dyes and the resulting films were employed for photoanodes of DSSCs. The ZnO(8)/FTO DSSC (microrod-rich) showed a significant increase in the Voc resulting in a PCE of 0.341% (Voc = 0.606 V, Jsc = 1.577 mA/cm2, and FF = 35.77%), as compared to those of the reference ZnO(4)/FTO DSSC (nanoflower-rich) (PCE = 0.182%; Voc = 0.264 V, Jsc = 1.572 mA/cm2, and FF = 43.94%). This increase in the Voc, and thereby the PCE, was attributed to a retardation of the interfacial charge recombination. This study therefore suggests that the growth temperature and time of ZnO determine the nanostructure and morphology and ZnO microrods improve the PCEs of ZnO-based DSSCs more effectively than ZnO nanoflowers.

Supplementary Materials

The following are available online at https://www.mdpi.com/2079-4991/9/12/1645/s1, Figure S1: JV characteristics of DSSCs with ZnO/FTO photoelectrodes, Table S1: Photovoltaic parameters of DSSCs with ZnO/FTO photoelectrodes, Figure S2: EIS spectra of the DSSCs with the ZnO/FTO photoelectrodes; (a) Bode and (b) Nyquist plots measured at −0.7 V in the dark, Figure S3: Dark current–voltage characteristics of DSSCs with ZnO/FTO photoelectrodes.

Author Contributions

Conceptualization, D.-H.K. and Y.S.H.; formal analysis, S.I.C. and H.K.S.; investigation, S.-J.L. and W.H.K.; writing—original draft preparation, Y.S.H.; writing—review and editing, D.-H.K.

Funding

This work was supported by the KETEP and the Ministry of Trade, Industry & Energy (No.20173010012980). This work was also supported by the National Research Foundation of Korea (NRF) grant funded by the Korea government (MSIT) (No. NRF-2019R1F1A1058801).

Conflicts of Interest

The authors declare no conflicts of interest.

References

  1. Sharma, K.; Sharma, V.; Sharma, S.S. Dye-Sensitized Solar Cells: Fundamentals and Current Status. Nanoscale Res. Lett. 2018, 13, 381. [Google Scholar] [CrossRef] [PubMed]
  2. Berger, P.R.; Kim, M. Polymer solar cells: P3HT:PCBM and beyond. J. Renew. Sustain. Energy 2018, 10, 013508. [Google Scholar] [CrossRef]
  3. Wang, R.; Mujahid, M.; Duan, Y.; Wang, Z.K.; Xue, J.; Yang, Y. A Review of Perovskites Solar Cell Stability. Adv. Funct. Mater. 2019, 1808843. [Google Scholar] [CrossRef]
  4. O’Regan, B.; Grätzel, M. A low-cost, high-efficiency solar cell based on dye-sensitized colloidal TiO2 films. Nature 1991, 353, 737–740. [Google Scholar] [CrossRef]
  5. Anta, J.A.; Guillén, E.; Tena-Zaera, R. ZnO-based dye-sensitized solar cells. J. Phys. Chem. C 2012, 116, 11413–11425. [Google Scholar] [CrossRef]
  6. Vittal, R.; Ho, K.C. Zinc oxide based dye-sensitized solar cells: A review. Renew. Sustain. Energy Rev. 2017, 70, 920–935. [Google Scholar] [CrossRef]
  7. Bazazi, S.; Arsalani, N.; Khataee, A.; Tabrizi, A.G. Comparison of ball milling-hydrothermal and hydrothermal methods for synthesis of ZnO nanostructures and evaluation of their photocatalytic performance. J. Ind. Eng. Chem. 2018, 62, 265–272. [Google Scholar] [CrossRef]
  8. Lee, J.; Chae, J.; Nahm, K.; Kang, M. Synthesis of nanometer-sized hexagonal disk-shaped ZnO in formic acid using a hydrothermal method and its optical properties. J. Ind. Eng. Chem. 2009, 15, 645–648. [Google Scholar] [CrossRef]
  9. Memarian, N.; Concina, I.; Braga, A.; Rozati, S.M.; Vomiero, A.; Sberveglieri, G. Hierarchically assembled ZnO nanocrystallites for high-efficiency dye-sensitized solar cells. Angew. Chem. Int. Ed. 2011, 50, 12321–12325. [Google Scholar] [CrossRef]
  10. Tsubomura, H.; Matsumura, M.; Nomura, Y.; Amamiya, T. Dye sensitised Zinc oxide: Aqueous electrolyte: Platinum photocell. Nature 1976, 261, 402–403. [Google Scholar] [CrossRef]
  11. Nayeri, F.D.; Soleimani, E.A.; Salehi, F. Synthesis and characterization of ZnO nanowires grown on different seed layers: The application for dye-sensitized solar cells. Renew. Energy 2013, 60, 246–255. [Google Scholar] [CrossRef]
  12. Chung, J.; Moon, H.; Bhang, S.H.; Kim, W.S.; Bong, K.W.; Yu, T. Aqueous-phase synthesis of single crystal ZnO nanobolts. J. Ind. Eng. Chem. 2016, 36, 59–65. [Google Scholar] [CrossRef]
  13. Umar, A.; Akhtar, M.S.; Almas, T.; Ibrahim, A.A.; Al-Assiri, M.S.; Masuda, Y.; Rahman, Q.I.; Baskoutas, S. Direct Growth of Flower-Shaped ZnO Nanostructures on FTO Substrate for Dye-Sensitized Solar Cells. Crystals 2019, 9, 405. [Google Scholar] [CrossRef]
  14. Nirmal Peiris, T.A.; Alessa, H.; Sagu, J.S.; Ahmad Bhatti, I.; Isherwood, P.; Upul Wijayantha, K.G. Effect of ZnO seed layer thickness on hierarchical ZnO nanorod growth on flexible substrates for application in dye-sensitised solar cells. J. Nanopart. Res. 2013, 15, 2115. [Google Scholar] [CrossRef]
  15. Wang, D.; Zhang, Y.; Su, M.; Xu, T.; Yang, H.; Bi, S.; Zhang, X.; Fang, Y.; Zhao, J. Design of Morphology-Controllable ZnO Nanorods/Nanopariticles Composite for Enhanced Performance of Dye-Sensitized Solar Cells. Nanomaterials 2019, 9, 931. [Google Scholar] [CrossRef] [PubMed]
  16. Peng, T.; Shi, W.; Wu, S.; Ying, Z.; Ri, J.H. Sea urchin-like TiO2 microspheres as scattering layer of nanosized TiO2 film-based dye-sensitized solar cell with enhanced conversion efficiency. Mater. Chem. Phys. 2015, 164, 238–245. [Google Scholar] [CrossRef]
  17. Zaban, A.; Greenshtein, M.; Bisquert, J. Determination of the electron lifetime in nanocrystalline dye solar cells by open-circuit voltage decay measurements. ChemPhysChem 2003, 4, 859–864. [Google Scholar] [CrossRef] [PubMed]
  18. Darvishzadeh, P.; Babanezhad, M.; Ahmadi, R.; Gorji, N.E. Modeling the degradation/recovery of open-circuit voltage in perovskite and thin film solar cells. Mater. Des. 2017, 114, 339–344. [Google Scholar] [CrossRef]
  19. Alarcόn, H.; Hedlund, M.; Johansson, E.M.J.; Rensmo, H.; Hagfeldt, A.; Boschloo, G. Modification of Nanostructured TiO2 Electrodes by Electrochemical Al3+ Insertion: Effects on Dye-Sensitized Solar Cell Performance. J. Phys. Chem. C 2007, 111, 13267–13274. [Google Scholar] [CrossRef]
  20. Lee, K.E.; Gomez, M.A.; Charbonneau, C.; Demopoulos, G.P. Enhanced surface hydroxylation of nanocrystalline anatase films improves photocurrent output and electron lifetime in dye sensitized solar cell photoanodes. Electrochim. Acta 2012, 67, 208–215. [Google Scholar] [CrossRef]
  21. Kim, J.T.; Han, Y.S. Effects of surface-modified photoelectrode on the power conversion efficiency of dye-sensitized solar cells. Met. Mater. Int. 2014, 20, 571–575. [Google Scholar] [CrossRef]
  22. Sarker, S.; Seo, H.W.; Seo, D.W.; Kim, D.M. Electrochemical impedance spectroscopy of dye-sensitized solar cells with different electrode geometry. J. Ind. Eng. Chem. 2017, 45, 56–60. [Google Scholar] [CrossRef]
  23. Kim, K.S.; Song, H.; Nam, S.H.; Kim, S.M.; Jeong, H.; Kim, W.B.; Jung, G.Y. Fabrication of an Efficient Light-Scattering Functionalized Photoanode Using Periodically Aligned ZnO Hemisphere Crystals for Dye Sensitized Solar Cells. Adv. Mater. 2012, 24, 792–798. [Google Scholar] [CrossRef] [PubMed]
  24. Zhao, J.; Sun, B.; Qiu, L.; Caocen, H.; Li, Q.; Chen, X.; Yan, F.J. Efficient light-scattering functionalized TiO2 photoanodes modified with cyanobiphenyl-based benzimidazole for dye-sensitized solar cells with additive-free electrolytes. Mater. Chem. 2012, 22, 18380–18386. [Google Scholar] [CrossRef]
  25. Cheng, F.; Ou, Y.; Liu, G.; Zhao, L.; Dong, B.; Wang, S.; Wen, S. Novel quasi-solid-state electrolytes based on electrospun poly(vinylidene fluoride) fiber membranes for highly efficient and stable dye-sensitized solar cells. Nanomaterials 2019, 9, 783. [Google Scholar] [CrossRef]
  26. Kim, J.T.; Lee, S.H.; Han, Y.S. Enhanced power conversion efficiency of dye-sensitized solar cells with Li2SiO3-modified photoelectrode. Appl. Surf. Sci. 2015, 333, 134–140. [Google Scholar] [CrossRef]
  27. Tian, H.; Hu, L.; Zhang, C.; Liu, W.; Huang, Y.; Mo, L.; Guo, L.; Sheng, J.; Dai, S. Retarded Charge Recombination in Dye-Sensitized Nitrogen-Doped TiO2 Solar Cells. J. Phys. Chem. C 2010, 114, 1627–1632. [Google Scholar] [CrossRef]
  28. Chen, S.G.; Chappel, S.; Diamant, Y.; Zaban, A. Preparation of Nb2O5 Coated TiO2 Nanoporous Electrodes and Their Application in Dye-Sensitized Solar Cells. Chem. Mater. 2001, 13, 4629–4634. [Google Scholar] [CrossRef]
  29. Diamant, Y.; Chen, S.G.; Melamed, O.; Zaban, A. Core-shell nanoporous electrode for dye sensitized solar cells: The effect of the SrTiO3 shell on the electronic properties of the TiO2 core. J. Phys. Chem. B 2003, 107, 1977–1981. [Google Scholar] [CrossRef]
  30. Hagfeldtt, A.; Boschloo, G.; Sun, L.; Kloo, L.; Petterson, H. Dye-sensitized solar cells. Chem. Rev. 2010, 110, 6595–6663. [Google Scholar] [CrossRef]
  31. Arkan, F.; Izadyar, M.; Nakhaeipour, A. The role of the electronic structure and solvent in the dye-sensitized solar cells based on Zn-porphyrins: Theoretical study. Energy 2016, 114, 559–567. [Google Scholar] [CrossRef] [Green Version]
  32. Lü, X.; Mou, X.; Wu, J.; Zhang, D.; Zhang, L.; Huang, F.; Xu, F.; Huang, S. Improved-performance dye-sensitized solar cells using Nb-doped TiO2 electrodes: Efficient electron injection and transfer. Adv. Funct. Mater. 2010, 20, 509–515. [Google Scholar] [CrossRef]
  33. Koide, N.; Islam, A.; Chiba, Y.; Han, L. Improvement of efficiency of dye-sensitized solar cells based on analysis of equivalent circuit. J. Photochem. Photobiol. A 2006, 182, 296–305. [Google Scholar] [CrossRef]
  34. Syrrokostas, G.; Leftheriotis, G.; Yianoulis, P. Effect of acidic additives on the structure and performance of TiO2 films prepared by a commercial nanopowder for dye-sensitized solar cells. Renew. Energy 2014, 72, 164–173. [Google Scholar] [CrossRef]
Figure 1. Structure of ZnO-based dye-sensitized solar cells (DSSC) and mechanism for light energy conversion into electric energy.
Nanomaterials 09 01645 g001
Figure 2. Top-view SEM images of the ZnO layer formed on the FTO glass for (a) 4 h, (b) 6 h, (c) 8 h, and (d) 10 h of growth time. Figures (e,f) are illustrations of nanoflowers and microrods, respectively.
Nanomaterials 09 01645 g002
Figure 3. Cross-sectional SEM images of ZnO layer formed on the FTO glass for (a) 4 h, (b) 6 h, (c) 8 h, and (d) 10 h growth time.
Nanomaterials 09 01645 g003
Figure 4. Variation of the photovoltaic performance with growth time: (a) Jsc, (b) Voc, (c) Fill factor (FF), and (d) PCE of the DSSCs measured under AM 1.5 irradiation.
Nanomaterials 09 01645 g004
Figure 5. JV characteristics of DSSCs with ZnO(4)/FTO and ZnO(8)/FTO photoelectrodes.
Nanomaterials 09 01645 g005
Figure 6. Electrochemical impedance spectroscopic (EIS) spectra of DSSCs with the ZnO(4)/FTO and the ZnO(8)/FTO photoelectrodes; (a) Bode and (b) Nyquist plots measured at −0.7 V in the dark.
Nanomaterials 09 01645 g006
Figure 7. Dark current-voltage characteristics of DSSCs with ZnO(4)/FTO and ZnO(8)/FTO photoelectrodes.
Nanomaterials 09 01645 g007
Table 1. Photovoltaic properties of DSSCs with ZnO(4)/FTO and ZnO(8)/FTO photoelectrodes.
Applied PhotoelectrodesVoc (mV)Jsc (mA/cm2)FF (%)η (%)Rse (Ωcm2)Rsh (Ωcm2)
ZnO(4)/FTO0.2641.57243.940.18297.8345.7
ZnO(8)/FTO0.6061.57735.770.341131.4973.1

