Domino Reaction for the Sustainable Functionalization of Few-Layer Graphene

 , ,
, , 

 ,
,  and
and 
Abstract
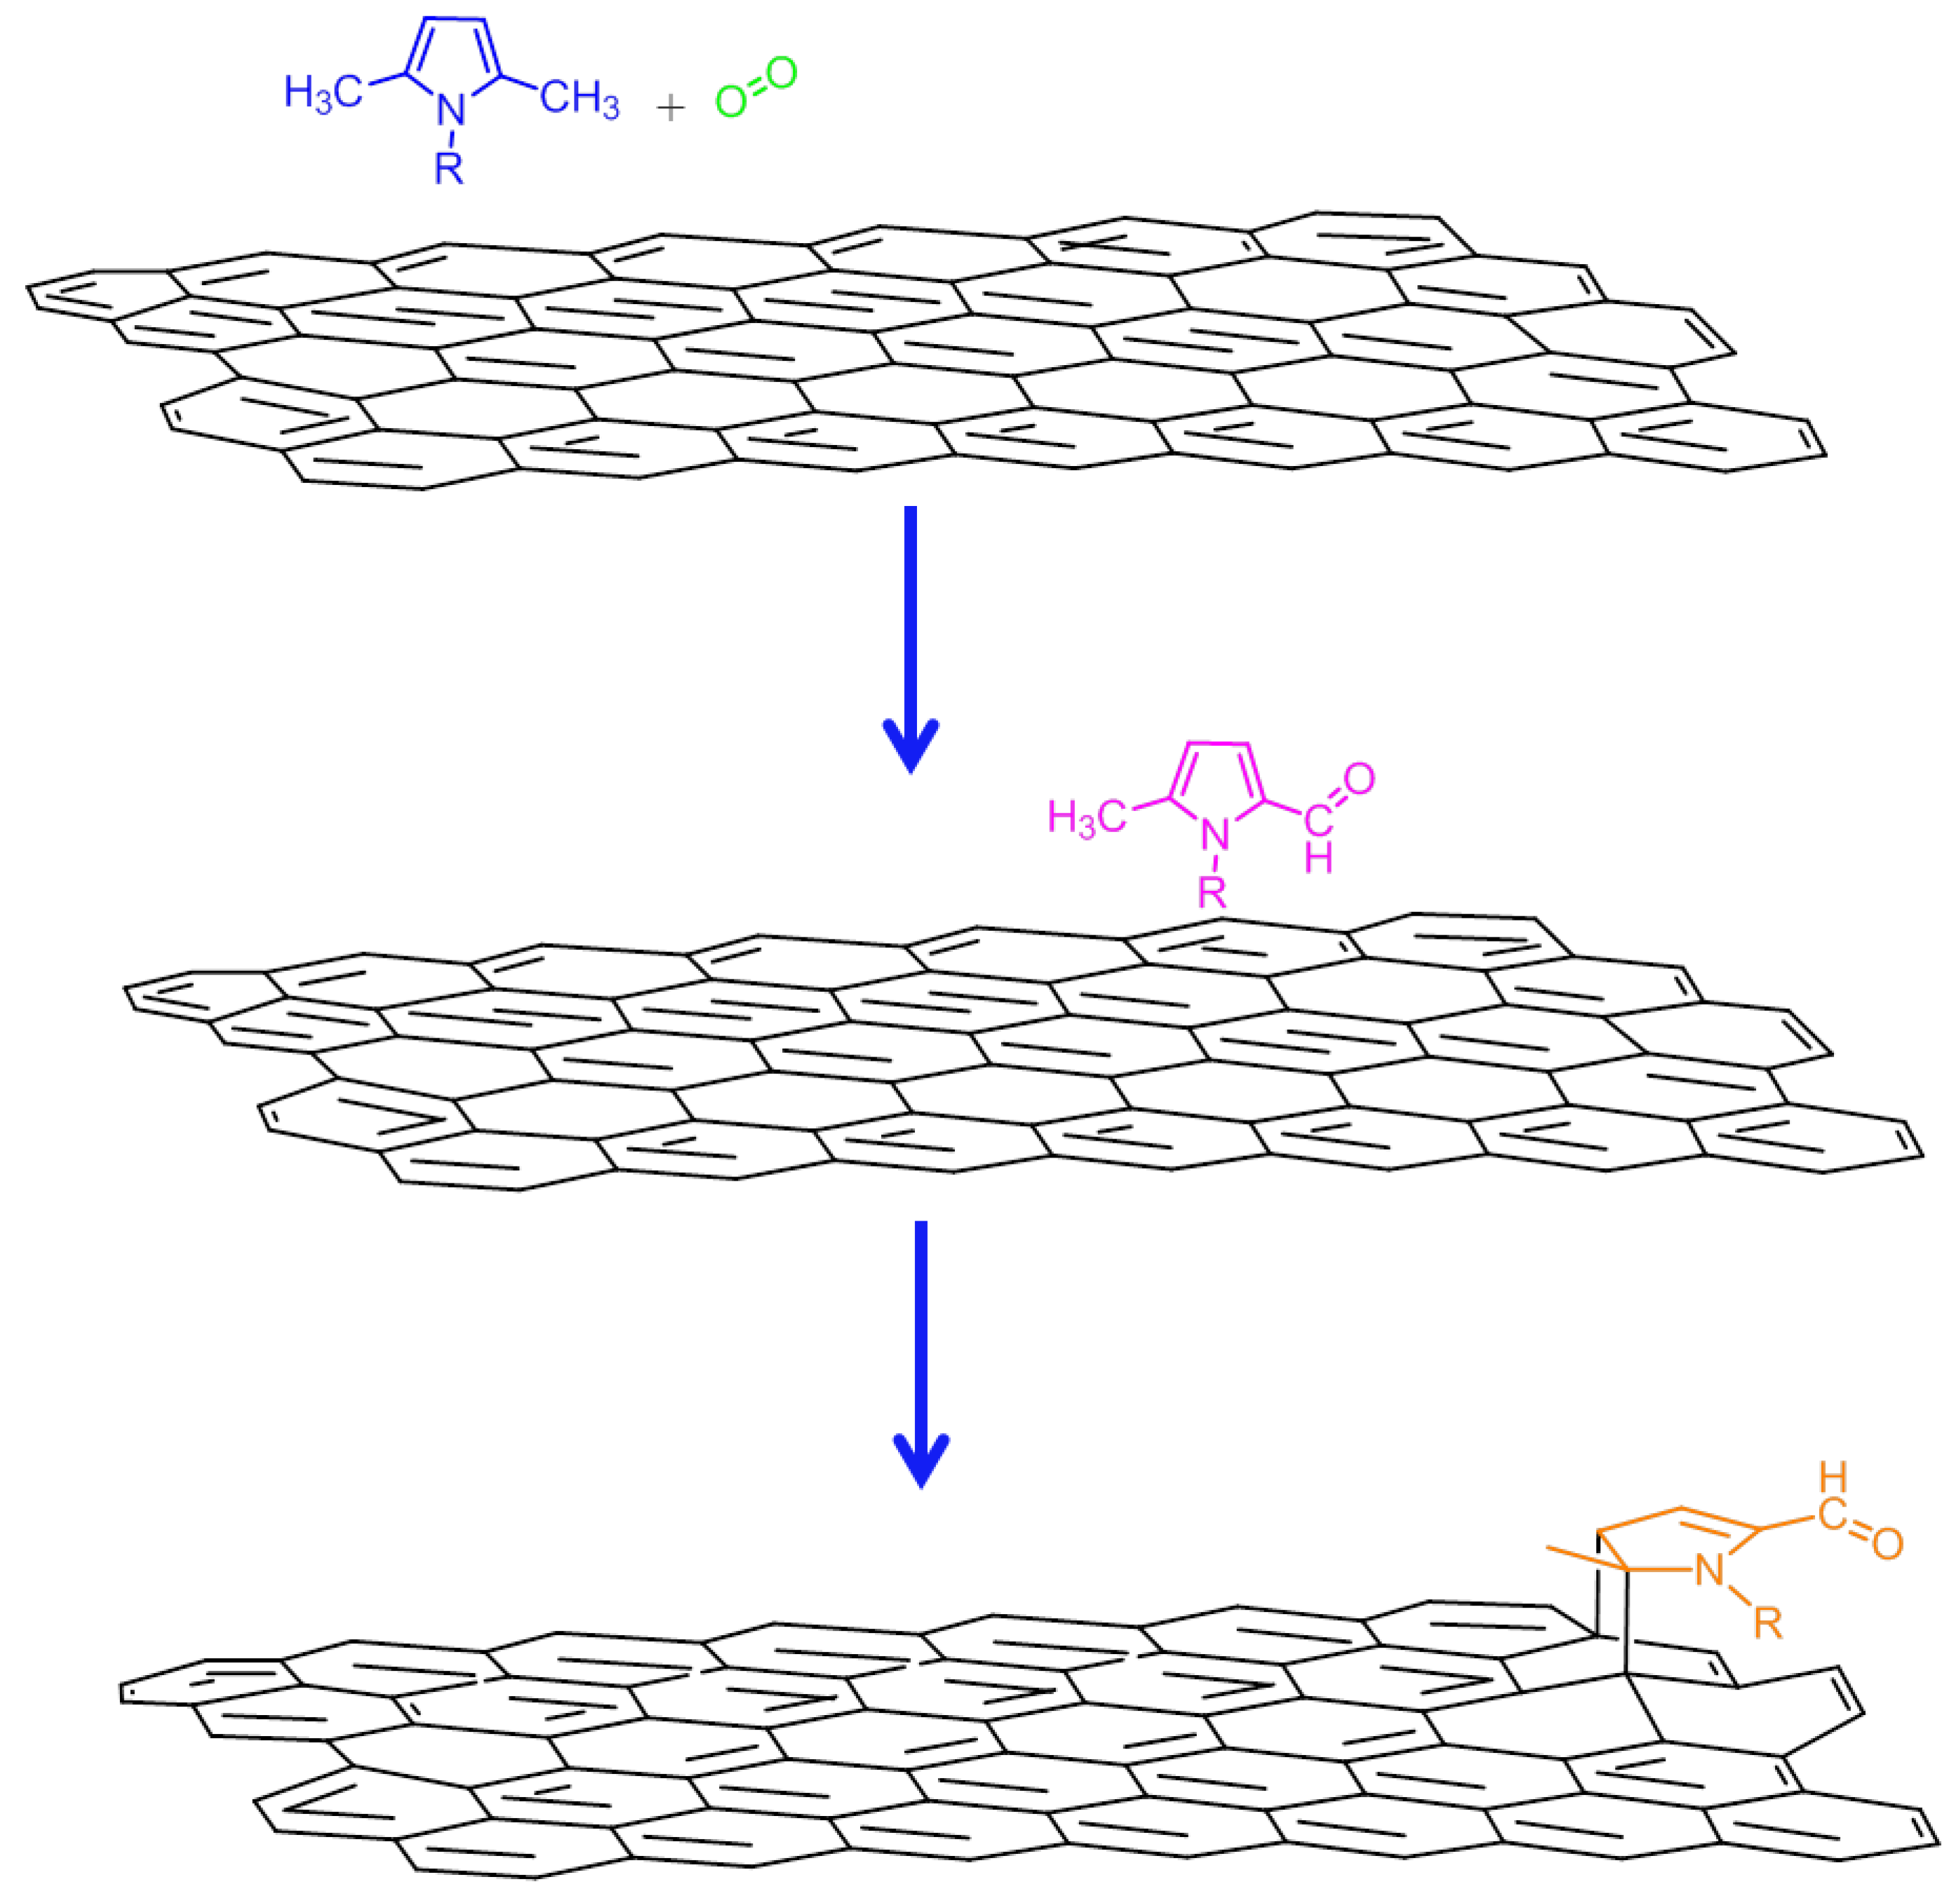
1. Introduction
2. Experimental Part
2.1. Materials and Syntheses
2.1.1. High Surface Area Graphite
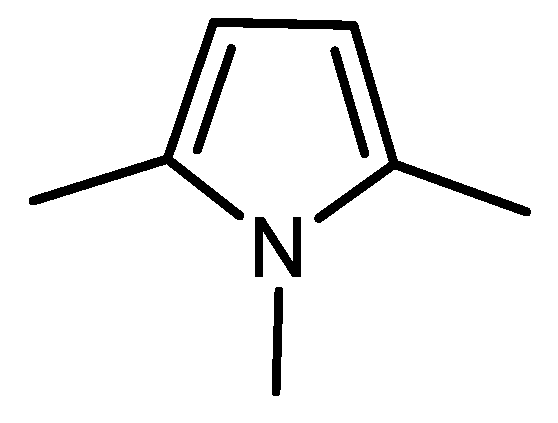
2.1.2. Synthesis of 1,2,5-Trimethylpyrrole
2.1.3. Synthesis of 1,2,5-Trimethylpyrrole on HSAG as Support
2.1.4. Thermal Treatments of 1,2,5-Trimethylpyrrole at Different Temperatures: 80 °C, 100 °C, 130 °C, 150 °C and 180 °C
General Procedure
TMP at 80 °C and 100 °C. TMP
TMP at 130 °C and 150 °C. TMP and Traces of DMP-CHO
TMP at 180 °C. Mixture of DMP-CHO/MP-(CHO)2/TMP (1/1/50)
2.1.5. Thermal Treatments of 1,2,5-Trimethylpyrrole Using a Catalytic Amount of HSAG at Different Temperatures: 80 °C, 100 °C, 130 °C, 150 °C and 180 °C
General Procedure
HSAG-TMP(cat) at 80 °C. Mixture of (DMP)2/TMP (1/10)
HSAG-TMP(cat) at 100 °C. Mixture of MP-(CHO)2/(DMP)2/TMP (1/15/3)
HSAG-TMP(cat) at 130 °C. Amide-CHO and Traces of Oligopyrroles
HSAG-TMP(cat) at 150°C. Mixture of DMP-CHO/MP-(CHO)2/(DMP)2/TMP (1/1/8/5)
HSAG-TMP(cat) at 180 °C. Mixture of DMP-CHO/MP-(CHO)2/(DMP)2/TMP (1/1/30/5)
2.1.6. Synthesis of HSAG-TMP Adducts (1:1 as Molar Ratio): 80 °C, 100 °C, 130 °C, 150 °C and 180 °C
General Procedure
- HSAG-TMP(1/1) at 80°C. Functionalization yield: 12 %.
- HSAG-TMP(1/1) at 100°C. Functionalization yield: 20 %.
- HSAG-TMP(1/1) at 130°C. Functionalization yield: 42 %.
- HSAG-TMP(1/1) at 150°C. Functionalization yield: 56 %.
- HSAG-TMP(1/1) at 180°C. Functionalization yield: 55 %.
2.2. Characterization of HSAG and Reaction Products
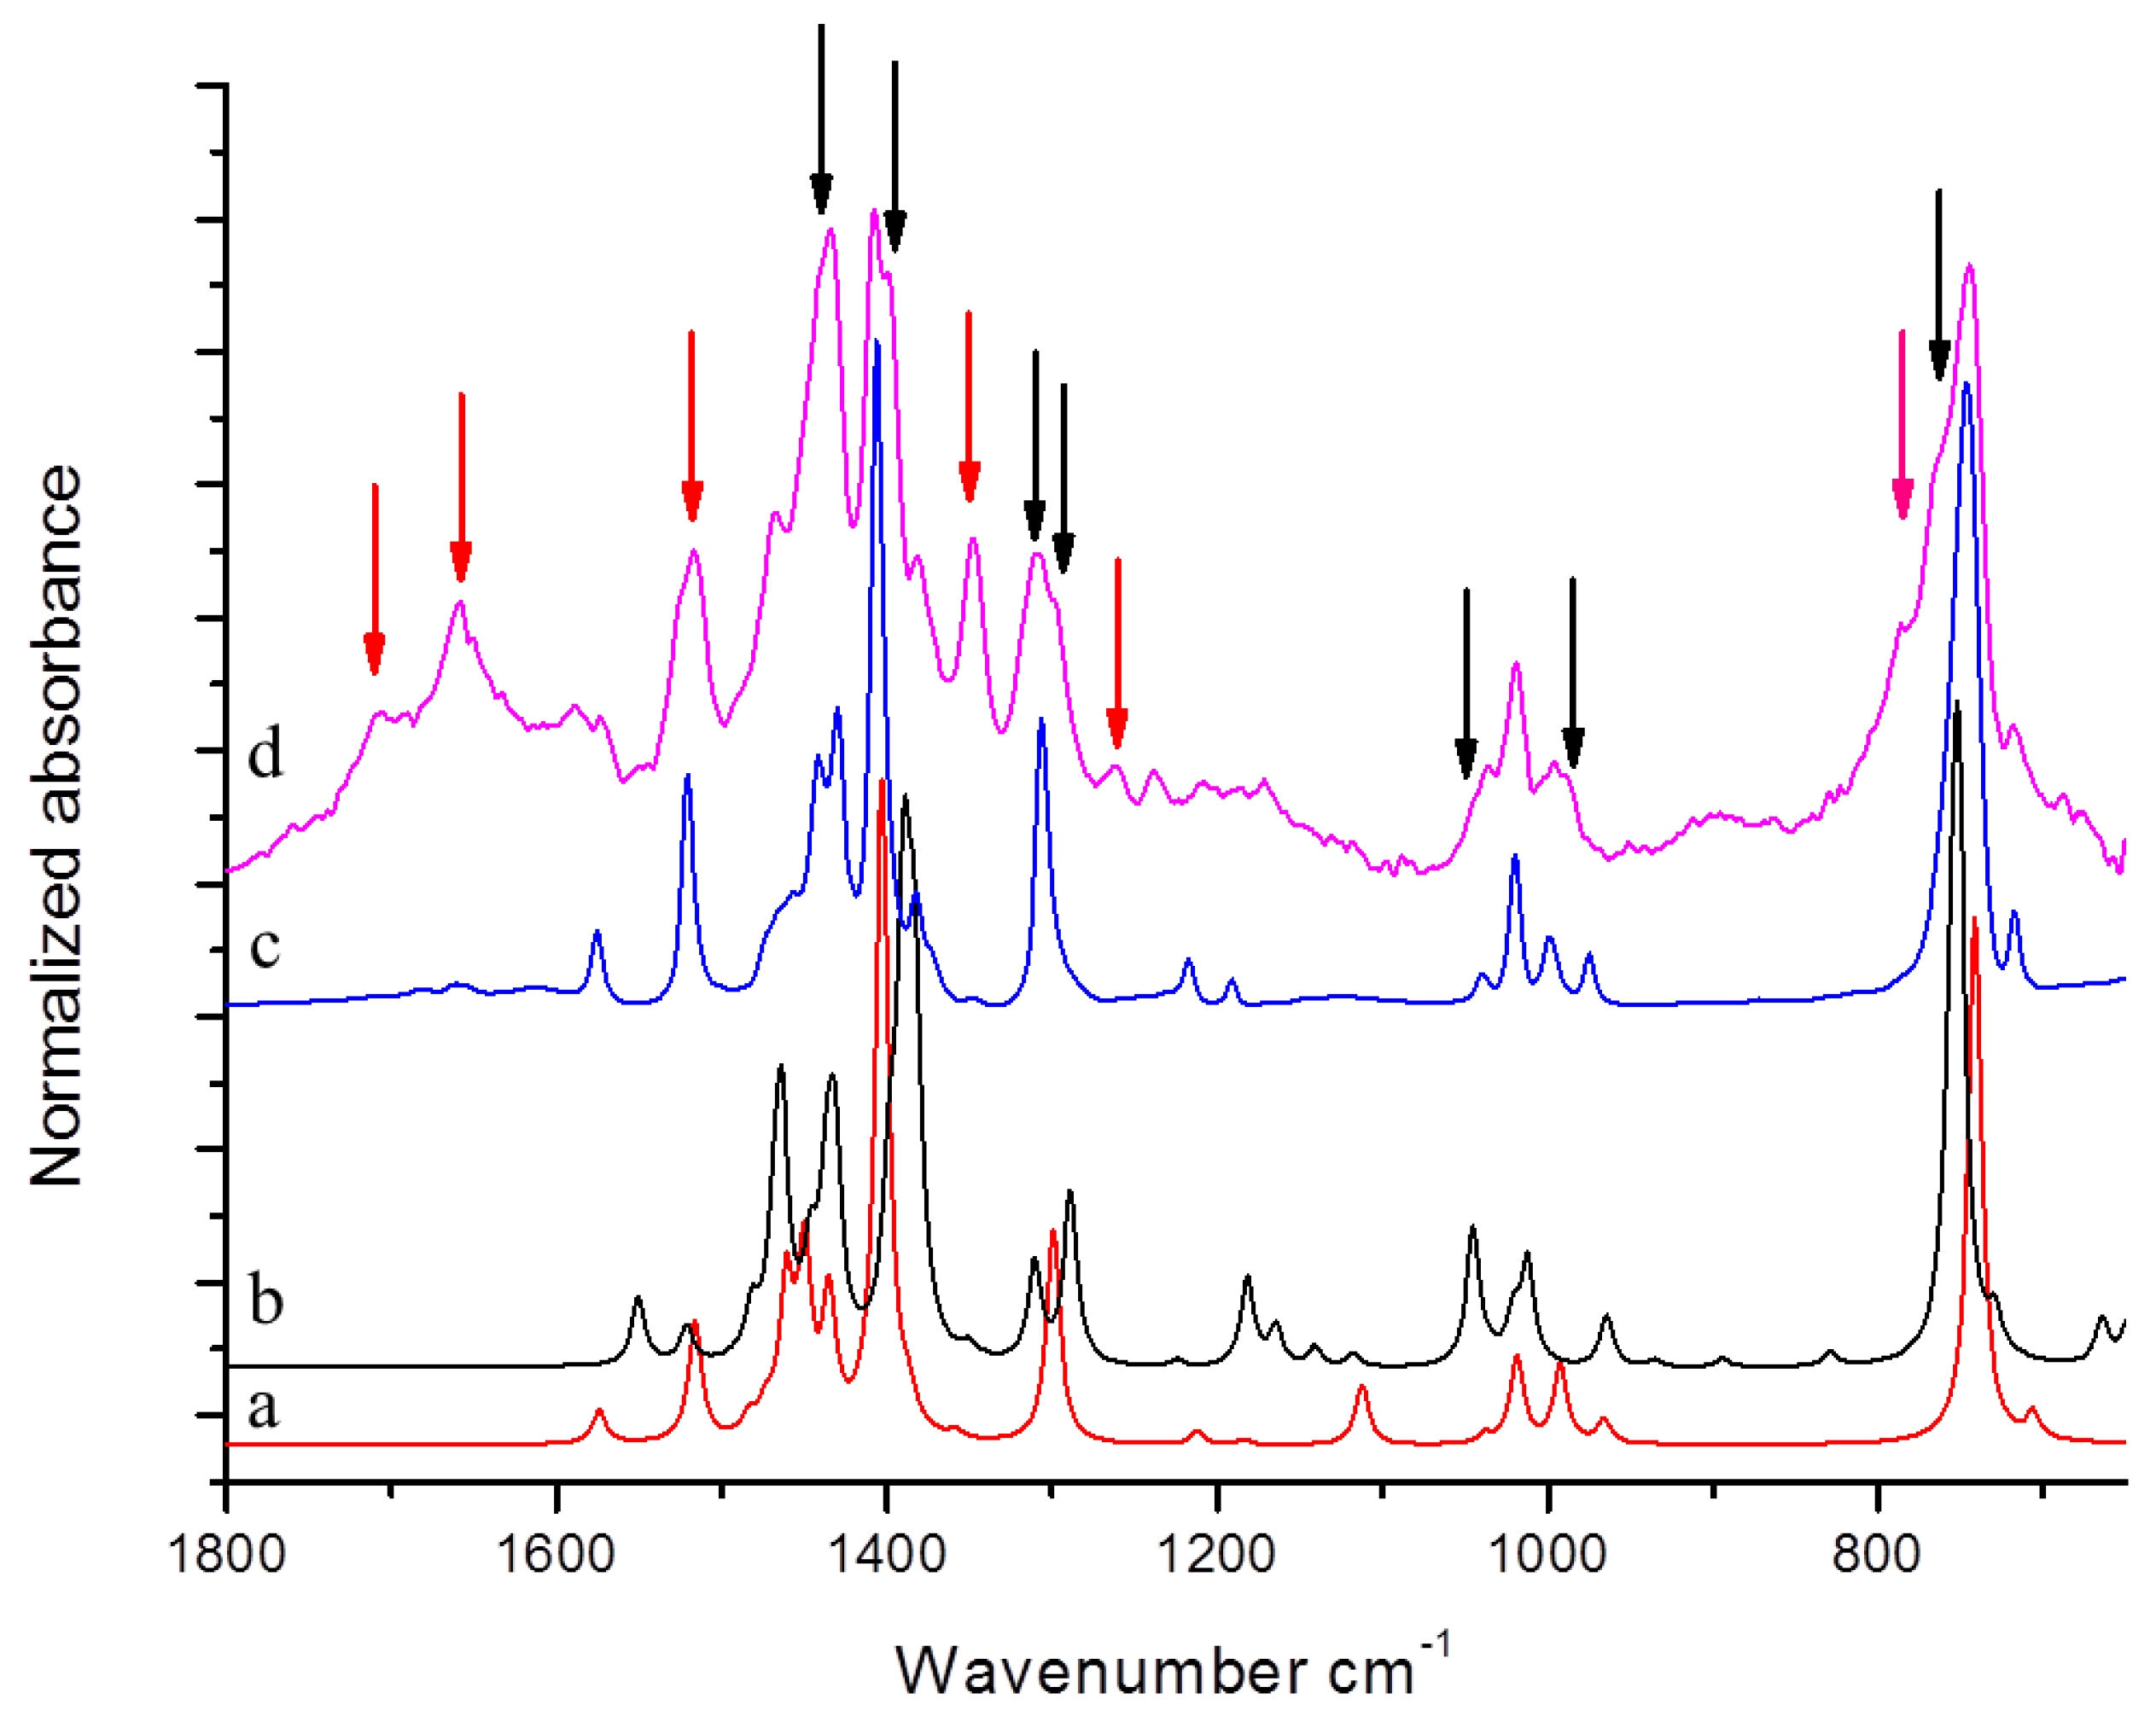
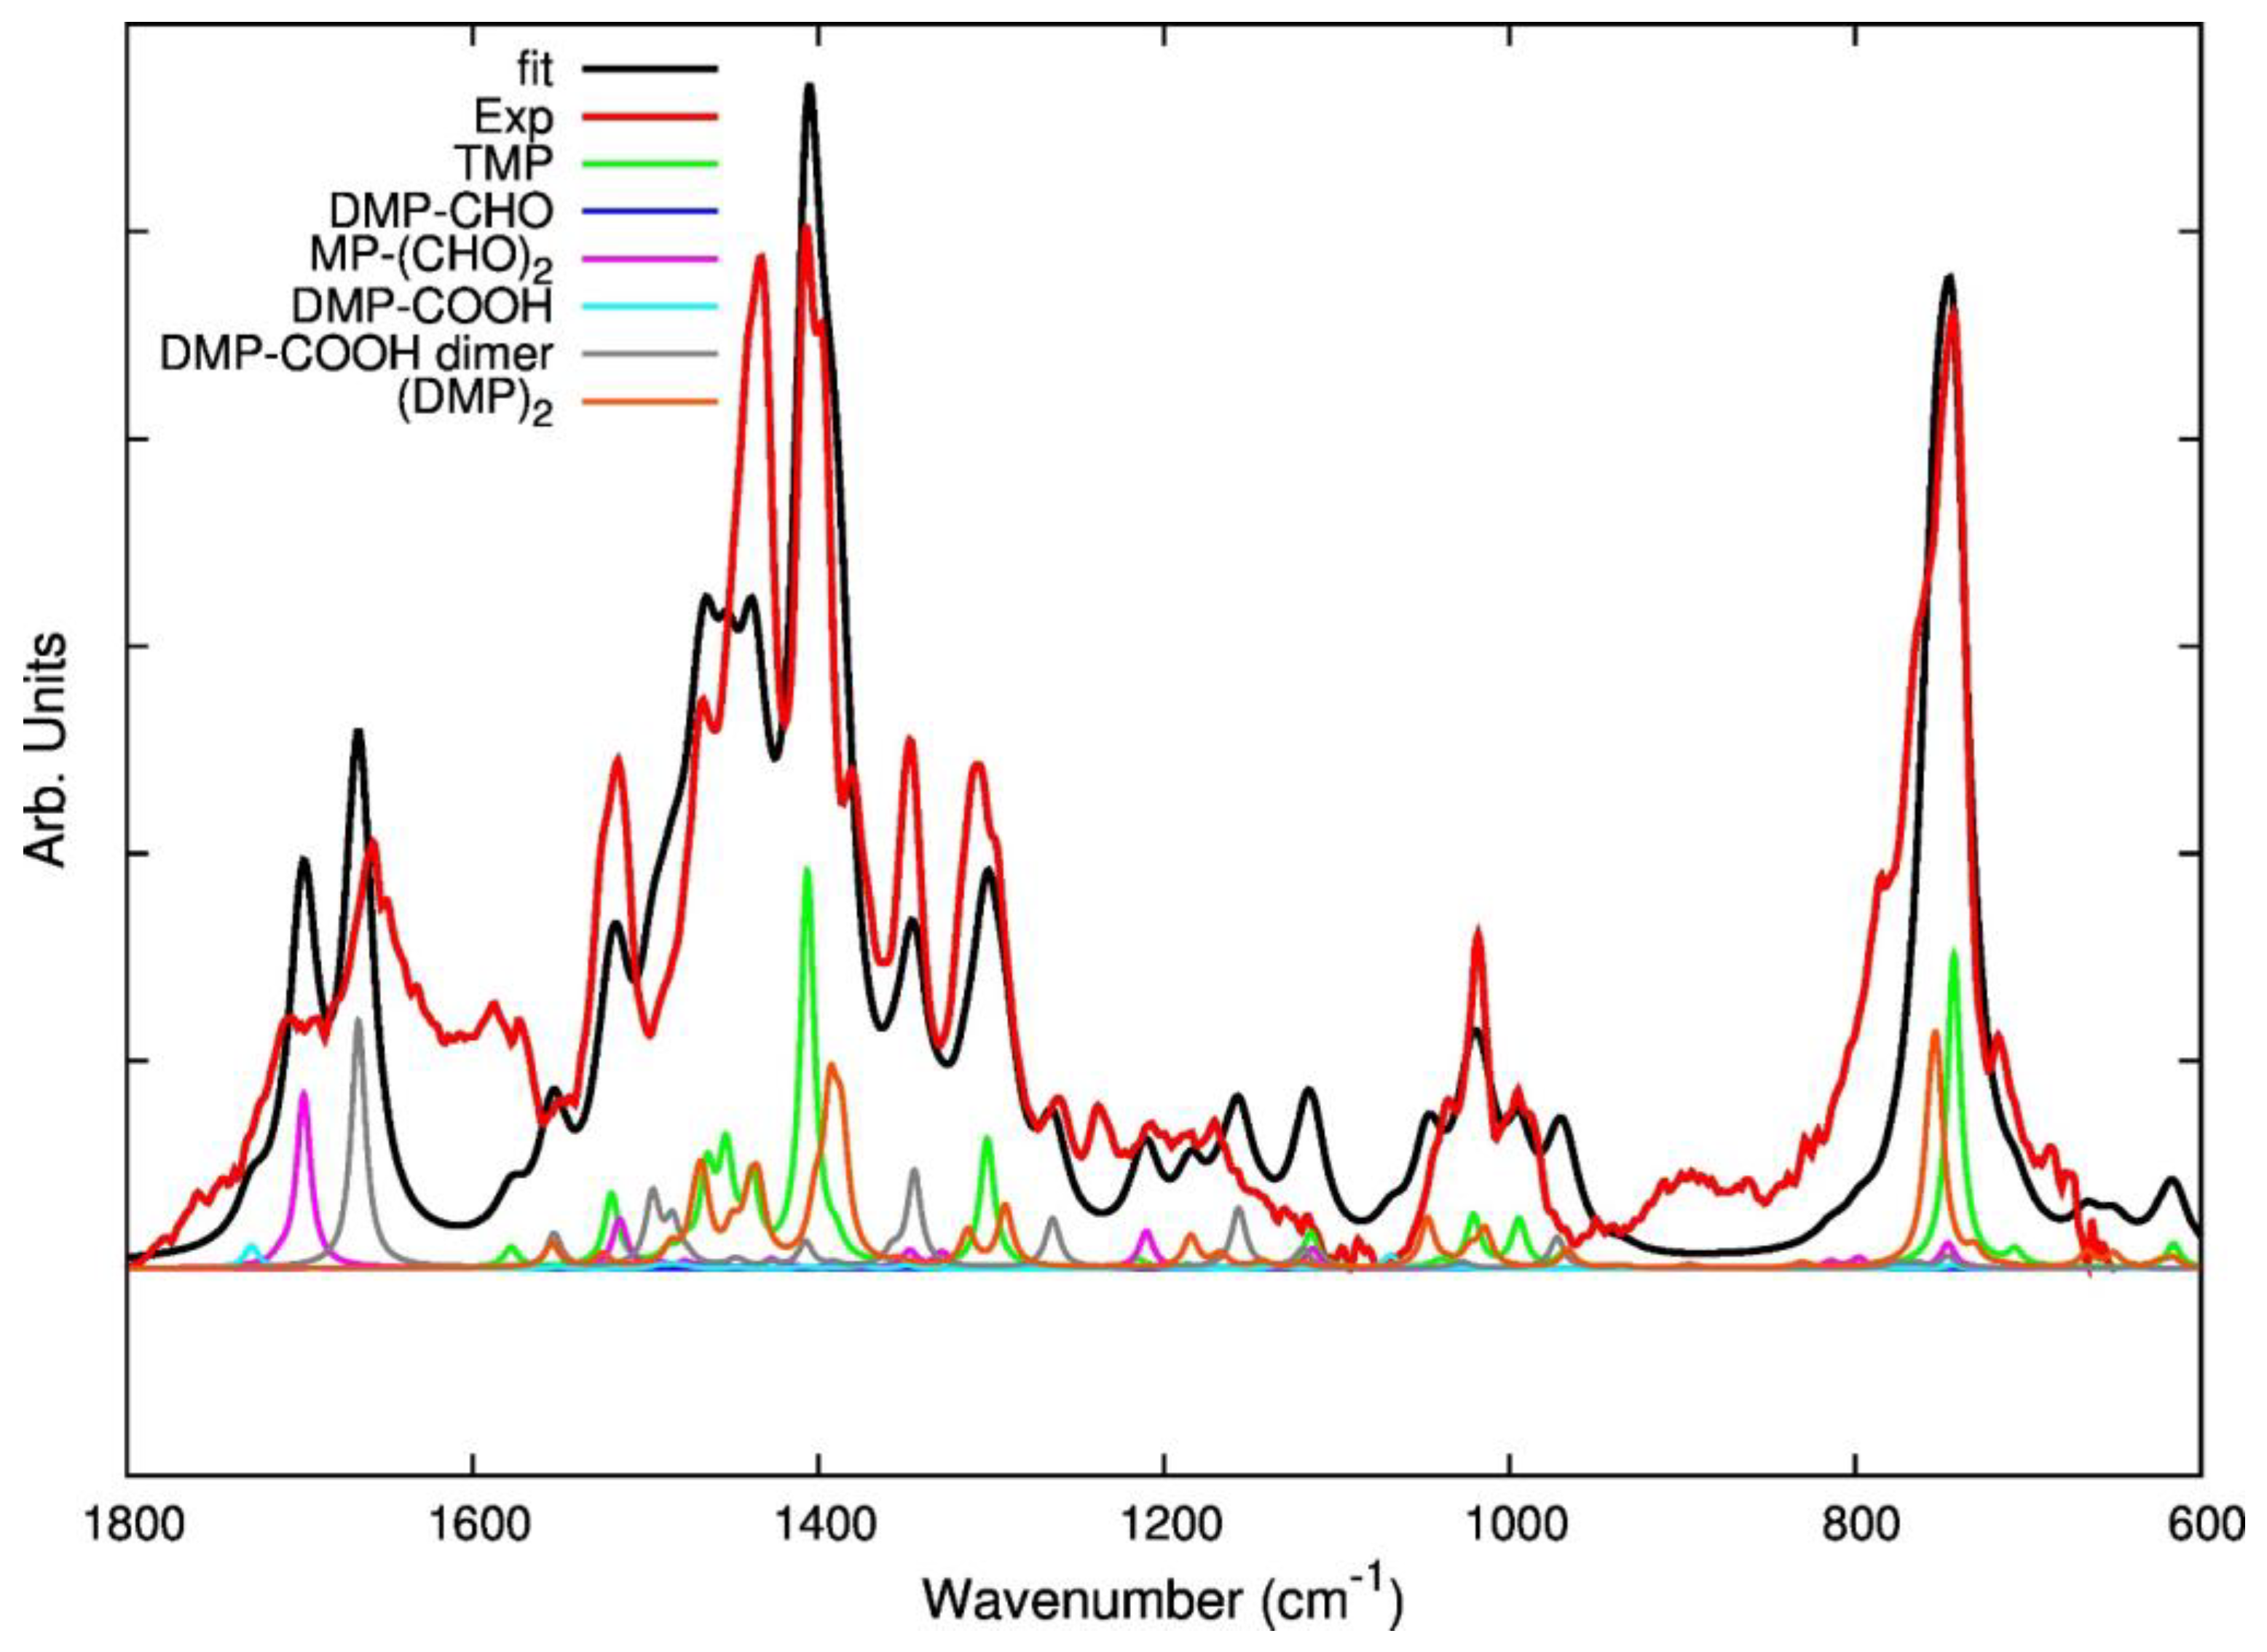
2.2.1. Fourier Transform Infra Red spectroscopy (FT-IR)
2.2.2. Raman Spectroscopy
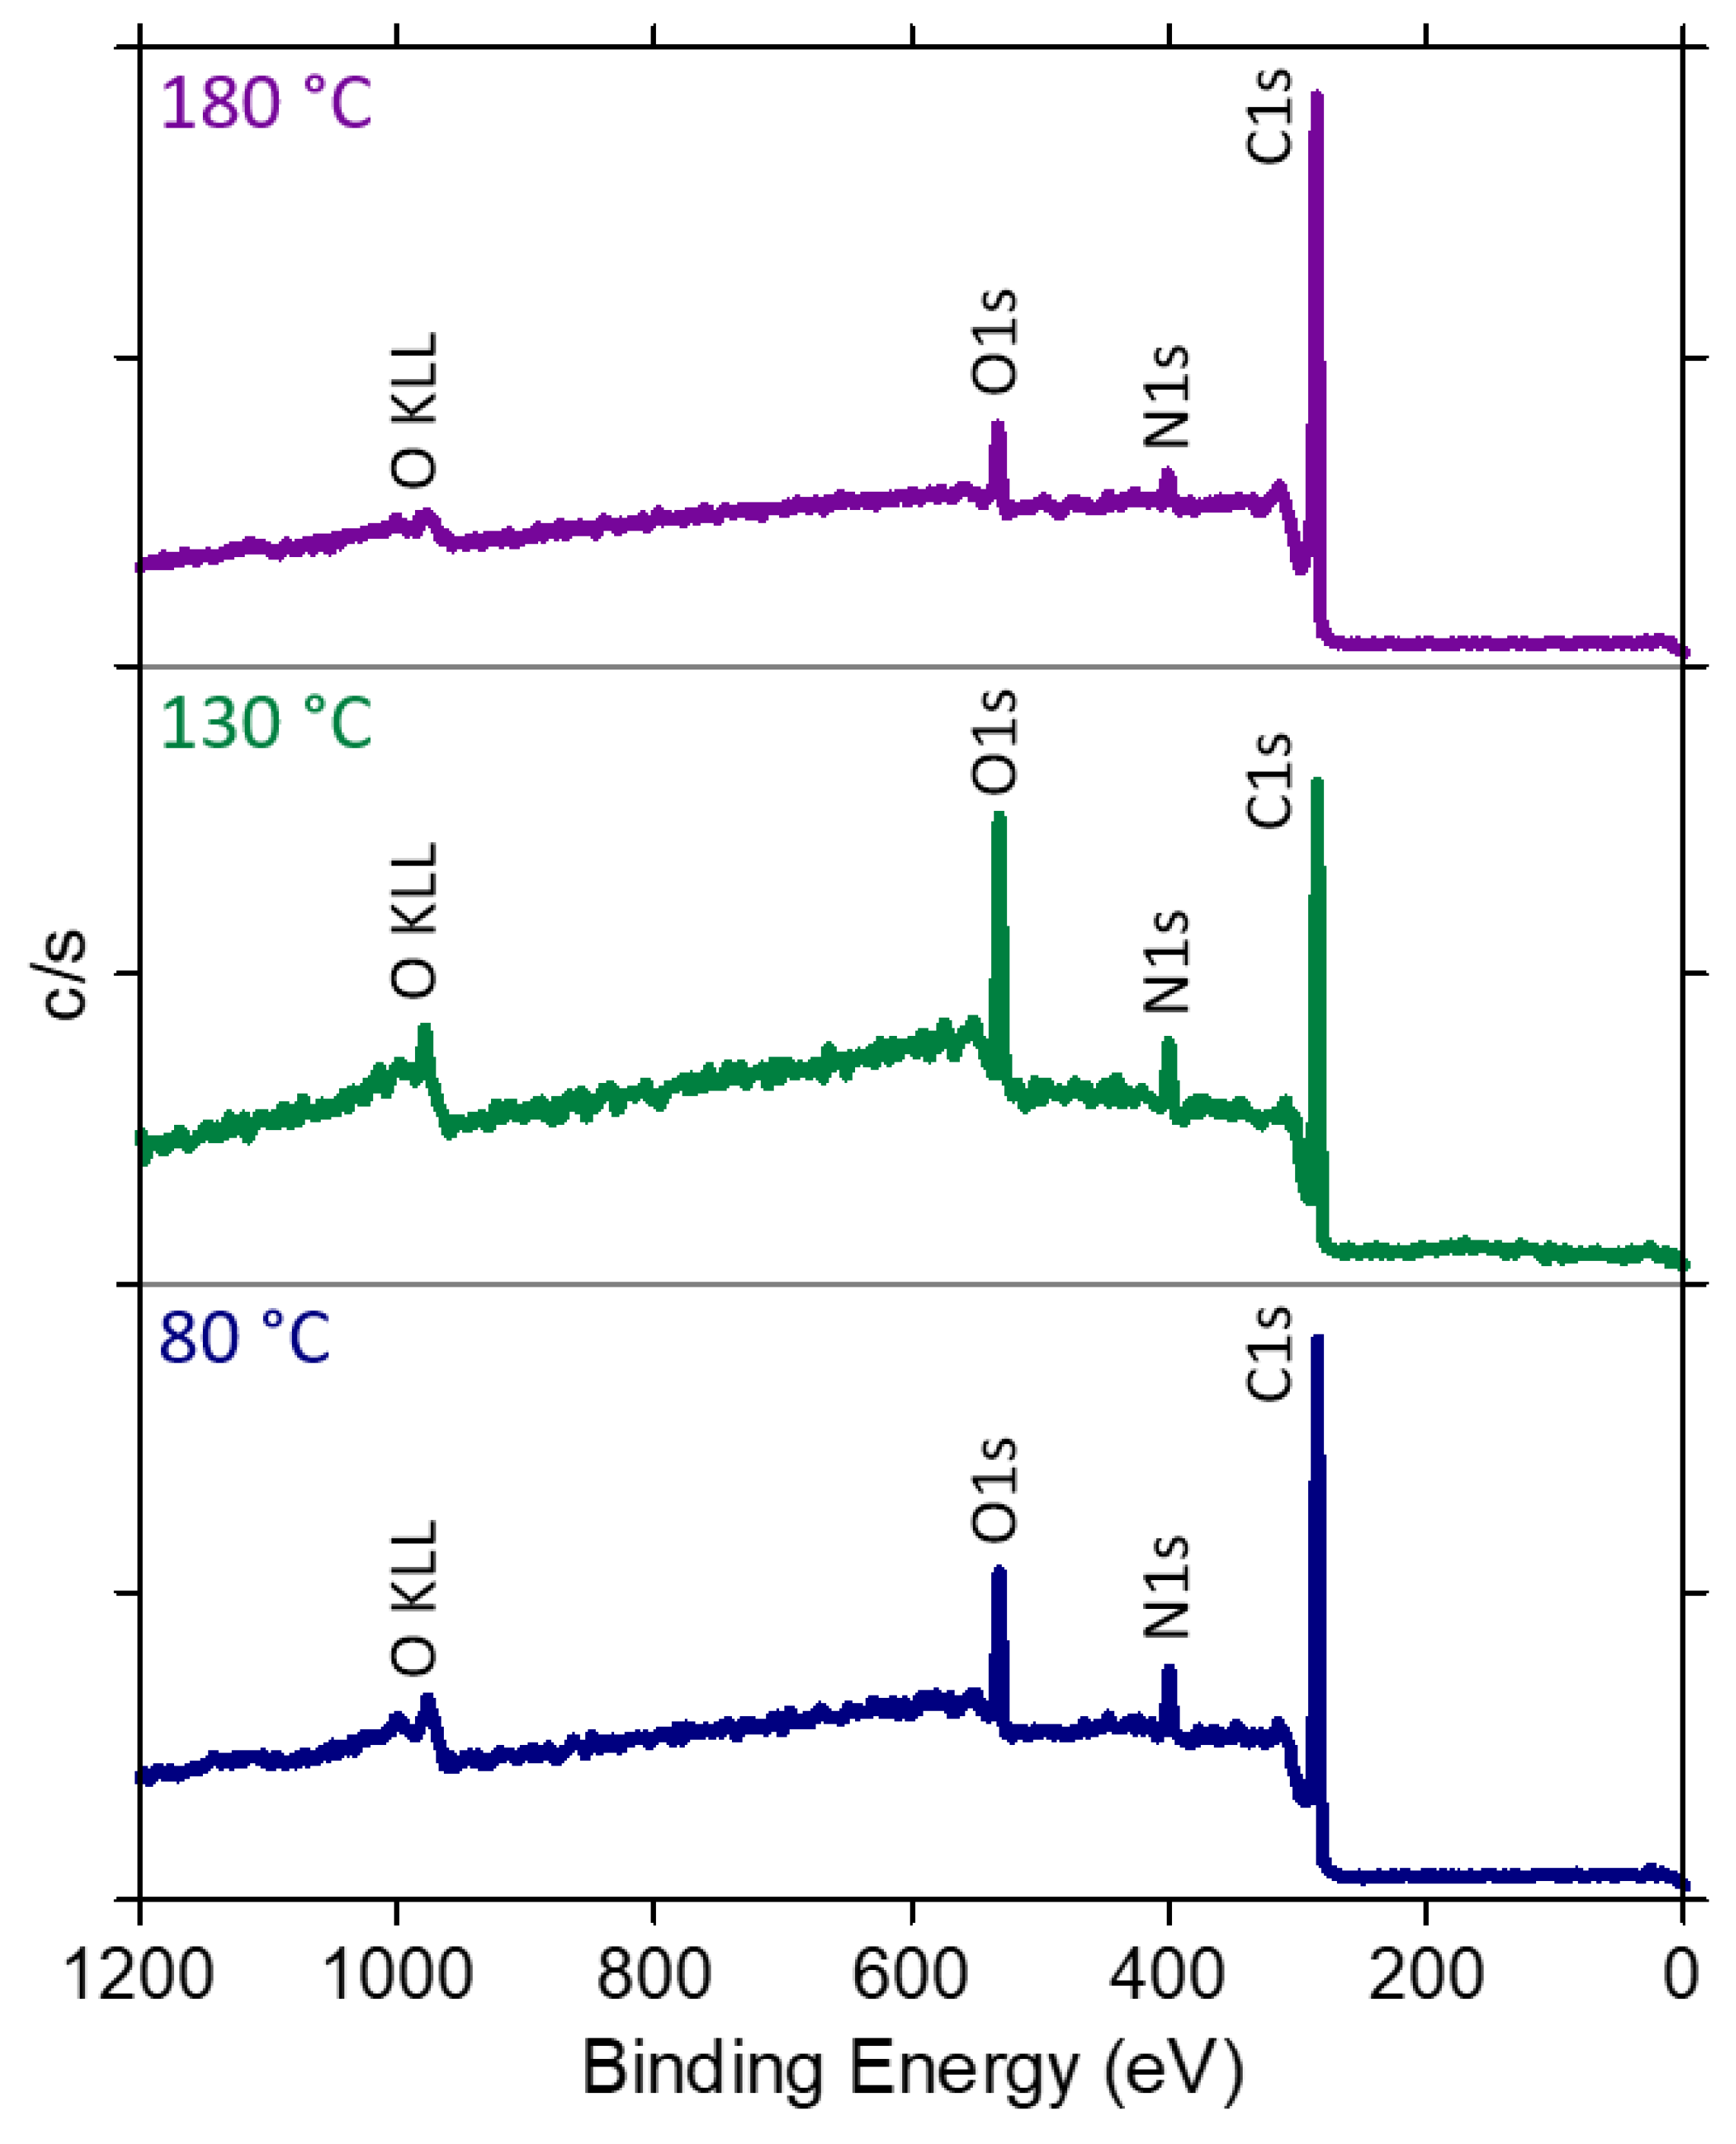
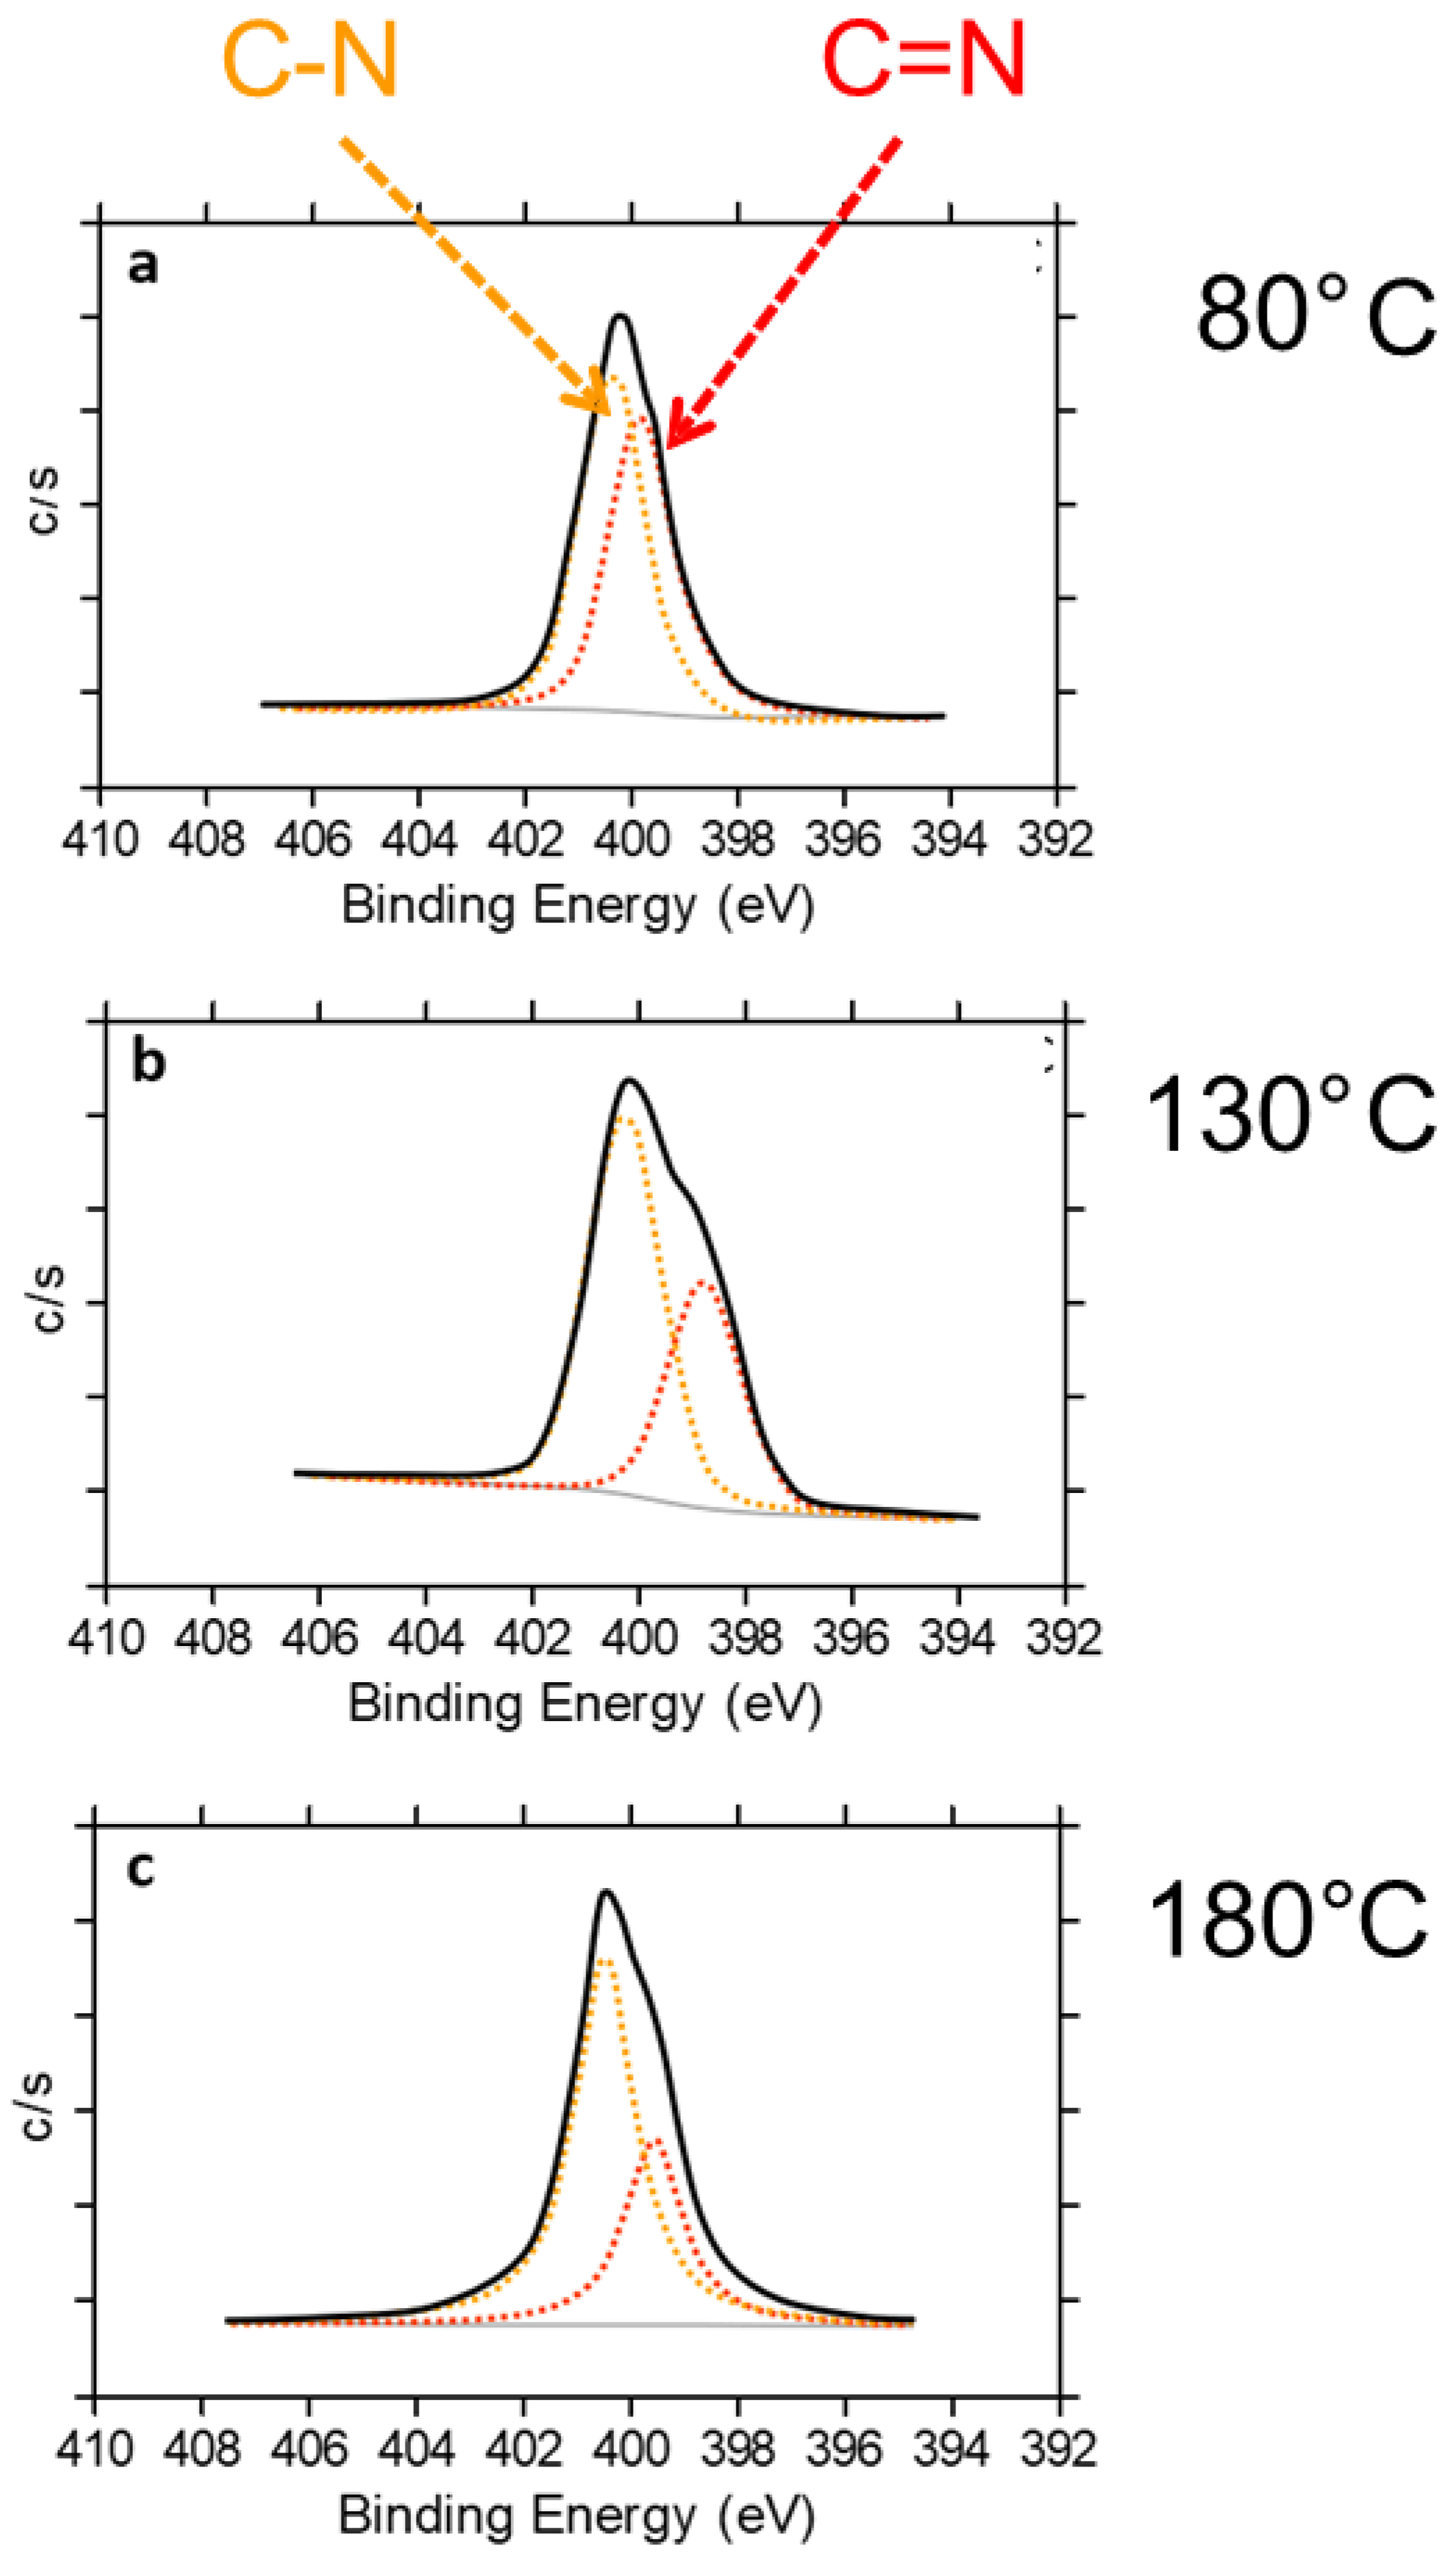
2.2.3. High Resolution X-ray Photoelectron Spectroscopy (XPS)
2.2.4. High-Resolution Transmission Electron Microscopy (HRTEM)
2.2.5. Quantum Chemical Molecular Modeling
3. Results and Discussion
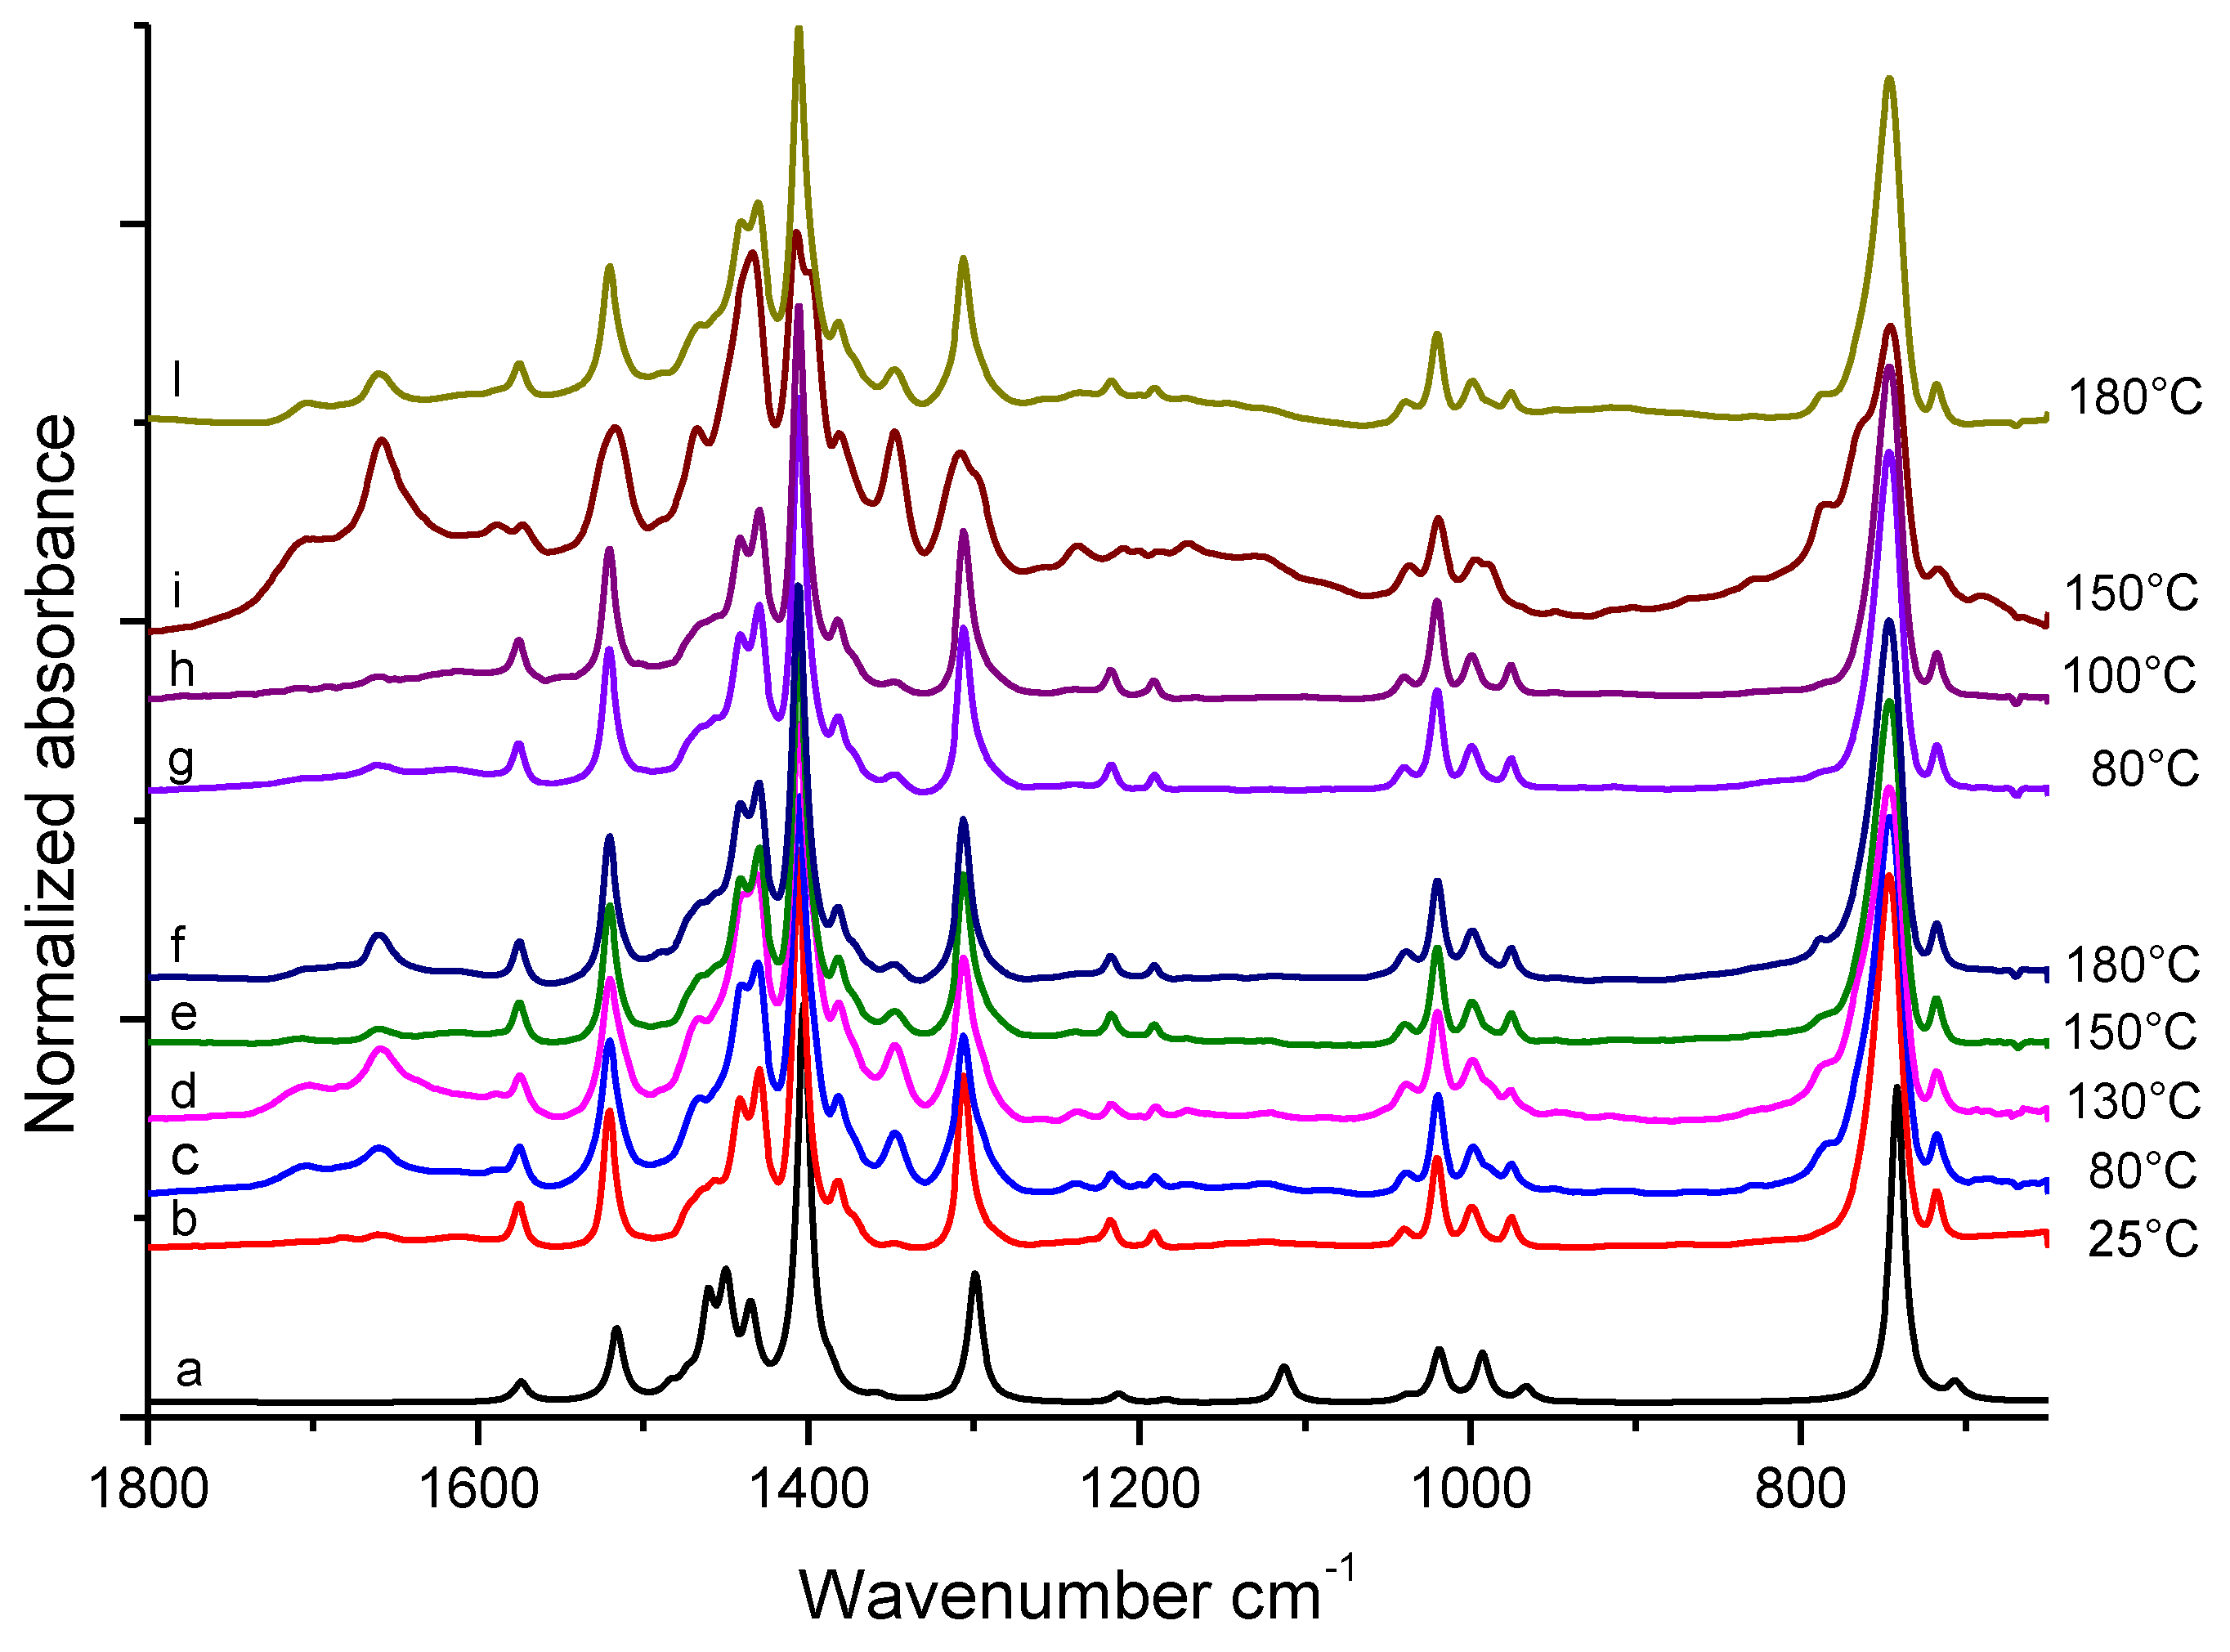
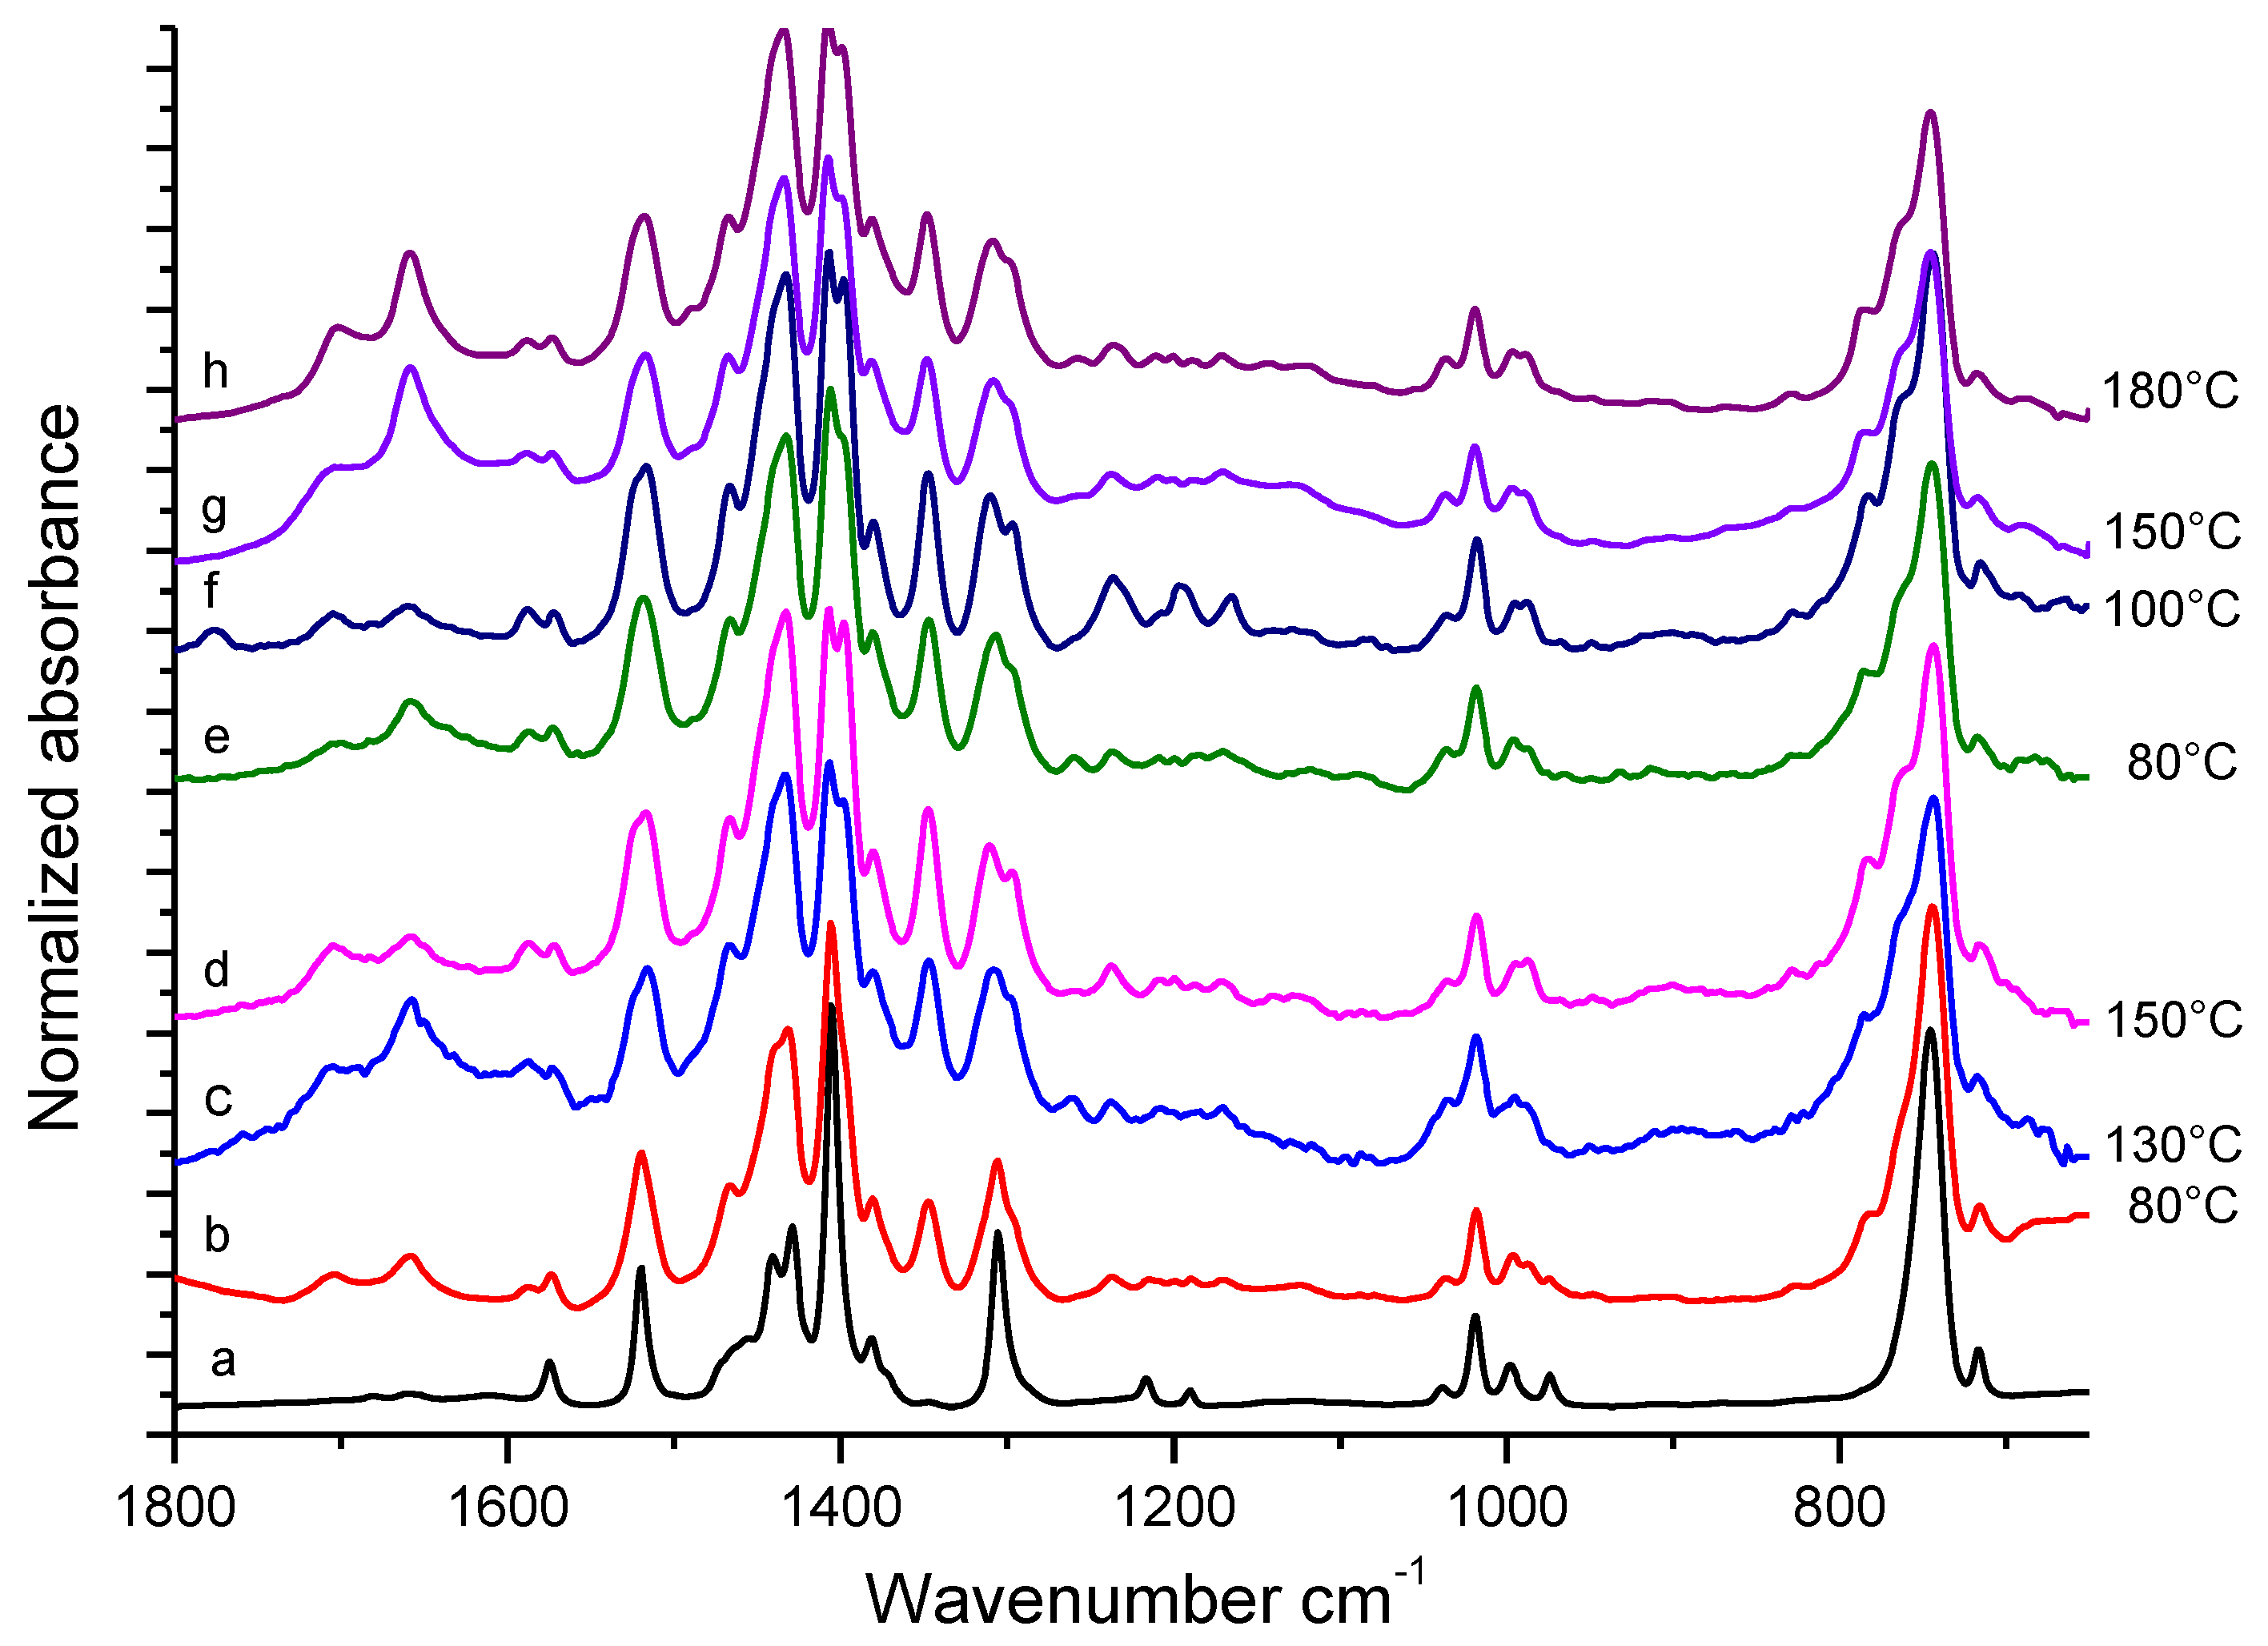
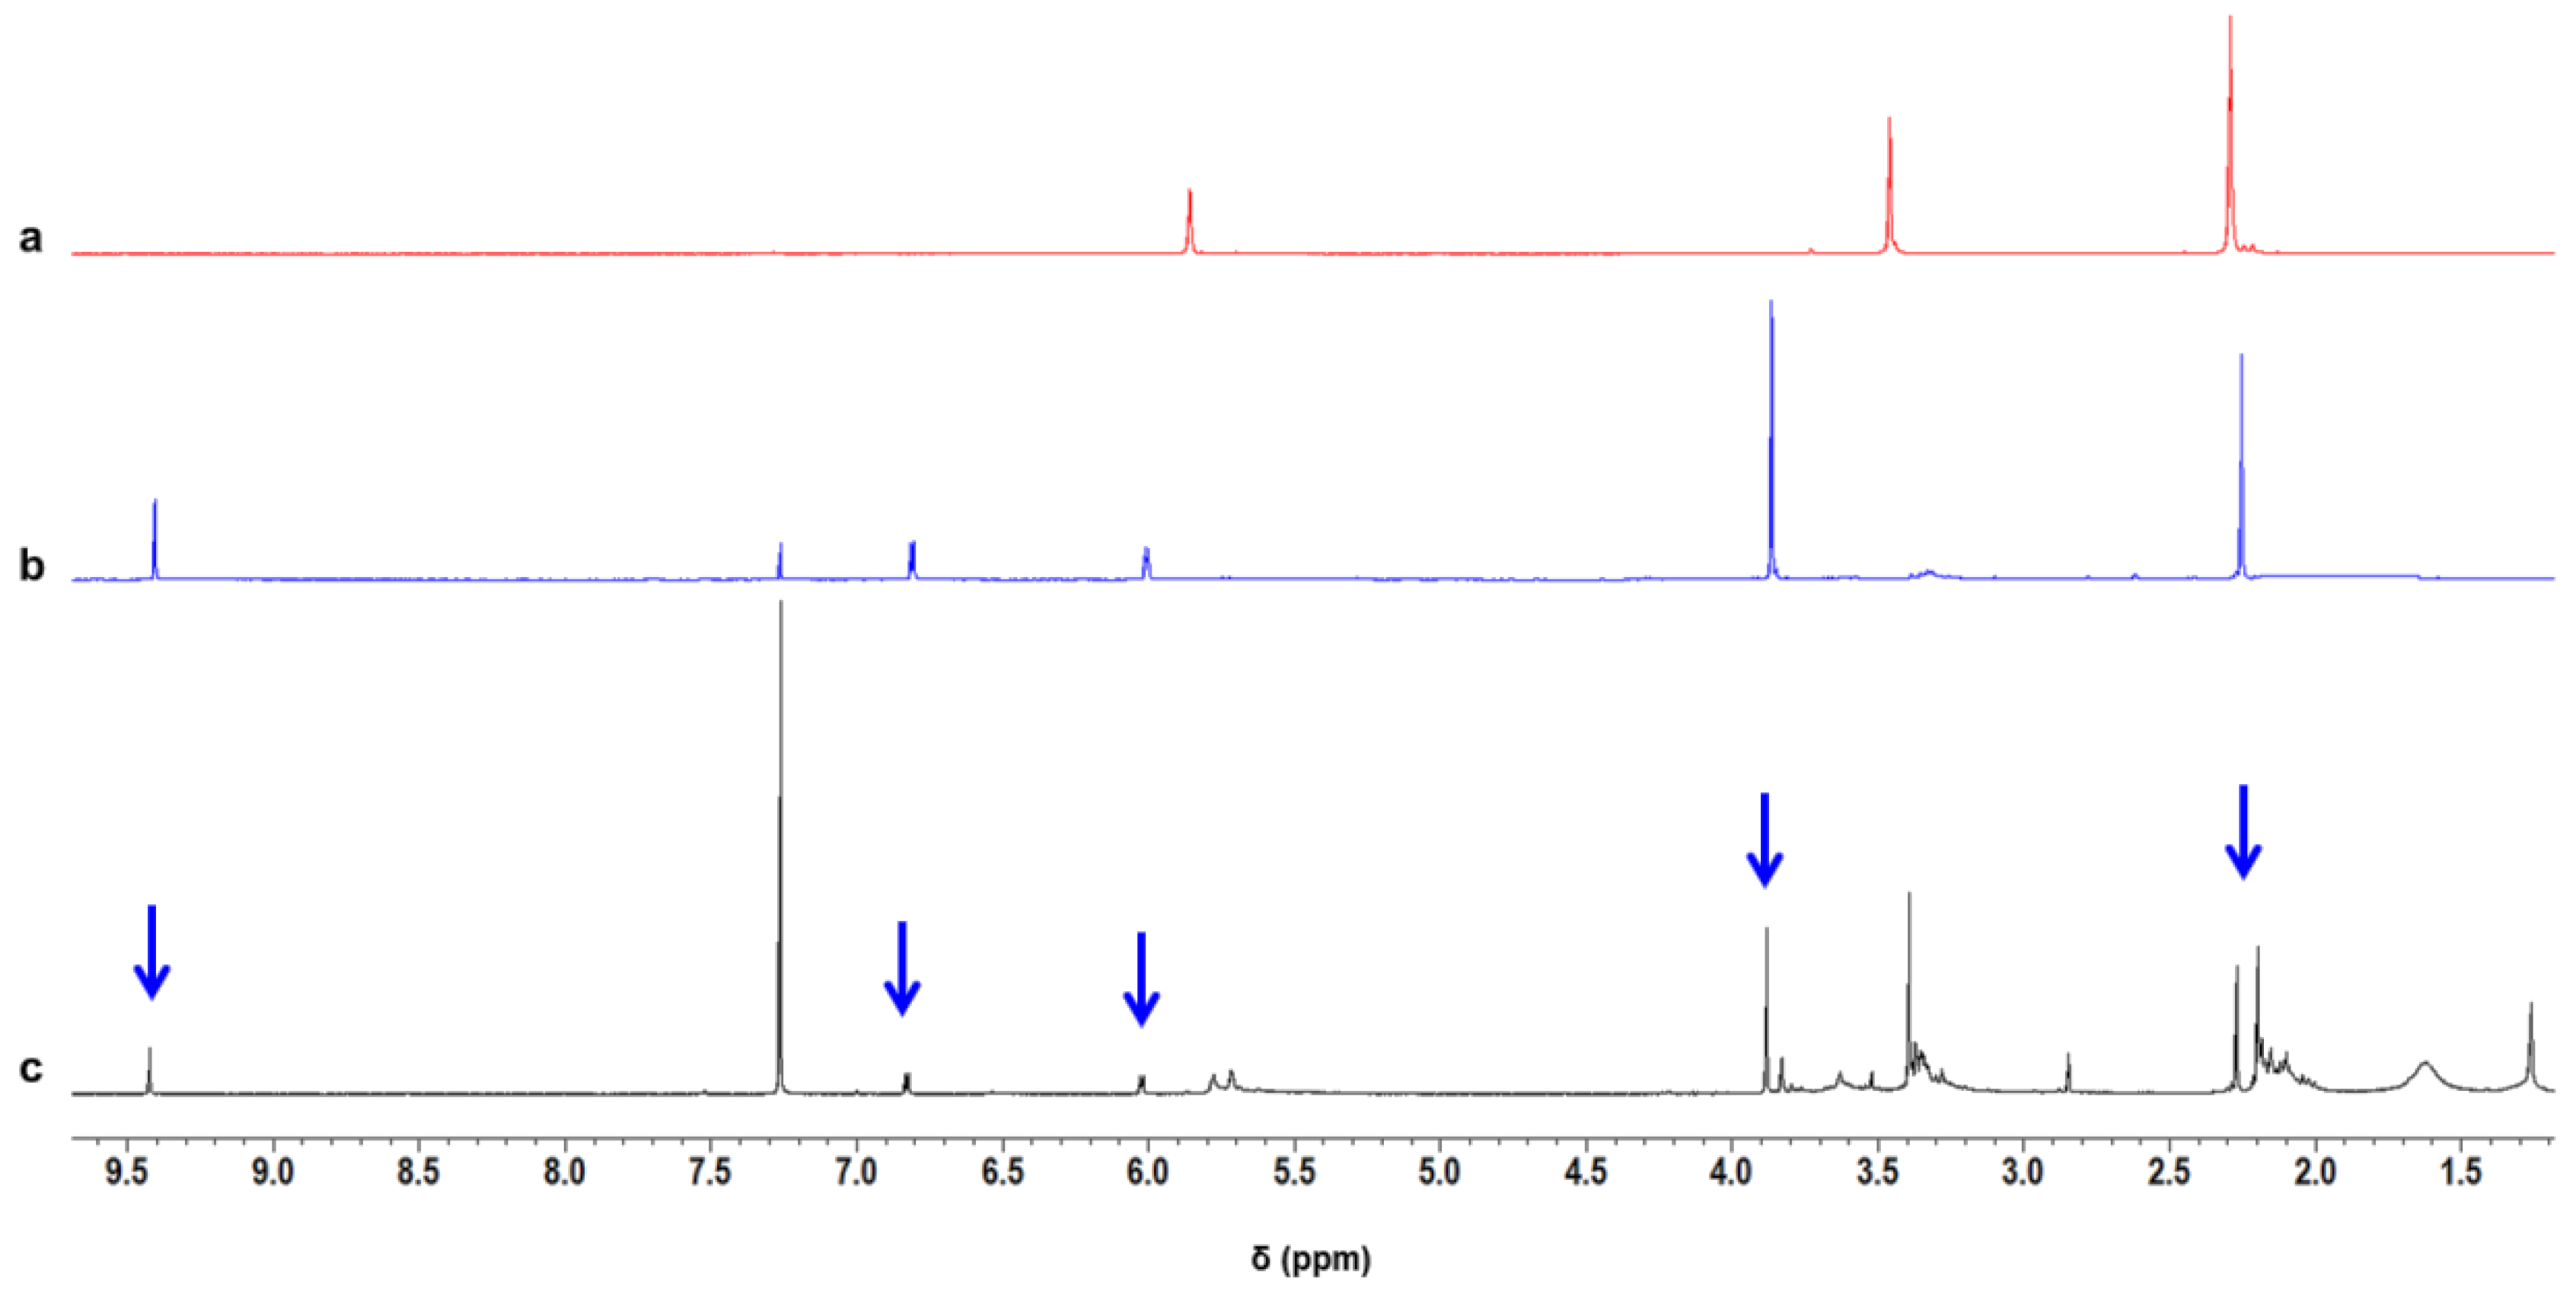
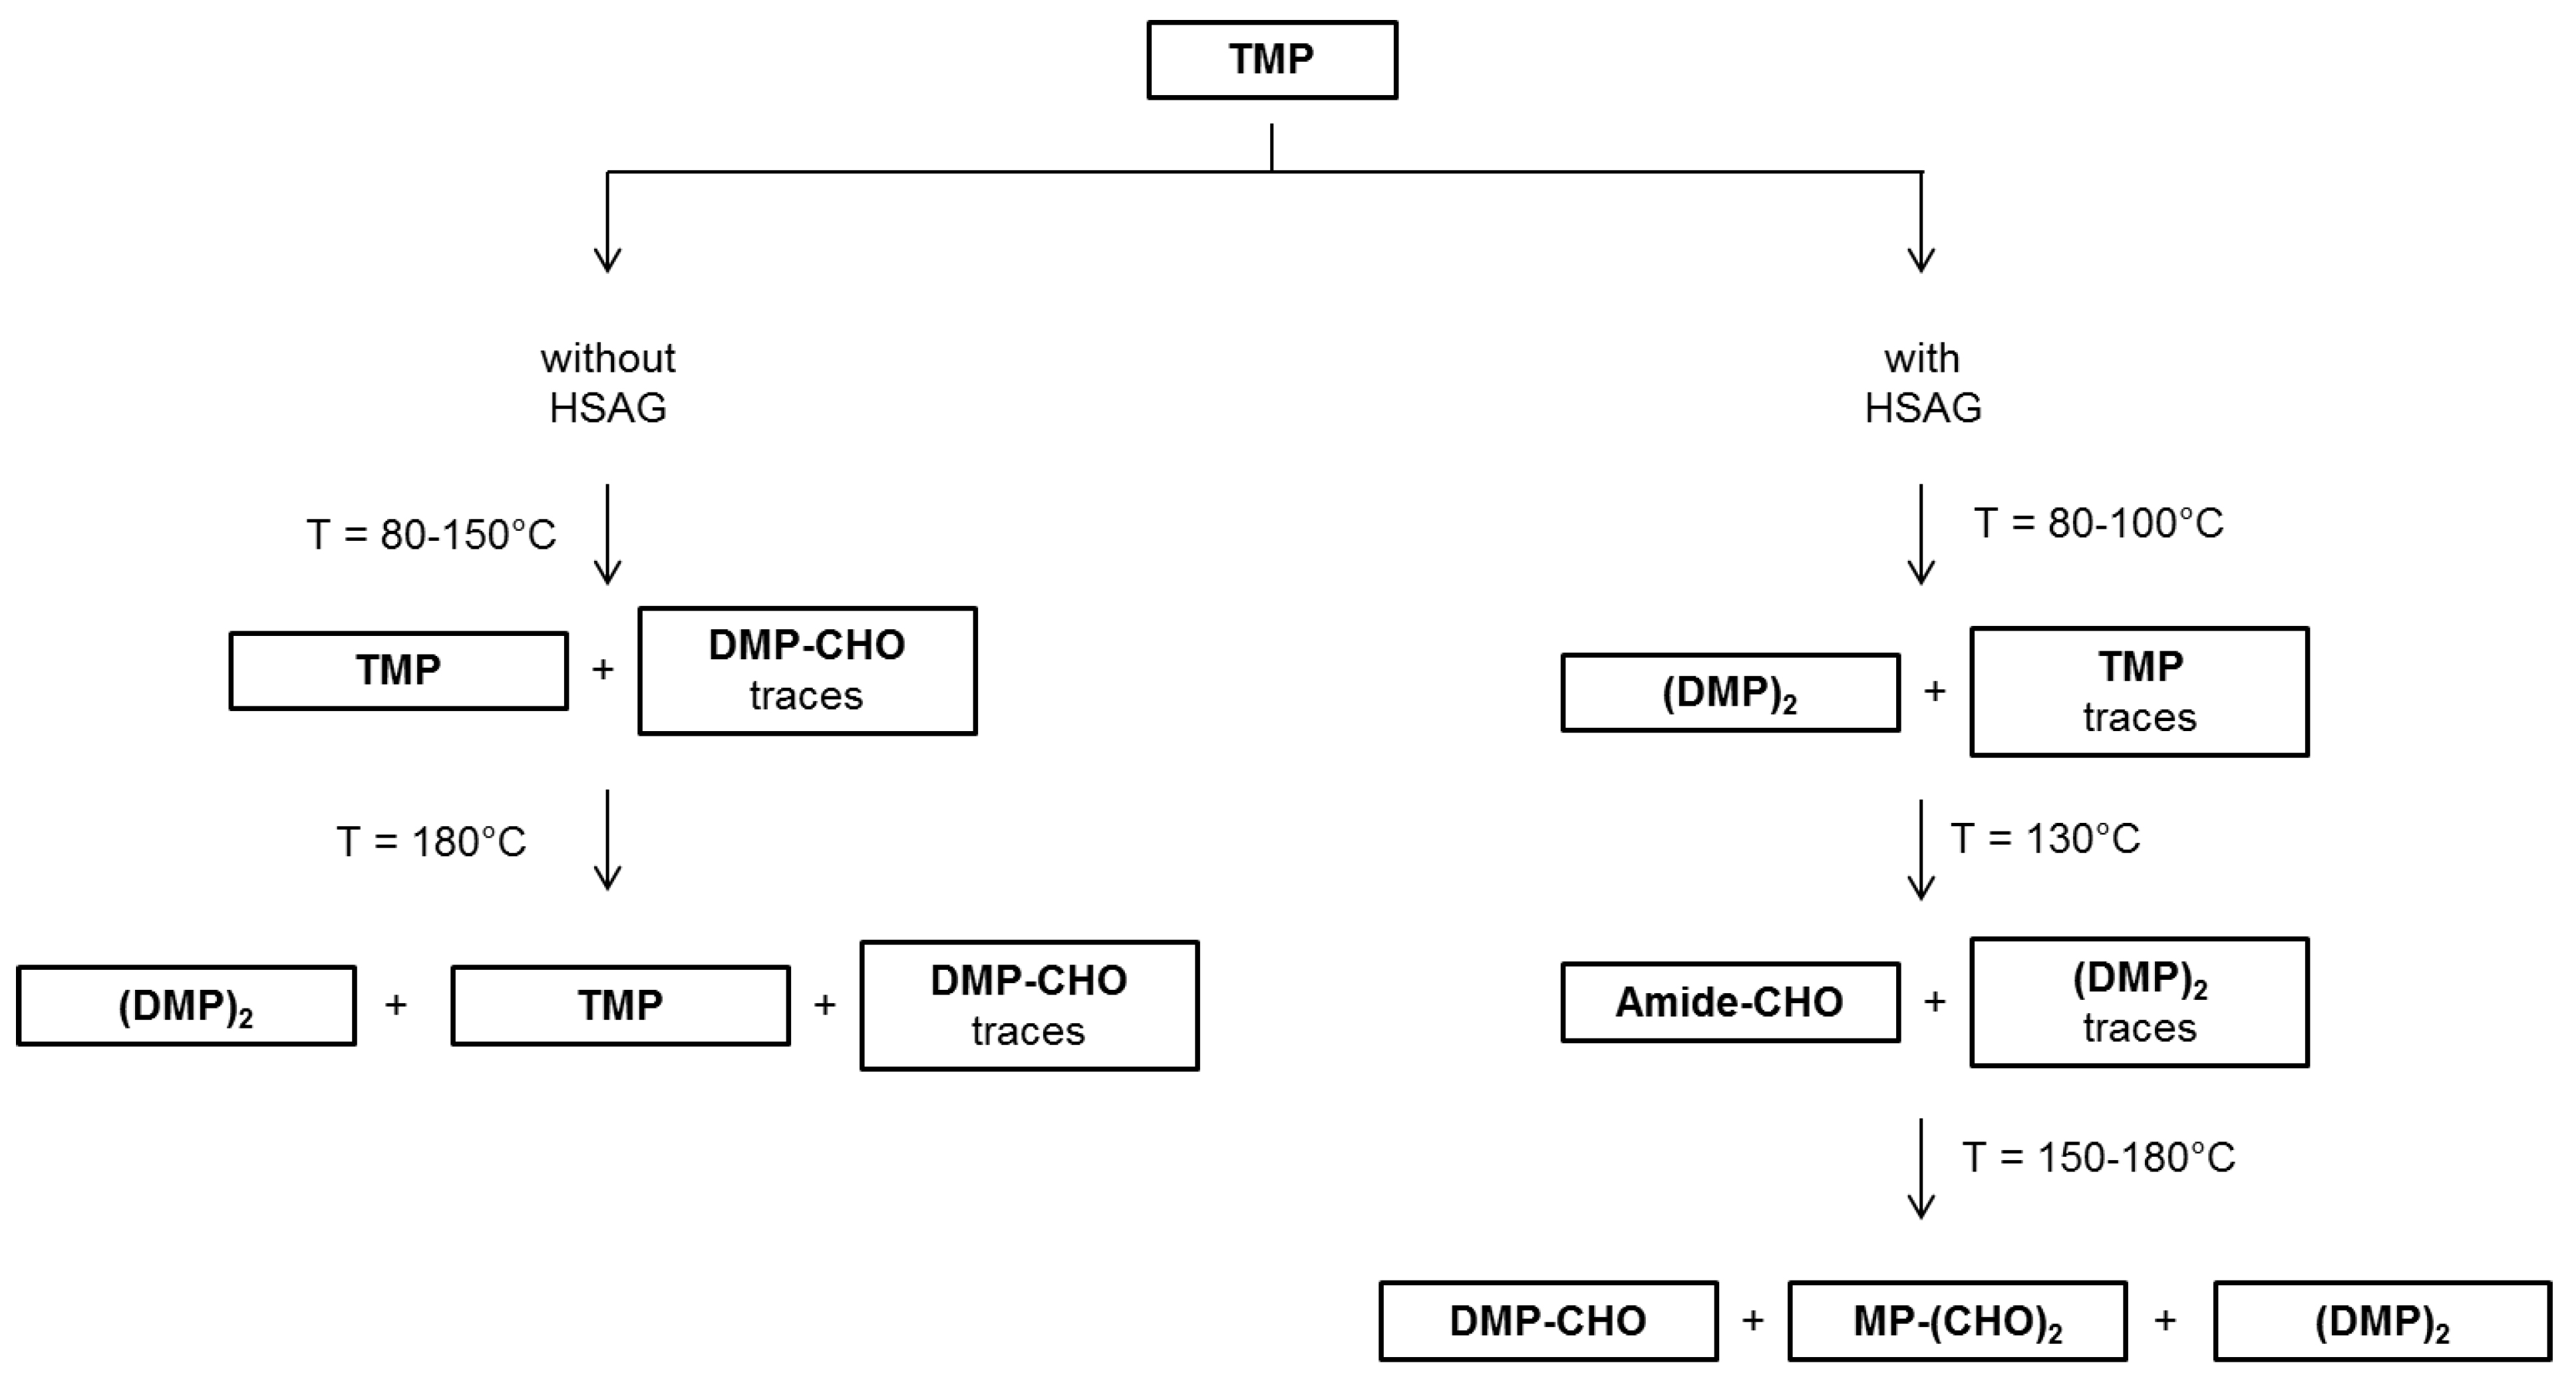
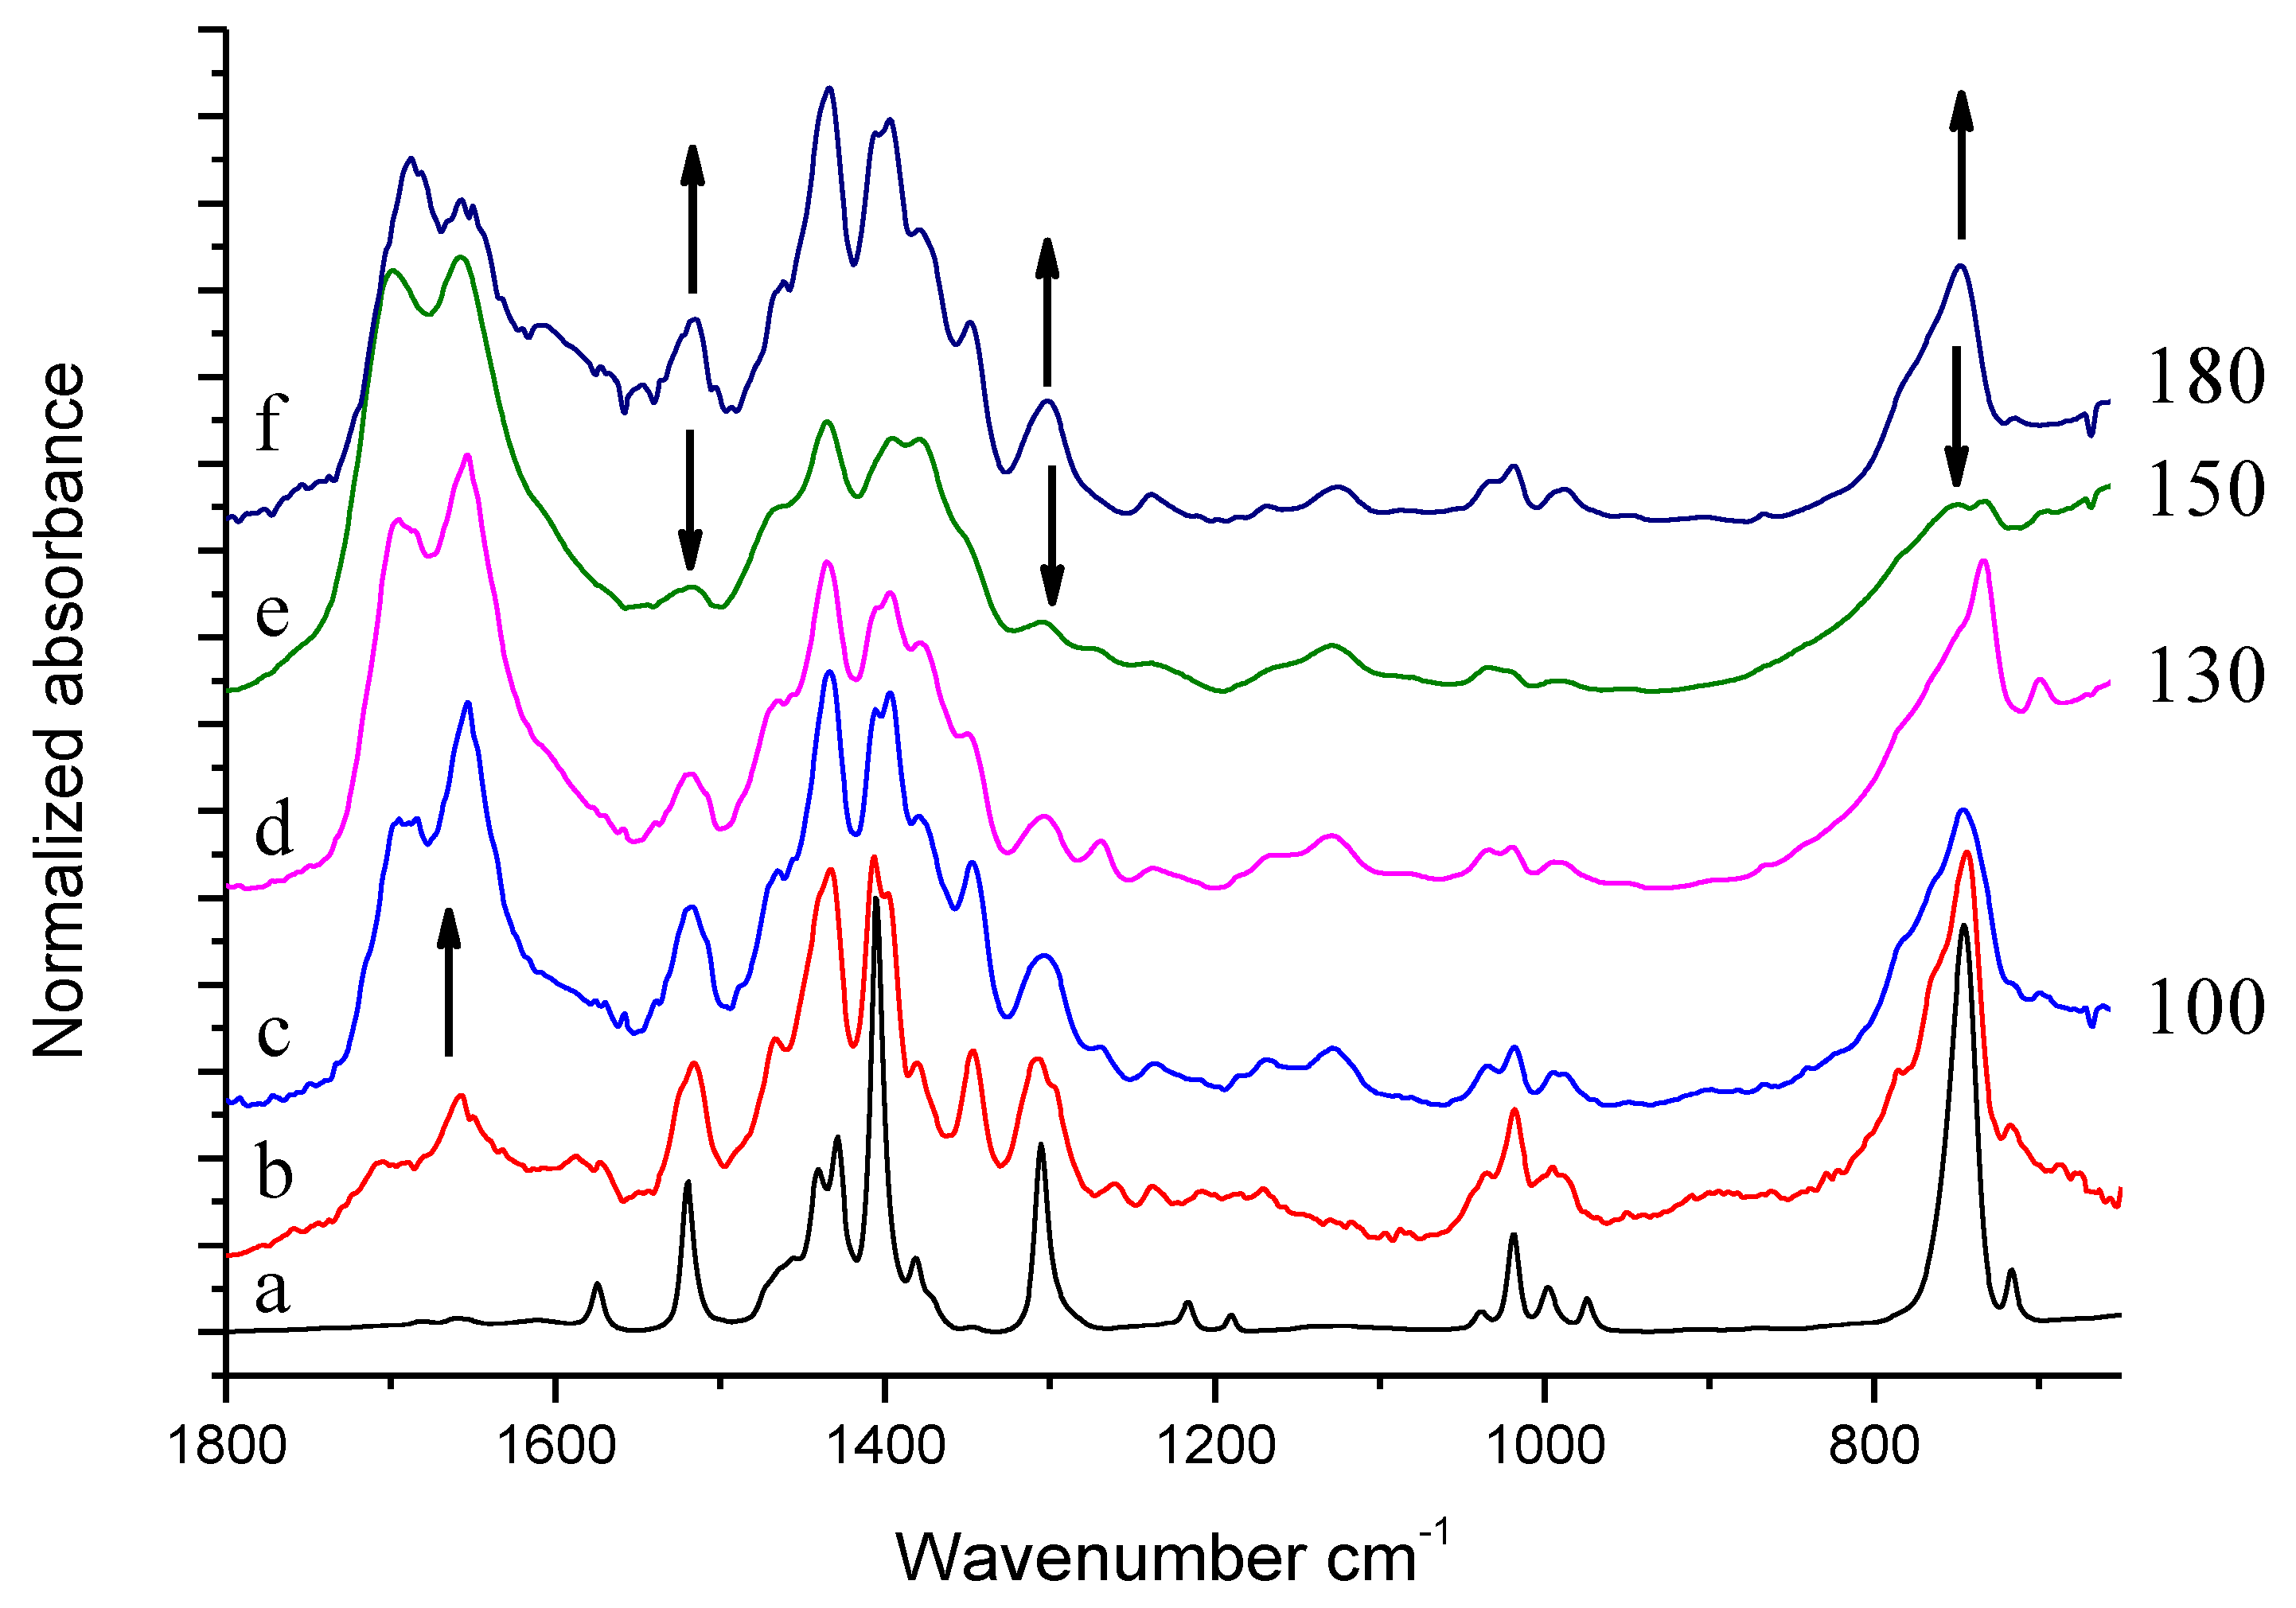
3.1 Thermal Treatment of TMP
3.1.1 Thermal Treatment of TMP in the Absence of HSAG
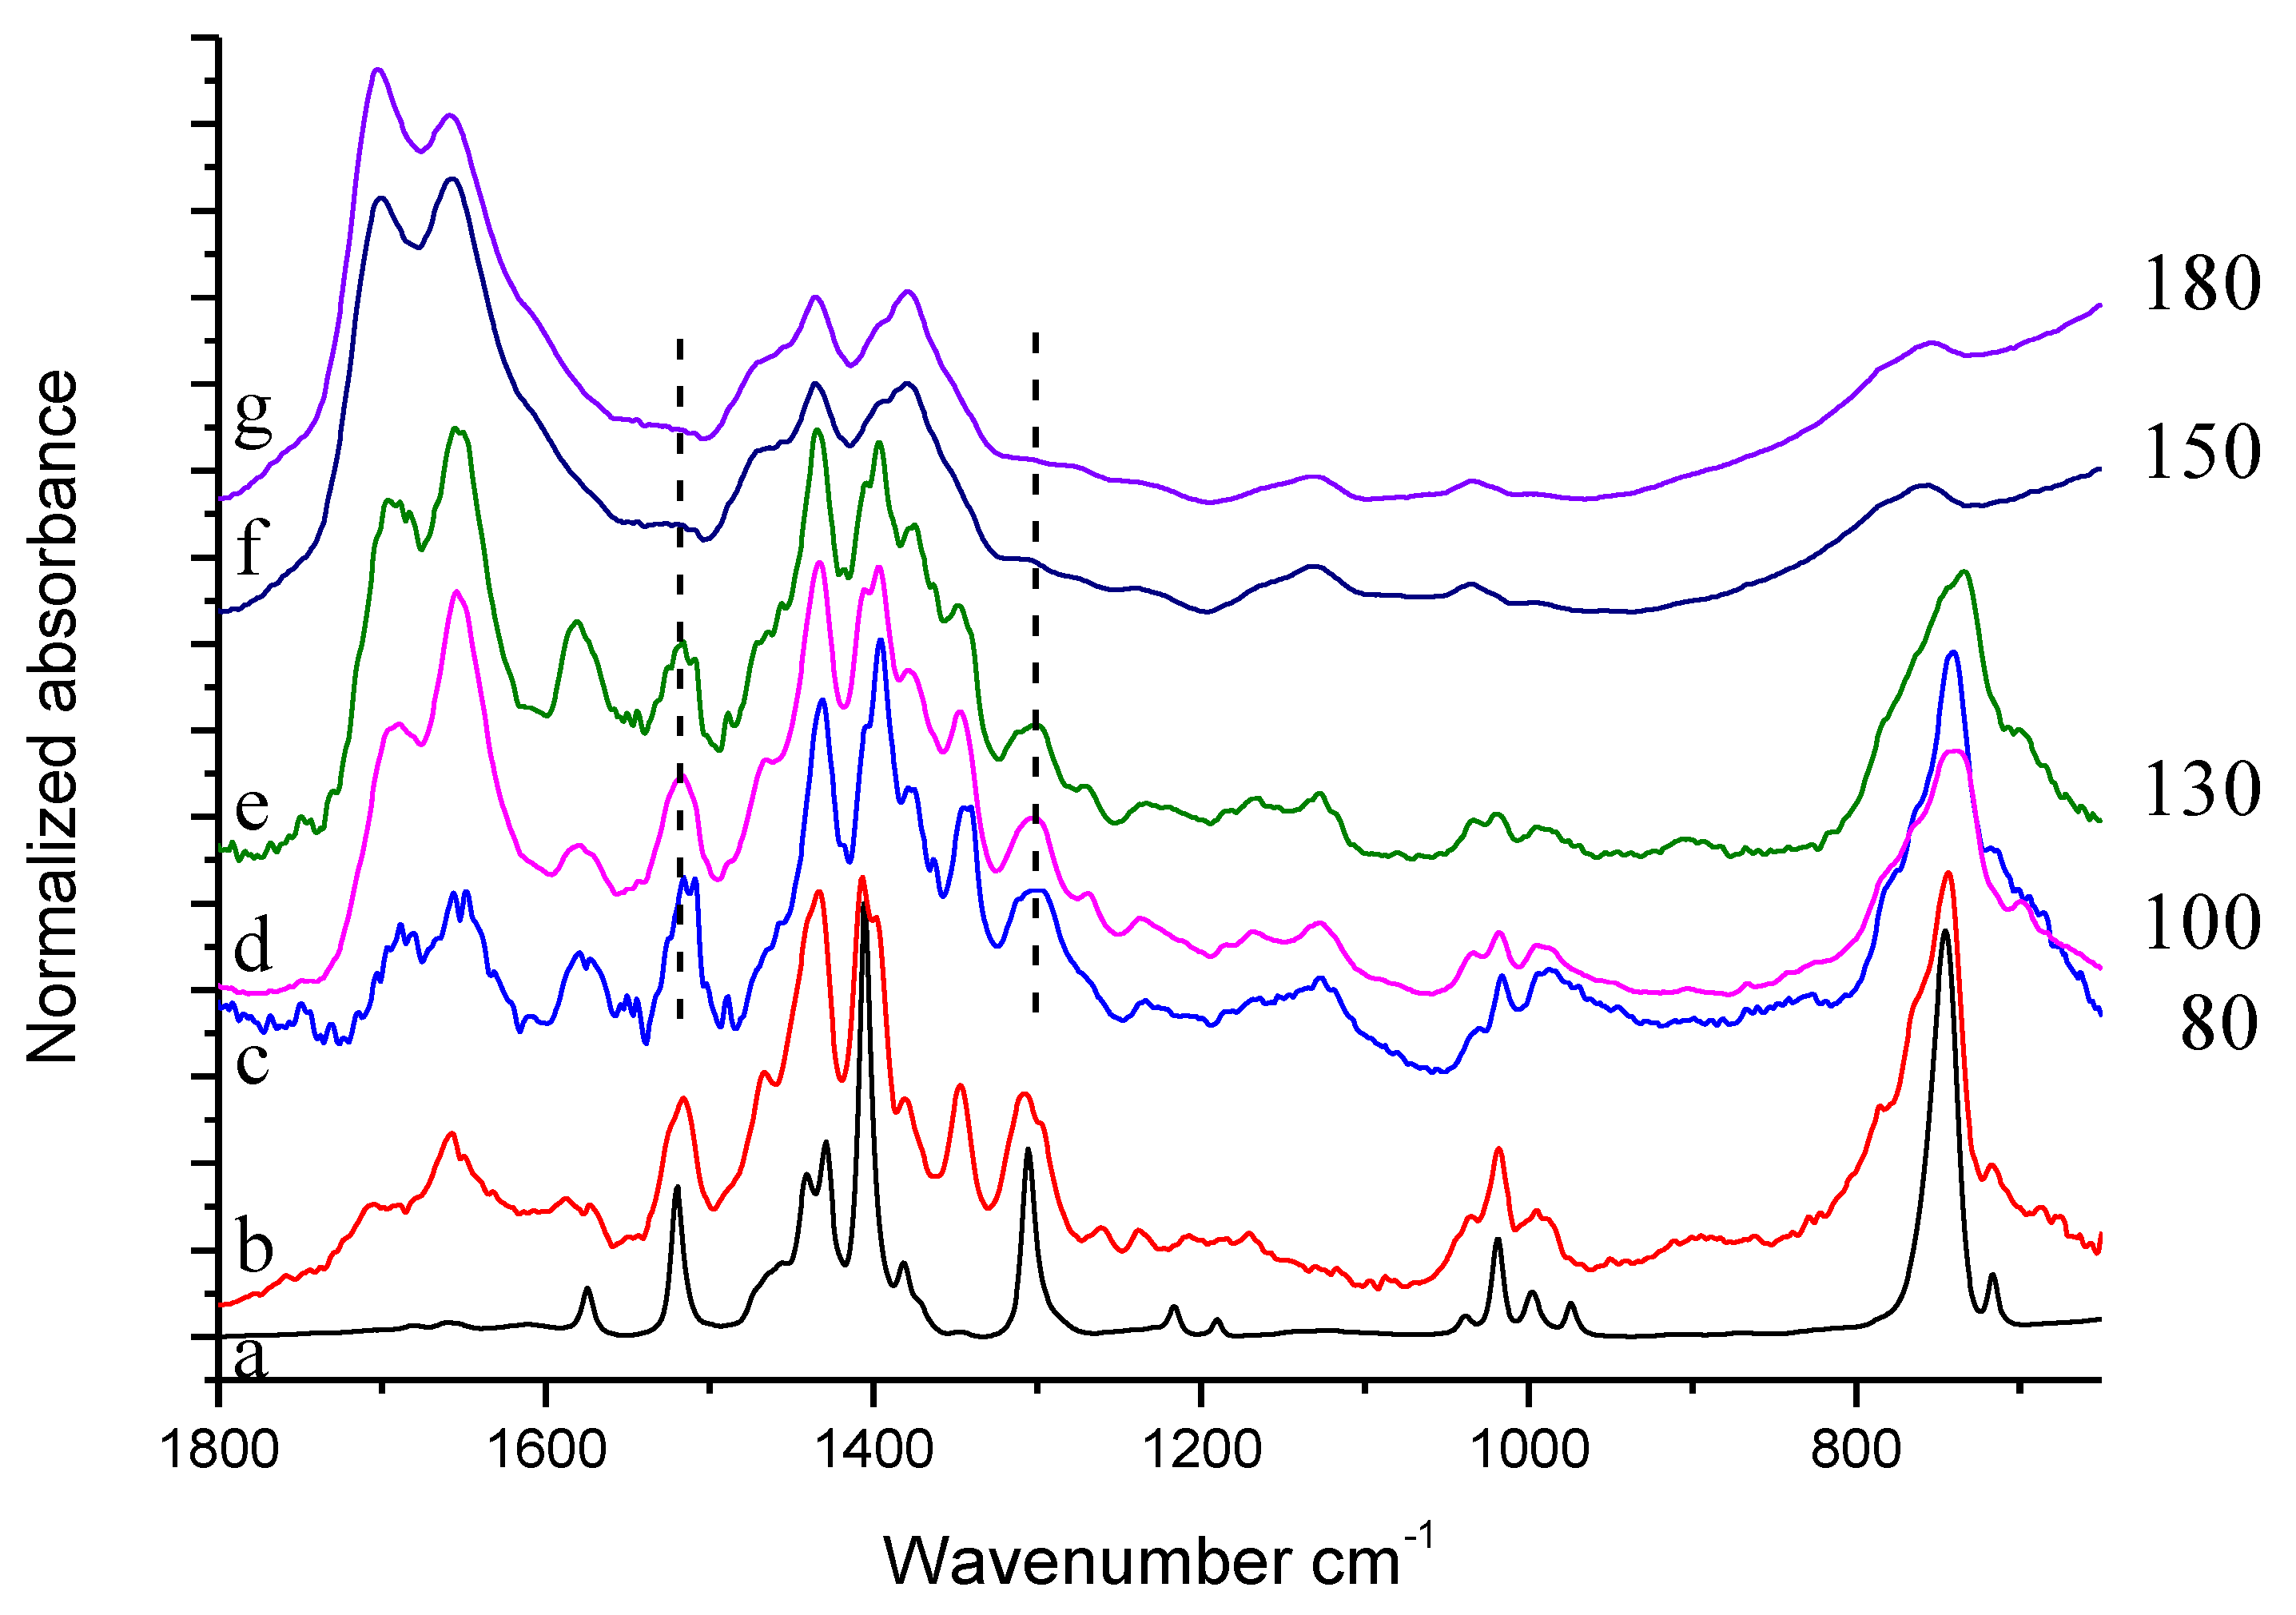
3.1.2 Thermal Treatment of TMP in the Presence of a Catalytic Amount of HSAG
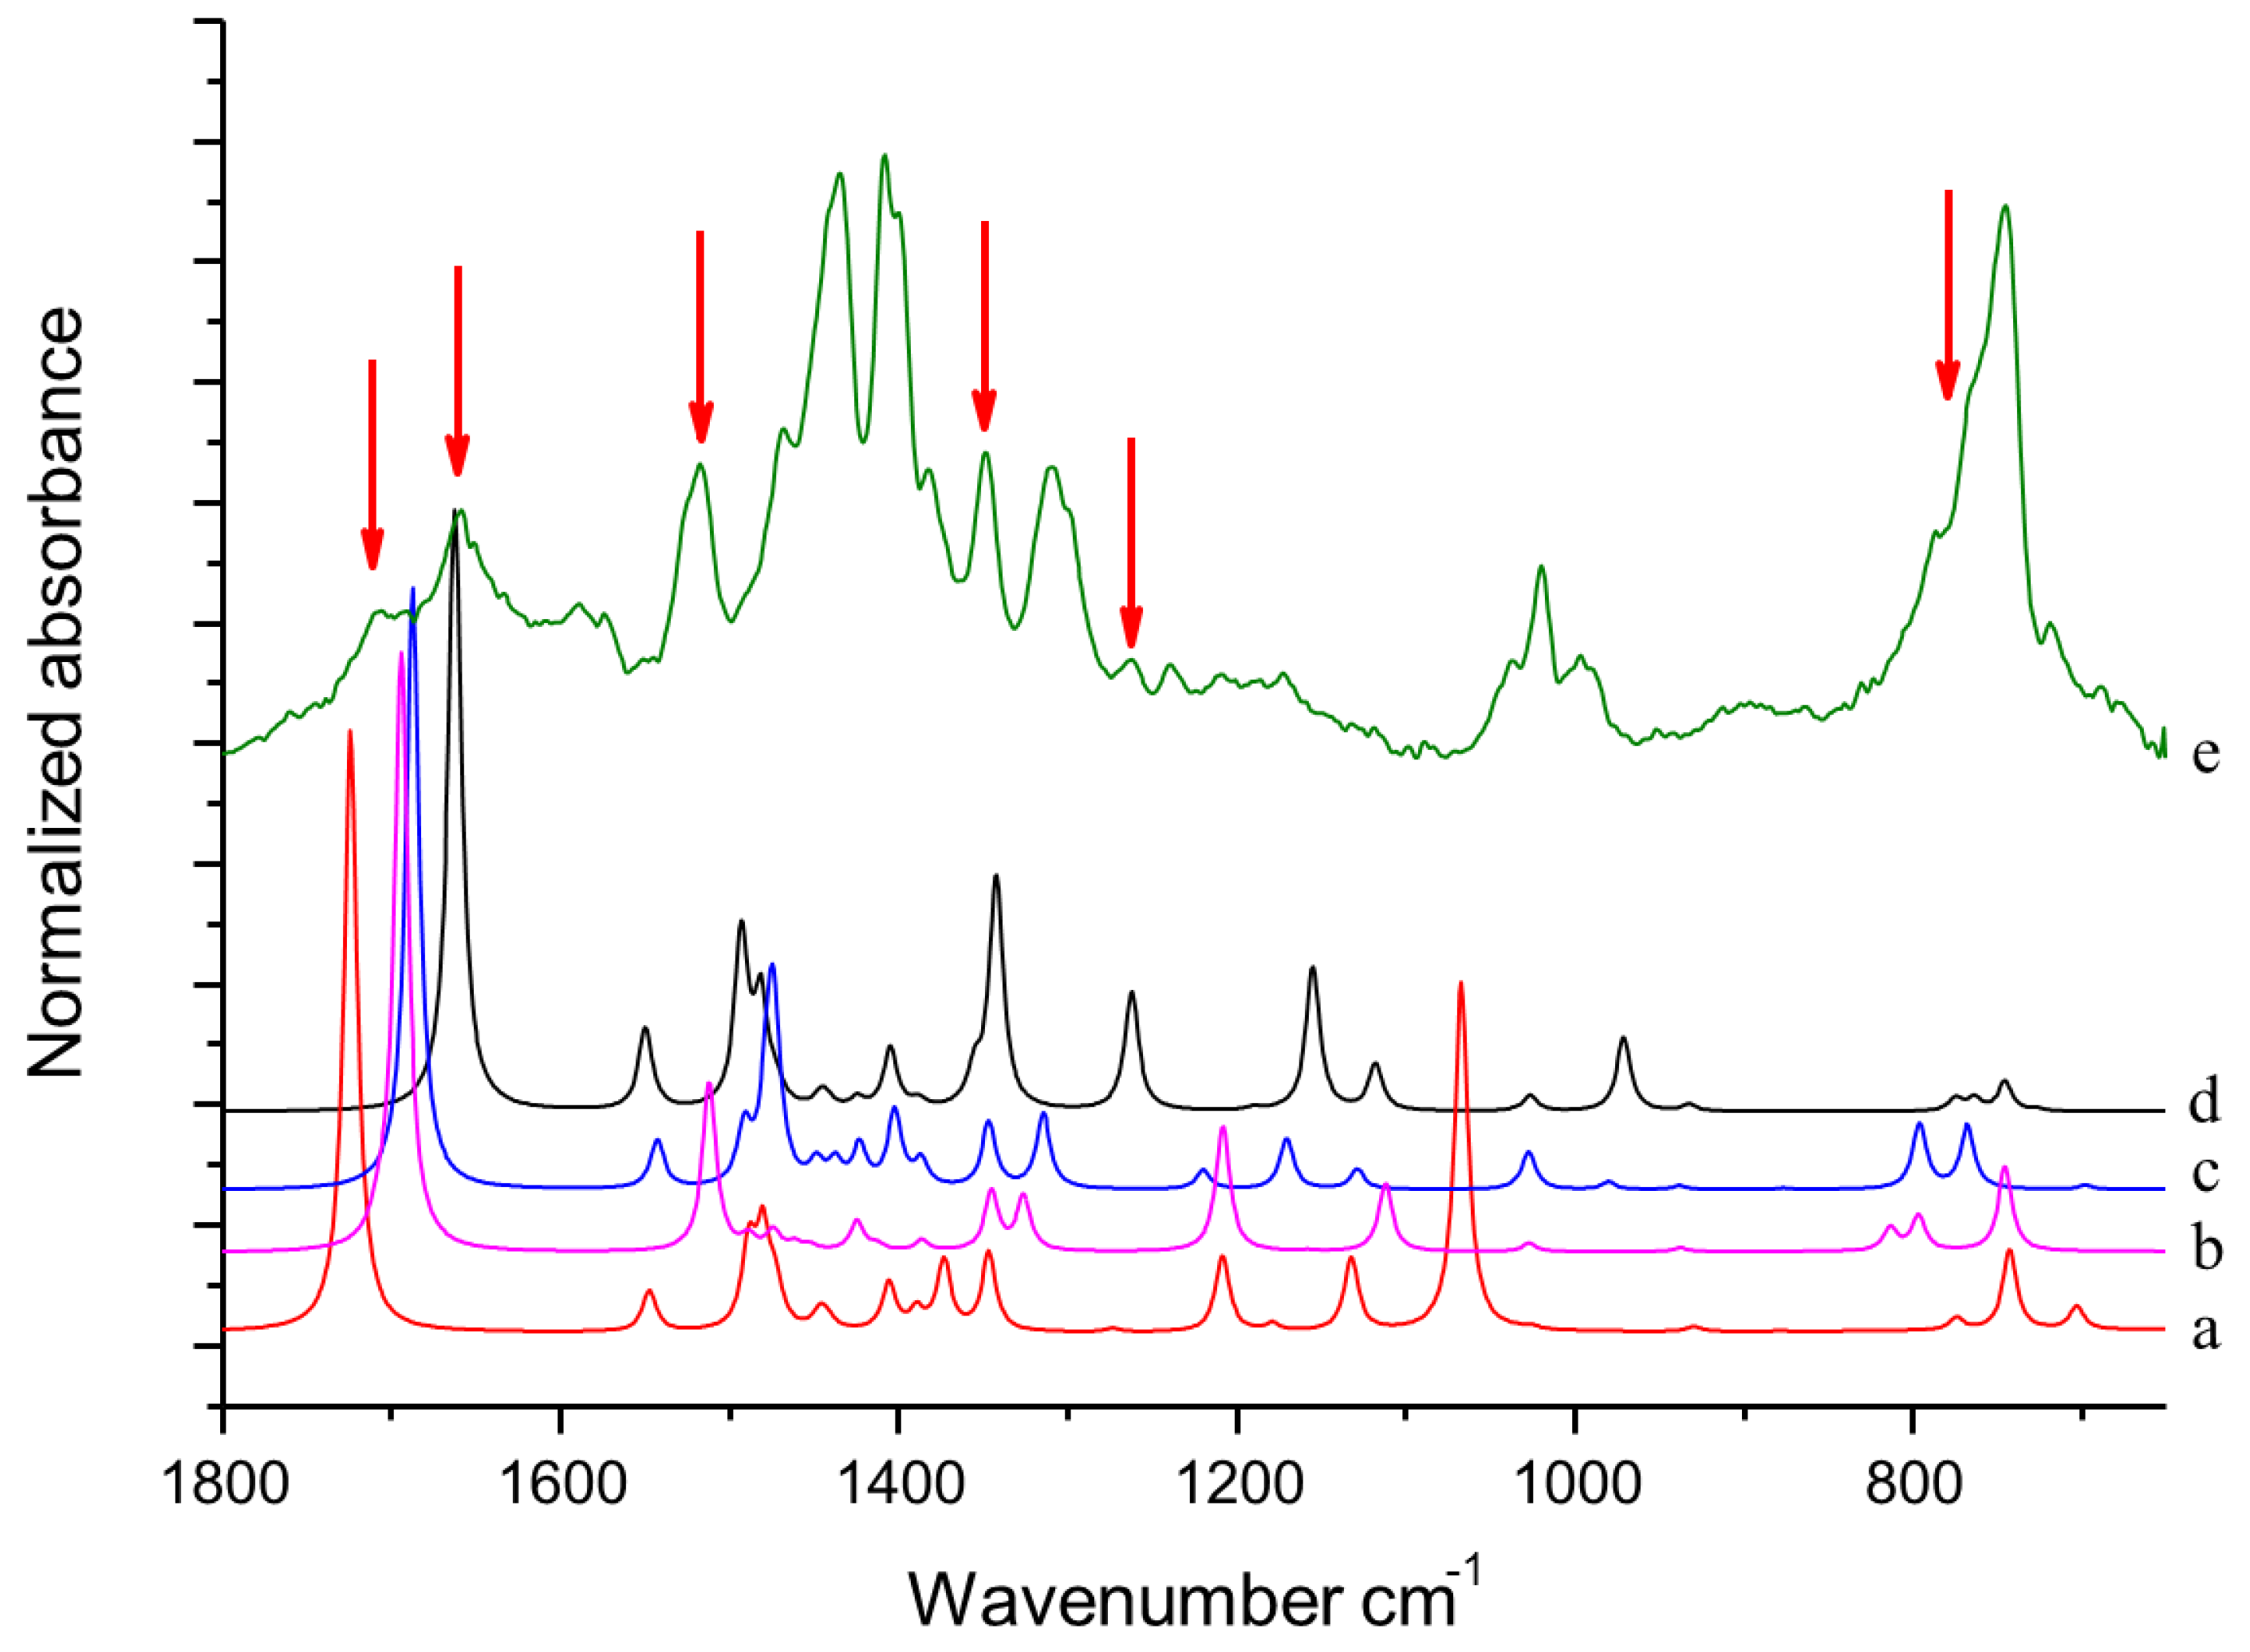
3.2 Reaction of HSAG with TMP: Solid Fraction.
3.3. Mechanism for the Formation of the Adduct Between TMP and Graphitic Substrate
4. Conclusions
Supplementary Materials
Author Contributions
Funding
Acknowledgments
Conflicts of Interest
References
- Novoselov, K.S.; Geim, A.K.; Morozov, S.V.; Jiang, D.; Zhang, Y.; Dubonos, S.V.; Grigorieva, I.V.; Firsov, A.A. Electric field effect in atomically thin carbon films. Science 2004, 306, 666–669. [Google Scholar] [CrossRef] [PubMed]
- Geim, A.K.; Novoselov, K.S. The Rise of Graphene. Nat. Mater. 2007, 6, 183. [Google Scholar] [CrossRef] [PubMed]
- Geim, A.K.; MacDonald, A.H. Graphene: Exploring Carbon Flatland. Phys. Today 2007, 60, 35–42. [Google Scholar]
- Service, R.F. Materials science. Carbon sheets an atom thick give rise to graphene dreams. Science 2009, 324, 875. [Google Scholar] [CrossRef]
- Novoselov, K.S.; Falko, V.I.; Colombo, L.; Gellert, P.R.; Schwab, M.G.; Kim, K. A roadmap for graphene. Nature 2012, 490, 192–200. [Google Scholar] [CrossRef] [PubMed]
- Zhang, Y.; Tan J, W.; Stormer, H.L.; Kim, P. Experimental Observation of the Quantum Hall Effect and Berry’s Phase in Graphene. Nature 2005, 438, 201–204. [Google Scholar] [CrossRef] [PubMed]
- Novoselov, K.S.; Geim, A.K.; Morozov, S.V.; Jiang, D.; Katsnelson, M.I.; Grigorieva, I.V.; Dubonos, S.V.; Firsov, A.A. Two-dimensional gas of massless Dirac fermions in graphene. Nature 2005, 438, 197–200. [Google Scholar] [CrossRef]
- Stoller, M.D.; Park, S.; Zhu, Y.; An, J.; Ruoff, R.S. Graphene-based ultracapacitors. Nano Lett. 2008, 8, 3498–3502. [Google Scholar] [CrossRef]
- Chen, S.; Moore, A.L.; Cai, W.; Suk, J.W.; An, J.; Mishra, C.; Amos, C.; Magnuson, C.W.; Kang, J.; Shi, L.; et al. Raman Measurements of Thermal Transport in Suspended Monolayer Graphene of Variable Sizes in Vacuum and Gaseous Environments. ACS Nano 2010, 5, 321–328. [Google Scholar] [CrossRef]
- Balandin, A.A. Thermal properties of graphene and nanostructured carbon materials. Nat. Mater. 2011, 10, 569–581. [Google Scholar] [CrossRef]
- Chen, S.; Wu, Q.; Mishra, C.; Kang, J.; Zhang, H.; Cho, K.; Cai, W.; Balandin, A.A.; Ruoff, R.S. Thermal conductivity of isotopically modified graphene. Nat. Mater. 2012, 11, 203–207. [Google Scholar] [CrossRef] [PubMed]
- Thostenson, E.T.; Li, C.Y.; Chou, T.W. Nanocomposites in Context. Compos. Sci. Technol. 2005, 65, 491–516. [Google Scholar] [CrossRef]
- Stankovich, S.; Dikin, D.A.; Dommett, G.H.B.; Kohlhaas, K.M.; Zimney, E.J.; Stach, E.A.; Piner, R.D.; Nguyen, S.T.; Ruoff, R.S. Graphene-based composite materials. Nature 2006, 442, 282–286. [Google Scholar] [CrossRef] [PubMed]
- Soldano, C.; Mahmood, A.; Dujardin, E. Production, properties and potential of graphene. Carbon 2010, 48, 2127–2150. [Google Scholar] [CrossRef]
- Liu, W.W.; Chai, S.P.; Mohamed, A.R.; Hashim, U. Synthesis and characterization of graphene and carbon nanotubes: A review on the past and recentdevelopments. J. Ind. Eng. Chem. 2014, 20, 1171–1185. [Google Scholar] [CrossRef]
- Rosca, I.D.; Hoa, S.V. Method for reducing contact resistivity of carbon nanotube-containing epoxy adhesives for aerospace applications. Compos. Sci. Technol. 2011, 71, 95–100. [Google Scholar] [CrossRef]
- Harrison, B.S.; Atala, A. Carbon nanotube applications for tissue engineering. Biomaterials 2007, 28, 344–353. [Google Scholar] [CrossRef]
- Cui, H.F.; Vashist, S.K.; Al-Rubeaan, K.; Luong, J.; Sheu, F.S. Interfacing carbon nanotubes with living mammalian cells and cytotoxicity issues. Chem. Res. Toxicol. 2010, 23, 1131–1147. [Google Scholar] [CrossRef]
- Miao, W.; Shim, G.; Kang, C.M.; Lee, S.; Choe, Y.S.; Choi, H.G.; Oh, Y.K. Cholesteryl hyaluronic acid-coated, reduced graphene oxide nanosheets for anti-cancer drug delivery. Biomaterials 2013, 34, 9638–9647. [Google Scholar] [CrossRef]
- Sahoo, N.G.; Bao, H.; Pan, Y.; Pal, M.; Kakran, M.; Cheng, H.K.F.; Li, L.; Tan, L.P. Functionalized carbon nanomaterials as nanocarriers for loading and delivery of a poorly water-soluble anticancer drug: A comparative study. Chem. Commun. 2011, 47, 5235–5237. [Google Scholar] [CrossRef]
- Farokhzad, O.C.; Langer, R. Impact of nanotechnology on drug delivery. ACS Nano 2009, 3, 16–20. [Google Scholar] [CrossRef] [PubMed]
- Yang, W.; Thordarson, P.; Gooding, J.J.; Ringer, S.P.; Braet, F. Carbon nanotubes for biological and biomedical applications. Nanotechnology 2007, 18, 412001. [Google Scholar] [CrossRef]
- Yang, Y.; Zhang, Y.M.; Chen, Y.; Zhao, D.; Chen, J.T.; Liu, Y. Construction of a graphene oxide based noncovalent multiple nanosupramolecular assembly as a scaffold for drug delivery. Chem. Eur. J. 2012, 18, 4208–4215. [Google Scholar] [CrossRef] [PubMed]
- Mao, H.Y.; Laurent, S.; Chen, W.; Akhavan, O.; Imani, M.; Ashkarran, A.A.; Mahmoudi, M. Graphene: Promises, facts, opportunities, and challenges in nanomedicine. Chem. Rev. 2013, 113, 3407–3424. [Google Scholar] [CrossRef] [PubMed]
- Plummer, J. Graphene synthesis: Molten bed. Nat. Mater. 2015, 14, 1186. [Google Scholar] [CrossRef]
- Yang, H.; Li, F.; Shan, C.; Han, D.; Zhang, Q.; Niu, L.; Ivaskab, A. Covalent functionalization of chemically converted graphene sheets via silane and its reinforcement. J. Mater. Chem. 2009, 19, 4632–4638. [Google Scholar] [CrossRef]
- Dreyer, D.R.; Park, S.; Bielawski, C.W.; Ruoff, R.S. The chemistry of graphene oxide. Chem. Soc. Rev. 2010, 39, 228–240. [Google Scholar] [CrossRef] [PubMed]
- Collins, W.R.; Lewandowski, W.; Schmois, E.; Walish, J.; Swager, T.M. Claisen Rearrangement of Graphite Oxide: A Route to Covalently Functionalized Graphenes. Angew. Chem. Int. Ed. 2011, 50, 8848–8852. [Google Scholar] [CrossRef]
- Li, W.; Tang, X.-Z.; Zhang, H.-B.; Jiang, Z.-G.; Yu, Z.-Z.; Du, X.-S.; Mai, Y.-W. Simultaneous surface functionalization and reduction of graphene oxide with octadecylamine for electrically conductive polystyrene composites. Carbon 2011, 49, 4724–4730. [Google Scholar] [CrossRef]
- Tang, Z.; Zeng, C.; Lei, Y.; Guo, B.; Zhang, L.; Jia, D. Fluorescent whitening agent stabilized graphene and its composites with chitosan. J. Mater. Chem. 2011, 21, 17111–17118. [Google Scholar] [CrossRef]
- Sarkar, S.; Bekyarova, E.; Haddon, R.C. Chemistry at the Dirac Point: Diels-Alder Reactivity of Graphene. Acc. Chem. Res. 2012, 45, 673–682. [Google Scholar] [CrossRef] [PubMed]
- Swager, T.M. Functional Graphene: Top-Down Chemistry of the π-Surface. ACS Macro Lett. 2012, 1, 3–5. [Google Scholar] [CrossRef]
- Zaman, I.; Kuan, H.-C.; Meng, Q.; Michelmore, A.; Kawashima, N.; Pitt, T.; Zhang, L.; Gouda, S.; Luong, L.; Ma, J. A Facile Approach to Chemically Modified Graphene and its Polymer Nanocomposites. Adv. Funct. Mater. 2012, 22, 2735–2743. [Google Scholar] [CrossRef]
- Huang, X.; Qi, X.; Boeya, F.; Zhang, H. Graphene-based composites. Chem. Soc. Rev. 2012, 41, 666–686. [Google Scholar] [CrossRef] [PubMed]
- Chua, C.K.; Pumera, M. Covalent chemistry on graphene. Chem. Soc. Rev. 2013, 42, 3222–3233. [Google Scholar] [CrossRef] [PubMed]
- Liu, K.; Chen, S.; Luo, Y.; Jia, D.; Gao, H.; Hu, G.; Liu, L. Edge-functionalized graphene as reinforcement of epoxy-based conductive composite for electrical interconnects. Compos. Sci. Technol. 2013, 88, 84–91. [Google Scholar] [CrossRef]
- Bhattacharjya, D.; Jeon, I.Y.; Park, H.Y.; Panja, T.; Baek, J.B.; Yu, J.S. Graphene Nanoplatelets with Selectively Functionalized Edges as Electrode Material for Electrochemical Energy Storage. Langmuir 2015, 31, 5676–5683. [Google Scholar] [CrossRef]
- Narita, A.; Wang, X.Y.; Feng, X.; Müllen, K. New advances in nanographene chemistry. Chem. Soc. Rev. 2015, 44, 6616–6643. [Google Scholar] [CrossRef]
- Xiong, P.; Zhu, J.; Zhang, L.; Wang, X. Recent advances in graphene-based hybrid nanostructures for electrochemical energy storage. Nanoscale Horiz. 2016, 1, 340–374. [Google Scholar] [CrossRef]
- Punetha, V.D.; Rana, S.; Yoo, H.J.; Chaurasia, A.; McLeskey, J.T., Jr.; Ramasamy, M.S.; Sahoo, N.G.; Cho, J.W. Functionalization of carbon nanomaterials for advanced polymer nanocomposites: A comparison study between CNT and graphene. Prog. Polym. Sci. 2016, 67, 1–47. [Google Scholar] [CrossRef]
- Xu, Y.; Cao, H.; Xue, Y.; Li, B.; Cai, W. Liquid-Phase Exfoliation of Graphene: An Overview on Exfoliation Media, Techniques, and Challenges. Nanomaterials 2018, 8, 942. [Google Scholar] [CrossRef] [PubMed]
- Ibarra-Hernández, A.; Vega-Rios, A.; Osuna, V. Synthesis of Graphite Oxide with Different Surface Oxygen Contents Assisted Microwave Radiation. Nanomaterials 2018, 8, 106. [Google Scholar] [CrossRef] [PubMed]
- Galimberti, M.; Barbera, V.; Guerra, S.; Conzatti, L.; Castiglioni, C.; Brambilla, L.; Serafini, A. Biobased Janus molecule for the facile preparation of water solutions of few layer graphene sheets. RSC Adv. 2015, 5, 81142–81152. [Google Scholar] [CrossRef]
- Galimberti, M.; Barbera, V.; Citterio, A.; Sebastiano, R.; Truscello, A.; Valerio, A.M.; Conzatti, L.; Mendichi, R. Supramolecular interactions of carbon nanotubes with biosourced polyurethanes from 2-(2,5-dimethyl-1H-pyrrol-1-yl)-1, 3-propanediol. Polymer 2015, 63, 62–70. [Google Scholar] [CrossRef]
- Barbera, V.; Musto, S.; Citterio, A.; Conzatti, L.; Galimberti, M. Polyether from a biobased Janus molecule as surfactant for carbon nanotubes. Express Polym. Lett. 2016, 10, 548–558. [Google Scholar] [CrossRef]
- Barbera, V.; Bernardi, A.; Palazzolo, A.; Rosengart, A.; Brambilla, L.; Galimberti, M. Facile and sustainable functionalization of graphene layers with pyrrole compounds. Pure Appl. Chem. 2018, 90, 253–270. [Google Scholar] [CrossRef]
- Barbera, V.; Bernardi, A.; Torrisi, G.; Porta, A.; Galimberti, M. Controlled functionalization of sp2 carbon allotropes for the reinforcement of diene elastomers. Elastomery 2017, 21, 235–251. [Google Scholar]
- Galimberti, M.; Barbera, V.; Guerra, S.; Bernardi, A. Facile functionalization of sp2 carbon allotropes with a biobased Janus molecule. Rubber Chem. Technol. 2017, 90, 285–307. [Google Scholar] [CrossRef]
- Barbera, V.; Porta, A.; Brambilla, L.; Guerra, S.; Serafini, A.; Valerio, A.M.; Galimberti, M. Polyhydroxylated few layer graphene for the preparation of flexible conductive carbon paper. RSC Adv. 2016, 6, 87767–87777. [Google Scholar] [CrossRef]
- Barbera, V.; Guerra, S.; Brambilla, L.; Maggio, M.; Serafini, A.; Conzatti, L.; Vitale, A.; Galimberti, M. Carbon papers and aerogels based on graphene layers and chitosan: Direct preparation from high surface area graphite. Biomacromolecules 2017, 18, 3978–3999. [Google Scholar] [CrossRef]
- Barbera, V.; Brambilla, L.; Porta, A.; Bongiovanni, R.M.; Vitale, A.; Torrisi, G.; Galimberti, M. Selective edge functionalization of graphene layers with oxygenated groups by means of Reimer-Tiemann and domino Reimer-Tiemann/Cannizzaro reactions. J. Mater. Chem. A 2018, 6, 7749–7761. [Google Scholar] [CrossRef]
- Milani, A.; Castiglioni, C.; Di Dedda, E.; Radice, S.; Canil, G.; Di Meo, A.; Picozzi, R.; Tonelli, C. Hydrogen bonding effects in perfluorinated polyamides: An investigation based on infrared spectroscopy and density functional theory calculations. Polymer 2010, 51, 2597–2610. [Google Scholar] [CrossRef]
- Milani, A.; Tommasini, M.; Castiglioni, C.; Zerbi, G.; Radice, S.; Canil, G.; Toniolo, P.; Triulzi, F.; Colaianna, P. Spectroscopic studies and first-principles modelling of 2,2,4-trifluoro-5-trifluoromethoxy-1,3-dioxole (TTD) and TTD–TFE copolymers (Hyflon® AD). Polymer 2008, 49, 1812–1822. [Google Scholar] [CrossRef]
- Quarti, C.; Milani, A.; Civalleri, B.; Orlando, R.; Castiglioni, C. Ab initio calculation of the crystalline structure and IR spectrum of polymers: Nylon 6 polymorphs. J. Phys. Chem. B 2012, 116, 8299–8311. [Google Scholar] [CrossRef] [PubMed]
- Frisch, M.J.; Trucks, G.W.; Schlegel, H.B.; Scuseria, G.E.; Robb, M.A.; Cheeseman, J.R.; Scalmani, G.; Barone, V.; Petersson, G.A.; Nakatsuji, H.; et al. Gaussian 09; revision A.02; Gaussian Inc.: Wallingford, CT, USA, 2016. [Google Scholar]
- Rodriguez-Reinoso, F. The role of carbon materials in heterogeneous catalysis. Carbon 1998, 36, 159–175. [Google Scholar] [CrossRef]
- Ferrari, A.C. Raman spectroscopy of graphene and graphite: Disorder, electron–phonon coupling, doping and nonadiabatic effects. Solid State Commun. 2007, 143, 47–57. [Google Scholar] [CrossRef]
- Reich, S.; Thomsen, C. Raman spectroscopy of graphite. Philos. Trans. R. Soc. Lond. A 2004, 362, 2271–2288. [Google Scholar] [CrossRef]
- Pimenta, M.A.; Dresselhaus, G.; Dresselhaus, M.S.; Cancado, L.G.; Jorio, A.; Saito, R. Studying disorder in graphite-based systems by Raman spectroscopy. Phys. Chem. Chem. Phys. 2007, 9, 1276–1290. [Google Scholar] [CrossRef]
- Castiglioni, C.; Tommasini, M.; Zerbi, G. Raman spectroscopy of polyconjugated molecules and materials: Confinement effect in one and two dimensions. Philos. Trans. R. Soc. Lond. A 2004, 362, 2425–2459. [Google Scholar] [CrossRef]
- Graf, D.; Molitor, F.; Ensslin, K.; Stampfer, C.; Jungen, A.; Hierold, C.; Wirtz, L. Spatially resolved Raman spectroscopy of single-and few-layer graphene. Nano Lett. 2007, 7, 238–242. [Google Scholar] [CrossRef]
- Casiraghi, C.; Hartschuh, A.; Qian, H.; Piscanec, S.; Georgi, C.; Fasoli, A.; Ferrari, A.C. Raman Spectroscopy of Graphene Edges. Nano Lett. 2009, 9, 1433–1441. [Google Scholar] [CrossRef] [PubMed]
- Radovic, L.R.; Bockrath, B. On the Chemical Nature of Graphene Edges: Origin of Stability and Potential for Magnetism in Carbon Materials. J. Am. Chem. Soc. 2005, 127, 5517–5927. [Google Scholar] [CrossRef] [PubMed]
- Tommasini, M.; Castiglioni, C.; Zerbi, G.; Barbon, A.; Brustolon, M. A joint Raman and EPR spectroscopic study on ball-milled nanographites. Chem. Phys. Lett. 2011, 516, 220–224. [Google Scholar] [CrossRef]
- Quintana, M.; Spyrou, K.; Grzelczak, M.; Browne, W.R.; Rudolf, P.; Prato, M. Functionalization of graphene via 1,3-dipolar cycloaddition. ACS Nano 2010, 4, 3527–3533. [Google Scholar] [CrossRef] [PubMed]
- Rubio, N.; Fabbro, C.; Herrero, M.A.; de la Hoz, A.; Meneghetti, M.; Fierro, J.L.; Prato, M.; Vázquez, E. Ball-Milling Modification of Single-Walled Carbon Nanotubes: Purification, Cutting, and Functionalization. Small 2011, 7, 665–674. [Google Scholar] [CrossRef] [PubMed]
- Lucío, M.I.; Pichler, F.; Ramírez, J.R.; de la Hoz, A.; Sánchez-Migallón, A.; Hadad, C.; Quintana, M.; Giulani, A.; Bracamonte, M.V.; Fierro, J.L.; et al. Triazine-Carbon Nanotubes: New Platforms for the Design of Flavin Receptors. Chem. A Eur. J. 2016, 22, 8879–8888. [Google Scholar] [CrossRef] [PubMed]
- Mineo, P.; Barbera, V.; Romeo, G.; Ghezzo, F.; Scamporrino, E.; Spitaleri, F.; Chiacchio, U. Thermally reversible highly cross-linked polymeric materials based on furan/maleimide Diels-Alder adducts. J. Appl. Polym. Sci. 2015, 132. [Google Scholar] [CrossRef]


| Experimental Wavenumber (cm−1) | From DFT (scaled values, f = 0.978) Wavenumber (cm−1) | Vibrational Assignment |
|---|---|---|
| 1575 | 1574 | anti-symm C=C stretching |
| 1520 | 1517 | symm C=C stretching |
| 1441 1429 | 1460 1450 1435 | CH3 bending |
| 1405 | 1403 | CH3 umbrella, symm CN stretching |
| 1382 | 1385 | CH3 umbrella |
| 1346 | 1358 | anti-symm CN stretching |
| 1305 | 1299 | Ring breathing |
| 1216 | 1212 | CH (sp2) in-plane wagging |
| 1190 | 1184 | C–N–C bending, N–CH3 stretching |
| 1220 (vw, broad) | 1113 | CH3 rocking |
| 1038 | 1038 | CH3 rocking |
| 1019 | 1019 | in-plane CH wagging |
| 998 | 993 | CH3 rocking |
| 974 | 966 | CH3 rocking + ring torsion |
| 746 | 741 | CH opla |
| 717 | 706 | collective symmetric CN stretching |
 DMP-CHO (1,5-dimethyl-1H-pyrrole-2-carbaldehyde) |  MP-(CHO)2 (1-methyl-1H-pyrrole-2,5-dicarbaldehyde) |
 DMP-COOH (1,5-dimethyl-1H-pyrrole-2-carboxylic acid) |  DMP-COOH dimer (1,5-dimethyl-1H-pyrrole-2-carboxylic acid) |
 (DMP)2 (1,1′,5,5′-tetramethyl-1H,1′H-2,2′-bipyrrole) | |
 Amide-CHO ((Z)-N-(4-oxobut-2-en-2-yl)formamide) |  Amide-COOH ((Z)-3-formamidobut-2-enoic acid) |
 A (Anthracene) |  A/DMP-CHO adduct (12,13-dimethyl-10,11,12,13-tetrahydro-9H-9,10-[2,3]epipyrroloanthracene-14-carbaldehyde) |
| Sample | C1s (at. %) | O1s (at. %) | N1s (at. %) | O1s/C1s | N1s/O1s | N1s/C1s |
|---|---|---|---|---|---|---|
| HSAG | 95.8 | 4.2 | 0 | 0.04 | 0 | 0 |
| HSAG/TMP 80 °C | 81.8 | 10.8 | 7.4 | 0.13 | 0.68 | 0.09 |
| HSAG/TMP 130 °C | 76.6 | 15.9 | 7.5 | 0.21 | 0.47 | 0.1 |
| HSAG/TMP 180 °C | 87.9 | 6.5 | 5.6 | 0.07 | 0.86 | 0.06 |
© 2018 by the authors. Licensee MDPI, Basel, Switzerland. This article is an open access article distributed under the terms and conditions of the Creative Commons Attribution (CC BY) license (http://creativecommons.org/licenses/by/4.0/).
Share and Cite
Barbera, V.; Brambilla, L.; Milani, A.; Palazzolo, A.; Castiglioni, C.; Vitale, A.; Bongiovanni, R.; Galimberti, M. Domino Reaction for the Sustainable Functionalization of Few-Layer Graphene. Nanomaterials 2019, 9, 44. https://doi.org/10.3390/nano9010044
Barbera V, Brambilla L, Milani A, Palazzolo A, Castiglioni C, Vitale A, Bongiovanni R, Galimberti M. Domino Reaction for the Sustainable Functionalization of Few-Layer Graphene. Nanomaterials. 2019; 9(1):44. https://doi.org/10.3390/nano9010044
Chicago/Turabian StyleBarbera, Vincenzina, Luigi Brambilla, Alberto Milani, Alberto Palazzolo, Chiara Castiglioni, Alessandra Vitale, Roberta Bongiovanni, and Maurizio Galimberti. 2019. "Domino Reaction for the Sustainable Functionalization of Few-Layer Graphene" Nanomaterials 9, no. 1: 44. https://doi.org/10.3390/nano9010044
APA StyleBarbera, V., Brambilla, L., Milani, A., Palazzolo, A., Castiglioni, C., Vitale, A., Bongiovanni, R., & Galimberti, M. (2019). Domino Reaction for the Sustainable Functionalization of Few-Layer Graphene. Nanomaterials, 9(1), 44. https://doi.org/10.3390/nano9010044