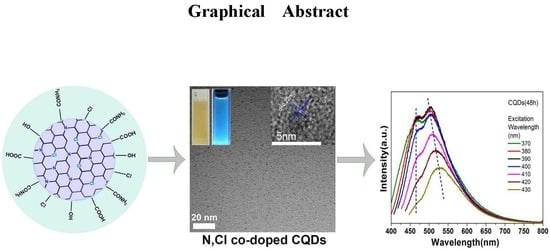
Tailoring Blue-Green Double Emissions in Carbon Quantum Dots via Co-Doping Engineering by Competition Mechanism between Chlorine-Related States and Conjugated π-Domains

Abstract
1. Introduction
2. Experimental
2.1. Materials
2.2. Synthesis of N,Cl Co-Doped CQDs
2.3. Characterization
3. Results and Discussion
3.1. Effects of Reagent Ratio
3.2. Effects of Reaction Time
4. Conclusions
Author Contributions
Funding
Conflicts of Interest
References
- Svedendahl, M.; Verre, R.; Kall, M. Refractometric Biosensing Based on Optical Phase Flips in Sparse and Short-Range-Ordered Nanoplasmonic Layers. Light Sci. Appl. 2014, 3, e220. [Google Scholar] [CrossRef]
- Zhu, Z.; Bai, B.; You, O.; Li, Q.; Fan, S. Fano resonance boosted cascaded optical field enhancement in a plasmonic nanoparticle-in-cavity nanoantenna array and its SERS application. Light Sci. Appl. 2015, 4, e296. [Google Scholar] [CrossRef]
- Wang, P.; Wang, Y.; Tong, L. Graphene-doped polymer nanofibers for low-threshold nonlinear optical waveguiding. Light Sci. Appl. 2013, 2, e102. [Google Scholar] [CrossRef]
- Li, X.; Xing, L.; Zheng, K.; Wei, P.; Du, L.; Shen, M.; Shi, X. Formation of gold nanostar-coated hollow mesoporous silica for tumor multimodality imaging and photothermal therapy. ACS Appl. Mater. Interfaces 2017, 9, 5817–5827. [Google Scholar] [CrossRef] [PubMed]
- Aslam, U.; Chavez, S.; Linic, S. Controlling energy flow in multimetallic nanostructures for plasmonic catalysis. Nat. Nano 2017, 12, 1000–1005. [Google Scholar] [CrossRef] [PubMed]
- Zhang, Q.; Wang, H. Facet-Dependent Catalytic Activities of Au Nanoparticles Enclosed by High-Index Facets. ACS Catal. 2014, 4, 4027–4033. [Google Scholar] [CrossRef]
- Karabchevsky, A.; Mosayyebi, A.; Kavokin, A.V. Tuning the chemiluminescence of a luminol flow using plasmonic nanoparticles. Light Sci. Appl. 2016, 5, 1–7. [Google Scholar] [CrossRef]
- Linnenbank, H.; Grynko, Y.; Forstner, J.; Linden, S. Second harmonic generation spectroscopy on hybrid plasmonic/dielectric nanoantennas. Light Sci. Appl. 2016, 5, e16013. [Google Scholar] [CrossRef]
- Blum, O.; Shaked, N.T. Prediction of photothermal phase signatures from arbitrary plasmonic nanoparticles and experimental verification. Light Sci. Appl. 2015, 4, e322. [Google Scholar] [CrossRef]
- Zhu, J.; Mei, S.; Yang, W.; Zhang, G.; Chen, Q.; Zhang, W.; Guo, R. Tunable emission of Cu (Mn)-doped ZnInS quantum dots via dopant interaction. J. Colloid Interface Sci. 2017, 506, 27–35. [Google Scholar] [CrossRef] [PubMed]
- Chen, B.; Meng, Q.; Zhong, H.; Sun, J.; Cheng, L.; Peng, Y.; Yu, T.; Chen, M. Quantum efficiency and surface passivation effect of nanocrystalline Y2O3:Eu3+. J. Nanosci. Nanotechnol. 2008, 8, 1165–1169. [Google Scholar] [PubMed]
- Chong, Y.; Ma, Y.; Shen, H.; Tu, X.; Zhou, X.; Xu, J.; Dai, J.; Fan, S.; Zhang, Z. The in vitro and in vivo toxicity of graphene quantum dots. Biomaterials 2014, 35, 5041–5048. [Google Scholar] [CrossRef] [PubMed]
- Liu, Q.; Guo, B.; Rao, Z.; Zhang, B.; Gong, J.R. Strong two-photon-induced fluorescence from photostable, biocompatible nitrogen-doped graphene quantum dots for cellular and deep-tissue imaging. Nano Lett. 2013, 13, 2436–2441. [Google Scholar] [CrossRef] [PubMed]
- Tan, X.; Li, Y.; Li, X.; Zhou, S.; Fan, L.; Yang, S. Electrochemical synthesis of small-sized red fluorescent graphene quantum dots as a bioimaging platform. Chem. Commun. 2015, 51, 2544–2546. [Google Scholar] [CrossRef] [PubMed]
- Ding, C.; Zhu, A.; Tian, Y. Functional surface engineering of c-dots for fluorescent biosensing and in vivo bioimaging. Acc. Chem. Res. 2013, 47, 20–30. [Google Scholar] [CrossRef] [PubMed]
- Suzuki, K.; Malfatti, L.; Takahashi, M.; Carboni, D.; Messina, F.; Tokudome, Y.; Takemoto, M.; Innocenzi, P. Design of carbon dots photoluminescence through organo-functional silane grafting for solid-state emitting devices. Sci. Rep. 2017, 7, 5469. [Google Scholar] [CrossRef] [PubMed]
- Qu, D.; Zheng, M.; Du, P.; Zhou, Y.; Zhang, L.; Li, D.; Tan, H.; Zhao, Z.; Xie, Z.; Sun, Z. Highly luminescent s, n co-doped graphene quantum dots with broad visible absorption bands for visible light photocatalysts. Nanoscale 2013, 5, 12272–12277. [Google Scholar] [CrossRef] [PubMed]
- Qu, D.; Zheng, M.; Li, J.; Xie, Z.; Sun, Z. Tailoring color emissions from n-doped graphene quantum dots for bioimaging applications. Light Sci. Appl. 2015, 4, e364. [Google Scholar] [CrossRef]
- Wang, D.W.; Wu, K.H.; Gentle, I.R.; Lu, G.Q. Anodic chlorine/nitrogen co-doping of reduced graphene oxide films at room temperature. Carbon 2012, 50, 3333–3341. [Google Scholar] [CrossRef]
- Wu, Y.; Lin, X.; Shen, X.; Sun, X.; Liu, X.; Wang, Z.; Kim, J. Exceptional dielectric properties of chlorine-doped graphene oxide/poly (vinylidene fluoride) nanocomposites. Carbon 2015, 89, 102–112. [Google Scholar] [CrossRef]
- Yang, S.; Sun, J.; Li, X.; Zhou, W.; Wang, Z.; He, P.; Ding, G.Q.; Xie, X.M.; Kang, Z.H.; Jiang, M.H. Large-scale fabrication of heavy doped carbon quantum dots with tunable-photoluminescence and sensitive fluorescence detection. J. Mater. Chem. A 2014, 2, 8660–8667. [Google Scholar] [CrossRef]
- Bourlinos, A.B.; Zbořil, R.; Petr, J.; Bakandritsos, A.; Krysmann, M.; Giannelis, E.P. Luminescent surface quaternized carbon dots. Chem. Mater. 2012, 24, 6–8. [Google Scholar] [CrossRef]
- Li, H.; He, X.; Kang, Z.; Huang, H.; Liu, Y.; Liu, J.; Lian, S.; Tsang, C.H.; Yang, X.; Lee, S.T. Water-soluble fluorescent carbon quantum dots and photocatalyst design. Angew. Chem. 2010, 122, 4532–4536. [Google Scholar] [CrossRef]
- Hu, S.L.; Niu, K.Y.; Sun, J.; Yang, J.; Zhao, N.Q.; Du, X.W. One-step synthesis of fluorescent carbon nanoparticles by laser irradiation. J. Mater. Chem. 2009, 19, 484–488. [Google Scholar] [CrossRef]
- Jin, S.H.; Kim, D.H.; Jun, G.H.; Hong, S.H.; Jeon, S. Tuning the photoluminescence of graphene quantum dots through the charge transfer effect of functional groups. ACS Nano 2013, 7, 1239–1245. [Google Scholar] [CrossRef] [PubMed]
- Chen, W.F.; Lv, G.; Hu, W.M.; Li, D.J.; Chen, S.N.; Dai, Z.X. Synthesis and applications of graphene quantum dots: A review. Nanotechnol. Rev. 2018, 7, 157–185. [Google Scholar] [CrossRef]
- Iannazzo, D.; Ziccarelli, I.; Pistone, A. Graphene quantum dots: Multifunctional nanoplatforms for anticancer therapy. J. Mater. Chem. B 2017, 5, 6471–6489. [Google Scholar] [CrossRef]
- Li, X.; Shu, P.L.; Tang, L.; Ji, R.; Yang, P. Multicolour light emission from chlorine-doped graphene quantum dots. J. Mater. Chem. C 2013, 1, 7308–7313. [Google Scholar] [CrossRef]
- Zhao, J.; Tang, L.; Xiang, J.; Ji, R.; Yuan, J.; Zhao, J.; Yu, R.Y.; Tai, Y.J.; Song, L.Y. Chlorine doped graphene quantum dots: Preparation, properties, and photovoltaic detectors. Appl. Phys. Lett. 2014, 105, 8869. [Google Scholar] [CrossRef]
- Xing, G.Z.; Wang, Y.; Wong, J.I.; Shi, Y.M.; Huang, Z.X.; Li, S.; Yang, H.Y. Hybrid CuO/SnO2 nanocomposites: Towards cost-effective and high performance binder free lithium ion batteries anode materials. Appl. Phys. Lett. 2014, 105, 143905. [Google Scholar] [CrossRef]
- Xing, G.Z.; Wang, D.D.; Cheng, C.J.; He, M.; Li, S.; Wu, T. Emergent ferromagnetism in ZnO/Al2O3 core-shell nanowires: Towards oxide spinterfaces. Appl. Phys. Lett. 2013, 103, 022402. [Google Scholar] [CrossRef]
- Sun, Y.; Li, Q. Research of zinc oxide quantum dot light-emitting diodes based on preparation of chemical solutions. Chin. J. Liq. Cryst. Disp. 2016, 31, 635–642. [Google Scholar] [CrossRef]
- Chen, X.Y.; Tian, Z. Recent progress in terahertz dynamic modulation based on graphene. Chin. Opt. 2017, 10, 86–97. [Google Scholar] [CrossRef]
- Tong, L.; Mei-ling, Z.; Fei, W.; Da-ming, Z.; Guo-ping, W. Fabrication of optical waveguide amplifiers based on bonding-type NaYF4: Er nanoparticles-polymer. Chin. Opt. 2017, 10, 219–225. [Google Scholar] [CrossRef]
- Huang, J.M.; Chen, E.G.; Guo, T.L. White-balance characteristic of quantum-dot backlight. Chin. J. Liq. Cryst. Disp. 2017, 32, 77. [Google Scholar] [CrossRef]
- Sun, J.H.; Sui, H.D.; Wang, Z.W.; Wang, K.; Yan, Y.; Qi, L.U.; Ling, L. Preparation of europium-doped nano-TiO2 transparent photocatalyst emulsion and photocatalytic performance. Chin. Opt. 2017, 10, 761–767. [Google Scholar]
- Qi, Y.L.; Wang, D.; Qiu, Y.; Shi, G.D. Ultro-high color gamut and patterned color filter based on quantum dot photoresist. Chin. J. Liq. Cryst. Disp. 2017, 32, 169. [Google Scholar]
- Du, J.L.; Gao, B.R.; Wang, H.Y.; Chen, Q.D. Dynamics of low-threshold random laser based on TiO2 nanoparticle films. Chin. Opt. 2016, 9, 249–254. [Google Scholar] [CrossRef]
- Wu, J.; Wang, H.; Su, Z.; Zhang, M.; Hu, X.; Wang, Y.; Wang, Z.; Zhong, B.; Zhou, W.; Liu, J.; et al. Highly flexible and sensitive wearable e-skin based on graphite nanoplatelet and polyurethane nanocomposite films in mass industry production available. ACS Appl. Mater. Interfaces 2017, 9, 38745–38754. [Google Scholar] [CrossRef] [PubMed]
- Hong-Lei, J.I.; Zhou, Q.C.; Pan, J.; Bai, Z.L.; Zhong, H.Z. Advances and prospects in quantum dots based backlights. Chin. Opt. 2017, 10, 666–680. [Google Scholar] [CrossRef]
- Zhang, F.; Xue, J.S.; Yu, Z.N.; Zhou, W.F.; Hui, G.B. Quantum-dot light emitting device for displays. Chin. J. Liq. Cryst. Disp. 2012, 27, 163–167. [Google Scholar] [CrossRef]
- Qu, D.; Zheng, M.; Zhang, L.; Zhao, H.; Xie, Z.; Jing, X.; Haddad, R.E.; Fan, H.; Sun, Z. Formation mechanism and optimization of highly luminescent N-doped graphene quantum dots. Sci. Rep. 2014, 4, 5294. [Google Scholar] [CrossRef] [PubMed]
- Zhang, M.; Xia, P.; Wang, L.; Zheng, J.; Wang, Y.; Xu, J.; Wang, L. Synthesis and fabrication of CNTs/Fe3O4@Pdop@Au nanocables by a facile approach. RSC Adv. 2014, 4, 44423–44426. [Google Scholar] [CrossRef]
- Matioli, E.; Brinkley, S.; Kelchner, K.M.; Hu, Y.L.; Nakamura, S.; DenBaars, S.; Speck, J.; Weisbuch, C. High-brightness polarized light-emitting diodes. Light Sci. Appl. 2012, 1, 479–482. [Google Scholar] [CrossRef]
- Mitra, S.; Chandra, S.; Pathan, S.H.; Sikdar, N.; Pramanik, P. Room temperature and solvothermal green synthesis of self passivated carbon quantum dots. RSC Adv. 2013, 3, 3189–3193. [Google Scholar] [CrossRef]
- Li, L.; Guo, W.; Yan, Y.; Lee, S.; Wang, T. Label-free super-resolution imaging of adenoviruses by submerged microsphere optical nanoscopy. Light Sci. Appl. 2013, 2, e104. [Google Scholar] [CrossRef]
- Shen, J.; Zhu, Y.; Chen, C.; Yang, X.; Li, C. Facile preparation and upconversion luminescence of graphene quantum dots. Chem. Commun. 2011, 47, 2580–2582. [Google Scholar] [CrossRef] [PubMed]
- Xing, G.; Wang, D.; Yi, J.; Yang, L.; Gao, M.; He, M.; Yang, J.; Ding, J.; Sum, T.C.; Wu, T. Correlated d0 ferromagnetism and photoluminescence in undoped ZnO nanowires. Appl. Phys. Lett. 2010, 96, 112511. [Google Scholar] [CrossRef]
- Cheng, X.; Zhang, J.; Ding, T.; Wei, Z.; Li, H.; Wang, Z. The effect of an electric field on the thermomechanical damage of nodular defects in dielectric multilayer coatings irradiated by nanosecond laser pulses. Light Sci. Appl. 2013, 2, e80. [Google Scholar] [CrossRef]
- Wang, D.D.; Xing, G.Z.; Yan, F.; Yan, Y.S.; Li, S. Ferromagnetic (Mn, N)-codoped ZnO nanopillars array: Experimental and computational insights. Appl. Phys. Lett. 2014, 104, 022412. [Google Scholar] [CrossRef]
- Pincella, F.; Isozaki, K.; Miki, K. A visible light-driven plasmonic photocatalyst. Light Sci. Appl. 2014, 3, 110–118. [Google Scholar] [CrossRef]
- Xing, G.Z.; Fang, X.S.; Zhang, Z.; Wang, D.D.; Huang, X.; Guo, J.; Liao, L.; Zheng, Z.; Xu, H.R.; Yu, T. Ultrathin single-crystal ZnO nanobelts: Ag-catalyzed growth and field emission property. Nanotechnology 2010, 21, 255701. [Google Scholar] [CrossRef] [PubMed]
- Wang, B.; Qu, S. Absorption spectra and near-electric field enhancement effects of Au- and Ag-Fe3O4 dimers. Appl. Surf. Sci. 2014, 292, 1002–1008. [Google Scholar] [CrossRef]
- Zhang, X.; Song, L.; Cai, L.; Tian, X.; Zhang, Q.; Qi, X.; Zhou, W.; Zhang, N.; Yang, F.; Fan, Q.; et al. Optical visualization and polarized light absorption of the single-wall carbon nanotube to verify intrinsic thermal applications. Light Sci. Appl. 2015, 4, e318. [Google Scholar] [CrossRef]
- Xing, G.Z.; Yi, J.B.; Wang, D.D.; Liao, L.; Yu, T.; Shen, Z.X.; Huan, C.H.A.; Sum, T.C.; Ding, J.; Wu, T. Strong correlation between ferromagnetism and oxygen deficiency in Cr-doped In2O3–δ nanostructures. Phys. Rev. B 2009, 79, 174406. [Google Scholar] [CrossRef]
- Xing, G.Z.; Yi, J.B.; Tao, J.G.; Liu, T.; Wong, L.M.; Zhang, Z.; Li, G.P.; Wang, S.J.; Ding, J.; Sum, T.C.; et al. Comparative study of room-temperature ferromagnetism in Cu-doped ZnO nanowires enhanced by structural inhomogeneity. Adv. Mater. 2008, 20, 3521–3527. [Google Scholar] [CrossRef]
- Wu, Z.L.; Zhang, P.; Gao, M.X.; Liu, C.F.; Wang, W.; Leng, F.; Huang, C.Z. One-pot hydrothermal synthesis of highly luminescent nitrogen-doped amphoteric carbon dots for bioimaging from bombyx mori silk-natural proteins. J. Mater. Chem. B 2013, 1, 2868–2873. [Google Scholar] [CrossRef]
- Guo, L.; Ge, J.; Liu, W.; Niu, G.; Jia, Q.; Wang, H.; Wang, P. Tunable multicolor carbon dots prepared from well-defined polythiophene derivatives and their emission mechanism. Nanoscale 2015, 8, 729–734. [Google Scholar] [CrossRef] [PubMed]
- Cayuela, A.; Soriano, M.L.; Carrillo-Carri, C.; Valcárcel, M. Semiconductor and carbon-based fluorescent nanodots: The need for consistency. Chem. Commun. 2016, 47, 1311–1326. [Google Scholar] [CrossRef] [PubMed]
- Qu, Q.; Zhu, A.; Shao, X.; Shi, G.; Tian, Y. Development of a carbon quantum dots-based fluorescent Cu2+ probe suitable for living cell imaging. Chem. Commun. 2012, 48, 5473–5475. [Google Scholar] [CrossRef] [PubMed]
- Lin, L.; Rong, M.; Lu, S.; Song, X.; Zhong, Y.; Yan, J.; Wang, Y.; Chen, X. A facile synthesis of highly luminescent nitrogen-doped graphene quantum dots for the detection of 2,4,6-trinitrophenol in aqueous solution. Nanoscale 2015, 7, 1872–1878. [Google Scholar] [CrossRef] [PubMed]
- Hu, C.F.; Liu, Y.L.; Yang, Y.H.; Cui, J.H.; Wang, Y.L.; Yang, L.F.; Rong, J.H. One-step preparation of nitrogen-doped graphene quantum dots from oxidized debris of graphene oxide. J. Mater. Chem. B 2012, 1, 39–42. [Google Scholar] [CrossRef]
- Zhang, M.; Bai, L.; Shang, W.; Xie, W.; Ma, H.; Fu, Y.; Fang, D.C.; Sun, H.; Fan, L.Z.; Han, M.; et al. Facile synthesis of water-soluble, highly fluorescent graphene quantum dots as a robust biological label for stem cells. J. Mater. Chem. 2012, 22, 7461–7467. [Google Scholar] [CrossRef]
- Gu, J.; Hu, M.J.; Guo, Q.Q.; Ding, Z.F.; Sun, X.L.; Yang, J. High-yield synthesis of graphene quantum dots with strong green photoluminescence. RSC Adv. 2014, 4, 50141–50144. [Google Scholar] [CrossRef]
- Nakamizo, M.; Kammereck, R. Laser raman studies on carbons. Carbon 1973, 12, 259–267. [Google Scholar] [CrossRef]
- Das, A.; Pisana, S.; Chakraborty, B.; Piscanec, S.; Saha, S.K.; Waghmare, U.V.; Novoselov, K.S.; Krishnamurthy, H.R.; Geim, A.K.; Ferrari, A.C.; et al. Monitoring dopants by raman scattering in an electrochemically top-gated graphene transistor. Nat. Nanotechnol. 2008, 3, 210–215. [Google Scholar] [CrossRef] [PubMed]
- Kim, J.Y.; Lee, W.H.; Suk, J.W.; Potts, J.R.; Chou, H.; Kholmanov, I.N.; Piner, R.D.; Lee, J.; Akinwande, D.; Ruoff, R.S. Chlorination of reduced graphene oxide enhances the dielectric constant of reduced graphene oxide/polymer composites. Adv. Mater. 2013, 25, 2308–2313. [Google Scholar] [CrossRef] [PubMed]
- Hu, S.; Chang, Q.; Lin, K.; Yang, J. Tailoring surface charge distribution of carbon dots through heteroatoms for enhanced visible-light photocatalytic activity. Carbon 2016, 105, 484–489. [Google Scholar] [CrossRef]
- Zhao, J.; Tang, L.; Xiang, J.; Ji, R.; Hu, Y.; Yuan, J.; Zhao, J.; Tai, Y.J.; Cai, Y.H. Fabrication and properties of a high-performance chlorine doped graphene quantum dot based photovoltaic detector. RSC Adv. 2015, 5, 29222–29229. [Google Scholar] [CrossRef]
- Zhang, J.H.; Niu, A.; Li, J.; Fu, J.W.; Xu, Q. In vivo characterization of hair and skin derived carbon quantum dots with high quantum yield as long-term bioprobes in zebrafish. Sci. Rep. 2016, 6, 37860. [Google Scholar] [CrossRef] [PubMed]
- Liu, Q.; Xu, S.; Niu, C.; Li, M.; He, D.; Lu, Z.; Ma, L. Distinguish cancer cells based on targeting turn-on fluorescence imaging by folate functionalized green emitting carbon dots. Biosens. Bioelectron. 2015, 64, 119–125. [Google Scholar] [CrossRef] [PubMed]
- Dong, Y.; Pang, H.; Yang, H.B.; Guo, C.; Shao, J.; Chi, Y.; Li, C.M.; Yu, T. Carbon-Based Dots Co-doped with Nitrogen and Sulfur for High Quantum Yield and Excitation-Independent Emission. Angew. Chem. Int. Ed. Engl. 2013, 125, 7954–7958. [Google Scholar] [CrossRef]
- Chen, Y.F.; Wu, Y.Y.; Weng, B.; Wang, B.; Li, C.M. Facile synthesis of nitrogen and sulfur co-doped carbon dots and application for Fe(III) ions detection and cell imaging. Sens. Actuators B Chem. 2016, 223, 689–696. [Google Scholar] [CrossRef]
- Joseph, J.; Anappara, A.A. Microwave-assisted hydrothermal synthesis of UV-emitting carbon dots from tannic acid. New J. Chem. 2016, 40, 8110–8117. [Google Scholar] [CrossRef]
- Zhang, R.; Chen, W. Nitrogen-doped carbon quantum dots: Facile synthesis and application as a “turn-off” fluorescent probe for detection of Hg2+ ions. Biosens Bioelectron. 2014, 55, 83–90. [Google Scholar] [CrossRef] [PubMed]
- Qu, D.; Sun, Z.; Zheng, M.; Li, J.; Zhang, Y.; Zhang, G.; Zhao, H.F.; Liu, X.Y.; Xie, Z.G. Three colors emission from S,N co-doped graphene quantum dots for visible light H2 production and bioimaging. Adv. Opt. Mater. 2015, 3, 360–367. [Google Scholar] [CrossRef]
- Roushani, M.; Mavaei, M.; Rajabi, H.R. Graphene quantum dots as novel and green nano-materials for the visible-light-driven photocatalytic degradation of cationic dye. J. Mol. Catal. A Chem. 2015, 409, 102–109. [Google Scholar] [CrossRef]
- Song, Y.; Zhu, C.; Song, J.; Li, H.; Du, D.; Lin, Y. Drug-Derived Bright and Color-Tunable N-doped Carbon Dots for Cell Imaging and Sensitive Detection of Fe3+ in Living Cells. ACS Appl. Mater. Interfaces 2017, 9, 7399–7405. [Google Scholar] [CrossRef] [PubMed]
- Kang, Y.F.; Li, Y.H.; Fang, Y.W.; Xu, Y.; Wei, X.M.; Yin, X.B. Carbon Quantum Dots for Zebrafish Fluorescence Imaging. Sci. Rep. 2015, 5, 11835. [Google Scholar] [CrossRef] [PubMed]
- Thakur, M.; Mewada, A.; Pandey, S.; Bhori, M.; Singh, K.; Sharon, M.; Sharon, M. Milk-derived multi-fluorescent graphene quantum dot-based cancer theranostic system. Mater. Sci. Eng. C 2016, 67, 468–477. [Google Scholar] [CrossRef] [PubMed]
- Tang, L.; Ji, R.; Li, X.; Bai, G.; Liu, C.P.; Hao, J.; Lin, J.; Jiang, H.; Teng, K.S.; Yang, Z.; et al. Deep ultraviolet to near-infrared emission and photoresponse in layered n-doped graphene quantum dots. ACS Nano 2014, 8, 6312–6320. [Google Scholar] [CrossRef] [PubMed]
- Mirzapoor, A.; Ranjbar, B. Biophysical and electrochemical properties of self-assembled noncovalent swnt/dna hybrid and electroactive nanostructure. Phys. E 2017, 93, 208–215. [Google Scholar] [CrossRef]
- Chen, Y.; Zheng, M.; Xiao, Y.; Dong, H.; Zhang, H.; Zhuang, J.; Hu, H.; Lei, B.; Liu, Y. A self-quenching-resistant carbon-dot powder with tunable solid-state fluorescence and construction of dual-fluorescence morphologies for white light-emission. Adv. Mater. 2016, 28, 312–318. [Google Scholar] [CrossRef] [PubMed]
- Noor, U.A.; Martin, O.E.; Susann, S.; Asghar, M.; Lin, P.C.; Mikael, S.; Reza, Y.G. Tuning the emission energy of chemically doped graphene quantum dots. Nanomaterials 2016, 6, 198. [Google Scholar] [CrossRef] [PubMed]
- Wang, Y.; Kalytchuk, S.; Zhang, Y.; Shi, H.; Kershaw, S.V.; Rogach, A.L. Thickness-Dependent Full-Color Emission Tunability in a Flexible Carbon Dot Ionogel. J. Phys. Chem. Lett. 2014, 5, 1412–1420. [Google Scholar] [CrossRef] [PubMed]
- Hu, S.; Trinchi, A.; Atkin, P.; Cole, I. Tunable Photoluminescence across the Entire Visible Spectrum from Carbon Dots Excited by White Light. Angew. Chem. Int. Ed. Engl. 2015, 54, 2970–2974. [Google Scholar] [CrossRef] [PubMed]
- Shi, Q.Q.; Li, Y.H.; Xu, Y.; Wang, Y.; Yin, X.B.; He, X.W.; Zhang, Y.K. High-yield and high-solubility nitrogen-doped carbon dots: Formation, fluorescence mechanism and imaging application. RSC Adv. 2014, 4, 1563–1566. [Google Scholar] [CrossRef]
- Liang, Q.; Ma, W.; Shi, Y.; Li, Z.; Yang, X.M. Easy synthesis of highly fluorescent carbon quantum dots from gelatin and their luminescent properties and applications. Carbon 2013, 60, 421–428. [Google Scholar] [CrossRef]
- Hu, S.; Tian, R.; Wu, L.; Zhao, Q.; Yang, J.; Liu, J.; Cao, S. Chemical regulation of carbon quantum dots from synthesis to photocatalytic activity. Chem. Asian J. 2013, 8, 1035–1041. [Google Scholar] [CrossRef] [PubMed]
- Wu, M.B.; Wang, Y.; Wu, W.T.; Hu, C.; Wang, X.N.; Zheng, J.T.; Li, Z.T. Preparation of functionalized water-soluble photoluminescent carbon quantum dots from petroleum coke. Carbon 2014, 78, 480–489. [Google Scholar] [CrossRef]
- Bolton, O.; Lee, K.; Kim, H.J.; Lin, K.Y.; Kim, J. Activating efficient phosphorescence from purely organic materials by crystal design. Nat. Chem. 2011, 3, 205–210. [Google Scholar] [CrossRef] [PubMed]
- Kim, S.; Hwang, S.W.; Kim, M.K.; Shin, D.Y.; Shin, D.H.; Kim, C.O.; Yang, S.B. Anomalous Behaviors of Visible Luminescence from Graphene Quantum Dots: Interplay between Size and Shape. ACS Nano 2012, 6, 8203–8208. [Google Scholar] [CrossRef] [PubMed]
- Peng, J.; Gao, W.; Gupta, B.K.; Liu, Z.; Romero-Aburto, R.; Ge, L.; Song, L.; Alemany, L.B.; Zhan, X. Graphene quantum dots derived from carbon fibers. Nano Lett. 2012, 12, 844–849. [Google Scholar] [CrossRef] [PubMed]
- Ritter, K.A.; Lyding, J.W. The influence of edge structure on the electronic properties of graphene quantum dots and nanoribbons. Nat. Mater. 2009, 8, 235–242. [Google Scholar] [CrossRef] [PubMed]
- Li, Y.; Zhao, Y.; Cheng, H.; Hu, Y.; Shi, G.; Dai, L.; Qu, L. Nitrogen-doped graphene quantum dots with oxygen-rich functional groups. J. Am. Chem. Soc. 2012, 134, 15–18. [Google Scholar] [CrossRef] [PubMed]
- Ding, H.; Wei, J.S.; Xiong, H.M. Nitrogen and sulfur co-doped carbon dots with strong blue luminescence. Nanoscale 2014, 6, 13817–13823. [Google Scholar] [CrossRef] [PubMed]
- Li, X.; Lau, S.P.; Tang, L.; Ji, R.; Yang, P. Sulphur doping: A facile approach to tune the electronic structure and optical properties of graphene quantum dots. Nanoscale 2014, 6, 5323–5328. [Google Scholar] [CrossRef] [PubMed]
- Tang, L.; Ji, R.; Cao, X.; Lin, J.; Jiang, H.; Li, X.; Teng, K.S.; Luk, C.M.; Zeng, S.; Hao, J.; et al. Deep Ultraviolet Photoluminescence of Water-Soluble Self-Passivated Graphene Quantum Dots. ACS Nano 2012, 6, 5102–5110. [Google Scholar] [CrossRef] [PubMed]
- Zhu, S.; Song, Y.; Wang, J.; Wan, H.; Zhang, Y.; Ning, Y.; Yang, B. Photoluminescence mechanism in graphene quantum dots: Quantum confinement effect and surface/edge state. Nano Today 2016. [CrossRef]
- Song, S.H.; Jang, M.H.; Jeong, J.M.; Yoon, H.; Cho, Y.H.; Jeong, W.I.; Kim, B.H. Jeon S. Primary hepatocyte imaging by multiphoton luminescent graphene quantum dots. Chem. Commun. 2015, 51, 8041–8043. [Google Scholar] [CrossRef] [PubMed]
- Hu, Y.; Yang, J.; Jia, L.; Yu, J.S. Ethanol in aqueous hydrogen peroxide solution: Hydrothermal synthesis of highly photoluminescent carbon dots as multifunctional nanosensors. Carbon 2015, 93, 999–1007. [Google Scholar] [CrossRef]
- Liu, Y.; Zhou, L.; Li, Y.; Deng, R.; Zhang, H. Highly fluorescent nitrogen-doped carbon dots with excellent thermal and photo stability applied as invisible ink for loading important information and anti-counterfeiting. Nanoscale 2016, 9, 491–496. [Google Scholar] [CrossRef] [PubMed]
- Qian, Z.; Ma, J.; Shan, X.; Feng, H.; Shao, L.; Chen, J. Highly luminescent N-doped carbon quantum dots as an effective multifunctional fluorescence sensing platform. Chem. A Eur. J. 2014, 20, 2254–2263. [Google Scholar] [CrossRef] [PubMed]
- Ding, H.; Yu, S.B.; Wei, J.S.; Xiong, H.M. Full-color light-emitting carbon dots with a surface-state-controlled luminescence mechanism. ACS Nano 2016, 10, 484–491. [Google Scholar] [CrossRef] [PubMed]
- Sumpter, B.G.; Meunier, V.; Romoherrera, J.M.; Cruzsilva, E.; Cullen, D.A.; Terrones, H.; Smith, D.J.; Terrones, M. Nitrogen-mediated carbon nanotube growth: Diameter reduction, metallicity, bundle dispersability, and bamboo-like structure formation. ACS Nano 2007, 1, 369–375. [Google Scholar] [CrossRef] [PubMed]
- Chandra, S.; Laha, D.; Pramanik, A.; Ray, A.C.; Karmakar, P.; Sahu, S.K. Synthesis of highly fluorescent nitrogen and phosphorus doped carbon dots for the detection of Fe(3+) ions in cancer cells. Luminescence 2016, 31, 81–87. [Google Scholar] [CrossRef] [PubMed]
- Dong, Y.; Shao, J.; Chen, C.; Li, H.; Wang, R.; Chi, Y.; Lin, X.M.; Chen, G.N. Blue luminescent graphene quantum dots and graphene oxide prepared by tuning the carbonization degree of citric acid. Carbon 2012, 50, 4738–4743. [Google Scholar] [CrossRef]
- Zhao, P.H.; Luo, Y.; Kong, L.Y. One-step preparation of green fluorescent graphene quantum dots from petroleum asphalt. J. Nano Res. 2017, 45, 76–83. [Google Scholar] [CrossRef]
- Liu, F.; Jang, M.H.; Ha, H.D.; Kim, J.H.; Cho, Y.H.; Seo, T.S. Facile synthetic method for pristine graphene quantum dots and graphene oxide quantum dots: Origin of blue and green luminescence. Adv. Mater. 2013, 25, 3657–3662. [Google Scholar] [CrossRef] [PubMed]


| Sample | CQDs (1:0.5) | CQDs (1:1) | CQDs (1:1.5) | CQDs (1:2) |
|---|---|---|---|---|
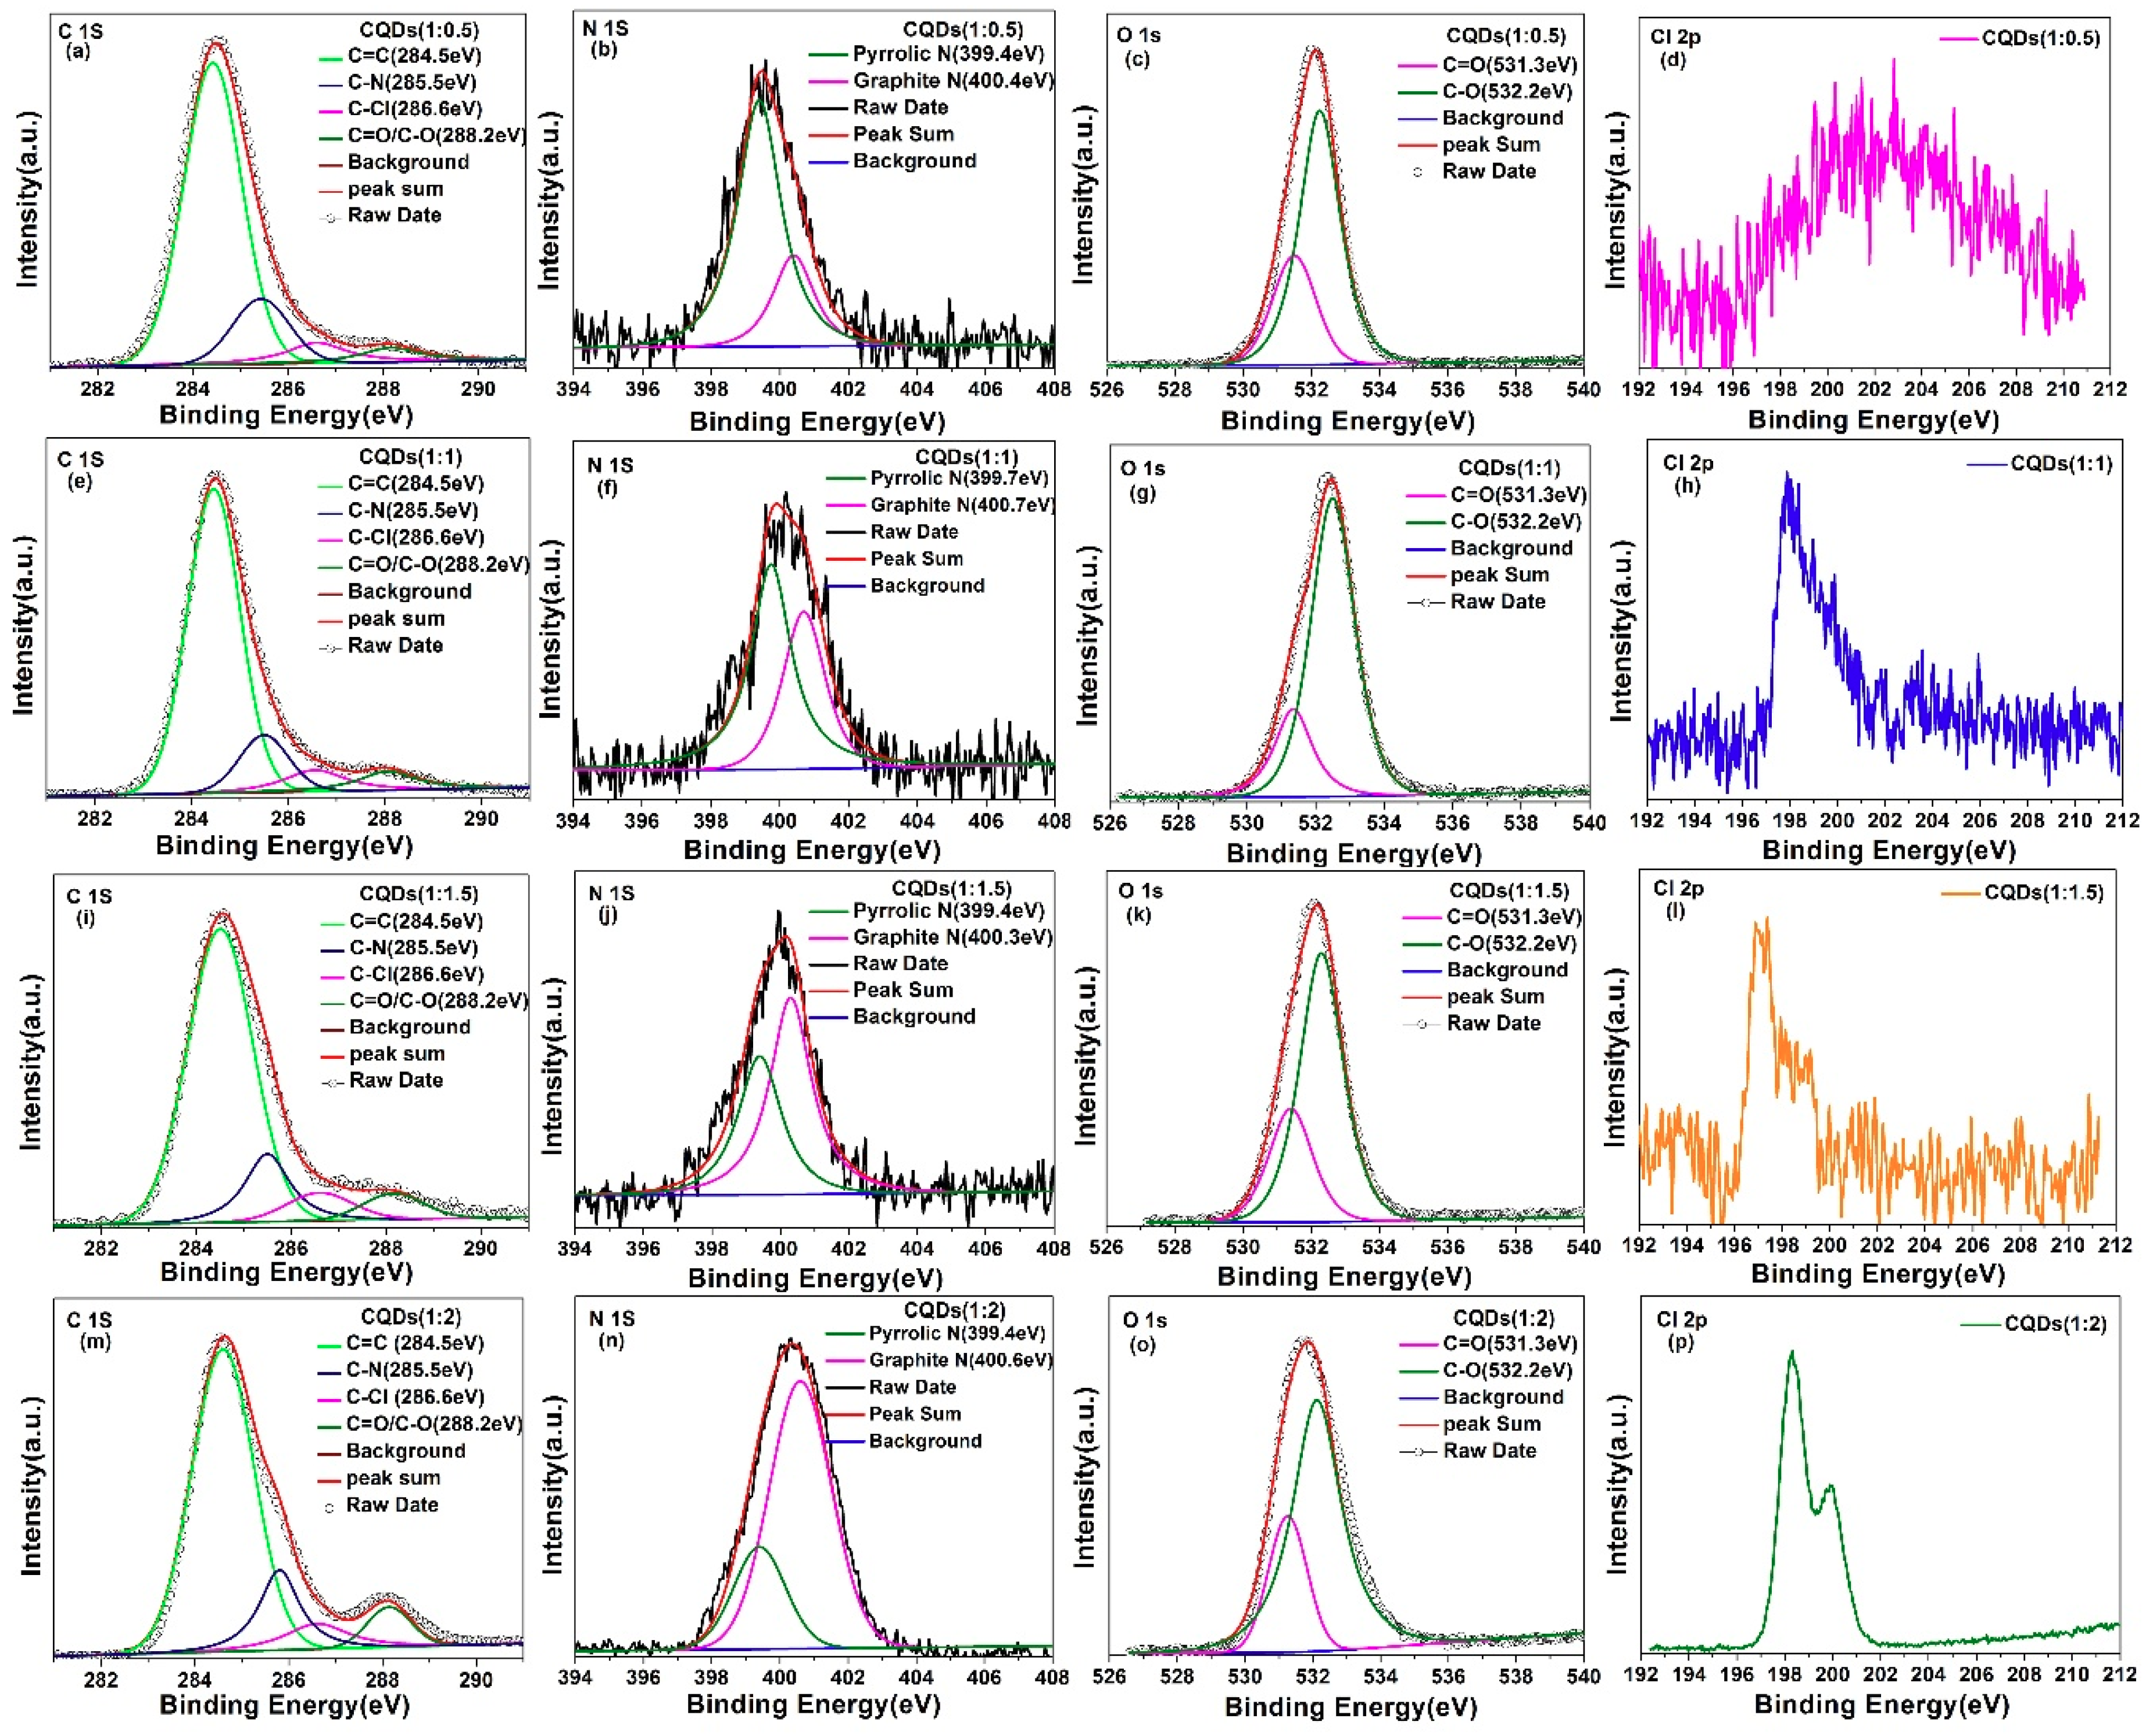
| C–N | 2.92% | 4.46% | 6.42% | 10.96% |
| C–Cl | 1.08% | 1.94% | 2.86% | 4.10% |
| Sample | τ1 (ns) | τ2 (ns) | τaverage (ns) | χ2 |
|---|---|---|---|---|
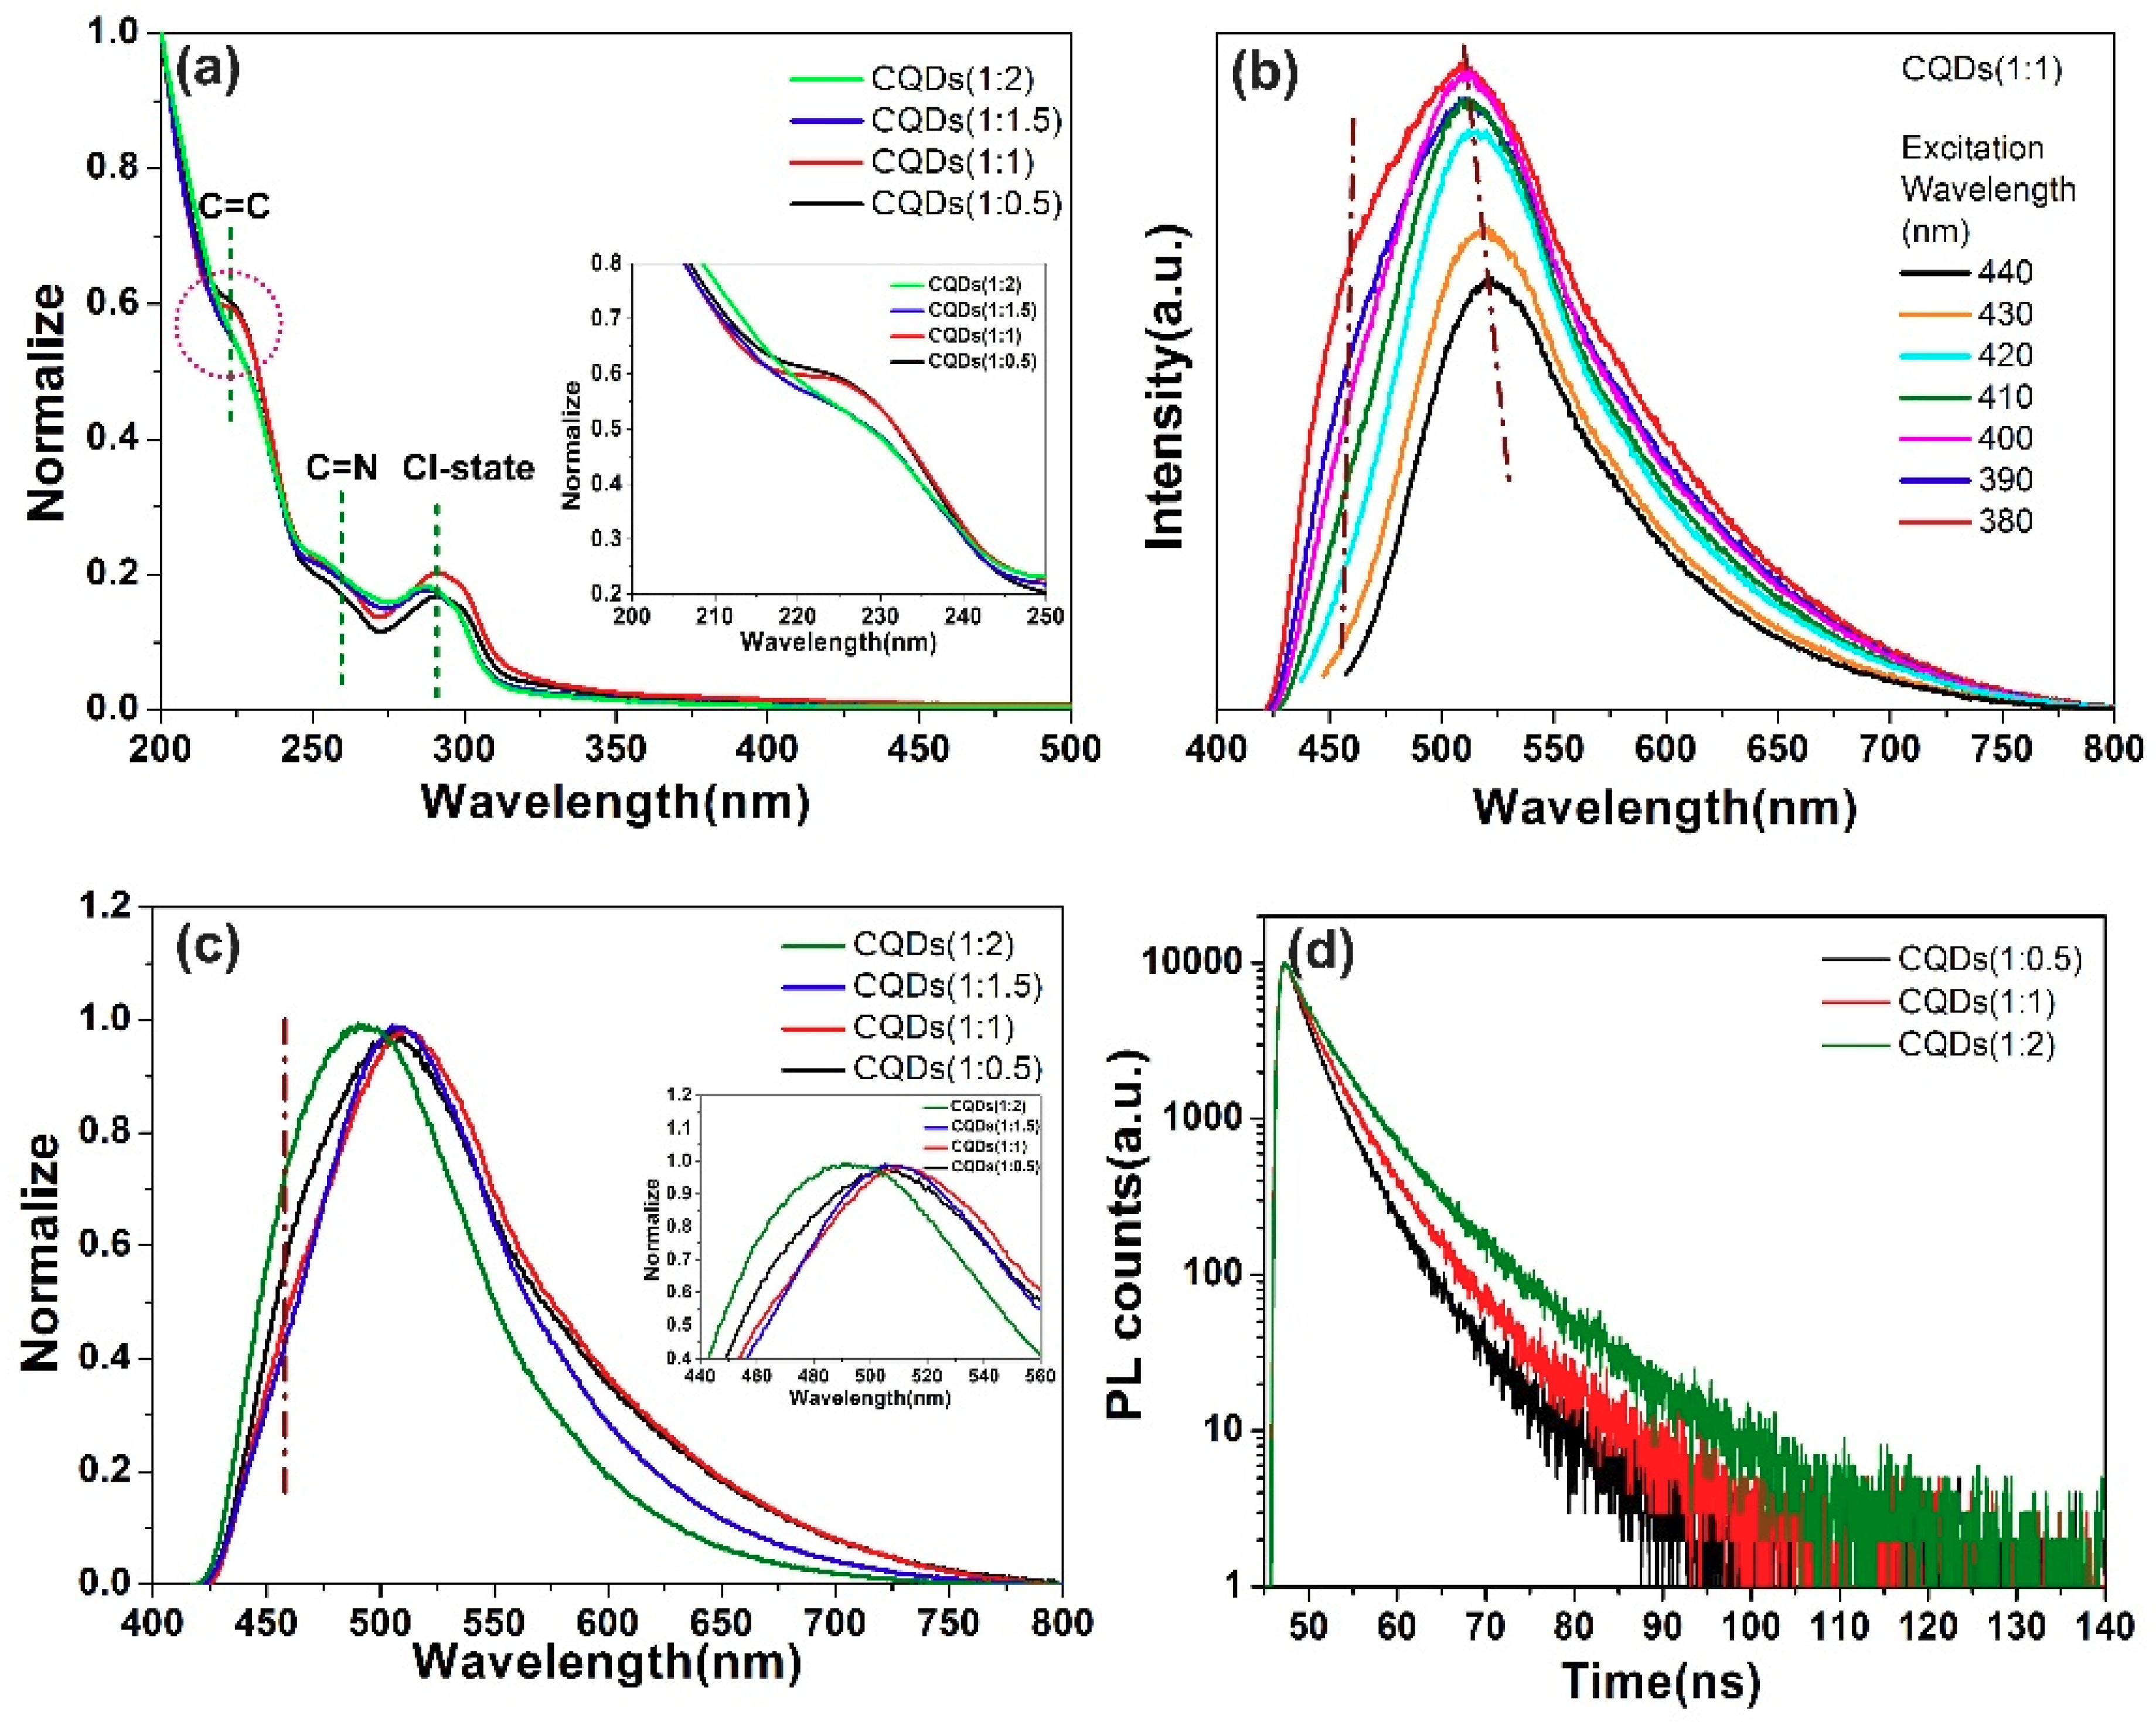
| CQDs (1:0.5) | 2.21 | 5.56 | 2.75 | 0.93 |
| CQDs (1:1) | 2.46 | 6.11 | 3.32 | 1.05 |
| CQDs (1:2) | 3.08 | 7.97 | 4.23 | 0.86 |
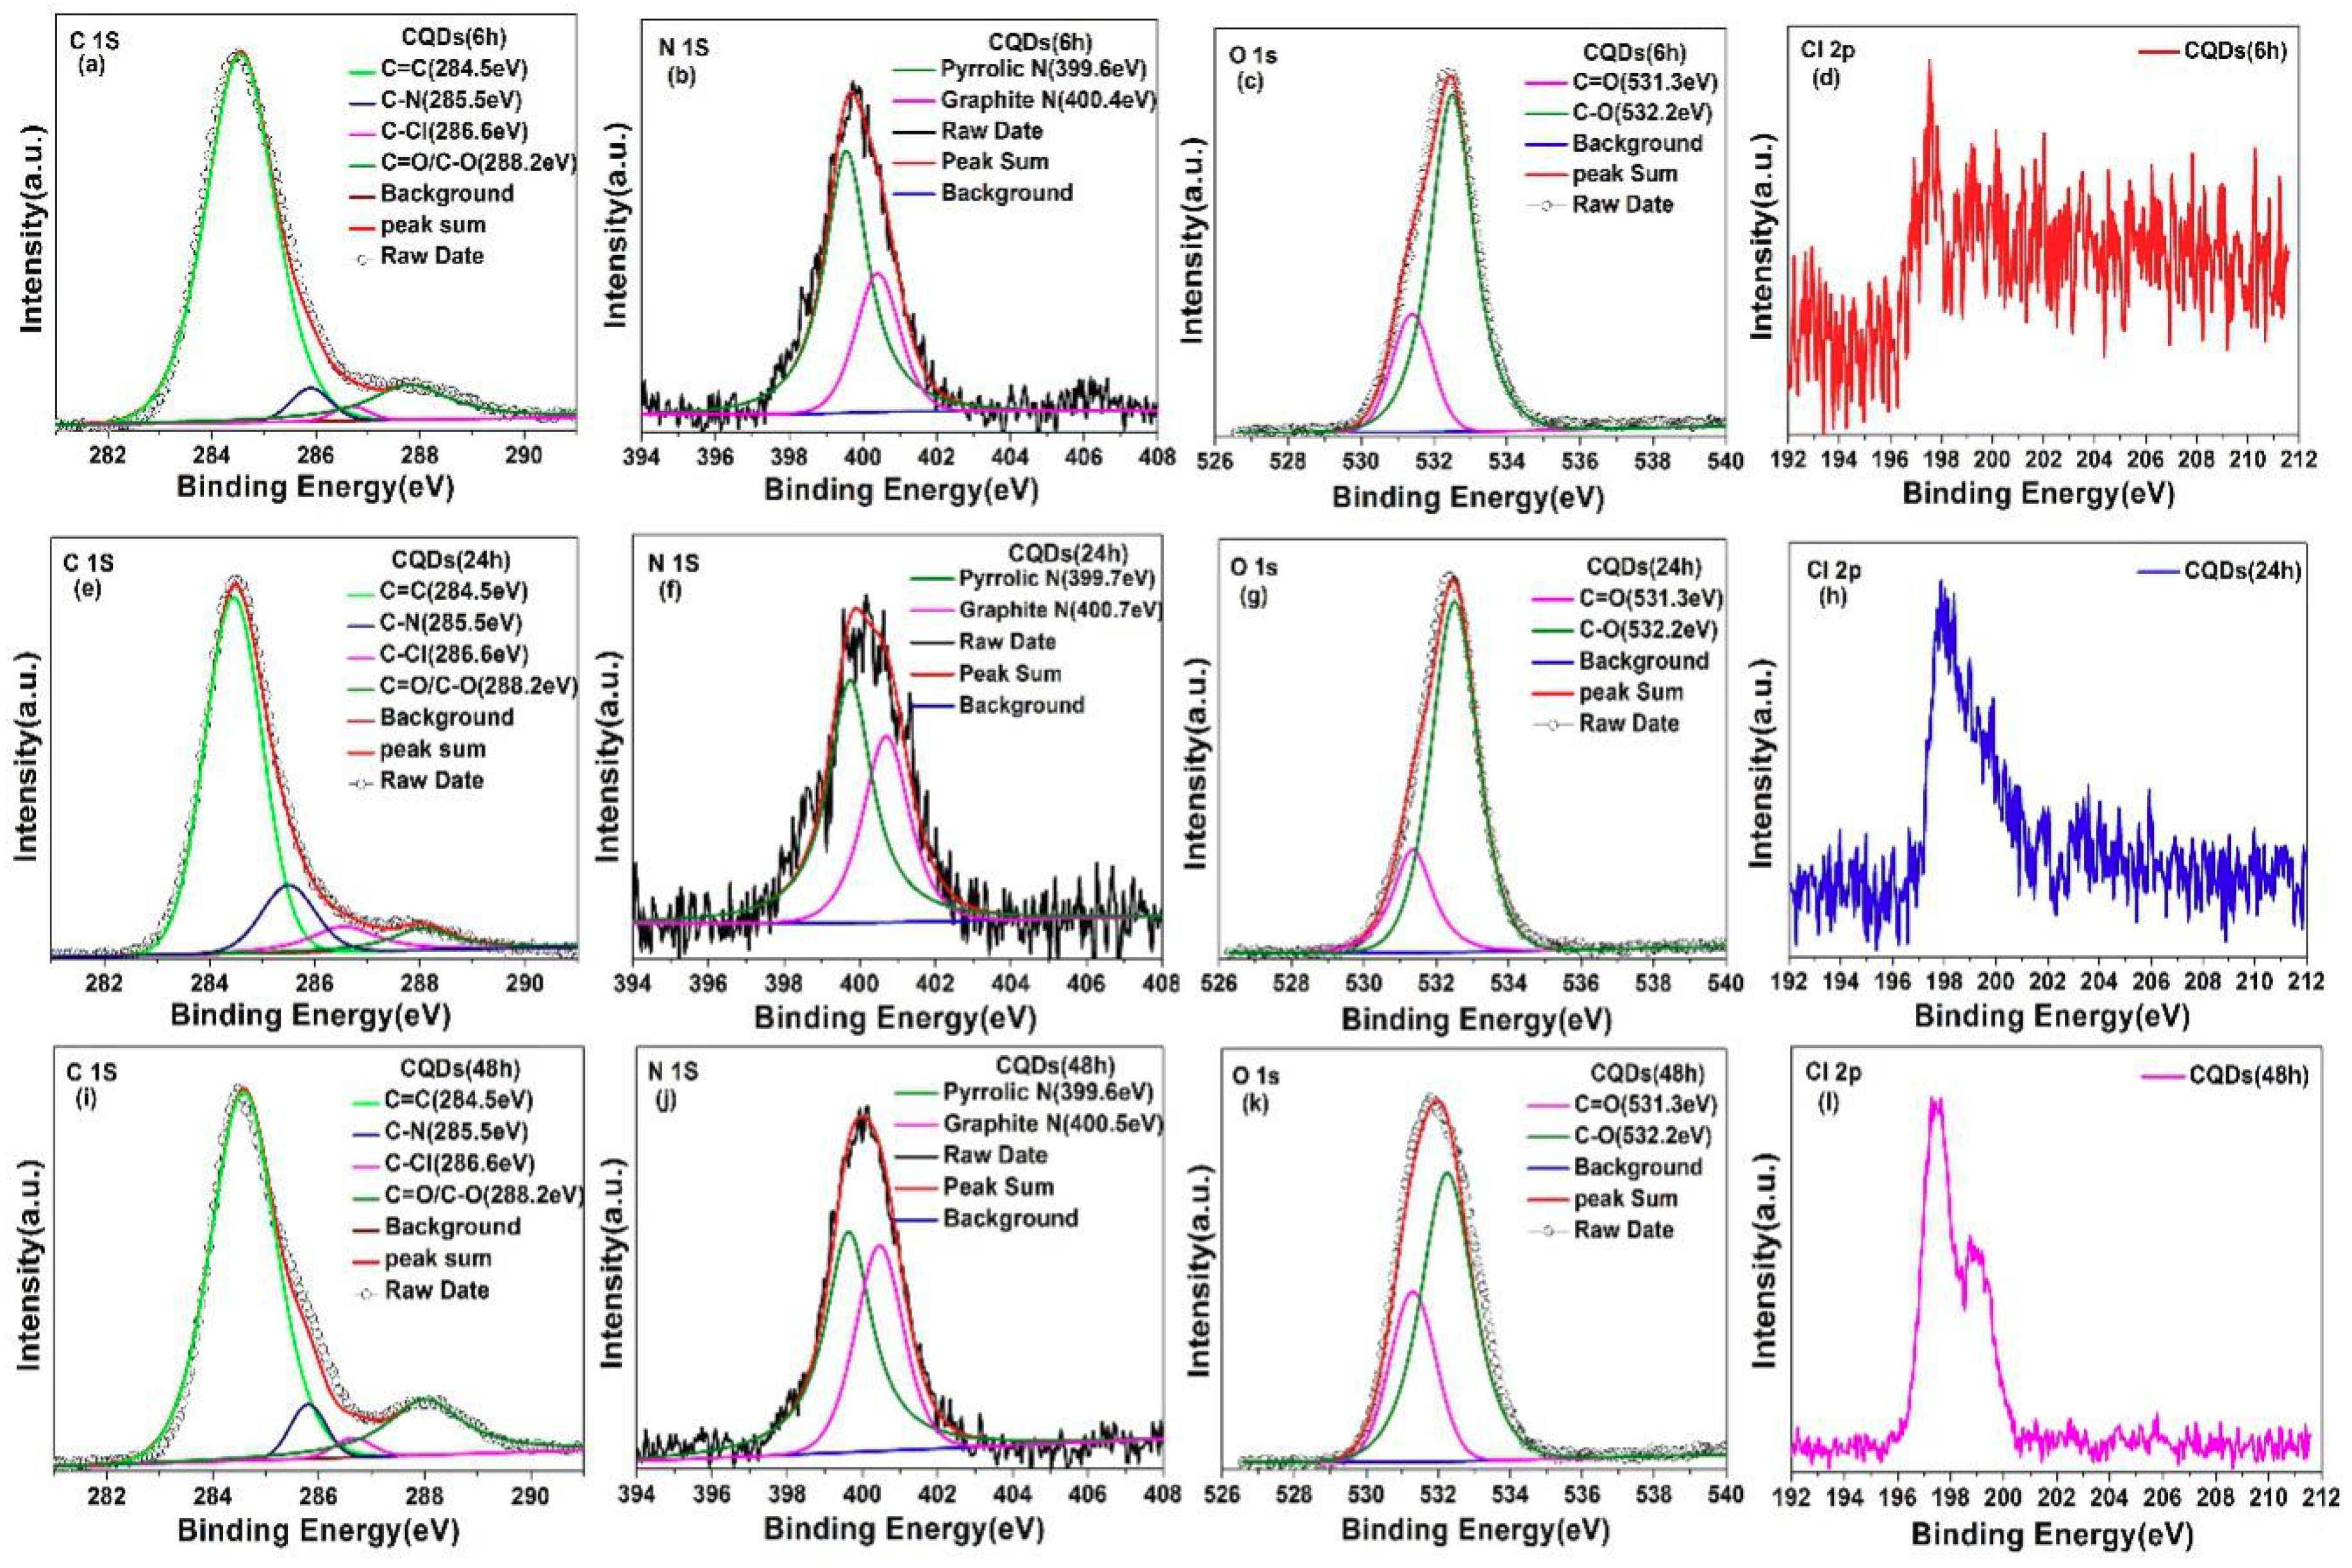
| Sample | CQDs (6 h) | CQDs (24 h) | CQDs (48 h) |
|---|---|---|---|
| C-N | 4.13% | 4.46% | 5.40% |
| C-Cl | 1.57% | 1.94% | 2.16% |
| Sample | τ1 (ns) | τ2 (ns) | τaverage (ns) | χ2 |
|---|---|---|---|---|
| CQDs (6 h) | 2.31 | 5.29 | 3.57 | 1.54 |
| CQDs (24 h) | 2.46 | 6.11 | 3.32 | 1.05 |
| CQDs (36 h) | 2.90 | 7.11 | 3.94 | 0.78 |
| CQDs (48 h) | 2.50 | 9.47 | 4.62 | 0.68 |
© 2018 by the authors. Licensee MDPI, Basel, Switzerland. This article is an open access article distributed under the terms and conditions of the Creative Commons Attribution (CC BY) license (http://creativecommons.org/licenses/by/4.0/).
Share and Cite
Sun, X.; Liu, H.; Yang, L.; Wang, X.; Yang, W.; Wei, M.; Liu, X.; Cao, J.; Yang, J.; Xing, S.G. Tailoring Blue-Green Double Emissions in Carbon Quantum Dots via Co-Doping Engineering by Competition Mechanism between Chlorine-Related States and Conjugated π-Domains. Nanomaterials 2018, 8, 635. https://doi.org/10.3390/nano8090635
Sun X, Liu H, Yang L, Wang X, Yang W, Wei M, Liu X, Cao J, Yang J, Xing SG. Tailoring Blue-Green Double Emissions in Carbon Quantum Dots via Co-Doping Engineering by Competition Mechanism between Chlorine-Related States and Conjugated π-Domains. Nanomaterials. 2018; 8(9):635. https://doi.org/10.3390/nano8090635
Chicago/Turabian StyleSun, Xue, Huilian Liu, Lili Yang, Xinying Wang, Weiqiang Yang, Maobin Wei, Xiaoyan Liu, Jian Cao, Jinghai Yang, and Scott Guozhong Xing. 2018. "Tailoring Blue-Green Double Emissions in Carbon Quantum Dots via Co-Doping Engineering by Competition Mechanism between Chlorine-Related States and Conjugated π-Domains" Nanomaterials 8, no. 9: 635. https://doi.org/10.3390/nano8090635
APA StyleSun, X., Liu, H., Yang, L., Wang, X., Yang, W., Wei, M., Liu, X., Cao, J., Yang, J., & Xing, S. G. (2018). Tailoring Blue-Green Double Emissions in Carbon Quantum Dots via Co-Doping Engineering by Competition Mechanism between Chlorine-Related States and Conjugated π-Domains. Nanomaterials, 8(9), 635. https://doi.org/10.3390/nano8090635