Article

Magnetic Fe@FeOx, Fe@C and α-Fe2O3 Single-Crystal Nanoblends Synthesized by Femtosecond Laser Ablation of Fe in Acetone

1
RIKEN Center for Advanced Photonics, 2-1 Hirosawa, Wako, Saitama 351-0198, Japan
2
Department of Nano-Mechatronics, Korea University of Science and Technology (UST), 217 Gajeong-Ro, Yuseong-Gu, Daejeon 34113, Korea
3
Department of Nano-Manufacturing Technology, Korea Institute of Machinery and Material (KIMM), 156 Gajeongbuk-Ro, Yuseong-Gu, Daejeon 34103, Korea
4
Condensed Molecular Materials Laboratory, RIKEN Cluster for Pioneering Research, 2-1 Hirosawa, Wako, Saitama 351-0198, Japan
5
Faculty of Physics and Center for Nanointegration Duisburg-Essen (CENIDE), University of Duisburg-Essen, 47057 Duisburg, Germany
6
Department of Laser & Electron Beam Application, Korea Institute of Machinery and Material (KIMM), 156 Gajeongbuk-Ro, Yuseong-Gu, Daejeon 34103, Korea
7
Emergent Bioengineering Materials Research Team, RIKEN Center for Emergent Matter Science, 2-1 Hirosawa, Wako, Saitama 351-0198, Japan
8
Department of Applied Chemistry, National Chiao Tung University, Science Building 2, 1001 Ta Hsueh Road, Hsinchu 300, Taiwan
9
Nano Medical Engineering Laboratory, RIKEN Cluster for Pioneering Research, 2-1 Hirosawa, Wako, Saitama 351-0193, Japan
*
Author to whom correspondence should be addressed.
These authors contributed equally to this work.
Nanomaterials 2018, 8(8), 631; https://doi.org/10.3390/nano8080631
Submission received: 24 July 2018 / Revised: 17 August 2018 / Accepted: 18 August 2018 / Published: 20 August 2018
(This article belongs to the Special Issue Laser-Based Nano Fabrication and Nano Lithography)

Abstract

:
There are few reports on zero-field-cooled (ZFC) magnetization measurements for Fe@FeOx or FeOx particles synthesized by laser ablation in liquids (LAL) of Fe, and the minimum blocking temperature (TB) of 120 K reported so far is still much higher than those of their counterparts synthesized by chemical methods. In this work, the minimum blocking temperature was lowered to 52 K for 4–5 nm α-Fe2O3 particles synthesized by femtosecond laser ablation of Fe in acetone. The effective magnetic anisotropy energy density (Keff) is calculated to be 2.7–5.4 × 10⁵ J/m3, further extending the Keff values for smaller hematite particles synthesized by different methods. Large amorphous-Fe@α-Fe2O3 and amorphous-Fe@C particles of 10–100 nm in diameter display a soft magnetic behavior with saturation magnetization (Ms) and coercivities (Hc) values of 72.5 emu/g and 160 Oe at 5 K and 61.9 emu/g and 70 Oe at 300 K, respectively, which mainly stem from the magnetism of amorphous Fe cores. Generally, the nanoparticles obtained by LAL are either amorphous or polycrystalline, seldom in a single-crystalline state. This work also demonstrates the possibility of synthesizing single-crystalline α-Fe2O3 hematite crystals of several nanometers with (104), (113), (116) or (214) crystallographic orientations, which were produced simultaneously with other products including carbon encapsulated amorphous Fe (a-Fe@C) and Fe@FeOx core-shell particles by LAL in one step. Finally, the formation mechanisms for these nanomaterials are proposed and the key factors in series events of LAL are discussed.

Graphical Abstract

1. Introduction

The newly emerged technique of laser ablation in liquids (LAL) [1,2,3,4,5] has proven to be valid for the synthesis of a large variety of colloids resulting from material removal of the substances [6]. With specific targets, simply changing the liquids for LAL allows the easy alteration of colloidal properties such as sizes [7,8] and phases [9,10,11]. For the synthesis of magnetic particles by LAL, the most frequently investigated material is Fe, whose results have turned out to be very diverse depending on experimental conditions [2], in which nanosecond (ns) lasers were typically used. For example, Vahabzadeh and Torkamany made use of ns lasers at fundamental and 2nd harmonic wavelengths (1064 nm and 532 nm) to ablate Fe in water for the formation of Fe3O4 and FeO particles, whose saturation magnetizations (Ms) and coercivity (Hc) were 22.5 emu/g and 11.5 Oe and 14.8 emu/g and 22 Oe [12], respectively. These values were much lower than those of bulk magnetite (Ms = 92 emu/g and Hc = 500–800 Oe). Zeng et al. prepared FeO nanoparticles by ns laser fragmentation in liquid (LFL) of Fe using a water/poly(vinyl pyrrolidone) (PVP) solution [13]. Amendola et al. obtained FeOx (Fe3O4, FeO, α-Fe) nanoparticles with an Ms of 100 emu/g by ns LAL in water [14]. Pandey et al. found that the ns LAL of commercial Fe2O3 powders in doubly distilled water improved the hematite particle crystallinity and increased Ms from 0.024 to 3.41 emu/g [15]. Svetlichnyi et al. found that the Hc of the FeOx (Fe, Fe2O3 and Fe3O4) nanoparticles synthesized by ns LAL of Fe in water increased from 144 Oe to 370 Oe when the measurement temperature was reduced from 300 K to 77 K [16]. Ismail et al. showed that the Ms values of 16.3–20.3 emu/g for the magnetic iron oxide (Fe3O4, α-Fe2O3, FeO and ε-Fe2O3) nanoparticles synthesized by ns LAL in SDS aqueous solution were larger than 13.8–16.2 emu/g for FeOx (Fe3O4, α-Fe2O3, ε-Fe2O3) particles synthesized by ns LAL in dimethylformamide (DMF) at the same laser energies [17]. Meanwhile, Kanitz et al. employed a femtosecond (fs) laser for LAL of Fe and reported that the products changed depending on the adopted solutions: α-iron, wüstite and magnetite were synthesized in water, α-iron, cementite and FeOx in methanol, amorphous-Fe and α-Fe mixture in ethanol and acetone, and amorphous-Fe@C core-shell particles in toluene [18]. Their Ms and Hc values were measured to be 23, 80, 60, 67 and 14 emu/g, and 77, 92, 65, 56, and 52 Oe at 300 K, respectively. Santillán et al. synthesized FeOx (Fe3O4, γ-Fe2O3 or α-Fe) by fs laser (120 fs, 1 kHz, 800 nm) ablation of Fe in water, by which Ms, number density, magnetic radius and total radius of 49.3 emu/g, 2.9 × 10¹⁸, 1.1 nm, 1.9 nm, respectively, were obtained, which were different from the magnetic properties (26.7 emu/g, 3468 μB and 0.7 × 10¹⁸, 1.5 nm, 3.2 nm) of the particles obtained by LAL in a trisodium citrate aqueous solution [19]. Most of these works mainly focused on the hysteresis curves to reveal the dependence of magnetic properties on the phases of LAL-prepared FeOx or Fe/FeOx particles. Little attention has been paid to the zero-field-cooled (ZFC) and field-cooled (FC) curves including the information about blocking temperature (TB) which is closely related to the product of particle size and magnetic anisotropy energy density essentially defining the energy barrier between two easy axes of magnetization [20].
Amendola et al. observed a blocking temperature TB = 200 K of FeOx particles synthesized by the ns-LAL of Fe in water [14]. Franzel et al. reported that Fe3O4 and Fe3C synthesized by picosecond (ps) LAL of Fe in ethanol had a blocking temperature TB = 120 K [21], much lower that of FeOx particles synthesized by ns-LAL, which was due to the generation of higher ratios of smaller particles by ps-LAL. As is well known, a low TB value (<100 K) is a good indicator for superparamagnetism arising from small particles [22,23]. The endowment of superparamagnetism to the as-prepared magnetic particles often requires the particle size to be around or less than 10 nm [24]. To date, the minimum blocking temperature of LAL-generated Fe@FeOx or FeOx particles is still above 100 K [21]. Due to the fact that smaller FeOx particles often possess lower blocking temperatures [20], the synthesis of ultrasmall Fe@FeOx and FeOx particles by LAL is essential to lower the blocking temperature below 100 K. To this end, fs-LAL is a better choice than ps- and ns-LAL because of the phase/Coloumb explosion mechanism for fs-LAL rather than the thermal ablation mechanism for ns-LAL [25].
Despite many reports on the fs-LAL of Fe and studies on the magnetic properties (Ms, Mr and Hc) of the products [11,18], the ZFC/FC curves were not measured. To fill this gap and to further lower the blocking temperature of Fe@FeOx possessing superparamagnetic properties, the fs-LAL of Fe in acetone was performed. XRD, high-resolution transition electron microscropy (HRTEM), energy-dispersive X-ray (EDX), selected area electron diffraction (SAED), fast Fourier transform (FFT), X-ray photoelectron spectroscopy (XPS) and Raman characterizations were performed to clarify the composition of the as-prepared particles. TEM analysis was performed to display the particle morphologies and calculate the size distribution of the colloids. Both ZFC/FC and hysteresis curves of the synthesized magnetic particles were measured, from which TB, Ms, Mr and Hc values were determined.

2. Materials and Methods

Colloids were synthesized by laser ablation of a Fe sheet (99.45 wt % Fe, 0.42 wt % O, 0.13 wt % C) using a fs laser system (FGPA μJewel D-1000-UG3, IMRA America Inc., Ann Arbor, MI, USA). The pulse duration, wavelength and repetition rate of the laser system were 457 fs, 1045 nm and 100 kHz, respectively. An Fe sheet with dimensions of 20 mm × 20 mm × 1 mm was placed inside a glass container and then immersed in 8 mL acetone for LAL. The liquid thickness above the target surface was kept at 5 mm. Then, a fs laser beam was focused on the Fe sheet surface by a 20× objective lens (numerical aperture (NA) = 0.4, Mitutoyo, Kawasaki, Japan) and scanned over an area of 3.5 × 3.5 mm2 using the scan method described in [26,27,28] with a line interval of 5 μm and a scan speed of 1 mm/s to ablate the Fe sheet. The ablation process lasted around 1 h. The average laser power was set to 600 mW. The spot size was 26 μm. The peak irradiance and laser fluence were calculated to be 1.13 × 10⁹ W/m2 and 113 J/cm2, respectively.
The colloids were directly deposited onto TEM grids (EMJapan, U1015, Tokyo, Japan, 20 nm thick carbon films on copper grids) after LAL without any pre-treatment and then characterized using TEM (Jeol, JEM-1230, Tokyo, Japan) operating at 80 kV. HRTEM and STEM-EELS (scanning transmission electron microscopy–electron energy loss spectroscopy) were performed with a JEM-ARM200F (Jeol, Tokyo, Japan) equipped with third-order aberration correctors for both illuminating and imaging lens systems operated at 200 kV. For XRD and magnetic property measurements, the colloids with liquids were centrifuged by a centrifuge (Eppendorf, Centrifuge 5430, Hamburg, Germany) at a rotation speed of 14,000 rpm for 10 min. The precipitated particles were then collected in a cuvette and dried in a freeze dryer (Rikakikai, S-1000, Eyela, Tokyo, Japan). The dried particles were deposited on an amorphous glass plate (10 mm × 10 mm × 1 mm) for XRD, XPS and Raman characterizations. The composition of the particles was analysed using XRD (Rigaku, CuKα radiation (40 kV-30 mA), SmartLab-R 3kW, Tokyo, Japan). The surface chemistry of the particles was analysed by XPS (Thermo Scientific, ESCALAB 250, Tokyo, Japan) and Raman spectroscopy (LabRAM, Hiriba, He-Ne laser, 632 nm, 0.686 mW, Tokyo, Japan). A zeta-potential and particle size analyzer (ELSZ-2PL, Photal, Osaka, Japan) was used to measure the zeta potential of the fresh colloid and the colloid stored after 3 weeks. UV-vis spectroscopy (Shimadzu, UV-3600 Plus, Tokyo, Japan) was used to measure the absorption spectra of colloids.
Magnetic properties of the particles were measured in He gas atmosphere using the superconducting quantum interference device (SQUID) magnetometer (Quantum Design, MPMS XL7, San Diego, USA). The dried 26.5 mg Fe@α-Fe2O3 particle powder was filled into a capsule, which was then placed into the magnetometer. Zero-field-cooled (ZFC) magnetization was measured by cooling samples in a zero magnetic field and then increasing the temperature from 5 K to 300 K with magnetization-temperature data recorded every 5 K at an applied field of 50 Oe. Field-cooled (FC) curves were recorded by cooling the samples from 300 K to 5 K with a constant field of 50 Oe. The field dependence of the magnetization (hysteresis loop) was recorded up to ±70 kOe at T = 5 K and ± 10 kOe at T = 300 K, respectively.

3. Results

3.1. Material Property

After drying on TEM grids, the particles synthesized in acetone form a particle network (Figure 1a–c), connected by a large amount of small clusters, which is a typical phenomenon after ferro-fluidic colloid drying [29,30,31,32,33,34]. The average size of the particles is estimated to be 5–6 nm (Figure 1d). Small particles with sizes of less than 10 nm occupy more than an 87% number frequency of all of the particles. In particular, small particles with a ~ 90% number frequency of 1–10 nm are in the majority, with the highest number frequency at 4–5 nm (Figure 1f–i). The large particles are in the form of core-shell particles with a shell thickness of ca. 6 nm (Figure 1c). No crystalline peak was observed in the XRD spectrum (Figure 1e), similar to the case of the nanomaterials obtained by LAL of Cu in acetone [35]. This is either due to the low amount of particle powders used for the XRD spectrum or due to the too-small crystallites of the particles [35]. Actually, we used several mg particles for XRD characterization. With the same amount, a well featured XRD spectrum of Ag particles synthesized by LAL of Ag in acetone has been observed [36], which indicates that the particles synthesized by LAL of Fe in acetone are in very low crystallinity.
To confirm the compositions of small clusters and core-shell particles, the distribution of Fe, C, O elements in the nanoblends was analyzed by EDX as shown in Figure 2 and Figure 3. As indicated by TEM image (Figure 2a) and the Fe and O elemental distributions (Figure 2c,e), the small clusters were identified as FeOx. Besides this, a certain amount of carbon was also detected (Figure 2b,d). However, given that the particles were deposited on the carbon membrane of a TEM grid, it is difficult to differentiate whether the detected carbon comes from the particles or not.
Apparent evidence for the generation of carbon during LAL was witnessed by HRTEM characterization (Figure 3a,f,g) and EDX analysis (Figure 3b–e). Both amorphous carbon (Figure 3b,d,f) and onion-like carbon (Figure 3b,d,f,g) were discovered, which encapsulated amorphous Fe particles to form the amorphous-Fe@carbon (a-Fe@C) core-shell particles (a representative particle is shown with an arrow marked in Figure 3b). Facilitated by the adhesion of different carbon shells, a-Fe@C core-shell particles gradually evolve into a particle network (Figure 1a–c and Figure 3g). This phenomenon is consistent with previous reports that LAL in organic solvents often causes the decomposition of solvent molecules and results in the formation of carbon-encapsulated particle networks [10,37]. Amorphous FeOx clusters (Figure 3a–e) were also generated, which surrounded big core-shell particles to facilitate the formation of particle network. Figure 2a–e and Figure 3a–e also indicate that, besides a-Fe@C core-shell particles, large Fe@FeOx core-shell particles with diameters of tens of nm are produced by LAL of Fe in acetone.
To better understand the compositions of Fe@FeOx core-shell particles, a core-shell particle was selected as the representative particle for HRTEM, SAED and FFT characterizations, as shown in Figure 4a–c. To further clarify the crystallinity in different regions, HRTEM images of seven domains of FeOx shells and one larger domain of an Fe core were displayed in Figure 4d–k. The SAED pattern of the core-shell particle indicates that the core-shell particle has a low crystallinity since only two diffraction rings were observed (Figure 4b), which fits well with the (104) and (214) planes of α-Fe2O3 (ICSD No. 01-089-0597). FFT analysis gives more information about the crystallinity of the core-shell particle, which indicates that two more planes of the (113) and (116) planes of α-Fe2O3 are also present. Figure 4d–h display the HRTEM images of different crystal domains in the FeOx shell which possess (104), (113), (116) and (214) planes of α-Fe2O3 with interplanar distances of 0.270, 0.217, 0.170 and 0.150 nm, respectively. Besides α-Fe2O3, another diffraction ring belonging to a crystal plane with an interplanar distance of 0.300 nm was also detected, which can be assigned to the (220) plane of Fe3O4 (ICSD No. 01-089-0950). It is noteworthy that (i) the crystals in the FeOx shell are mainly single crystalline; and (ii) the quality of the single-crystallinity is not particularly good because many defects among the crystal planes are obvious (Figure 4d–g,l–o). One domain of the FeOx shell is almost completely amorphous (Figure 4j). As concluded from Figure 4d–h, the FeOx shell is composed of many α-Fe2O3 single-crystalline crystals with different crystallographic orientations. Regarding the Fe core, it is totally amorphous (Figure 4k). That is why no peak was detected during XRD characterization (Figure 1e). Regarding the dominant small particles, four crystalline domains outside the Fe@FeOx particle are shown in Figure 4l–o. The interplanar distances of 0.217, 0.217, 0.217 and 0.270 nm of these crystalline domains are well indexed to (113), (113), (113) and (104) planes of α-Fe2O3. As indicated by HRTEM analysis, it is clear that single-crystalline α-Fe2O3 nanocrystals with different crystallographic orientations are abundant in the nanoblends.
Raman spectroscopy shows seven peaks at 220.9, 239.5, 286.0, 401.4, 495.9, 606.7, 659.4, 812.0, 1050, 1099.4, 1297.7 and 1603.0 cm−1 (Figure 5) associated with α-Fe2O3, in accordance with the conclusion from HRTEM analysis (Figure 4) that α-Fe2O3 is the main crystalline product. Besides the peaks corresponding to α-Fe2O3, another small peak is also observed at 1584.7 cm−1, which can be assigned to the G-band of carbon and therefore indicates the presence of a large amount of carbon in the particles, in accordance with the HRTEM images shown in Figure 3f–g and XPS analysis which show that the outermost 5 nm-thick surfaces of the as-prepared particles are composed of 72.22% C, 1.29% Fe and 26.49% O. The high C ratio and low Fe and O ratios suggest that a higher ratio of carbon/carbon-byproduct clusters are generated by the laser-induced decomposition of acetone molecues. High-resolution XPS Fe 2p, O 1s and C 1s spectra are shown in Figure 6. After peak fitting, the ratio of sp2/sp3-C was calculated to be 0.89. The sp2 and sp3 carbons correspond to an ordered graphite (sp2) structure and disordered graphite layers (e.g., soot, chars, glassy carbon, and evaporated amorphous carbon [36,38]), respectively. Thus, more than half of the C that precipitates on Fe@Fe2O3 particles is crystalline because the sp2/sp3 ratio is less than 1, in accordance with the HRTEM images shown in Figure 3f–g, where onion-like carbons with some defects appear as shells to embed a-Fe particles inside. When both sp2 and sp3 C states are mixed in particles, diamond-like carbon (DLC) [39] structures are considered to be generated. DLC structures should be a typical product of LAL in organic solvents since they were also observed from other nanomaterials obtained by the LAL of different metals (e.g., Ag [36], Mo [39], Ti, [40], Ta [41], Nb [41], Hf [41], Mo [41] and Co [37]) in organic solvents. Peak fitting of C 1s (Figure 6c) shows that 15.91% and 21.90% of the carbon have C=O and C–O bonding, respectively, which is due to adsorbed acetone molecules and their decomposition byproducts. From the XPS Fe 2p spectrum (Figure 6a), only the binding energies that correspond to Fe3+ (711.2 eV and 724.9 eV) and Fe0 (707.3 eV and 720.1 eV) are observed, which come from α-Fe2O3 and a-Fe, respectively. Because of abundant C–O and C=O bindings on the particle surfaces, only a small amount of Fe-O binding can be deconvoluted from the O 1s spectrum (Figure 6b). Both XPS and Raman spectra support the conclusion from HRTEM analysis that α-Fe2O3 is the dominant phase of the crystalline particles.
The synthesized Fe@α-Fe2O3 and α-Fe2O3 particles were unstable with gradual particle precipitation at the bottom of the glass container (right optical image inset in Figure 7a) during the colloid storage. As a result, the absorbance spectrum of the colloid downshifted (Figure 7a) and the optical transparency of the colloid increased after 3-week storage (left and middle optical images inset in Figure 7a). Additionally, the zeta potential values of the colloid decreased from −34.88 mV to −27.95 mV after 3-week storage, which indicates the decreased stability of the colloid. The zeta potential is indicative of the difference in the electric potentials between the charges of the species which strongly adsorb on the particle surface and those (with the opposite sign) of the diffuse layer in the dispersing medium [42]. It is often considered that the colloids with a zeta potential value smaller than −30 mV or larger than 30 mV are stable, while those with zeta potential values in the range of −30~30 mV are unstable [3]. Hence, in principle, one would expect that the stable particles with larger charges remain well dispersed while those with lower charges precipitate. However, in our case, the zeta potential value of the colloids decreased over time, which indicated that the gradual aggregation of nanoparticles occurred during colloidal storage. The magnetic properties among magnetic particles and the “capture” behavior of both carbon shells (Figure 3a) and free carbon clusters [36] cause colloidal aggregation and precipitation during storage. Considering the excellent long-term (six-month) stability of Ag colloid produced by LAL in acetone [36], it is highly possible that the magnetostatic interaction among magnetic particles is the main reason to be responsible for the colloidal aggregation and precipitation.
Compared with the techniques of laser target evaporation in gases and laser ablation in air whereby metal-oxide [43,44] is produced, LAL is better at the synthesis of Fe@C and Fe@FeOx core-shell particles and further indicates a new way to synthesize single-crystalline iron oxide particles.

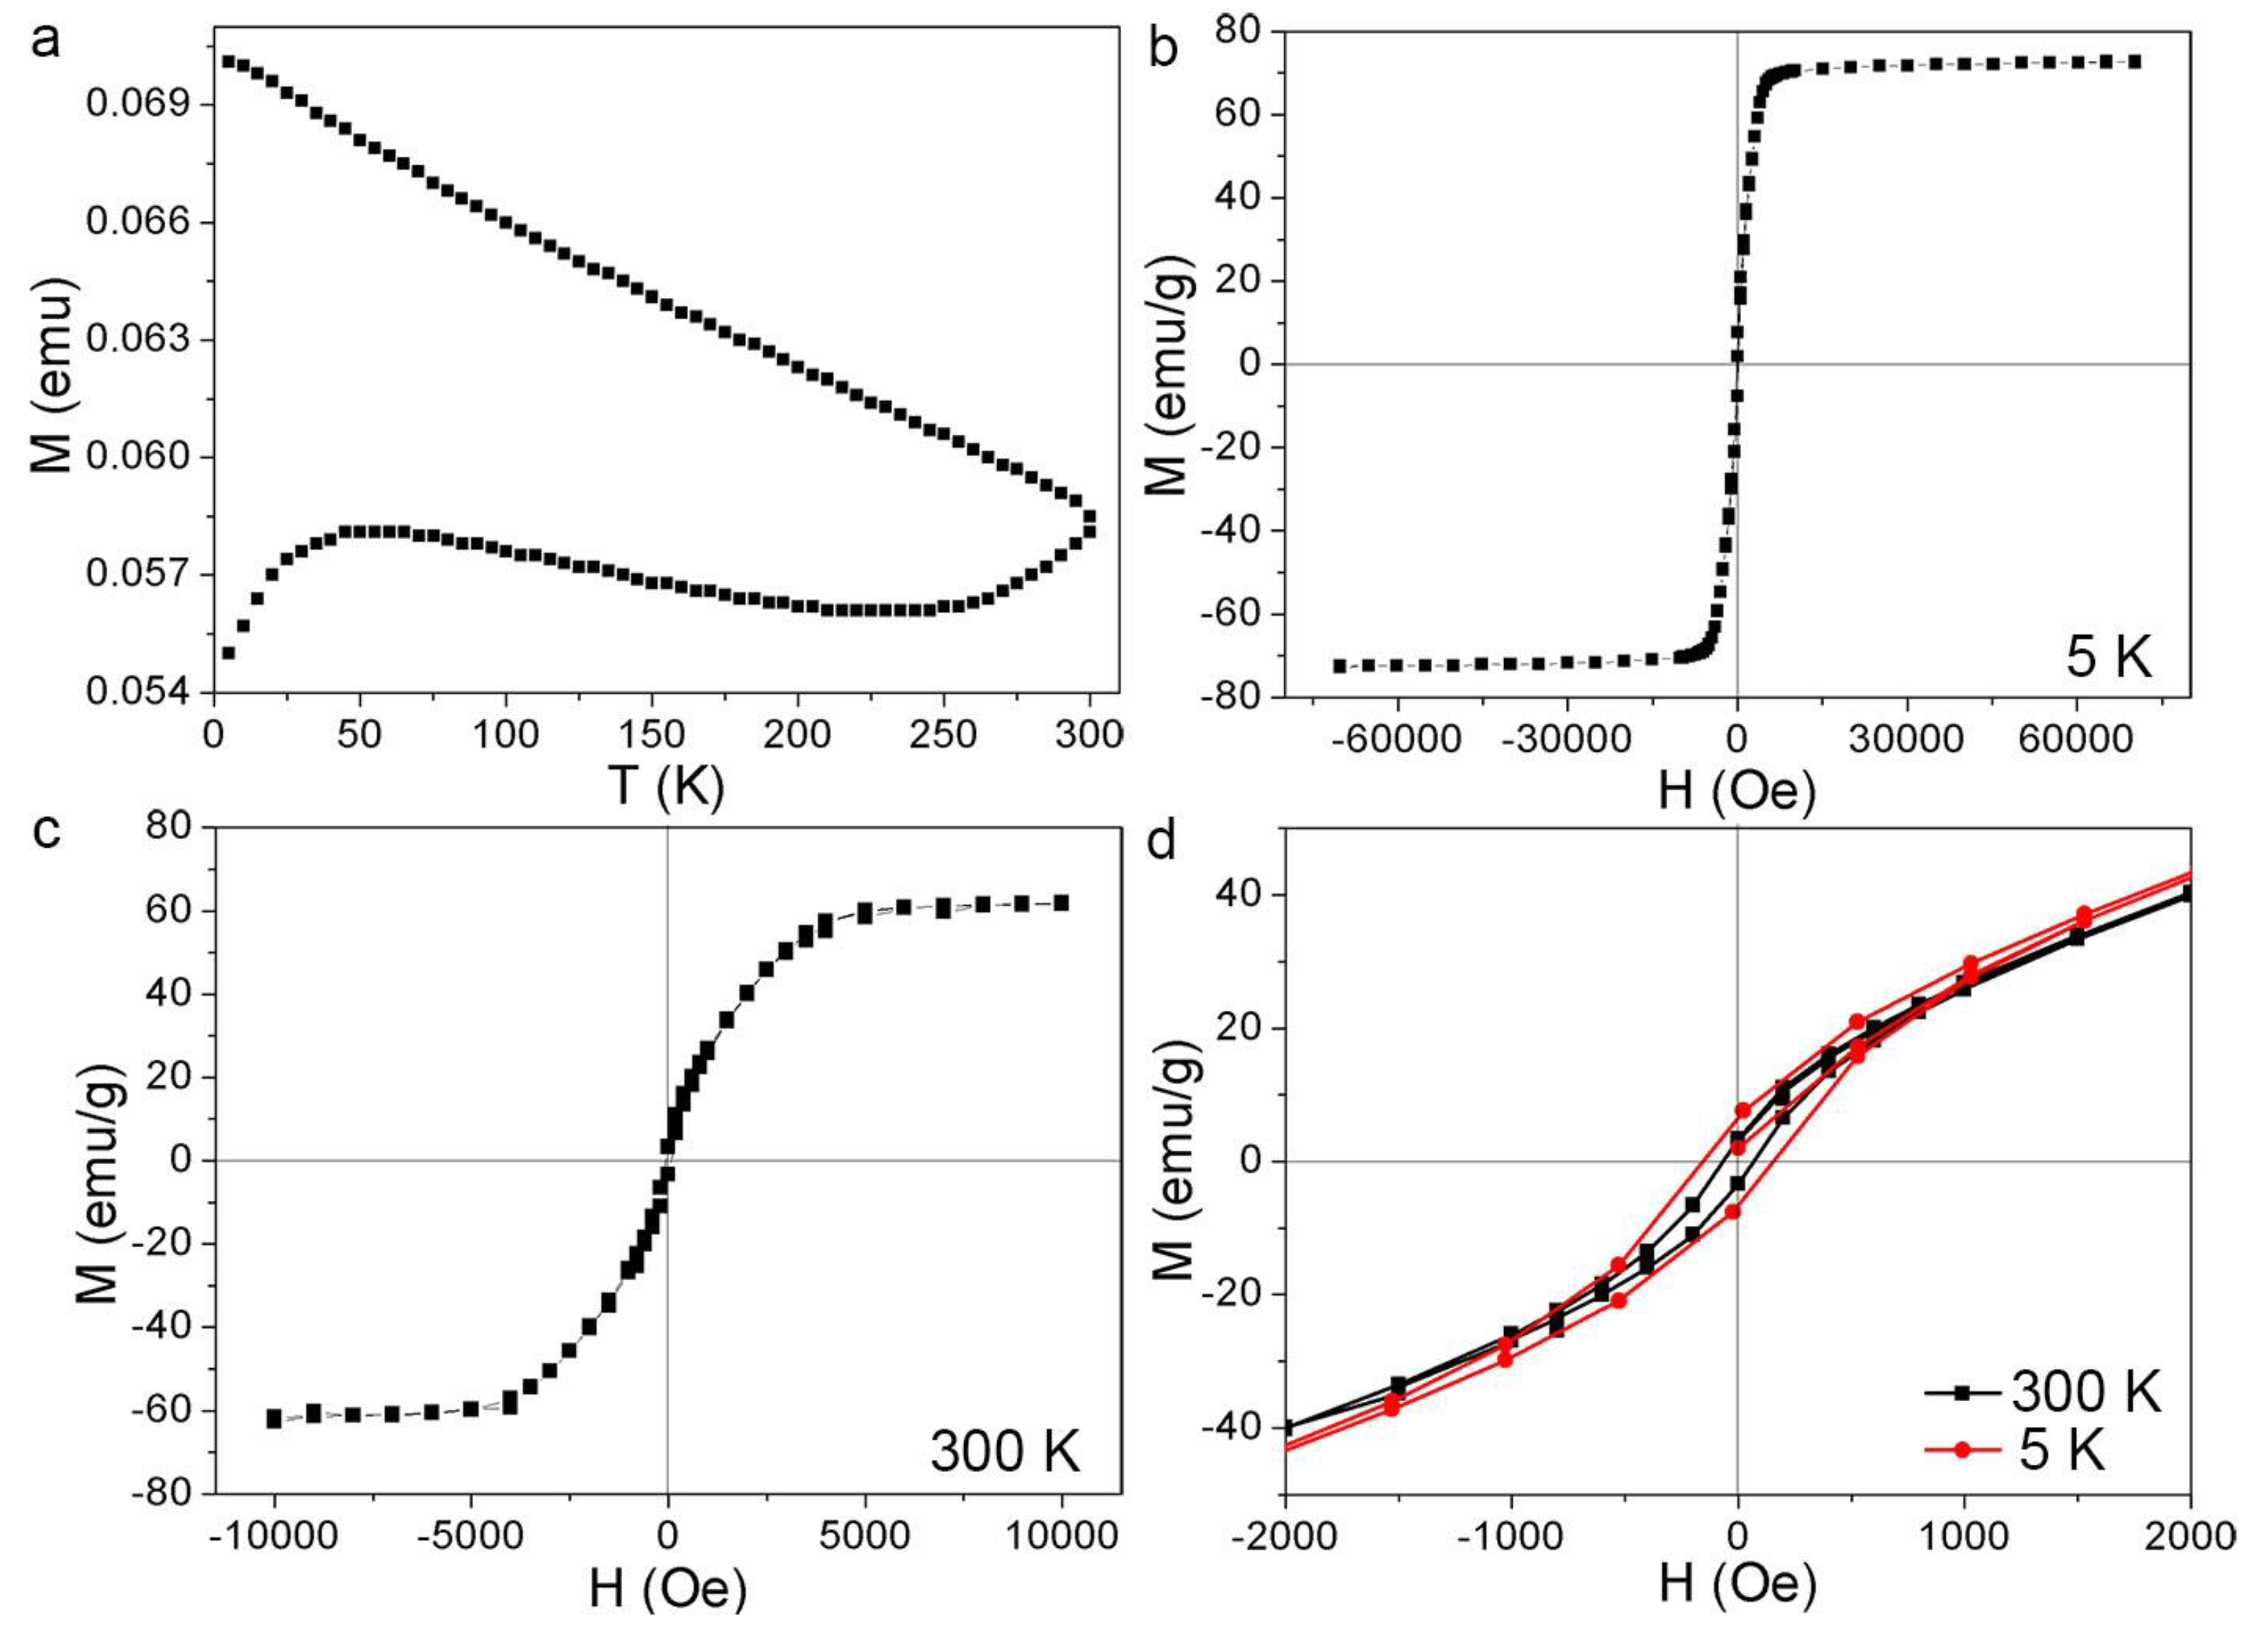
3.2. Magnetic Properties

The magnetic properties of the Fe@α-Fe2O3 particles prepared in acetone are presented in Figure 8. To reveal the relationship between magnetization and temperature, ZFC and FC curves of the as-prepared nanomaterials were measured. The ZFC curve in Figure 8a shows a broad maximum peaking at 52 K, followed by a plateau and a subsequent gradual increase from 250–300 K suggesting two different fractions of particles. The FC branch exhibits an almost linear increase of the magnetic moment with decreasing temperature from 300 K to 5 K. Figure 8b,c show the magnetic hysteresis loops at 5 K and 300 K with saturation magnetization MS = 72.5 emu/g and 61.9 emu/g, respectively. The magnification around zero field delivers coercivities of HC = 160 Oe at 5 K and 70 Oe at 300 K.
The structural and morphological studies above reveal a mixture of Fe@α-Fe2O3, Fe@C, and α-Fe2O3 particles (Figure 2, Figure 3 and Figure 4) which can be split into two size regimes. The sizes of large Fe@α-Fe2O3 and Fe@C core-shell particles with a number frequency of about 10% are in the range of 10–100 nm, with the maximum diameter of the distribution being 30 nm (Figure 1d). α-Fe2O3 particles are significantly smaller, with a medium size of 4–5 nm (Figure 1d), at a number frequency of about 90%. For the magnetometry of magnetic powders, magnetization is the ratio of the magnetic moment with respect to mass of particles in different size regimes. Taking identical mass densities as a rough estimate, the relative mass fraction of the large particles is calculated to be 87%–93%. Further consideration of the significantly smaller magnetization of α-Fe2O3 of 1 emu/g as compared to amorphous Fe with MS > 100 emu/g [45] further reduces the relative magnetic signal from α-Fe2O3. This means that the vast majority of the magnetic signal stems from the larger particles while the smaller are expected contributing less than 1% in the saturated state.
Therefore, the saturation magnetization of MS = 72.5 emu/g and 61.9 emu/g at 5 K and 300 K, respectively, is considered to mainly stem from the amorphous Fe cores of large a-Fe@FeOx core-shell particles. This deduction is also helpful in understanding the magnetic properties (MS = 67 emu/g at 300 K) of a-Fe@C and Fe3O4 nanoblends synthesized by fs-LAL of Fe in acetone under other conditions (35 fs, 800 nm, 5 kHz, 800 μJ/pulse) [18]. The remanence to saturation ratio (Mr/Ms), also called the saturation magnetization ratio, was calculated to be ca. 0.1, which was smaller than that (0.5) expected theoretically for randomly oriented single domain grains [46], which indicates the presence of a significant amount of superparamagnetic small particles, domain walls in large particles, and the occurrence of antiferromagnetic interactions [47]. Here, all the above may add to an overall low remanence. It is well known that α-Fe2O3 is weakly ferromagnetic or antiferromagnetic [48], and its presence as the shell material endows antiferromagnetic properties to the Fe@α-Fe2O3 particles while the small α-Fe2O3 particles are expected to be superparamagnetic at 300 K and thermally blocked at 5 K (see discussion below). The interfacial magnetic interactions between ferromagnetic cores and antiferromagnetic shells [49,50] may also endow high orbital magnetic moment to LAL-synthesized a-Fe@α-Fe2O3 particles. For the metallic a-Fe core, Grinstaff et al. have confirmed that glassy a-Fe is a soft ferromagnetic material with MS = 152 emu/g and Hc = 160 Oe at T = 5 K [45]. While Hc fits well to the present results, the lower MS can be explained by the mixture of amorphous Fe, the weakly ferromagnetic α-Fe2O3, and the unknown but significant amount of C in the sample. Thus, the remanent magnetization mainly originates from large Fe@α-Fe2O3 core-shell ferromagnetic particles with multi-domains, which cannot rapidly demagnetize by domain formation in the absence of an applied field.
A more interesting phenomenon is the magnetic signature of small α-Fe2O3 particles, which results in different ZFC/FC curves as compared to those of a-Fe@C particles synthesized by fs-LAL of Fe in acetone under other conditions [18]. The broad peak with a maximum at 52 K is ascribed to the blocking behavior of α-Fe2O3 particles on top of an almost constant signal in the interval of 5–250 K arising from the larger Fe@α-Fe2O3 particles. The smallest particles of the Fe@α-Fe2O3 particles gradually cross their blocking temperature TB with the temperature increasing above 250 K. At 300 K, however, only a minor fraction of Fe@α-Fe2O3 is superparamagnetic, explaining the monotonous increase in the FC branch; moreover, the interparticle interactions [51] among LAL-generated particles [43] of the magnetic core-shell particles are supposedly not strong enough to cause collective magnetic freezing to enter a spin-glass state.
We do not observe any sharp change of the magnetization, which indicates the absence of the Morin transition in α-Fe2O3. Previous reports have shown that in small α-Fe2O3 particles with diameters below 19 nm (cf. Figure 1a–d), the Morin transition occurring in bulk α-Fe2O3 is smeared out over a wide temperature range or even completely suppressed [52,53]. This leads to weakly ferromagnetic α-Fe2O3 for all considered temperatures. The blocking behavior with TB = 52 K at the peak position can be translated to an effective magnetic anisotropy energy density Keff via Keff·V = 25 kBTB with V the particle volume and kB Boltzmann’s constant. The factor of 25 is the natural logarithm of the product of the measurement time window of SQUID magnetometry (10 s) and the intrinsic attempt frequency of about 1010 Hz [53]. For 4–5 nm hematite nanospheres, as in our cases, Keff is calculated to be 2.7–5.4 × 10⁵ J/m3. Bödker et al. extracted an energy barrier of 300–600 K for 16 nm which translates to Keff = 0.5–1.1 × 10⁵ J/m3 [53] and a strongly increasing Keff when the particle size is reduced, reaching a maximum value of 2.4 × 10⁵ J/m3 for 5.9 nm particles at the smallest investigated diameter [54]. In this light, the obtained results for the 4–5 nm α-Fe2O3 particles convincingly extend the size dependence to smaller diameters.
Despite a very broad size distribution, the α-Fe2O3 particles synthesized by fs-LAL possess the lowest blocking temperature of 52 K among all α-Fe2O3 particles synthesized by LAL [2]. The blocking temperature of FeOx particles synthesized by the ns-LAL of Fe in water was ca. 220 K, which corresponds to the particle size of 15 nm [14]. The ps-LAL of Fe in ethanol gave rise to the formation of Fe3O4/Fe3C mixture colloids which had a bimodal size distribution with maxima at ca. 3 nm and ca. 12 nm [21]. Because of the generation of a greater amount of small particles by ps-LAL, the blocking temperature down-shifted to 120 K when the applied field was 50 Oe [21]. According to the previously reported relationship between the blocking temperatures and particle sizes [20], it is estimated that the average size of Fe3O4/Fe3C mixture colloid obtained by ps-LAL in ethanol was ca. 9 nm. In the case of fs-LAL shown in this work, the blocking temperature is further lowered to 52 K, which corresponds to the particle size of ca. 4–5 nm for α-Fe2O3.

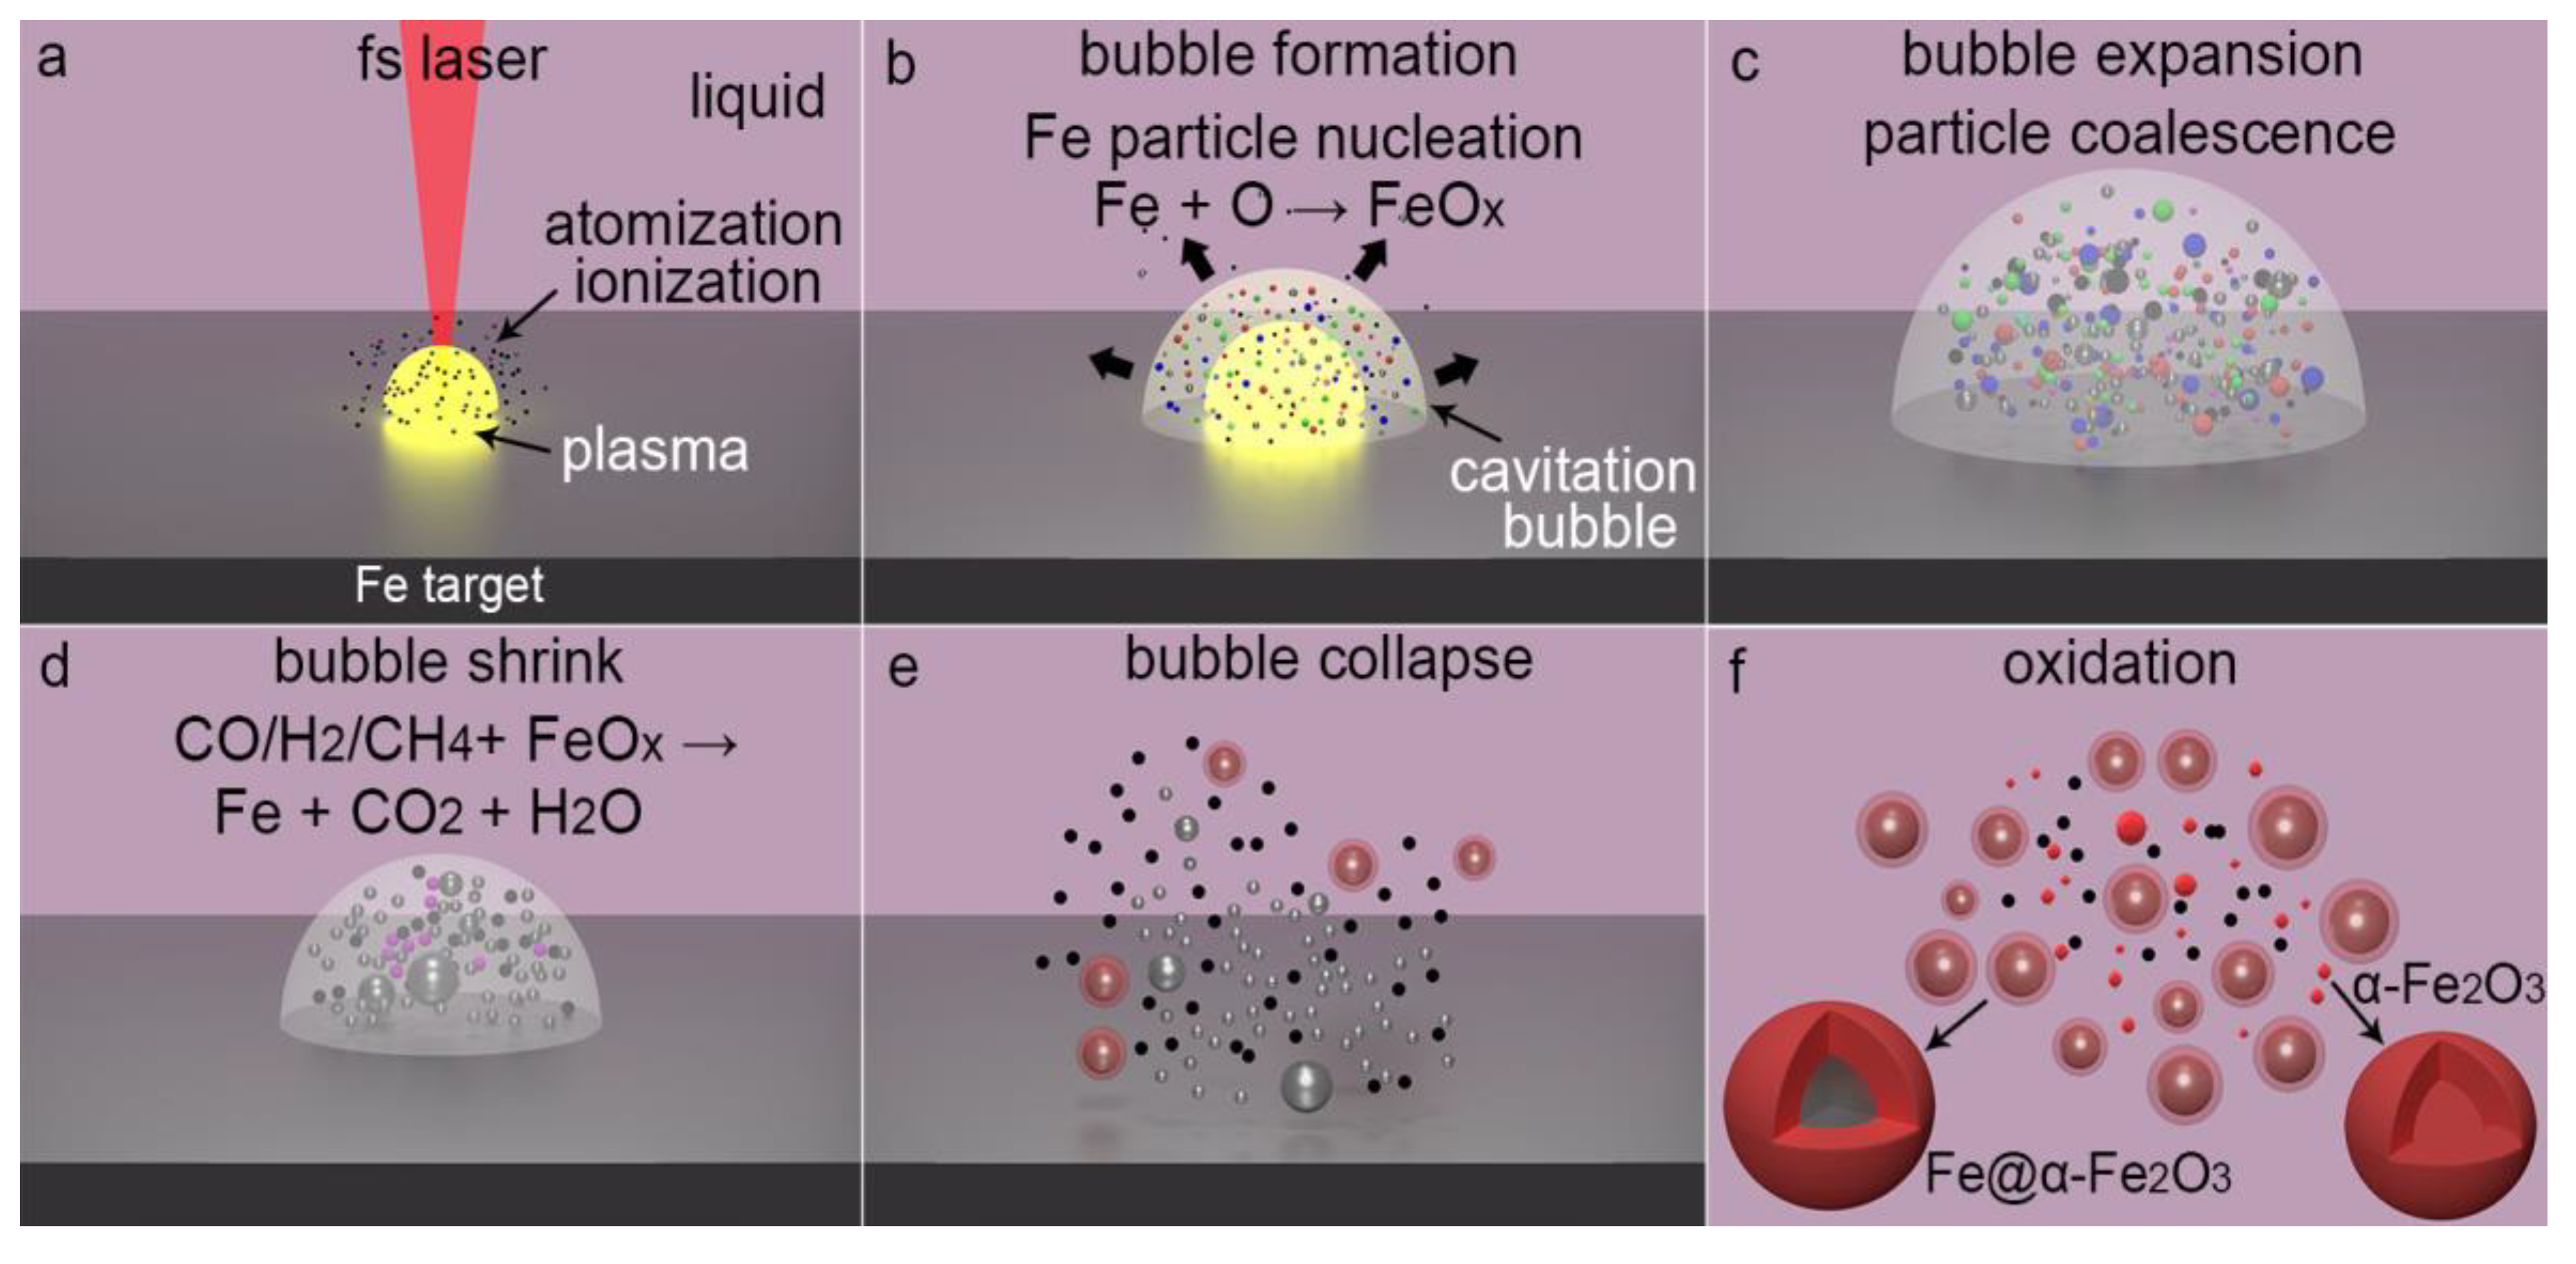
3.3. Formation Mechanism

Considering the advantage of fs-LAL over ps-LAL, and ns-LAL enabling the synthesis of ultrasmall magnetic particles with lower blocking temperatures, the formation mechanism of both Fe@C, Fe@FeOx and ultrasmall α-Fe2O3 particles is here proposed to show the uniqueness of the fs-LAL process. The large size difference between ultrasmall α-Fe2O3 clusters of several nm and large core-shell particles with sizes ranging from tens of nm to 130 nm indicates that large particles do not form through particle growth mechanism but form through ejection of large Fe particles during LAL [55]. The ultrasmall α-Fe2O3 particles less than 10 nm (Figure 5g) should form due to phase/Coloumb explosion mechanism for fs-LAL. In contrast, owing to the thermal ablation mechanism, the sizes of the majority of the small particles inside the cavitation bubble are already 12 nm for ns-LAL [56]. The particle growth after bubble collapse often leads to a further increase in the particle sizes. Therefore, despite a small amount of large Fe particle ejection due to thermal effects during fs-LAL, the main “cold” process of fs-LAL is more efficient at generating ultrasmall particles than both ps- and ns-LAL.
Due to the plasma-induced decomposition of acetone molecules and the dissociation of the dissolved oxygen (Figure 9a) [57], O radicals are generated during fs-LAL of Fe in acetone, which may react with the surrounding Fe atoms (generated from plasma-induced target material atomization) to form FeOx clusters (Figure 9b). However, due to the existence of limited oxygen, the main products generated from the plasma phase are pure Fe clusters. The sizes of Fe and FeOx clusters may increase slightly during bubble expansion (Figure 9c) by coalescence. Inside the cavitation bubble, reductive gases [58] such as H2, CO and CH4 reduce FeOx, which results in the formation of pure Fe particles (Figure 8d). After bubble collapses (Figure 8e), the outer parts of large Fe particles are oxidized into FeOx shells containing a large amount of α-Fe2O3 domains (Figure 9g), while the ultrasmall Fe particles are oxidized into α-Fe2O3 particles (Figure 9f,g). Due to the difference in local temperature and pressure as well as the variation in oxygen abundance around Fe particles, Fe particles crystallize into α-Fe2O3 or Fe3O4 single crystals along different crystallographic orientations. It is also possible that (1) reductive gases in the cavitation bubbles inhibit complete oxidation of Fe into FeOx and their further polycrystallization; (2) during bubble collapses, the shock waves [59] render small α-Fe2O3 crystals with high kinetic energy to make them quickly eject towards the already formed Fe@FeOx particles to be captured by FeOx shells as single domains.
Extremely superfast cooling of the molten Fe droplets inhibits their crystallization so that a-Fe rather than crystalline Fe particles form after LAL. The cooling rate required for a-Fe formation ranges from 105 to 107 K/s [60], which can be easily obtained during the ultrafast quenching of LAL-generated plasma (thousands of Kelvin quenching within a submicro-second interval [61]). During the ejection of the molten Fe particles from the ablated target, they interact with acetone molecules, as a case of the electric explosion of steel in carbon-rich liquids [62,63], resulting in the formation of carbon atoms and other carbonaceous byproducts, which then precipitate on Fe particles to form C-shells. During their precipitation, Fe particles with high surface activity act as catalysts to facilitate the formation of onion-like carbon shells. The presence of carbons on the Fe particles inhibits particle growth and coalescence [4] and prevent surface oxidation, leading to the formation of Fe@C core-shell particles (Figure 3f–g).
Under the impact of the high-temperature and high-pressure environment in the plasma phase of fs-LAL, the atomization/ionization of carbon impurities in the iron substrates and the decomposition of the acetone molecules [64,65] occur simultaneously (Figure 9a), which leads to the formation of free C clusters. Besides pure carbon, polycyclic structures may be also generated through the interaction between Fe particles and organic solvents [63], which may precipitate on the already particles to make them evolve into networks. In consequence, the stability of the colloids decreases during storage and results in the precipitation of particles (Figure 7).

4. Conclusions

This work has demonstrated the capability of synthesizing large Fe@α-Fe2O3 and small α-Fe2O3 particles which are practically completely split in the size histogram. Four to five nanometer α-Fe2O3 particles exhibit a low blocking temperature of 52 K by fs-LAL in acetone, among the lowest ever achieved by LAL. From superparamagnetic blocking, an effective magnetic anisotropy Keff = 2.7–5.4 × 10⁵ J/m3 has been estimated which extends previous investigations convincingly towards smaller hematite particle sizes. Surprisingly, most small α-Fe2O3 particles were single-crystalline, and so the possibility of synthesizing single-crystalline particles by LAL was demonstrated. Because of the dominant mass of large Fe@α-Fe2O3 and Fe@C particles (10–100 nm), all nanoblends show a soft magnetic behavior with saturation magnetization (Ms) and coercivities (Hc) values of 72.5 emu/g and 160 Oe at 5 K and 61.9 emu/g and 70 Oe at 300 K, respectively, which mainly originate from amorphous Fe core particles. Previously, ZFC/FC curves were seldom investigated as compared to hysteresis curves for LAL-generated magnetic particles. Here, it was shown that the blocking temperatures in the ZFC curves can be used to estimate the sizes of small magnetic particles.

Author Contributions

D.Z., K.S. conceived and designed the experiments; W.C. performed the experiments; D.Z. characterized the particles and analyzed the data; Y.O. and D.Z. did the magnetic measurement; U.W. analyzed the magnetic properties; H.-P.L. and Y.I. measured the zeta potential of the colloid, D.Z. and K.S. wrote the paper, all authors read and revised the manuscript.

Acknowledgments

The authors acknowledge Aiko Nakao from the Institute of Physical and Chemical Research (RIKEN) for her help with XPS measurement and analysis. Also, we would also like to thank the Materials Characterization Support Unit, RIKEN CEMS for providing access to the TEM microscopy, XRD, Raman and XPS instruments and the support from Masaki Takeguchi from NIMS (National Institute for Materials Science) for HRTEM characterization and analysis.

Conflicts of Interest

The authors declare no conflict of interest.

References

  1. Zhang, D.; Gökce, B. Perspective of laser-prototyping nanoparticle-polymer composites. Appl. Surf. Sci. 2017, 392, 991–1003. [Google Scholar] [CrossRef]
  2. Zhang, D.; Gökce, B.; Barcikowski, S. Laser synthesis and processing of colloids: Fundamentals and applications. Chem. Rev. 2017, 117, 3990–4103. [Google Scholar] [CrossRef] [PubMed]
  3. Zhang, D.; Liu, J.; Li, P.; Tian, Z.; Liang, C. Recent advances in surfactant-free, surface charged and defect-rich catalysts developed by laser ablation and processing in liquids. ChemNanoMat 2017, 3, 512–533. [Google Scholar] [CrossRef]
  4. Zhang, D.; Liu, J.; Liang, C. Perspective on how laser-ablated particles grow in liquids. Sci. China Phys. Mech. Astron. 2017, 60, 074201. [Google Scholar] [CrossRef]
  5. Amendola, V.; Meneghetti, M. What controls the composition and the structure of nanomaterials generated by laser ablation in liquid solution? Phys. Chem. Chem. Phys. 2013, 15, 3027–3046. [Google Scholar] [CrossRef] [PubMed]
  6. Zhang, D.; Gökce, B.; Sommer, S.; Streubel, R.; Barcikowski, S. Debris-free rear-side picosecond laser ablation of thin germanium wafers in water with ethanol. Appl. Surf. Sci. 2016, 367, 222–230. [Google Scholar] [CrossRef]
  7. Letzel, A.; Gökce, B.; Wagener, P.; Ibrahimkutty, S.; Menzel, A.; Plech, A.; Barcikowski, S. Size quenching during laser synthesis of colloids happens already in the vapor phase of the cavitation bubble. J. Phys. Chem. C 2017, 121, 5356–5365. [Google Scholar] [CrossRef]
  8. Rehbock, C.; Merk, V.; Gamrad, L.; Streubel, R.; Barcikowski, S. Size control of laser-fabricated surfactant-free gold nanoparticles with highly diluted electrolytes and their subsequent bioconjugation. Phys. Chem. Chem. Phys. 2013, 15, 3057–3067. [Google Scholar] [CrossRef] [PubMed] [Green Version]
  9. Zhang, D.; Ma, Z.; Spasova, M.; Yelsukova, A.E.; Lu, S.; Farle, M.; Wiedwald, U.; Gökce, B. Formation mechanism of laser-synthesized iron-manganese alloy nanoparticles, manganese oxide nanosheets and nanofibers. Part. Part. Syst. Charact. 2017, 34, 1600225. [Google Scholar] [CrossRef]
  10. Amendola, V.; Riello, P.; Meneghetti, M. Magnetic nanoparticles of iron carbide, iron oxide, iron@iron oxide, and metal iron synthesized by laser ablation in organic solvents. J. Phys. Chem. C 2011, 115, 5140–5146. [Google Scholar] [CrossRef]
  11. Lasemi, N.; Bomati Miguel, O.; Lahoz, R.; Lennikov, V.; Pacher, U.; Rentenberger, C.; Kautek, W. Laser-assisted synthesis of colloidal fewxoy and fe/fexoy nanoparticles in water and ethanol. Chemphyschem 2018. [Google Scholar] [CrossRef] [PubMed]
  12. Vahabzadeh, E.; Torkamany, M.J. Iron oxide nanocrystals synthesis by laser ablation in water: Effect of laser wavelength. J. Clust. Sci. 2014, 25, 959–968. [Google Scholar] [CrossRef]
  13. Liu, P.; Cai, W.; Zeng, H. Fabrication and size-dependent optical properties of feo nanoparticles induced by laser ablation in a liquid medium. J. Phys. Chem. C 2008, 112, 3261–3266. [Google Scholar] [CrossRef]
  14. Amendola, V.; Riello, P.; Polizzi, S.; Fiameni, S.; Innocenti, C.; Sangregorio, C.; Meneghetti, M. Magnetic iron oxide nanoparticles with tunable size and free surface obtained via a “green” approach based on laser irradiation in water. J. Mater. Chem. 2011, 21, 18665–18673. [Google Scholar] [CrossRef]
  15. Pandey, B.K.; Shahi, A.K.; Shah, J.; Kotnala, R.K.; Gopal, R. Optical and magnetic properties of fe2o3 nanoparticles synthesized by laser ablation/fragmentation technique in different liquid media. Appl. Surf. Sci. 2014, 289, 462–471. [Google Scholar] [CrossRef]
  16. Svetlichnyi, V.A.; Shabalina, A.V.; Lapin, I.N.; Goncharova, D.A.; Velikanov, D.A.; Sokolov, A.E. Characterization and magnetic properties study for magnetite nanoparticles obtained by pulsed laser ablation in water. Appl. Phys. A 2017, 123, 763. [Google Scholar] [CrossRef]
  17. Ismail, R.A.; Sulaiman, G.M.; Abdulrahman, S.A.; Marzoog, T.R. Antibacterial activity of magnetic iron oxide nanoparticles synthesized by laser ablation in liquid. Mater. Sci. Eng. C 2015, 53, 286–297. [Google Scholar] [CrossRef] [PubMed]
  18. Kanitz, A.; Hoppius, J.S.; del Mar Sanz, M.; Maicas, M.; Ostendorf, A.; Gurevich, E.L. Synthesis of magnetic nanoparticles by ultrashort pulsed laser ablation of iron in different liquids. Chemphyschem 2017, 18, 1155–1164. [Google Scholar] [CrossRef] [PubMed]
  19. Santillán, J.M.J.; Muñetón Arboleda, D.; Coral, D.F.; Fernández van Raap, M.B.; Muraca, D.; Schinca, D.C.; Scaffardi, L.B. Optical and magnetic properties of fe nanoparticles fabricated by femtosecond laser ablation in organic and inorganic solvents. Chemphyschem 2017, 18, 1192–1209. [Google Scholar]
  20. Jongnam, P.; Eunwoong, L.; Nong-Moon, H.; Misun, K.; Chul, K.S.; Yosun, H.; Je-Geun, P.; Han-Jin, N.; Jae-Young, K.; Jae-Hoon, P.; et al. One-nanometer-scale size-controlled synthesis of monodisperse magnetic iron oxide nanoparticles. Angew. Chem. 2005, 117, 2932–2937. [Google Scholar]
  21. Franzel, L.; Bertino, M.F.; Huba, Z.J.; Carpenter, E.E. Synthesis of magnetic nanoparticles by pulsed laser ablation. Appl. Surf. Sci. 2012, 261, 332–336. [Google Scholar] [CrossRef]
  22. Khan, U.; Adeela, N.; Irfan, M.; Ali, H.; Han, X.F. Temperature mediated morphological and magnetic phase transitions of iron/iron oxide core/shell nanostructures. J. Alloys Compd. 2017, 696, 362–368. [Google Scholar] [CrossRef]
  23. Pardoe, H.; Chua-anusorn, W.; St. Pierre, T.G.; Dobson, J. Structural and magnetic properties of nanoscale iron oxide particles synthesized in the presence of dextran or polyvinyl alcohol. J. Magn. Magn. Mater. 2001, 225, 41–46. [Google Scholar] [CrossRef]
  24. Qiang, Y.; Antony, J.; Sharma, A.; Nutting, J.; Sikes, D.; Meyer, D. Iron/iron oxide core-shell nanoclusters for biomedical applications. J. Nanopart. Res. 2006, 8, 489–496. [Google Scholar] [CrossRef]
  25. Sugioka, K.; Cheng, Y. Femtosecond laser three-dimensional micro- and nanofabrication. Appl. Phys. Rev. 2014, 1, 041303. [Google Scholar] [CrossRef] [Green Version]
  26. Zhang, D.; Chen, F.; Fang, G.; Yang, Q.; Xie, D.; Qiao, G.; Li, W.; Si, J.; Hou, X. Wetting characteristics on hierarchical structures patterned by a femtosecond laser. J. Micromech. Microeng. 2010, 20, 075029. [Google Scholar] [CrossRef]
  27. Zhang, D.; Chen, F.; Yang, Q.; Si, J.; Hou, X. Mutual wetting transition between isotropic and anisotropic on directional structures fabricated by femotosecond laser. Soft Matter 2011, 7, 8337–8342. [Google Scholar] [CrossRef]
  28. Zhang, D.; Chen, F.; Yang, Q.; Yong, J.; Bian, H.; Ou, Y.; Si, J.; Meng, X.; Hou, X. A simple way to achieve pattern-dependent tunable adhesion in superhydrophobic surfaces by a femtosecond laser. ACS Appl. Mater. Interfaces 2012, 4, 4905–4912. [Google Scholar] [CrossRef] [PubMed]
  29. Moussa, S.; Atkinson, G.; El-Shall, M.S. Laser-assisted synthesis of magnetic fe/fe2o3 core: Carbon-shell nanoparticles in organic solvents. J. Nanopart. Res. 2013, 15, 1470. [Google Scholar] [CrossRef]
  30. Zufía-Rivas, J.; Morales, P.; Veintemillas-Verdaguer, S. Effect of the sodium polyacrylate on the magnetite nanoparticles produced by green chemistry routes: Applicability in forward osmosis. Nanomaterials 2018, 8, 470. [Google Scholar]
  31. Nguyen, V.; Gauthier, M.; Sandre, O. Templated synthesis of magnetic nanoparticles through the self-assembly of polymers and surfactants. Nanomaterials 2014, 4, 628. [Google Scholar] [CrossRef] [PubMed]
  32. Maneeratanasarn, P.; Khai, T.V.; Kim, S.Y.; Choi, B.G.; Shim, K.B. Synthesis of phase-controlled iron oxide nanoparticles by pulsed laser ablation in different liquid media. Phys. Status Solidi A 2013, 210, 563–569. [Google Scholar] [CrossRef]
  33. Sukhov, I.A.; Aleksandr, V.S.; Georgii, A.S.; Viau, G.; Garcia, C. Formation of nanoparticles during laser ablation of an iron target in a liquid. Quantum Electron. 2012, 42, 453. [Google Scholar] [CrossRef]
  34. De Bonis, A.; Lovaglio, T.; Galasso, A.; Santagata, A.; Teghil, R. Iron and iron oxide nanoparticles obtained by ultra-short laser ablation in liquid. Appl. Surf. Sci. 2015, 353, 433–438. [Google Scholar] [CrossRef]
  35. Marzun, G.; Bönnemann, H.; Lehmann, C.; Spliethoff, B.; Weidenthaler, C.; Barcikowski, S. Role of dissolved and molecular oxygen on cu and ptcu alloy particle structure during laser ablation synthesis in liquids. Chemphyschem 2017, 18, 1175–1184. [Google Scholar] [CrossRef] [PubMed]
  36. Zhang, D.; Choi, W.; Jakobi, J.; Kalus, M.-R.; Barcikowksi, S.; Cho, S.-H.; Sugioka, K. Spontaneous shape alteration and size separation of surfactant-free silver particles synthesized by laser ablation in acetone during long-period storage. Nanomaterials 2018, 8, 529. [Google Scholar] [CrossRef] [PubMed]
  37. Zhang, H.; Liang, C.; Liu, J.; Tian, Z.; Shao, G. The formation of onion-like carbon-encapsulated cobalt carbide core/shell nanoparticles by the laser ablation of metallic cobalt in acetone. Carbon 2013, 55, 108–115. [Google Scholar] [CrossRef]
  38. Robertson, J. Diamond-like amorphous carbon. Mater. Sci. Eng. 2002, 37, 129–281. [Google Scholar] [CrossRef] [Green Version]
  39. Madrigal-Camacho, M.; Vilchis-Nestor, A.R.; Camacho-López, M.; Camacho-López, M.A. Synthesis of moc@graphite nps by short and ultra-short pulses laser ablation in toluene under n2 atmosphere. Diamond Relat. Mater. 2018, 82, 63–69. [Google Scholar] [CrossRef]
  40. De Bonis, A.; Santagata, A.; Galasso, A.; Laurita, A.; Teghil, R. Formation of titanium carbide (tic) and tic@c core-shell nanostructures by ultra-short laser ablation of titanium carbide and metallic titanium in liquid. J. Colloid Interfaces Sci. 2017, 489, 76–84. [Google Scholar] [CrossRef] [PubMed]
  41. Zhang, H.; Liu, J.; Tian, Z.; Ye, Y.; Cai, Y.; Liang, C.; Terabe, K. A general strategy toward transition metal carbide/carbon core/shell nanospheres and their application for supercapacitor electrode. Carbon 2016, 100, 590–599. [Google Scholar] [CrossRef]
  42. Giorgetti, E.; Muniz-Miranda, M.; Marsili, P.; Scarpellini, D.; Giammanco, F. Stable gold nanoparticles obtained in pure acetone by laser ablation with different wavelengths. J. Nanopart. Res. 2012, 14, 648. [Google Scholar] [CrossRef]
  43. Safronov, A.; Beketov, I.; Komogortsev, S.; Kurlyandskaya, G.; Medvedev, A.; Leiman, D.; Larrañaga, A.; Bhagat, S. Spherical magnetic nanoparticles fabricated by laser target evaporation. AIP Adv. 2013, 3, 052135. [Google Scholar] [CrossRef] [Green Version]
  44. Osipov, V.V.; Platonov, V.V.; Uimin, M.A.; Podkin, A.V. Laser synthesis of magnetic iron oxide nanopowders. Tech. Phys. 2012, 57, 543–549. [Google Scholar] [CrossRef]
  45. Grinstaff, M.W.; Salamon, M.B.; Suslick, K.S. Magnetic properties of amorphous iron. Phys. Rev. B 1993, 48, 269. [Google Scholar] [CrossRef]
  46. Goya, G.; Berquo, T.; Fonseca, F.; Morales, M. Static and dynamic magnetic properties of spherical magnetite nanoparticles. J. Appl. Phys. 2003, 94, 3520–3528. [Google Scholar] [CrossRef]
  47. Hadjipanayis, G.; Sellmyer, D.J.; Brandt, B. Rare-earth-rich metallic glasses. I. Magnetic hysteresis. Phys. Rev. B 1981, 23, 3349. [Google Scholar] [CrossRef]
  48. Teja, A.S.; Koh, P.-Y. Synthesis, properties, and applications of magnetic iron oxide nanoparticles. Prog. Cryst. Growth Charact. Mater. 2009, 55, 22–45. [Google Scholar] [CrossRef]
  49. Wiedwald, U.; Spasova, M.; Salabas, E.; Ulmeanu, M.; Farle, M.; Frait, Z.; Rodriguez, A.F.; Arvanitis, D.; Sobal, N.; Hilgendorff, M. Ratio of orbital-to-spin magnetic moment in co core-shell nanoparticles. Phys. Rev. B 2003, 68, 064424. [Google Scholar] [CrossRef]
  50. Han, L.; Wiedwald, U.; Biskupek, J.; Fauth, K.; Kaiser, U.; Ziemann, P. Nanoscaled alloy formation from self-assembled elemental co nanoparticles on top of pt films. Beilstein J. Nanotechnol. 2011, 2, 473. [Google Scholar] [CrossRef] [PubMed] [Green Version]
  51. Xu, Y.Y.; Rui, X.F.; Fu, Y.Y.; Zhang, H. Magnetic properties of α-fe2o3 nanowires. Chem. Phys. Lett. 2005, 410, 36–38. [Google Scholar] [CrossRef]
  52. Wu, C.; Yin, P.; Zhu, X.; OuYang, C.; Xie, Y. Synthesis of hematite (α-fe2o3) nanorods:  Diameter-size and shape effects on their applications in magnetism, lithium ion battery, and gas sensors. J. Phys. Chem. B 2006, 110, 17806–17812. [Google Scholar] [CrossRef] [PubMed]
  53. Bødker, F.; Hansen, M.F.; Koch, C.B.; Lefmann, K.; Mørup, S. Magnetic properties of hematite nanoparticles. Phys. Rev. B 2000, 61, 6826. [Google Scholar]
  54. Bødker, F.; Mørup, S. Size dependence of the properties of hematite nanoparticles. Europhys. Lett. 2000, 52, 217. [Google Scholar]
  55. Shih, C.-Y.; Streubel, R.; Heberle, J.; Letzel, A.; Shugaev, M.; Wu, C.; Schmidt, M.; Gokce, B.; Barcikowski, S.; Zhigilei, L. Two mechanisms of nanoparticle generation in picosecond laser ablation in liquids: The origin of the bimodal size distribution. Nanoscale 2018, 10, 6900–6910. [Google Scholar] [CrossRef] [PubMed]
  56. Ibrahimkutty, S.; Wagener, P.; Rolo, T.d.S.; Karpov, D.; Menzel, A.; Baumbach, T.; Barcikowski, S.; Plech, A. A hierarchical view on material formation during pulsed-laser synthesis of nanoparticles in liquid. Sci. Rep. 2015, 5, 16313. [Google Scholar] [CrossRef] [PubMed] [Green Version]
  57. Semaltianos, N.G.; Friedt, J.-M.; Chassagnon, R.; Moutarlier, V.; Blondeau-Patissier, V.; Combe, G.; Assoul, M.; Monteil, G. Oxide or carbide nanoparticles synthesized by laser ablation of a bulk hf target in liquids and their structural, optical, and dielectric properties. J. Appl. Phys. 2016, 119, 204903. [Google Scholar] [CrossRef]
  58. Kalus, M.-R.; Barsch, N.; Streubel, R.; Gokce, E.; Barcikowski, S.; Gokce, B. How persistent microbubbles shield nanoparticle productivity in laser synthesis of colloids—Quantification of their volume, dwell dynamics, and gas composition. Phys. Chem. Chem. Phys. 2017, 19, 7112–7123. [Google Scholar] [CrossRef] [PubMed]
  59. Lauterborn, W.; Vogel, A. Shock wave emission by laser generated bubbles. In Bubble Dynamics and Shock Waves; Springer: Berlin, Germany, 2013; pp. 67–103. [Google Scholar]
  60. Suslick, K.S.; Choe, S.-B.; Cichowlas, A.A.; Grinstaff, M.W. Sonochemical synthesis of amorphous iron. Nature 1991, 353, 414. [Google Scholar] [CrossRef]
  61. Dell’Aglio, M.; Gaudiuso, R.; De Pascale, O.; De Giacomo, A. Mechanisms and processes of pulsed laser ablation in liquids during nanoparticle production. Appl. Surf. Sci. 2015, 348, 4–9. [Google Scholar]
  62. Lázár, K.; Varga, L.K.; Kovács Kis, V.; Fekete, T.; Klencsár, Z.; Stichleutner, S.; Szabó, L.; Harsányi, I. Electric explosion of steel wires for production of nanoparticles: Reactions with the liquid media. J. Alloys Compd. 2018, 763, 759–770. [Google Scholar]
  63. Beketov, I.V.; Safronov, A.P.; Bagazeev, A.V.; Larrañaga, A.; Kurlyandskaya, G.V.; Medvedev, A.I. In situ modification of fe and ni magnetic nanopowders produced by the electrical explosion of wire. J. Alloys Compd. 2014, 586, S483–S488. [Google Scholar] [CrossRef]
  64. Liu, P.; Cui, H.; Yang, G. Synthesis of body-centered cubic carbon nanocrystals. Cryst. Growth Des. 2008, 8, 581–586. [Google Scholar] [CrossRef]
  65. Seyedeh Zahra, M.; Parviz, P.; Ali, R.; Soghra, M.; Rasoul, S.-B. Generation of various carbon nanostructures in water using ir/uv laser ablation. J. Phys. D Appl. Phys. 2013, 46, 165303. [Google Scholar]
Figure 1. (ac) TEM images of the particles synthesized by the laser ablation of Fe in acetone at 400 mW. (d) Size distribution of the synthesized particles. The inset figure shows the detailed size distribution in the range of 0–10 nm. (e) XRD pattern of the synthesized particles, where no peaks were detected, probably due to the low crystallinity of the particles and a large amount of carbon clusters. (f,g) and (h,i) black field and white field scanning transmission electron microscopy (STEM) images of small particles, respectively.
Nanomaterials 08 00631 g001
Figure 2. (a) TEM image and (be) EDX mapping of small clusters. (b) TEM image of mixed elements of (c) Fe, (d) C and (e) O images.
Nanomaterials 08 00631 g002
Figure 3. (a) TEM image and (be) EDX mapping of a Fe@FeOx core-shell particle. (b) TEM image of mixed elements of (c) Fe, (d) C and (e) O images. (f,g) TEM images of the Fe@C particles.
Nanomaterials 08 00631 g003
Figure 4. (a) High-resolution transition electron microscropy (HRTEM) image of a Fe@FeOx core-shell particle, (b) selected area electron diffraction (SAED) and (c) FFT analysis of the core-shell particle. HRTEM images of (dj) α-Fe2O3 shells, (i) Fe3O4 shell and (j) amorphous FeOx shell and (k) amorphous Fe core, respectively. (lo) Single-crystalline α-Fe2O3 crystals. Inset images in (k,n) show the FFT image indicating an amorphous structure and the inverse FFT image of the structure showing clearer crystal planes, respectively. The scale bar in the inset image of (n) is 0.5 nm.
Nanomaterials 08 00631 g004
Figure 5. Raman spectrum of the particles obtained by the laser ablation in liquids (LAL) of Fe in acetone.
Nanomaterials 08 00631 g005
Figure 6. High resolution XPS (a) Fe 2p, (b) O 1s and (c) C 1s spectra from the colloids synthesized by laser ablation of Fe in acetone.
Nanomaterials 08 00631 g006
Figure 7. (a) Absorption spectra for the fresh colloid (red curve) synthesized by laser ablation of Fe in acetone at 600 mW and (b) the colloid stored for 3 weeks (black curve), respectively. Inset images in (a) are optical images of the fresh colloid (left) and the colloid stored for 3 weeks (middle), where the precipitation of the colloid (as indicated by white arrows in the right optical image) causes the downshift of the absorbance spectra. (b) Zeta potential curves of the fresh colloid and the colloid stored for 3 weeks.
Nanomaterials 08 00631 g007
Figure 8. Magnetic characterization of the Fe@α-Fe2O3 particles synthesized by laser ablation in acetone. (a) ZFC/FC curves in 50 Oe, (b,c) hysteresis curves at 5 and 300 K. (d) Magnified hysteresis curves at 5 and 300 K.
Nanomaterials 08 00631 g008
Figure 9. (af) Schematic of formation mechanism for Fe@α-Fe2O3 particles by fs-LAL of Fe in acetone. Oxygen radicals that react with Fe atoms to from FeOx come from fs laser induced decomposition of acetone and dissolved oxygen. Fe: grey color, C: black color, α-Fe2O3: red color, other FeOx phases: green and blue color. Note that the shockwaves [59] generated during bubble collapse can push the already formed α-Fe2O3 ultrasmall particles towards Fe@FeOx particles to be captured by the FeOx shells.
Nanomaterials 08 00631 g009

