We observed a new feather-like structure in the experiment and found that the formation of this structure is related to the GB and the HMF. To analyze this effect, we present the results of phase-field simulations of the spinodal decomposition in the Fe-Cr-Co alloy during thermal-magnetic treatment and compare with experimental results.
4.1. Theoretical Model
We employed the phase-field method and use the nonlinearized Cahn–Hilliard diffusion equation to describe the time evolution of a composition field in the Fe-Cr-Co system. The model for the spinodal decomposition process used in this study is a combination of several models, including the models of Cahn and Hilliard [
18,
19], Ramanarayan and Abinandanan [
12], Biner [
20], and Lv and coworkers [
21]. Our model uses a composition field c, and the time-dependent Cahn–Hilliard equation is written by [
19]:
where
E represents the total free energy, and
M is the atomic mobility tensor, which may depend on position. The mobility value at the boundary is considered to be much higher than that of the grain interior. The enhanced mobility is calculated here by an equation simplified from the model of Ramanarayan and Abinandanan [
12]. A position-dependent mobility tensor M in a direction parallel to the GB plane is defined by:
in which the value of factor
is 1 at the GB and is zero outside the GB.
Mb is the atomic mobility in the grain interior.
Mt is the enhanced atomic mobility in the plane of the GB.
Thermomagnetic treatment is important in the spinodal decomposition process of the Fe-Cr-Co alloy. We considered the effect of a magnetic field on the phase separation behavior, in addition to the chemical potential energy. Also, we considered the role of elastic inhomogeneities on the phase separation behavior. The total free energy
E is assumed to be additive and composed of three parts in our model: chemical, elastic, and magnetic energies. The Cahn–Hilliard equation has been modified as:
where
Ech,
Eel,
Emag are the chemical energy, the elastic energy, and the magnetic energy, respectively.
The chemical energy
Ech is expressed in a simple Cahn–Hilliard equation [
19]:
where
κ is the gradient energy coefficient. In this paper, a double-well function is used to describe the bulk free energy
f(c):
in which
Ac is a positive constant.
We simulated the boundary elastic stress on the phase decomposition by incorporating into our calculations the model of Biner [
20], which considers the stress fields of dislocations that compose the boundary. For simplicity, the boundary is supposed to be composed of an array of dislocation dipoles (composed of two edge dislocations). The dislocation dipoles were introduced on
a (1 −1 0) slip plane with Burgers vector
b =
a0/2 [1 1 1], where
a0 is the lattice constant. The elastic energy can be described by [
20]:
where
is the stress,
is total strain, and
is the position- and composition-dependent eigenstrain. The total strain
is related to the displacements
ui and is given by the kinematic equation, expressed as:
where
u and
x are the displacement and position vectors, respectively. All the phases in Fe-Cr-Co alloys are assumed to be linear elastic. The stresses
are obtained through Hooks law
, where C
ijkl is the position-dependent elastic modulus tensor. In this paper, the elastic coefficients for bcc Co are assumed to be
, and the elastic coefficients for Fe and Cr are
GPa,
GPa,
GPa,
GPa,
GPa, and
GPa, respectively [
22].
The system requires the solution of mechanical equilibrium,
The contribution of dislocations to the elastic energy is calculated through their eigenstrain [
20]:
where
b is Burgers vector to the slip plane,
n is the normal vector to the slip plane, and
d is the interplanar distance of the slip planes.
Emag is the magnetic energy, which depends on the magnetic domain morphology in the microstructure and the external magnetic field. The magnetic energy contributing to total free energy is taken as [
21]:
in which
, and
are the chemical potentials corresponding to the external magnetic field energy, magnetic exchange energy, magnetocrystalline anisotropy energy, and demagnetizing energy, respectively.
In this model, we simplified the calculation of magnetic energy from the model of Lv and coworkers [
21]. The magnetocrystalline anisotropy and the magnetic exchange energy was neglected here. The demagnetizing energy is the dipole–dipole interaction energy between magnetic moments, which is expressed as [
21]:
where
Is is the absolute value of the magnetization moment vector, which depends on the local composition. The vector
m(r) is the normalized magnetization moment (|
m(r)|=1).
is the demagnetizing field, which is calculated by [
21]:
The external magnetic field energy is expressed as:
were
is the external magnetic field.
We introduce the following dimensionless parameters:
, where
Mb is the atomic mobility in the grain interior,
;
, in which
f0 is a reference energy,
; the dimensionless gradient energy coefficient
,
, b is the magnitude of Burgers vector
b =
a0/2 [1 1 1]. In this study, only the external magnetic field energy and demagnetizing energy was considered, and the magnetic chemical potential is calculated by [
21]:
where
Is,max is the maximal value of
Is,
,
.
, where A is the magnetic exchange constant
The dimensionless grid sizes were set to be
and
in the simulations. The dimensionless time step
was set as 10
-3. The simulation cell had
Nx =
Ny = 800 grid points with grid spacing d
x = d
y = 1. The width of the dipole (width of boundary) was 20 grid-spacing. The concentration field c was initially set to have random initial fluctuations of about
c0 = 0.4, and periodic boundary conditions were used in the simulation, which were set the same as in [
2]. Since this study is a combination of several models, the parameters related to the magnetic field contribution were taken from [
2], the parameters related to the enhanced mobility were taken from [
12], and the parameters related to the dislocations in the GB were taken from [
20]. We wrote the simulation codes by Matlab.
4.2. Calculated results and Discussion
As discussed above, there are several different factors acting on the spinodal decomposition of Fe-Cr-Co alloys. To understand the mechanism of this process, we designed several conditions to observe the microstructural evolution through the phase-field simulation. (1) The first condition is the single effect of the enhanced mobility (EM); (2) The second condition is the combined effect of EM and elastic energy of dislocation (EED), by which we tried to compare the effect of EED to EM; (3) The third condition is to observe the effect of an applied HMF, combined with the same parameters set for the second condition. The dislocation dipoles in the second and the third conditions have an equal spacing. Such an arrangement of dislocation exists in a tilt GB; (4) The fourth condition has the same parameters as the third condition, except the spacing between dislocation dipoles is unequal. Since the dislocation spacings in a real GB cannot always be equal, we changed the dislocation spacing to be randomly distributed in a range, to observe the dependence of the EED effect on the dislocation spacings; (5) In the fifth condition, we changed the direction of the HMF to orient parallel to the GB.
Figure 6 shows the two-dimensional simulation of the spinodal decomposition in the Fe-Cr-Co alloys under several different conditions in the thermomagnetic treatment. The white parts are the FeCo-rich regions (α
1 phase), and the dark parts are the Cr-rich regions (α
2 phase). The initial state of the supersaturated solid solution was set with a small composition fluctuation due to the computer-generated random number. Our simulation introduced an array of edge dislocation dipoles (20 grid-spacing in width and 10 grid-spacing apart in the y-direction) to represent a GB. The GB was set to migrate in the right direction (the left edge of GB migrates from
x = 40 to
x = 480, with a velocity of 5).
In the first condition, the mobility in the GB region is enhanced in the direction parallel to the GB according to equation (2).
Figure 6a–c shows the influence of enhanced mobility (EM) on the spinodally decomposed structure. In the region where the GB has passed, the α
1 phase tends to change from round particles to rods. This trend is significant at the initial stage of the spinodal decomposition, as shown in
Figure 6a when
Mt = 5,
t* = 2000. There is competitive growth between the α
1 rods accelerated by the GB and the α
1 particles precipitated from other regions. As the α
1 round particles from other regions grow to a certain size, the effect of EM cannot change the shape of these particles, as shown in
Figure 6b. Moreover, the α
1 rods might change into irregular shapes and lose the regular arrangement in the subsequent coarsening process. The effect of EM is more significant with high
Mt.
Figure 6c shows the morphology under
Mt = 100, where α
1 rods tend to be elongated and regularly arranged perpendicular to the GB. The diameter of the α
1 rods appears to be approximately equal or larger compared with the α
1 round particles without the EM effect.
In the second condition, we set a normal effect of EM (
Mt = 5) combined with the EED generated by dislocation dipoles with equal spacing of 10 grid.
Figure 6d shows an initial state at
t* = 100 of the supersaturated solid solution, and a trace of the GB can be observed on the left side of the image. The effect of EM and EED has accelerated the spinodal decomposition, leading to the prior precipitation of the α
1 phase in the GB regions, making the trace of the GB clear. In the regions where the GB has passed, the α
1 particles were elongated by the EED, arranged in lines that are perpendicular to the GB, as shown in
Figure 6e. The combined effect of the EED and EM on the elongation of the α
1 phase is more obvious compared with that of only EM in the first condition. The effect of the GB in the second condition is also limited by the competitive growth from the α
1 particles formed by composition fluctuation before the presence of GB, and the elongation of the α
1 phase only affected the initial stage of spinodal decomposition. These original rods tend to change into irregular shapes or round particles after being aged for a longer time, hence, the morphology in this region lost its regular arrangement, as shown in
Figure 6f.
Figure 6g–i shows the effect of an external magnetic field being applied to the spinodal decomposition.
Figure 6g shows a trace of the GB; as discussed above, the trace is formed by the prior precipitation of the α
1 phase. Despite this prior precipitation being generated by the effect of EM and EED, a clearer trace of the GB is formed with an applied HMF, as shown in
Figure 6g. Since the rod-like α
1 precipitates in the trace are parallel to the HMF, their growth is improved by the magnetization.
Figure 6h shows the morphology of two regions separated by the GB with differently shaped α
1 phases. In the region where the GB has not passed, the α
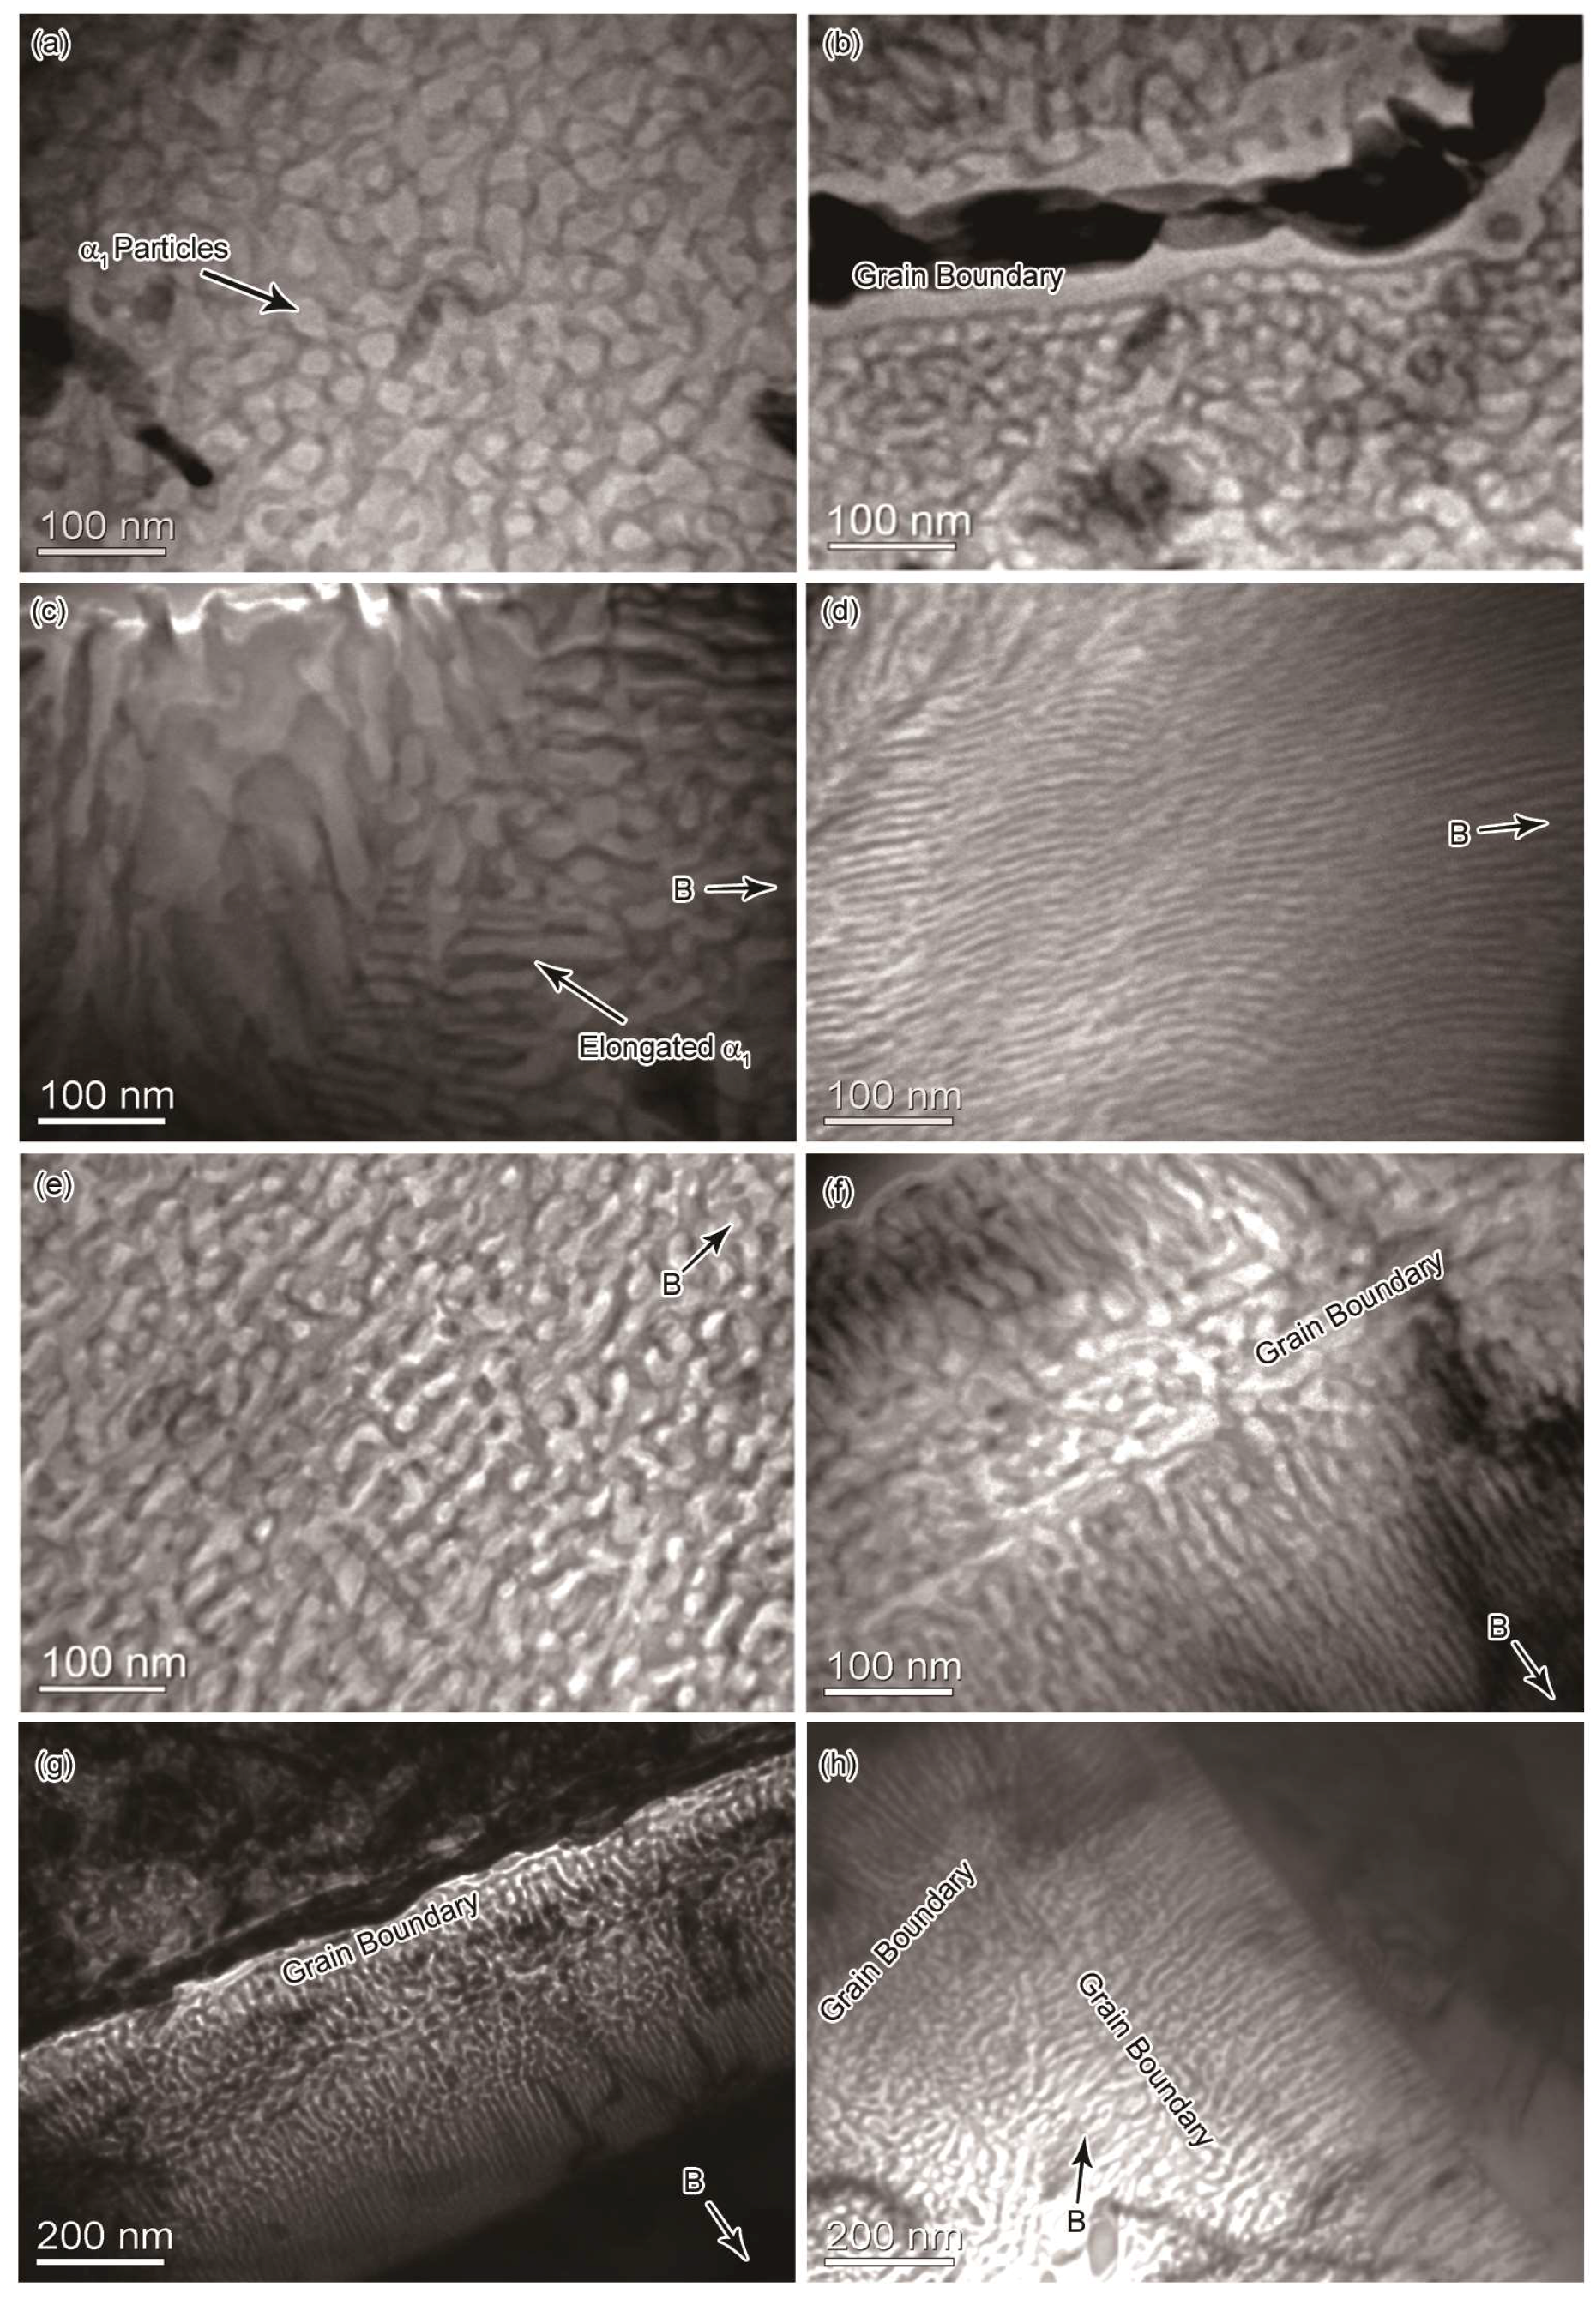
1 precipitates are elongated along the external magnetic field, and some appear as curved rods. Moreover, a feather-like structure is formed in the region where the GB has passed under the combined effect of the HMF, the EM, and the EED. The feather-like structure contains very long α
1 rods that are regularly arranged, which is quite similar to the morphology observed experimentally in
Figure 3d. In the coarsening process, the width of the α
1 phase increases with increasing aging time. Nevertheless, the feather-like structure has a high structural stability and exhibits a slow coarsening rate. Therefore, after a long coarsening process, the α
1 phase in the feather-like structure has a much smaller width compared with that in other regions, as shown in
Figure 3i. The morphological developments of the simulated microstructures are in good agreement with the experimental results that were observed.
We used the fourth condition to study the dependence of the EED effect on the dislocation spacings.
Figure 6j–l shows the effect of a GB in which the dislocations are arranged with unequal spacings between them. The GB trace shown in
Figure 6j exhibits this spacing difference. The feather-like structure is also formed in this condition, except that some parts of it appear to be discontinuous, which makes it not as regular as the one shown in
Figure 6h. These discontinuous regions correspond to the traces of the large spacing between them. A spacing larger than 15 grid leads to a discontinuous distribution of the α
1 phase and disturbs the formation of the feather-like structure, indicating there is a critical spacing required to form the feather-like structure. In the later coarsening process, these discontinuous regions disturb the stability of the feather-like structure, leading to a faster coarsening rate, as shown in
Figure 6f. The large spacing in the fourth condition provides an extreme case; this spacing difference might be larger than that in a real boundary in the Fe-Cr-Co alloys. The experimental feather-like structure shown in
Figure 3d,f both exhibit a more continuous and regular morphology than the simulated results of the fourth condition, though they are not as regular as the one simulated with the third condition. This indicates that the dislocation spacing difference is small in the GBs causing the experimental feather-like structure.
In the fifth condition, we changed the direction of the HMF to orient parallel to the GB, and the other parameter settings are the same as in the third condition. At the initial stage, the effect of the GB is stronger, hence,
Figure 6m appears to be similar to
Figure 6g. Later, the HMF takes effect, whereas the elongation effect of the GB and HMF on the α
1 phase cannot be combined. The formation of the feather-like structure has failed. Instead, there is competitive growth between the α
1 precipitates accelerated by the GB and the α
1 precipitates accelerated by the HMF, as shown in
Figure 6n. They interfere with each other, with the α
1 precipitates growing in a tilt direction in some regions. In the end, the effect of the HMF is advantageous, because it allows for the control of the growth direction of the α
1 precipitates in most regions, as shown in
Figure 6o. In addition, this mutual interference between the two effects results in a fast coarsening of some α
1 precipitates with large size near the original position of the GB. A similar morphology is observed experimentally in the left part of
Figure 3c.
In this model, the total energy is influenced by several factors, including the HMF, the EM, and the EED. The decomposition rate appears to be different depending on the different combinations of these factors. The decomposition rate is indicated by the change of average concentration
.
Figure 7a shows the
curves against time, considering different factors. The
curve has the smallest value in the case excluding all the effects of the GB and HMF, corresponding to the slowest decomposition rate. The decomposition rate is enhanced slightly by considering the EM effect, and enhanced much further by considering the EED effect. This demonstrates that the dislocations accelerate the local precipitates of the α
1 phases. The highest value of
is shown in the curve considering the effect of the HMF, indicating that the HMF can accelerate the precipitation of the α
1 phase.
The shape of the α
1 phase includes spheres, ellipses, and rods, hence, we measured their size with both maximum diameter and minimum diameter.
Figure 7b shows the distribution of the minimum diameter (
Dmin) that corresponds to the different regions shown in
Figure 6f,i. The largest value of the mean
Dmin is shown in the curve considering only GB. Besides, this curve also has the largest distribution range. The
Dmin decreased slightly after removing the GB factor, indicating that the GB promotes the coarsening of the α
1 phase, probably through the enhanced mobility. Under the effect of the HMF, the mean
Dmin and the distribution range are decreased considerably. The smallest value of the mean
Dmin is shown in the curve representing a region with the combined effect of the HMF and GB, namely, the feather-like structure shown in
Figure 6i.
Figure 7c shows the aspect ratio of the α
1 precipitates generated in different conditions, including the single effect of the HMF (namely, the non-GB regions in the third and fourth conditions), and the GB effect under an HMF with equal and unequal dislocation spacing (namely, the feather-like structure in the third and fourth conditions). Considering only the effect of the HMF, the aspect ratio ranges up to 20. Under the combined effect of the HMF and GB, the feather-like structure shows a considerable increase in the aspect ratio of the α
1 rods. In the third condition, the aspect ratio ranges up to 140 in the feather-like structure. Although the GB has a weaker elongation effect in the fourth condition, the distribution of the aspect ratio still ranges up to 50.
The determination of the mean
Dmin can be used to evaluate the coarsening rate of the α
1 phase.
Figure 7d shows the mean
Dmin of the α
1 precipitates against time in several conditions. The mean
Dmin increases quickly at the initial stage of decomposition, then the coarsening rate slows down with increasing aging time. Considering only the GB, the precipitates have the highest coarsening rate, and the mean
Dmin increases quickly. The coarsening rate decreases slightly after removing the GB factor. Considering the effect of the HMF, the coarsening rate becomes much slower. Furthermore, in the region considering the combined effect of the HMF and GB, namely, the feather-like structure,
Dmin nearly stops increasing after time step 5000, indicating a high structural stability in this region. The high structural stability occurring in the simulation can explain the formation of the feather-like structure in the experimental results shown in
Figure 3, in which the α
1 phase has a much slimmer shape compared with other regions.

