Abstract
Nowadays, synthetic organic dyes and pigments discharged from numerous industries are causing unprecedentedly severe water environmental pollution, and conventional water treatment processes are hindered due to the corresponding sophisticated aromatic structures, hydrophilic nature, and high stability against light, temperature, etc. Herein, we report an efficient fabrication strategy to develop a new type of highly efficient, low-cost, and magnetically recoverable nanocatalyst, i.e., FePt–Ag nanocomposites, for the reduction of methyl orange (MO) and rhodamine B (RhB), by a facile seed deposition process. X-ray diffraction results elaborate that the as-synthesized FePt–Ag nanocomposites are pure disordered face-centered cubic phase. Transmission electron microscopy studies demonstrate that the amount of Ag seeds deposited onto the surfaces of FePt nanocrystals increases when increasing the additive amount of silver colloids. The linear correlation of the MO and RhB concentration versus reaction time catalyzed by FePt–Ag nanocatalysts is in line with pseudo-first-order kinetics. The reduction rate constants of MO and RhB increase with the increase of the amount of Ag seeds. FePt–Ag nanocomposites show good separation ability and reusability, and could be repeatedly applied for nearly complete reduction of MO and RhB for at least six successive cycles. Such cost-effective and recyclable nanocatalysts provide a new material family for use in environmental protection applications.
1. Introduction
At present, water environmental pollution has become a major global issue. Excessive emissions of the dye effluents derived from the textile, leather, food, paper, plastic, rubber, and pharmaceutical industries are one of the most important water pollution sources [1,2,3,4]. These dispersed dye molecules block sunlight from reaching the lower depths of the water, reduce the dissolved oxygen level in the water, and thereby inhibit the growth and development of marine plants and animals [5,6,7]. Most seriously, most of these dyes are mutagenic and carcinogenic and cause severe damage to human life [8,9,10]. Therefore, it is necessary to remove the dyes from wastewater for environmental protection and remediation. Unfortunately, it is hard to treat organic dye contaminants because their structures are stable and biologically nondegradable [11,12].
Conventional treatment techniques to remove and decolorize organic dyes include adsorption, biodegradation, ultrafiltration, photochemical, and electrochemical methods [13]. Due to the constraints like the complex aromatic structure and recalcitrant nature of the dyes or the high operating cost, the above techniques are difficult to popularize in practical applications. Recently, photocatalytic degradation in the presence of semiconductor photocatalysts (e.g., typically, TiO2 and ZnO) and catalytic reduction of noble metal catalysts (e.g., typically, Ag and Au) have developed as alternatives to conventional water treatment methods for the treatment of organic dyes [14,15,16]. For instance, Li et al. synthesized TiO2 to catalyze and degrade methyl orange (MO) under UV light irradiation [17]. However, even though the photocatalytic method is cost effective, the photocatalytic efficiency is low and not effective enough for the dye degradation. Another disadvantage is that the electrons and the holes of the semiconductor photocatalysts can only be excited under ultraviolet light irradiation.
Most recently, the catalytic reduction method for the removal of dyes by using noble metal nanocatalysts has been regarded as a competitive technology because of the high efficiency and simplicity of its design and operation. It must be mentioned that the noble metal nanocatalysts encounter an obstacle because they are difficult to efficiently separate and recycle after the catalytic process by traditional methods such as centrifugation or filtration. To address this problem, many researchers have tried to immobilize the nanocatalysts onto magnetic supporting materials [18,19,20,21]. Zhang et al. synthesized Fe3O4/Ag composites to catalyze rhodamine B (RhB) [22]. Bimetallic FePt nanocrystals have high chemical stability and fast magnetic responsiveness [23]. Interestingly, research results have found that FePt nanocrystals themselves have catalytic degradation abilities [24,25]. Therefore, considerable efforts have been devoted to the design and preparation of FePt–Ag nanocrystals for the degradation of dyes.
In this work, with the aim of ensuring the ability of the proposed catalytic degradation system not only for a specific dye but also for other industrial dyes, methyl orange (MO) and rhodamine B (RhB) were selected as representative model dye pollutants. Polyethyleneimine dithiocarbamate (PEI-DTC) was employed as a polymer to prepare FePt–Ag nanocomposites by the seed deposition process. By adjusting the additive amount of silver colloids or the additive amount of FePt nanocrystals, we control the amount of Ag seeds deposited on the modified surfaces of FePt nanocrystals. In addition, in order to investigate the catalytic ability of FePt–Ag nanocomposites, we investigate the effects of the amount of Ag seeds on the catalytic capacities of the catalytic reduction of MO and RhB with the help of sodium borohydride (NaBH4). A schematic illustration of the synthesis and application of FePt–Ag nanocomposites is shown in Figure 1.
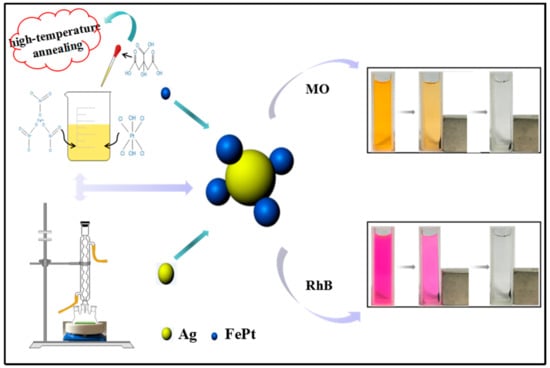
Figure 1.
Schematic illustration of the synthesis and application of FePt–Ag nanocomposites.
2. Experimental
2.1. Materials
The initial materials included iron (III) nitrate nonahydrate (Fe(NO3)3·9H2O), chloroplatinic acid hexahydrate (H2PtCl6·6H2O), citric acid monohydrate (C6H8O7·H2O), polyethyleneimine (PEI, branched, MW ≈ 25,000 g/mol), potassium hydroxide (KOH), carbon disulfide (CS2), silver nitrate (AgNO3), and trisodium citrate dihydrate (C6H5Na3O7·2H2O). All chemical reagents in this work were used as received without further purification.
2.2. Preparation of Silver Colloids
Noble metal nanocrystals have received both fundamental and practical attention owing to their potential applications in many fields such as ultrasensitive biosensing, imaging agents, photothermal therapy, and in particular catalysts because of their unique and tunable optical properties and high catalytic activities [26,27,28,29,30,31,32,33]. In the present work, the silver colloids were prepared based on the work by Yang et al. [34]. Briefly, 36 mg of AgNO3 was dissolved in 200 mL of deionized water under vigorous stirring at 90 °C. The solution was heated to near boiling after 15 min, and then 40 mg of 4 mL C6H5Na3O7·2H2O was injected into the solution drop by drop. The temperature of the solution was immediately reduced to 85 °C and the mixture was stirred continuously for another 40 min. Finally, the reaction mixture was allowed to cool down to room temperature and stored in the dark.
2.3. Preparation of Ag@PEI-DTC Solution
This process included two steps. The first step was the synthesis of PEI-DTC. Quantities of 50 mg of PEI and 325 mg of KOH were dissolved in 25 mL methanol. After the mixture solution was degassed, 347.5 μL of CS2 was added dropwise to the mixture solution; PEI-DTC aqueous solution was thus obtained. The second step was the synthesis of Ag@PEI-DTC solution. A quantity of 60mL of silver colloids was centrifuged and then dispersed in 20 mL of methanol. The obtained silver solution was added into the PEI-DTC solution drop by drop. After the reaction mixture was kept at room temperature for 1 h, the resultant product was collected by centrifugation (5000 rpm, 10 min) and subsequently washed with deionized water and ethanol several times. Finally, the obtained Ag@PEI-DTC seeds were stored in 4 mL of deionized water.
2.4. Preparation of FePt Nanocrystals
The FePt nanocrystals were synthesized using the sol-gel method. Details of the preparation have been published in our previous work [35]. In general, 234 mg of Fe(NO3)3·9H2O, 20 mL of H2PtCl6·6H2O, and 162 mg of C6H8O7·H2O were dissolved in 50 mL of deionized water with stirring to form the sol. The solution was polymerized to form a gel at 80 °C. FePt nanocrystals were successfully synthesized with precursors heat-treated in argon atmosphere for 2 h at 400 °C with a heating rate of 2 °C min−1.
2.5. Preparation of FePt–Ag@PEI-DTC Nanocomposites
Most recently, considerable efforts have been devoted to the design and preparation of multifunctional nanocomposites. Compared to the bulk materials, nanostructured materials possess large surface area while retaining their excellent electrical, optical, and magnetic properties [36,37,38,39,40,41,42,43]. A quantity of 10 mg of FePt nanocrystals was dispersed in 4 mL of deionized water and then added dropwise into the obtained Ag@PEI-DTC solution under vortex. FePt–Ag@PEI-DTC nanocomposites were shaken for 1 h and then washed with deionized water and ethanol three times; the result was named FePt–Ag 10 mg–60 mL. The experiment was carried out again under the same conditions as FePt–Ag 10 mg–60 mL, but the additive amount of silver colloids was adjusted to 90 and 120 mL, with the results named FePt–Ag 10 mg–90 mL and FePt–Ag 10 mg–120 mL, respectively. In addition, in order to study the effect of the additive amount of FePt nanocrystals on the amount of Ag seeds deposited on the modified surfaces of FePt nanocrystals, the volume of the silver colloids was kept the same as in FePt–Ag 10 mg–60 mL, but the mass of FePt nanocrystals was changed to 5 mg; the result was named FePt–Ag 5 mg–60 mL.
2.6. Application of FePt–Ag Nanocomposites for Catalytic Reduction of MO and RhB
The catalytic reduction of MO and RhB in the presence of NaBH4 was studied and monitored by a UV–vis spectroscopy to explore the catalytic activity of FePt–Ag 10 mg–120 mL. The detailed reaction process was as follows: 1 mg of FePt–Ag 10 mg–120 mL was added to 2 mL of MO or RhB aqueous solution (40 mg·L−1). Subsequently, 0.1 mL of NaBH4 aqueous solution (0.1 M, freshly prepared each time before use) was injected into the mixture solution. UV–vis spectra of the solution were recorded every 6 min. The first obtained data were designated as the values for the reaction time t = 0. The rate constant of the reduction process was determined by measuring the change in absorption as a function of time. It could be observed that the solution color changed gradually from colored to colorless. In order to investigate the reusability of the prepared samples, the FePt–Ag 10 mg–120 mL nanocatalysts were separated from the reaction solution using a magnet after the completion of the reduction process. The obtained magnetic nanocatalysts were washed with ethanol and deionized water three times and reused in the next reaction process. The same procedure for the catalytic reduction of each of MO and RhB was repeated six times.
2.7. Characterization Methods
Structure characterization of the as-synthesized samples was carried out on a Rigaku D/Max-2500 copper (Rigaku Corporation, Tokyo, Japan) rotating-anode X-ray diffractometer (XRD) using Cu Kα radiation (40 kV, 200 mA). Ultraviolet–visible spectroscopy (UV–vis) absorbance spectra were recorded on a Shimadzu UV 3600 spectrophotometer (Shimadzu Corporation, Tokyo, Japan) in the range of 350–800 nm. The detailed structure of the obtained samples was characterized using a JEOL JSM-7800F field emission scanning electron microscope (FESEM) (JEOL Ltd., Tokyo, Japan) at an acceleration voltage of 20 kV and a JEOL 2100 transmission electron microscope (TEM) operating at 200 kV. The X-ray photoelectron spectrum was measured with a Thermo Scientific ESCALAB 250Xi X-ray photoelectron spectroscope (XPS) (Thermo Fisher Scientific, Waltham, MA, USA). Magnetic properties were measured using a Quantum Design MPMS3 superconducting quantum interference device (SQUID) magnetometer (Quantum Design, Inc., San Diego, CA, USA).
3. Results and Discussion
3.1. Structure of FePt–Ag Nanocomposites
The crystal structure of pure FePt and FePt–Ag nanocomposites was investigated using XRD. Figure 2a,b present XRD patterns of the pure FePt nanocrystals and the FePt–Ag nanocomposites with different additive amounts of FePt nanocrystals (FePt–Ag 5 mg–60 mL and FePt–Ag 10 mg–60 mL), and of the FePt–Ag nanocomposites with different additive amounts of silver colloids (FePt–Ag 10 mg–60 mL, FePt–Ag 10 mg–90 mL, and FePt–Ag 10 mg–120 mL), respectively. As for the pure FePt nanocrystals, three primary peaks of (111), (200), and (220) around 39.8°, 46.4°, and 67.6° are observed and no other trace of impurities are detected, indicating that the as-synthesized FePt nanocrystals are pure disordered face-centered cubic phase [44]. After silver colloids are added to FePt nanocrystals, three additional diffraction peaks at about 38.3°, 44.5°, and 64.7° appear; these can be well attributed to the (111), (200), and (220) of Ag (Joint Committee on Powder Diffraction Standards, JCPDS card no. 04-0783) [45], respectively. With the decrease of the additive amount of FePt nanocrystals or the increase of the additive amount of silver colloids, the intensity of Ag diffraction peaks is obviously enhanced, but the position of Ag diffraction peaks does not change significantly. On the basis of these XRD results, we preliminarily conclude that the number of Ag seeds attached on the FePt surfaces can be adjusted by changing the additive amount of silver colloids or FePt nanocrystals.
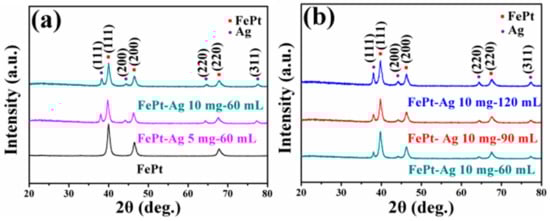
Figure 2.
XRD patterns of the pure FePt nanocrystals and the FePt–Ag nanocomposites with different additive quantities of FePt nanocrystals (FePt–Ag 5 mg–60 mL and FePt–Ag 10 mg–60 mL) (a), and of the FePt–Ag nanocomposites with different additive amounts of silver colloids (FePt–Ag 10 mg–60 mL, FePt–Ag 10 mg–90 mL, and FePt–Ag 10 mg–120 mL) (b).
UV–vis absorbance spectra were used to further confirm that the Ag seeds were firmly immobilized on the surfaces of FePt nanocrystals. Figure 3 shows the UV–vis absorbance spectra of silver colloids, FePt nanocrystals, and FePt–Ag 10 mg–120 mL nanocomposites. It is well established that silver colloids exhibit a plasmon absorption band in the visible region on account of the coherent excitation of the free electrons within the conduction band [46]. In general, the plasmon absorption band of silver nanocrystals is around 420 nm, while Fe and Pt nanocrystals have no specific absorption peak in this region [47]. As can be seen from Figure 3, the as-prepared silver colloids have a characteristic absorption peak at 430 nm, but no such absorption peak is observed for the FePt nanocrystals. An interesting finding is that the absorption peak of FePt–Ag 10 mg–120 mL shows a slight red shift from 430 to 435 nm compared with that of the silver colloids, which might be attributed to the polarizability of the metallic silver owing to the formation of the FePt–Ag nanocomposites [48].
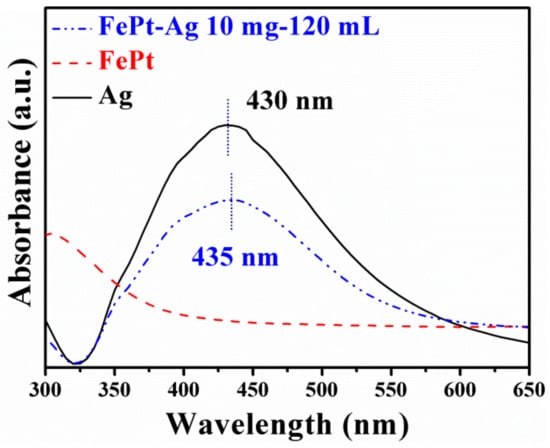
Figure 3.
UV–vis absorbance spectra of silver colloids (black curve line), pure FePt nanocrystals (red dotted line), and FePt–Ag 10 mg–120 mL nanocomposites (blue dotted line).
3.2. Morphology of FePt–Ag Nanocomposites
The morphology and detailed structure of the samples were investigated by SEM and TEM. In particular, the TEM technique is a direct and important methodology for structure analysis in the materials engineering technologies [49,50,51,52,53,54,55,56,57,58,59,60,61]. Figure 4 shows typical low-magnification TEM images of pure FePt nanocrystals, pure silver colloids, and FePt–Ag 5 mg–60 mL and FePt–Ag 10 mg–60 mL nanocomposites. The shapes of both the pure FePt nanocrystals and silver colloids are nearly spherical, and their average particle sizes are 11 ± 1.5 and 41 ± 2 nm, respectively. The corresponding particle size histogram of the pure FePt nanocrystals indicates that FePt nanocrystals have a narrow particle size distribution (Figure S1). The inset of Figure 4a is the corresponding high-resolution TEM (HRTEM) image, which shows the characteristic spacings of 0.223 nm for the (111) lattice planes of face-centered cubic FePt. From the TEM images of FePt–Ag 5 mg–60 mL and FePt–Ag 10 mg–60 mL, Ag seeds are found to be coherent with FePt nanocrystals owing to the effect of the two chelating sulfur groups provided by the PEI-DTC polymers. It is commonly known that the brightness in the TEM image reflects the ability of the transmitted electrons from the different substances and is proportional to the atomic number of the substances [62]. Unfortunately, because both FePt and Ag nanocrystals have high atomic numbers, it is hard to distinguish the two nanomaterials from TEM images. TEM images of the FePt nanocrystals with different addition quantities of the silver colloids (FePt–Ag 10 mg–60 mL, FePt–Ag 10 mg–90 mL, and FePt–Ag 10 mg–120 mL) are exhibited in Figure 5. In order to investigate the influence of the additive amount of silver colloids on the number of Ag seeds attached to the FePt surfaces, energy-dispersive spectroscopy (EDS) was performed to determine the composition of the nanostructures, as shown in Figure S2. The EDS results confirm that FePt–Ag nanocomposites are composed of Fe, Pt, and Ag, and that the amount of Ag seeds adhered to the surfaces of FePt nanocrystals increases with the increase in the additive amount of silver colloids. This is consistent with the observation from XRD results. The Si peak could be assigned to the Si substrates for loading the samples. HRTEM images show that the interplanar spacings of 0.223 and 0.235 nm match well with those of the (111) planes of FePt and Ag, respectively. The selected area electron diffraction (SAED) pattern of FePt–Ag 10 mg–120 mL is presented in the inset of Figure 5d. The bright and discrete diffraction spots can be assigned to the diffractions of either FePt nanocrystals or Ag seeds. HRTEM and SAED results further testify the coexistence of FePt and Ag.
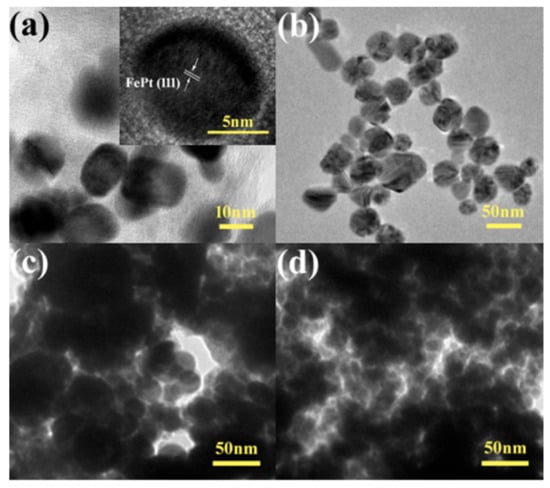
Figure 4.
TEM images of the pure FePt nanocrystals with high-resolution TEM (HRTEM) image (inset) (a), pure silver colloids (b), and FePt–Ag 5 mg–60 mL (c) and FePt–Ag 10 mg–60 mL nanocomposites (d).
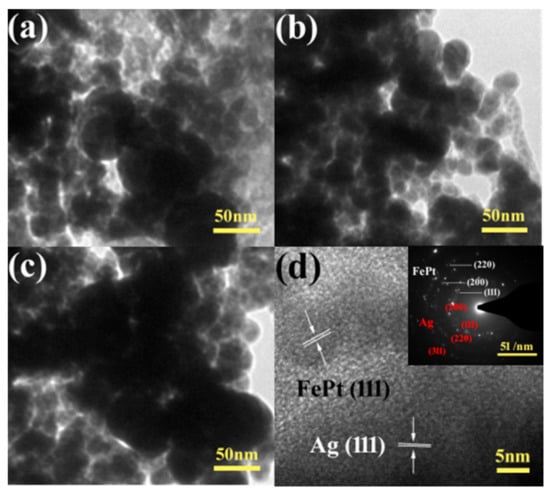
Figure 5.
TEM images of FePt–Ag 10 mg–60 mL (a), FePt–Ag 10 mg–90 mL (b), and FePt–Ag 10 mg–120 mL (c); (d) shows the corresponding selected area electron diffraction (SAED) pattern (inset) and HRTEM image of (c).
3.3. XPS Studies of FePt–Ag Nanocomposites
XPS measurements were carried out to characterize the chemical state of Fe, Pt, and Ag elements. High-resolution scans of Fe 2p, Pt 4f, and Ag 3d for pure FePt nanocrystals and for FePt–Ag 10 mg–60 mL, FePt–Ag 10 mg–90 mL, and FePt–Ag 10 mg–120 mL nanocomposites are shown in Figure 6. As for the pure FePt nanocrystals, the Fe 2p spectrum shows two contributions—2p3/2 and 2p1/2—resulting from the spin–orbit splitting, respectively located at 710.6 and 724.1 eV. The XPS spectrum of Pt exhibits double peaks with binding energies of 71.1 and 74.2 eV, corresponding to the standard peaks of pure Pt 4f7/2 and Pt 4f5/2 [63,64]. The binding energy of FePt–Ag 10 mg–60 mL is located at 367.4 and 373.4 eV, which can be assigned to Ag 3d5/2 and Ag 3d3/2, and matches well with the standard XPS spectrum of metallic Ag [53,54]. It should be pointed out that the intensity of Fe 2p and Pt 4f decreases and the intensity of Ag 3d increases with the increase of the additive amount of the silver colloids, since the intensity of XPS spectra is proportional to the atomic concentration [65]. Another interesting point is that the positions of Fe 2p and Pt 4f peaks shift toward the lower binding energy side, and the positions of Ag 3d peaks shift toward the higher binding energy side. The shift of the binding energy provides evidence of an electronic exchange interaction between FePt and Ag [66]. Furthermore, in addition to Fe, Pt, Ag, O, and C peaks, no impurities are observed from the XPS survey scan spectra in Figure S3.
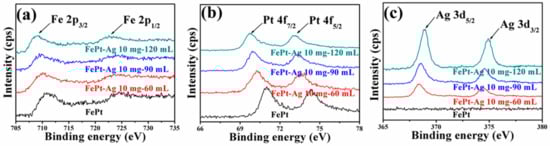
Figure 6.
High-resolution XPS scans of Fe 2p (a), Pt 4f (b). and Ag 3d (c) for pure FePt nanocrystals and for FePt–Ag 10 mg–60 mL, FePt–Ag 10 mg–90 mL, and FePt–Ag 10 mg–120 mL nanocomposites.
3.4. Magnetism of FePt–Ag Nanocomposites
The magnetic properties of the pure FePt nanocrystals and the FePt–Ag nanocomposites were characterized by SQUID at room temperature. Figure 7 shows the magnetic hysteresis (M-H) loops of the pure FePt nanocrystals and the FePt–Ag nanocomposites. The magnetic saturation (Ms) of the pure FePt nanocrystals is 4.8 emu∙g−1. It is obvious that the Ms value decreases with the decrease of the addition quantities of FePt nanocrystals or the increase of the additive amount of the silver colloids. On the basis of the previous XRD, TEM, EDS, and XPS results, both the decrease of the addition quantities of FePt nanocrystals and the increase of the additive amount of the silver colloids may lead to the increase of Ag seeds in FePt–Ag nanocomposites. Therefore, the decrease in Ms values may be ascribed to the increase in weight ratio of Ag seeds to FePt nanocrystals [67] or the diamagnetic contribution of the intact Ag seeds [68]. It must also be mentioned that although Ms values decrease due to the introduction of Ag seeds, the FePt–Ag nanocomposites still have strong magnetic responsivity and can be easily magnetically separated from aqueous solution by using an external magnet (as shown in Figure S4), which is beneficial to their economic applications and reuse.
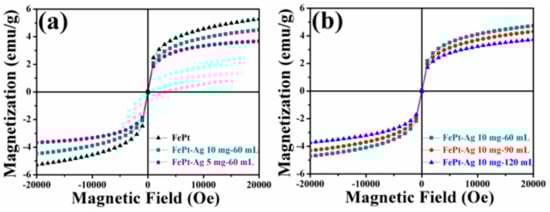
Figure 7.
Magnetic hysteresis (M-H) loops of the pure FePt nanocrystals and the FePt–Ag nanocomposites with different additive quantities of FePt nanocrystals (FePt–Ag 5 mg–60 mL and FePt–Ag 10 mg–60 mL) (a), and the FePt–Ag nanocomposites with different additive amounts of silver colloids (FePt–Ag 10 mg–60 mL, FePt–Ag 10 mg–90 mL, and FePt–Ag 10 mg–120 mL) (b).
The temperature-dependent magnetization (M-T) of pure FePt and FePt–Ag 10 mg–120 mL was measured under zero-field-cooled (ZFC) and 1000 Oe field-cooled (FC) conditions (Figure S5). The shape of ZFC-FC curves for the two samples is the typical form for weakly dipole–dipole interacting systems. The magnetization of FC curves monotonically increases with the decrease of temperature. The ZFC curves reach maximum at 86 and 81 K for the pure FePt and FePt–Ag 10 mg–120 mL, respectively, corresponding to the blocking temperature (TB). In general, the TB value is closely related to the nanocrystal size and the magnetic interaction between the nanocrystals [69]. It is reasonable to exclude the contribution of the FePt and Ag particle size to the variation of TB value. Thus, the Ag seeds in the FePt–Ag nanocomposites weaken the magnetic dipole–dipole interaction between adjacent FePt nanocrystals, and result in decrease of the TB value [70].
3.5. Catalytic Studies of FePt–Ag Nanocomposites
Previous works indicated that Ag nanocrystals played significant roles in the catalytic reduction of dye pollutants [71,72]. In order to study the catalytic performance of FePt–Ag nanocomposites on organic dyes, MO and RhB were selected as model dye pollutants. Figure 8 shows UV–vis absorption spectra of MO aqueous solution over time catalyzed by the different FePt–Ag nanocomposites (FePt–Ag 10 mg–60 mL, FePt–Ag 10 mg–90 mL and FePt–Ag 10 mg–120 mL) in the presence of NaBH4. As can be seen, the characteristic absorption peak of MO at 465 nm disappears within 30, 24, and 18 min of reaction time, respectively. This result indicates that the catalytic reduction and the complete removal of MO have been successfully achieved due to the inclusion of the FePt–Ag nanocomposites, which can be confirmed by the decoloration of MO in the inset of Figure 1. The corresponding ln(C/C0) versus reaction time plots are presented in Figure 8b,d,f. The concentration of MO at reaction time t is denoted by C, and the initial concentration of MO at t = 0 is regarded as C0. The concentration of NaBH4 can be considered as a constant during the reaction period, because it is much more excessive relative to that of MO. The ratio of C to C0 is obtained from the relative intensity of respective absorbance (At/A0) at 465 nm. The linear relationship of ln(C/C0) versus reaction time shows that the reduction of MO by the FePt–Ag nanocomposites matches well with pseudo-first-order kinetics [73]. The rate constant is determined by a linear plot of ln(C/C0) versus reaction time. The correlation coefficients R2 of the two samples are higher than 0.98. The rate constants of MO are 0.14 min−1, 0.18 min−1, and 0.24 min−1 using FePt–Ag 10 mg–60 mL, FePt–Ag 10 mg–90 mL, and FePt–Ag 10 mg–120 mL as nanocatalysts, respectively. It is obvious that the rate constants for MO reduction increase with the increase of the additive amount of silver colloids. NaBH4 acts as the electron donor (BH4− ions) and hydrogen supplier in this reaction [74]. When the FePt–Ag nanocomposites are added into the above reaction, the BH4− ions and the MO molecules are absorbed on the surfaces of the FePt–Ag nanocomposites. The FePt–Ag nanocomposites can transfer the electrons from the donor BH4− to the acceptor MO molecules and the BH4− ions also transfer surface hydrogen to MO molecules. It is reasonable that if the noble metal nanomaterial loading is increased, the mass fraction of the noble metal nanomaterials is higher in the final samples, and, thus, a better catalytic performance should be accomplished [75].
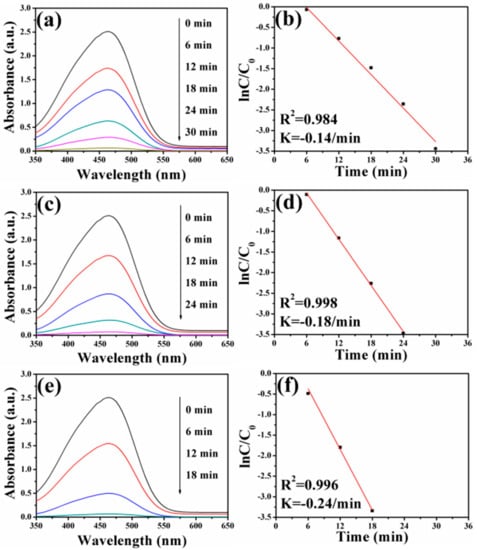
Figure 8.
UV–vis absorption spectra of MO aqueous solution after reduction catalyzed by FePt–Ag 10 mg–60 mL (a), FePt–Ag 10 mg–90 mL (c), and FePt–Ag 10 mg–120 mL (e). (b,d,f) show the corresponding ln(C/C0) versus reaction time plots.
In the case of RhB, a similar decolorization from pink to transparent is also observed in the insets of Figure 1. The changes in UV–vis absorption spectra of RhB aqueous solution over time catalyzed by the different FePt–Ag nanocomposites are shown in Figure 9. The intensity of the maximum absorption peak at 555 nm for RhB gradually decreases. In addition, an identical trend that the rate constants for RhB reduction increase when increasing the additive amount of silver colloids is found. It indicates that the catalytic ability of as-prepared FePt–Ag nanocomposites is not only efficient to a specific dye but also to different industrial dyes. Notably, as can be seen from Figures S6 and S7, no appreciable changes of the UV–vis absorption spectra for MO and RhB are observed when FePt nanocrystals or NaBH4 only are chosen as the catalysts, which suggests that MO and RhB could not be effectively reduced in the presence of FePt or NaBH4 only. Therefore, the catalytic reaction ability against dye pollutants mainly depends on the presence and the number of Ag seeds in the catalysts.
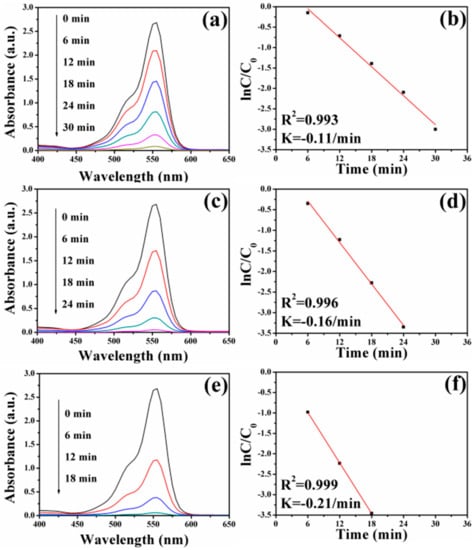
Figure 9.
UV–vis absorption spectra of RhB aqueous solution after reduction catalyzed by FePt–Ag 10 mg–60 mL (a), FePt–Ag 10 mg–90 mL (c), and FePt–Ag 10 mg–120 mL (e). (b,d,f) show the corresponding ln(C/C0) versus reaction time plots.
In order to investigate the recyclability of the FePt–Ag nanocomposites, FePt–Ag 10 mg–120 mL was selected to be separated magnetically and reused after catalytic reduction. As shown in Figure 10, FePt–Ag 10 mg–120 mL can be successfully recycled and reused against the two dye pollutants for at least six reaction runs with stable efficiency of around 100%, which indicates that the FePt–Ag nanocomposites have excellent reusability and can serve as recoverable and efficient catalysts for dye pollutants.
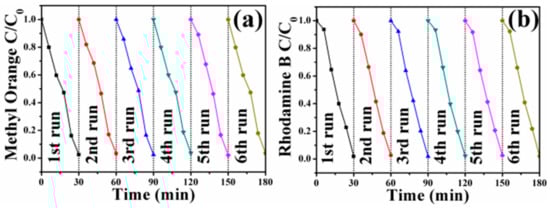
Figure 10.
Six cycles of the removal of MO (a) and RhB (b) with FePt–Ag 10 mg–120 mL.
4. Conclusions
In summary, we have demonstrated the fabrication of pure FePt nanocrystals. Then, FePt–Ag nanocomposites were successfully synthesized through a novel seed deposition process. XRD, TEM, and SEM results indicate that the additive amount of silver colloids and FePt nanocrystals is essential to controlling the number of Ag seeds deposited on the PEI-DTC-modified surfaces of FePt nanocrystals. The increase of the number of Ag seeds attached to the FePt nanocrystals surfaces results in the shifts of Fe 2p peaks and Pt 4f peaks toward the lower binding energy side and shifts of Ag 3d peaks toward the higher binding energy side. Although the Ms value decreases with the increase of the amount of Ag seeds attached on the FePt surfaces, the samples still have strong magnetic responsivity and can be easily separated from aqueous solution by applying a magnetic field. The pseudo-first-order kinetics are used to calculate the rate constant of MO and RhB. The catalytic reaction ability of FePt–Ag nanocomposites remains almost consistent even after at least six cycles, demonstrating that the FePt–Ag nanocomposites can serve as recyclable nanocatalysts for organic dyes. This system could potentially be applied as highly efficient nanocatalysts to different types of organic dyes.
Supplementary Materials
Supplementary materials can be found at http://www.mdpi.com/2079-4991/8/5/329/s1. Figure S1: Particle size histogram of the pure FePt nanocrystal. Inset shows the corresponding TEM images of the pure FePt nanocrystals. Figure S2: Energy-dispersive spectroscopy (EDS) spectra of FePt (a), FePt–Ag 10 mg–60 mL (b), FePt–Ag 10 mg–90 mL (c), and FePt–Ag 10 mg–120 mL (d). Figure S3: XPS survey scan spectra of pure FePt nanocrystals and FePt–Ag 10 mg–120 mL nanocomposites. Figure S4: Photographs of the colloidal silver solution, FePt nanocrystals dispersed in deionized water, and FePt–Ag nanocomposites dispersed in deionized water and after gentle shaking. Figure S5: ZFC and FC curves of pure FePt nanocrystals and FePt–Ag 10 mg–120 mL nanocomposites under an applied field of 1000 Oe. Figure S6: UV–vis absorption spectra of MO aqueous solution (a) and RhB aqueous solution (b) after reduction catalyzed by pure FePt nanocrystals. Figure S7: UV–vis absorption spectra of MO (a) and RhB (b) reduced by NaBH4 only.
Author Contributions
Y.L. conceived the experiments and wrote the manuscript; Y.Z., Q.K. and Y.C. carried out the experiments and tested the data; Y.S. and D.W. assisted with magnetic analyses; D.H., Y.Z. polished the whole manuscript; Z.L. and L.C. assisted with the catalytic analyses; J.Y. and S.G.X. helped perform the analyses with constructive theoretical discussions.
Funding
This research was funded by the National Natural Science Foundation of China (Grant Numbers 21676115, 51609100, 61705020, 61675090 and 61575080), Program for the development of Science and Technology of Jilin province (Grant Numbers 20160101287JC and 20150519024JH), Guangdong Province Science and Technology Projects (Grant Numbers 2015A030310342 and 2015A010103004), and Technology of Education Department of Jilin Province (Grant Number JJKH20170374KJ).
Conflicts of Interest
The authors declare no conflict of interest.
References
- Xie, Y.J.; Yan, B.; Xu, H.L.; Chen, J.; Liu, Q.X.; Deng, Y.H.; Zeng, H.B. Highly Regenerable Mussel-Inspired Fe3O4@Polydopamine-Ag Core-Shell Microspheres as Catalyst and Adsorbent for Methylene Blue Removal. ACS Appl. Mater. Interfaces 2014, 6, 8845–8852. [Google Scholar] [CrossRef] [PubMed]
- Deka, P.; Hazarika, A.; Dekaa, R.C.; Bharali, P. Influence of CuO morphology on the enhanced catalytic degradation of methylene blue and methyl orange. RSC Adv. 2016, 6, 95292–95306. [Google Scholar] [CrossRef]
- Xu, D.; Cheng, F.; Lu, Q.; Dai, P. Microwave Enhanced Catalytic Degradation of Methyl Orange inAqueous Solution over CuO/CeO2 Catalyst in the Absence andPresence of H2O2. Ind. Eng. Chem. Res. 2014, 53, 2625–2632. [Google Scholar] [CrossRef]
- Amir, M.D.; Kurtan, U.; Baykal, A. Rapid color degradation of organic dyes by Fe3O4@His@Ag recyclable magnetic nanocatalyst. J. Ind. Eng. Chem. 2015, 27, 347–353. [Google Scholar] [CrossRef]
- Saikia, P.; Miah, A.T.; Das, P.P. Highly efficient catalytic reductive degradation of various organic dyes by Au/CeO2-TiO2 nano-hybrid. J. Chem. Sci. 2017, 129, 81–93. [Google Scholar] [CrossRef]
- Soto-Quintero, A.; Romo-Uribe, Á.; Bermúdez-Morales, V.H.; Quijada-Garrido, I.; Guarrotxena, N. 3D-Hydrogel Based Polymeric Nanoreactors for Silver Nano-Antimicrobial Composites Generation. Nanomaterials 2017, 7, 209. [Google Scholar] [CrossRef] [PubMed]
- Alshehri, S.M.; Almuqati, T.; Almuqati, N.; Al-Farraj, E.; Alhokbany, N.; Ahamad, T. Chitosan based polymer matrix with silver nanoparticles decorated multiwalled carbon nanotubes for catalytic reduction of 4-nitrophenol. Carbohydr. Polym. 2016, 151, 135–143. [Google Scholar] [CrossRef] [PubMed]
- Li, X.G.; He, Y.Y.; Sui, H.; He, L. One-Step Fabrication of Dual Responsive Lignin Coated Fe3O4 Nanoparticles for Efficient Removal of Cationic and Anionic Dyes. Nanomaterials 2018, 8, 162. [Google Scholar] [CrossRef] [PubMed]
- Nassar, A.M.; Abo, Z.E.F.; Elseman, A.M.; Alotaibi, N.F. A novel heterometallic compound for design and study of electrical properties of silver nanoparticles-decorated lead compounds. New J. Chem. 2018, 42, 1387–1395. [Google Scholar] [CrossRef]
- Ray, C.; Pal, T. Recent advances of metal-metal oxide nanocomposites and their tailored nanostructures in numerous catalytic applications. J. Mater Chem. A 2107, 5, 9465–9487. [Google Scholar] [CrossRef]
- Liu, Y.; Kou, Q.W.; Wang, D.D.; Chen, L.; Sun, Y.T.; Lu, Z.Y.; Zhang, Y.Y.; Wang, Y.X.; Yang, J.H.; Xing, S. Rational synthesis and tailored optical and magnetic Characteristics of Fe3O4-Au composite nanoparticles. J. Mater. Sci. 2017, 52, 10163–10174. [Google Scholar] [CrossRef]
- Gong, R.; Ye, J.J.; Dai, W.; Yan, X.Y.; Hu, J.; Hu, X.; Li, S.; Huang, H. Adsorptive Removal of Methyl Orange and Methylene Blue from Aqueous Solution with Finger-Citron-Residue-Based Activated Carbon. Ind. Eng. Chem. Res. 2013, 52, 14297–14303. [Google Scholar] [CrossRef]
- Vi, T.T.T.; Kumar, S.R.; Rout, B.; Liu, C.-H.; Wong, C.-B.; Chang, C.-W.; Chen, C.-H.; Chen, D.W.; Lue, S.J.J. The Preparation of Graphene Oxide-Silver Nanocomposites: The Effect of Silver Loads on Gram-Positive and Gram-Negative Antibacterial Activities. Nanomaterials 2018, 8, 163. [Google Scholar] [CrossRef] [PubMed]
- Du, Q.; Tan, L.; Li, B.; Liu, T.; Ren, J.; Huang, Z.; Tang, F.; Meng, X. One-pot gradient solvothermal synthesis of the Ag/Au-Fe3O4 composite nanoparticles and their applications. RSC Adv. 2014, 4, 56057–56062. [Google Scholar] [CrossRef]
- Jin, C.J.; Han, J.; Chu, F.Y.; Wang, X.X.; Guo, R. Fe3O4@PANI Hybrid Shell as a Multifunctional Support for Au Nanocatalysts with a Remarkably Improved Catalytic Performance. Langmuir 2017, 33, 4520–4527. [Google Scholar] [CrossRef] [PubMed]
- Munshi, A.M.; Shi, M.; Thomas, S.P.; Saunders, M.; Spackman, M.A.; Iyer, K.S.; Smith, N.M. Magnetically recoverable Fe3O4@Au-coated nanoscale catalysts for the A3-coupling reaction. Dalton Trans. 2017, 46, 5133–5137. [Google Scholar] [CrossRef] [PubMed]
- Li, W.J.; Li, D.Z.; Lin, Y.M.; Wang, P.X.; Chen, W.; Fu, X.Z.; Shao, Y. Evidence for the Active Species Involved in the Photodegradation Process of Methyl Orange on TiO2. J. Phys. Chem. C 2012, 116, 3552–3560. [Google Scholar] [CrossRef]
- Xuan, S.H.; Wang, Y.-X.J.; Yu, J.C.; Leung, K.C.-F. Preparation, Characterization, and Catalytic Activity of Core/Shell Fe3O4@Polyaniline@Au Nanocomposites. Langmuir 2009, 25, 11835–11843. [Google Scholar] [CrossRef] [PubMed]
- Wang, Y.; Gai, L.G.; Ma, W.Y.; Jiang, H.H.; Peng, X.Q.; Zhao, L.C. Ultrasound-Assisted Catalytic Degradation of Methyl Orange with Fe3O4/Polyaniline in Near Neutral Solution. Ind. Eng. Chem. Res. 2015, 54, 2279–2289. [Google Scholar] [CrossRef]
- Xiong, R.; Lu, C.; Wang, Y.; Zhou, Z.; Zhang, X. Nanofibrillated cellulose as the support and reductant for the facile synthesis of Fe3O4/Ag nanocomposites with catalytic and antibacterial activity. J. Mater. Chem. A 2013, 1, 14910–14918. [Google Scholar] [CrossRef]
- Subhan, M.A.A.; Saha, P.C.; Rahman, M.M.; Ahmed, J.; Asirib, A.M. Mohammad Al-Mamun, Fabrication of a 2,4-dinitrophenol sensor based on Fe3O4@Ag@Ni nanomaterials and studies on their antibacterial properties. New J. Chem. 2018, 42, 872–881. [Google Scholar] [CrossRef]
- Zhang, X.P.; Jiang, W.Q.; Gong, X.L.; Zhang, Z. Sonochemical synthesis and characterization of magnetic separable Fe3O4/Ag composites and its catalytic properties. J. Alloys Compd. 2010, 508, 400–405. [Google Scholar] [CrossRef]
- Liu, Y.; Jiang, Y.H.; Zhang, X.L.; Wang, Y.X.; Zhang, Y.J.; Liu, H.L.; Zhai, H.J.; Liu, Y.Q.; Yang, J.H.; Yan, Y.S. Effects of annealing temperature on the structure and magnetic properties of the L10-FePt nanoparticles synthesized by the modified sol-gel method. Powder Technol. 2013, 239, 217–222. [Google Scholar] [CrossRef]
- Li, Q.; Wu, L.H.; Wu, G.; Su, D.; Lv, H.F.; Zhang, S.; Zhu, W.L.; Casimir, A.; Zhu, H.Y.; Mendoza-Garcia, A.; et al. New Approach to Fully Ordered fct-FePt Nanoparticles for Much Enhanced Electrocatalysis in Acid. Nano Lett. 2015, 15, 2468–2474. [Google Scholar] [CrossRef] [PubMed]
- Hsieh, S.; Lin, P.Y. FePt nanoparticles as heterogeneous Fenton-like catalysts for hydrogen peroxide decomposition and the decolorization of methylene blue. J. Nanopart. Res. 2012, 14, 1–10. [Google Scholar] [CrossRef]
- Wang, S.Q.; Xu, L.-P.; Zhang, X.J. Ultrasensitive Electrochemical Biosensor Based on Noble Metal Nanomaterials. Sci. Adv. Mater. 2015, 7, 2084–2102. [Google Scholar] [CrossRef]
- Svedendahl, M.; Verre, R.; Kall, M. Refractometric biosensing based on optical phase flips in sparse and short-range-ordered nanoplasmonic layers. Light Sci. Appl. 2014, 3, e220. [Google Scholar] [CrossRef]
- Zhu, Z.D.; Bai, B.F.; You, O.B.; Li, Q.Q.; Fan, S.S. Fano resonance boosted cascaded optical field enhancement in a plasmonic nanoparticle-in-cavity nanoantenna array and its SERS application. Light Sci. Appl. 2015, 4, e296. [Google Scholar] [CrossRef]
- Wang, P.; Wang, Y.P.; Tong, L.M. Functionalized polymer nanofibers: A versatile platform for manipulating light at the nanoscale. Light Sci. Appl. 2013, 2, e102. [Google Scholar] [CrossRef]
- Hunt, S.T.; Milina, M.; Alba-Rubio, A.C.; Hendon, C.H.; Dumesic, J.A.; Román-Leshkov, Y. Self-assembly of noble metal monolayers on transition metal carbide nanoparticle catalysts. Science 2016, 352, 974–978. [Google Scholar] [CrossRef] [PubMed]
- Karabchevsky, A.; Mosayyebi, A.; Kavokin, A.V. Tuning the chemiluminescence of a luminol flow using plasmonic nanoparticles. Light Sci. Appl. 2016, 5, e16164. [Google Scholar] [CrossRef]
- Linnenbank, H.; Grynko, Y.; Forstner, J.; Linden, S. Second harmonic generation spectroscopy on hybrid plasmonic/dielectric nanoantennas. Light Sci. Appl. 2016, 5, e16013. [Google Scholar] [CrossRef]
- Blum, O.; Shaked, N.T. Prediction of photothermal phase signatures from arbitrary plasmonic nanoparticles and experimental verification. Light Sci. Appl. 2015, 4, e322. [Google Scholar] [CrossRef]
- Yang, J.; Lee, J.Y.; Too, H.P. Core-Shell Ag-Au Nanoparticles from Replacement Reaction in Organic Medium. J. Phys. Chem. B 2015, 109, 19208–19212. [Google Scholar] [CrossRef] [PubMed]
- Yang, J.H.; Jiang, Y.H.; Liu, Y.; Zhang, X.L.; Wang, Y.X.; Zhang, Y.J.; Wang, J.; Li, W.; Cheng, X. Effects of SiO2 content on the structure and magnetic properties of L10-FePt nanoparticles synthesized by the sol-gel method. Mater. Lett. 2013, 91, 348–351. [Google Scholar] [CrossRef]
- Xing, G.Z.; Wang, Y.; Wong, J.I.; Shi, Y.M.; Huang, Z.X.; Li, S.; Yang, H.Y. Hybrid CuO/SnO2 nanocomposites: Towards cost-effective and high performance binder free lithium ion batteries anode materials. Appl. Phys. Lett. 2014, 105, 143905–143912. [Google Scholar] [CrossRef]
- Sun, J.H.; Sui, H.D.; Wang, Z.-W.; Wang, K.; Yan, Y.; Lu, Q.; Li, L. Preparation of europium-doped nano-TiO2 transparent photocatalyst emulsion and photocatalytic performance. Chin. Opt. 2017, 10, 760–767. [Google Scholar] [CrossRef]
- Xing, G.Z.; Wang, D.D.; Cheng, C.-J.; He, M.; Li, S.; Wu, T. Emergent ferromagnetism in ZnO/Al2O3 core-shell nanowires: Towards oxide spinterfaces. Appl. Phys. Lett. 2013, 103, 022402–022407. [Google Scholar] [CrossRef]
- Li, X.; Ji, M.; Wang, H.; Tu, G.; Wan, X.; Liu, J.; Liu, J.; Xu, M.; Zhang, J. Research progress of near-infrared photothermal conversion nanocrystals. Chin. Opt. 2017, 10, 541–554. [Google Scholar] [CrossRef]
- Sun, Y.; Li, Q. Research of zinc oxide quantum dot light-emitting diodes based on preparation of chemical solutions. J. Liq. Cryst. Disp. 2016, 31, 635–642. [Google Scholar] [CrossRef]
- Chen, X.Y.; Tian, Z. Recent progress in terahertz dynamic modulation based on graphene. Chin. Opt. 2017, 10, 86–97. [Google Scholar] [CrossRef]
- Tong, L.; Zhang, M.L.; Wang, F.; Zhang, D.M.; Wang, G.P. Fabrication of optical waveguide amplifiers based on bonding-type NaYF4: Er nanoparticles-polymer. Chin. Opt. 2017, 10, 219–225. [Google Scholar] [CrossRef]
- Psilodimitrakopoulos, S.; Mouchliadis, L.; Paradisanos, I.; Lemonis, A.; Kioseoglou, G.; Stratakis, E. Ultrahigh-resolution nonlinear optical imaging of the armchair orientation in 2D transition metal dichalcogenides. Light Sci. Appl. 2018, 7, e18005. [Google Scholar] [CrossRef]
- Zhang, S.; Zhang, X.; Jiang, G.M.; Zhu, H.Y.; Guo, S.J.; Su, D.; Lu, G.; Sun, S.H. Tuning nanoparticle structure and surface strain for catalysis optimization. J. Am. Chem. Soc. 2014, 136, 7734–7739. [Google Scholar] [CrossRef] [PubMed]
- Zhao, Y.; Tao, C.; Xiao, G.; Wei, G.; Li, L.; Liu, C.; Su, H. Controlled synthesis and photocatalysis of sea urchin-like Fe3O4@TiO2@Ag nanocomposites. Nanoscale 2016, 8, 5313–5326. [Google Scholar] [CrossRef] [PubMed]
- Lu, C.Y.; Puig, T.; Obradors, X.; Ricart, S.; Ros, J. Ultra-fast microwave-assisted reverse microemulsion synthesis of Fe3O4@SiO2 core-shell nanoparticles as a highly recyclable silver nanoparticle catalytic platform in the reduction of 4-nitroaniline. RSC Adv. 2016, 6, 88762–88769. [Google Scholar] [CrossRef]
- Huo, J.; Zeng, H. Silver nanoparticles-sensitized cobalt complex for highly-efficient photocatalytic activity. Appl. Catal. B Environ. 2016, 199, 342–349. [Google Scholar] [CrossRef]
- Lu, L.Y.; Wang, D.; Xu, X.G.; Wang, H.C.; Miao, J.; Jiang, Y. Low temperature magnetic hardening in self-assembled FePt/Ag core-shell nanoparticles. Mater. Chem. Phys. 2011, 129, 995–999. [Google Scholar] [CrossRef]
- Hu, R.; Zheng, M.X.; Wu, J.C.; Li, C.; Shen, D.Q.; Yang, D.; Li, L.; Ge, M.F.; Chang, Z.M.; Dong, W.F. Core-Shell Magnetic Gold Nanoparticles for Magnetic Field-Enhanced Radio-Photothermal Therapy in Cervical Cancer. Nanomaterials 2017, 7, 111. [Google Scholar] [CrossRef] [PubMed]
- Andreou, D.; Iordanidou, D.; Tamiolakis, I.; Armatas, G.S.; Lykakis, I.N. Reduction of Nitroarenes into Aryl Amines and N-Aryl hydroxylamines via Activation of NaBH4 and Ammonia-Borane Complexes by Ag/TiO2 Catalyst. Nanomaterials 2016, 6, 54. [Google Scholar] [CrossRef] [PubMed]
- Li, L.; Guo, W.; Yan, Y.; Lee, S.; Wang, T. Label-free super-resolution imaging of adenoviruses by submerged microsphere optical nanoscopy. Light Sci. Appl. 2013, 2, e104. [Google Scholar] [CrossRef]
- Wang, D.D.; Wang, W.L.; Huang, M.Y.; Lek, A.; Lam, J.; Mai, Z.H. Failure Analysis Depa Failure mechanism analysis and process improvement on time-dependent dielectric breakdown of Cu/ultra-low-k dielectric based on complementary Raman and FTIR spectroscopy study. AIP Adv. 2014, 4, 077124–077134. [Google Scholar] [CrossRef]
- Yu, D.H.; Yu, X.; Wang, C.; Liu, X.C.; Xing, Y. Synthesis of Natural Cellulose-Templated TiO2/Ag Nanosponge Composites and Photocatalytic Properties. ACS Appl. Mater. Interfaces 2012, 4, 2781–2787. [Google Scholar] [CrossRef] [PubMed]
- Xu, L.M.; Zhang, D.D.; Ming, L.F.; Jiao, Y.C.; Chen, F. Synergistic effect of interfacial lattice Ag+ and Ag0 clusters in enhancing the photocatalytic performance of TiO2. Phys. Chem. Chem. Phys. 2014, 16, 19358–19367. [Google Scholar] [CrossRef] [PubMed]
- Wang, D.D.; Xing, G.Z.; Yan, F.; Yan, Y.S.; Li, S. Ferromagnetic (Mn, N)-codoped ZnO nanopillars array: Experimental and computational insights. Appl. Phys. Lett. 2014, 104, 022412. [Google Scholar] [CrossRef]
- Pincella, F.; Isozaki, K.; Miki, K. A visible light-driven plasmonic photocatalyst. Light Sci. Appl. 2014, 3, 110–118. [Google Scholar] [CrossRef]
- Xing, G.Z.; Fang, X.S.; Zhang, Z.; Wang, D.D.; Huang, X.; Guo, J.; Liao, L.; Zheng, Z.; Xu, H.R.; Yu, T. Ultrathin single-crystal ZnO nanobelts: Ag-catalyzed growth and field emission property. Nanotechnology 2010, 21, 255701–255710. [Google Scholar] [CrossRef] [PubMed]
- Wang, B.; Qu, S. Absorption spectra and near-electric field enhancement effects of Au- and Ag-Fe3O4 dimers. Appl. Surf. Sci. 2014, 292, 1002–1008. [Google Scholar] [CrossRef]
- Zhang, X.; Song, L.; Cai, L.; Tian, X.; Zhang, Q.; Qi, X.; Zhou, W.; Zhang, N.; Yang, F.; Fan, Q.X.; et al. Optical visualization and polarized light absorption of the single-wall carbon nanotube to verify intrinsic thermal applications. Light Sci. Appl. 2015, 4, e318. [Google Scholar] [CrossRef]
- Xing, G.Z.; Yi, J.B.; Wang, D.D.; Liao, L.; Yu, T.; Shen, Z.X.; Huan, C.H.A.; Sum, T.C.; Ding, J.; Wu, T. Strong correlation between ferromagnetism and oxygen deficiency in Cr-doped In2O3-δ nanostructures. Phys. Rev. B 2009, 79, 174406–174415. [Google Scholar] [CrossRef]
- Xing, G.Z.; Yi, J.B.; WU, T. Comparative Study of Room-Temperature Ferromagnetism in Cu-Doped ZnO Nanowires Enhanced by Structural Inhomogeneity. Adv. Mater. 2008, 20, 3521–3527. [Google Scholar] [CrossRef]
- Zhang, X.; Niu, C.; Wang, Y.; Zhou, S.; Liu, J. Gel-limited synthesis of dumbbell-like Fe3O4-Ag composite microspheres and their SERS applications. Nanoscale 2014, 6, 12618–12625. [Google Scholar] [CrossRef] [PubMed]
- Wang, J.M.; Wang, Z.L.; Li, S.; Wang, R.M.; Song, Y.J. Surface and interface engineering of FePt/C nanocatalysts for electro-catalytic methanol oxidation: Enhanced activity and durability. Nanoscale 2017, 9, 4066–4075. [Google Scholar] [CrossRef] [PubMed]
- Krylova, G.; Giovanetti, L.J.; Requejo, F.G.; Dimitrijevic, N.M.; Prakapenka, A.; Shevchenko, E.V. Study of Nucleation and Growth Mechanism of the Metallic Nanodumbbells. J. Am. Chem. Soc. 2012, 134, 4384–4392. [Google Scholar] [CrossRef] [PubMed]
- Niedermaier, I.; Kolbeck, C.; Steinrück, H.P.; Maier, F. Dual analyzer system for surface analysis dedicated for angle-resolved photoelectron spectroscopy at liquid surfaces and interfaces. Rev. Sci. Instrum. 2016, 87, 045105. [Google Scholar] [CrossRef] [PubMed]
- Sahu, N.K.; Bahadur, D. Influence of excess Fe accumulation over the surface of FePt nanoparticles: Structural and magnetic properties. J. Appl. Phys. 2013, 113, 134303–134313. [Google Scholar] [CrossRef]
- Goon, I.Y.; Lai, L.M.H.; Lim, M.; Munroe, P.; Gooding, J.J.; Amal, R. Fabrication and Dispersion of Gold-Shell-Protected Magnetite Nanoparticles: Systematic Control Using Polyethyleneimine. Chem. Mater. 2009, 21, 673–681. [Google Scholar] [CrossRef]
- Wang, Y.; Shen, Y.; Xie, A.; Li, S.; Wang, X.; Cai, Y. A Simple Method To Construct Bifunctional Fe3O4/Au Hybrid Nanostructures and Tune Their Optical Properties in the Near-Infrared Region. J. Phys. Chem. C 2010, 114, 4297–4301. [Google Scholar] [CrossRef]
- Lopes, G.; Vargas, J.M.; Sharma, S.K.; Beron, F.; Pirota, K.R.; Knobel, M.; Rettori, C.; Zysler, R.D. Ag-Fe3O4 Dimer Colloidal Nanoparticles: Synthesis and Enhancement of Magnetic Properties. J. Phys. Chem. C 2010, 114, 10148–10152. [Google Scholar] [CrossRef]
- Freitas, M.; Sá, C.M.; Barroso, M.F.; Pereira, C.; De-Los-Santos-Álvarez, N.; Miranda-Ordieres, A.J.; Lobo-Castañón, M.J.; Delerue-Matos, C. Highly Monodisperse Fe3O4@Au Superparamagnetic Nanoparticles as Reproducible Platform for Genosensing Genetically Modified Organisms. ACS Sens. 2016, 1, 1044–1053. [Google Scholar] [CrossRef]
- Lu, S.X.; Yu, J.Y.; Cheng, Y.Y.; Wang, Q.; Barras, A.; Xu, W.G.; Szunerits, S.; Cornu, D.; Boukherroub, R. Preparation of silver nanoparticles/polydopamine functionalized polyacrylonitrile fiber paper and its catalytic activity for the reduction 4-nitrophenol. Appl. Surf. Sci. 2017, 411, 163–169. [Google Scholar] [CrossRef]
- Zhang, K.H.; Wang, C.W.; Rong, Z.; Xiao, R.; Zhou, Z.; Wang, S.Q. Silver coated magnetic microflowers as efficient and recyclable catalysts for catalytic reduction. New J. Chem. 2017, 41, 14199–14208. [Google Scholar] [CrossRef]
- Khan, M.M.; Lee, J.; Cho, M.H. Au@TiO2 nanocomposites for the catalytic degradation of methyl orange and methylene blue: An electron relay effect. J. Ind. Eng. Chem. 2014, 20, 1584–1590. [Google Scholar] [CrossRef]
- Wysocka, I.; Kowalska, E.; Trzcinski, K.; Łapinski, M.; Nowaczyk, G.; Zielinska-Jurek, A. UV-Vis-Induced Degradation of Phenol over Magnetic Photocatalysts Modified with Pt, Pd, Cu and Au Nanoparticles. Nanomaterials 2018, 2, 28. [Google Scholar] [CrossRef] [PubMed]
- Li, M.; Li, X.G.; Qi, X.H.; Luo, F.; He, G.H. Shape-Controlled Synthesis of Magnetic Iron Oxide@SiO2-Au@C Particles with Core-Shell Nanostructures. Langmuir 2015, 31, 5190–5197. [Google Scholar] [CrossRef] [PubMed]
© 2018 by the authors. Licensee MDPI, Basel, Switzerland. This article is an open access article distributed under the terms and conditions of the Creative Commons Attribution (CC BY) license (http://creativecommons.org/licenses/by/4.0/).