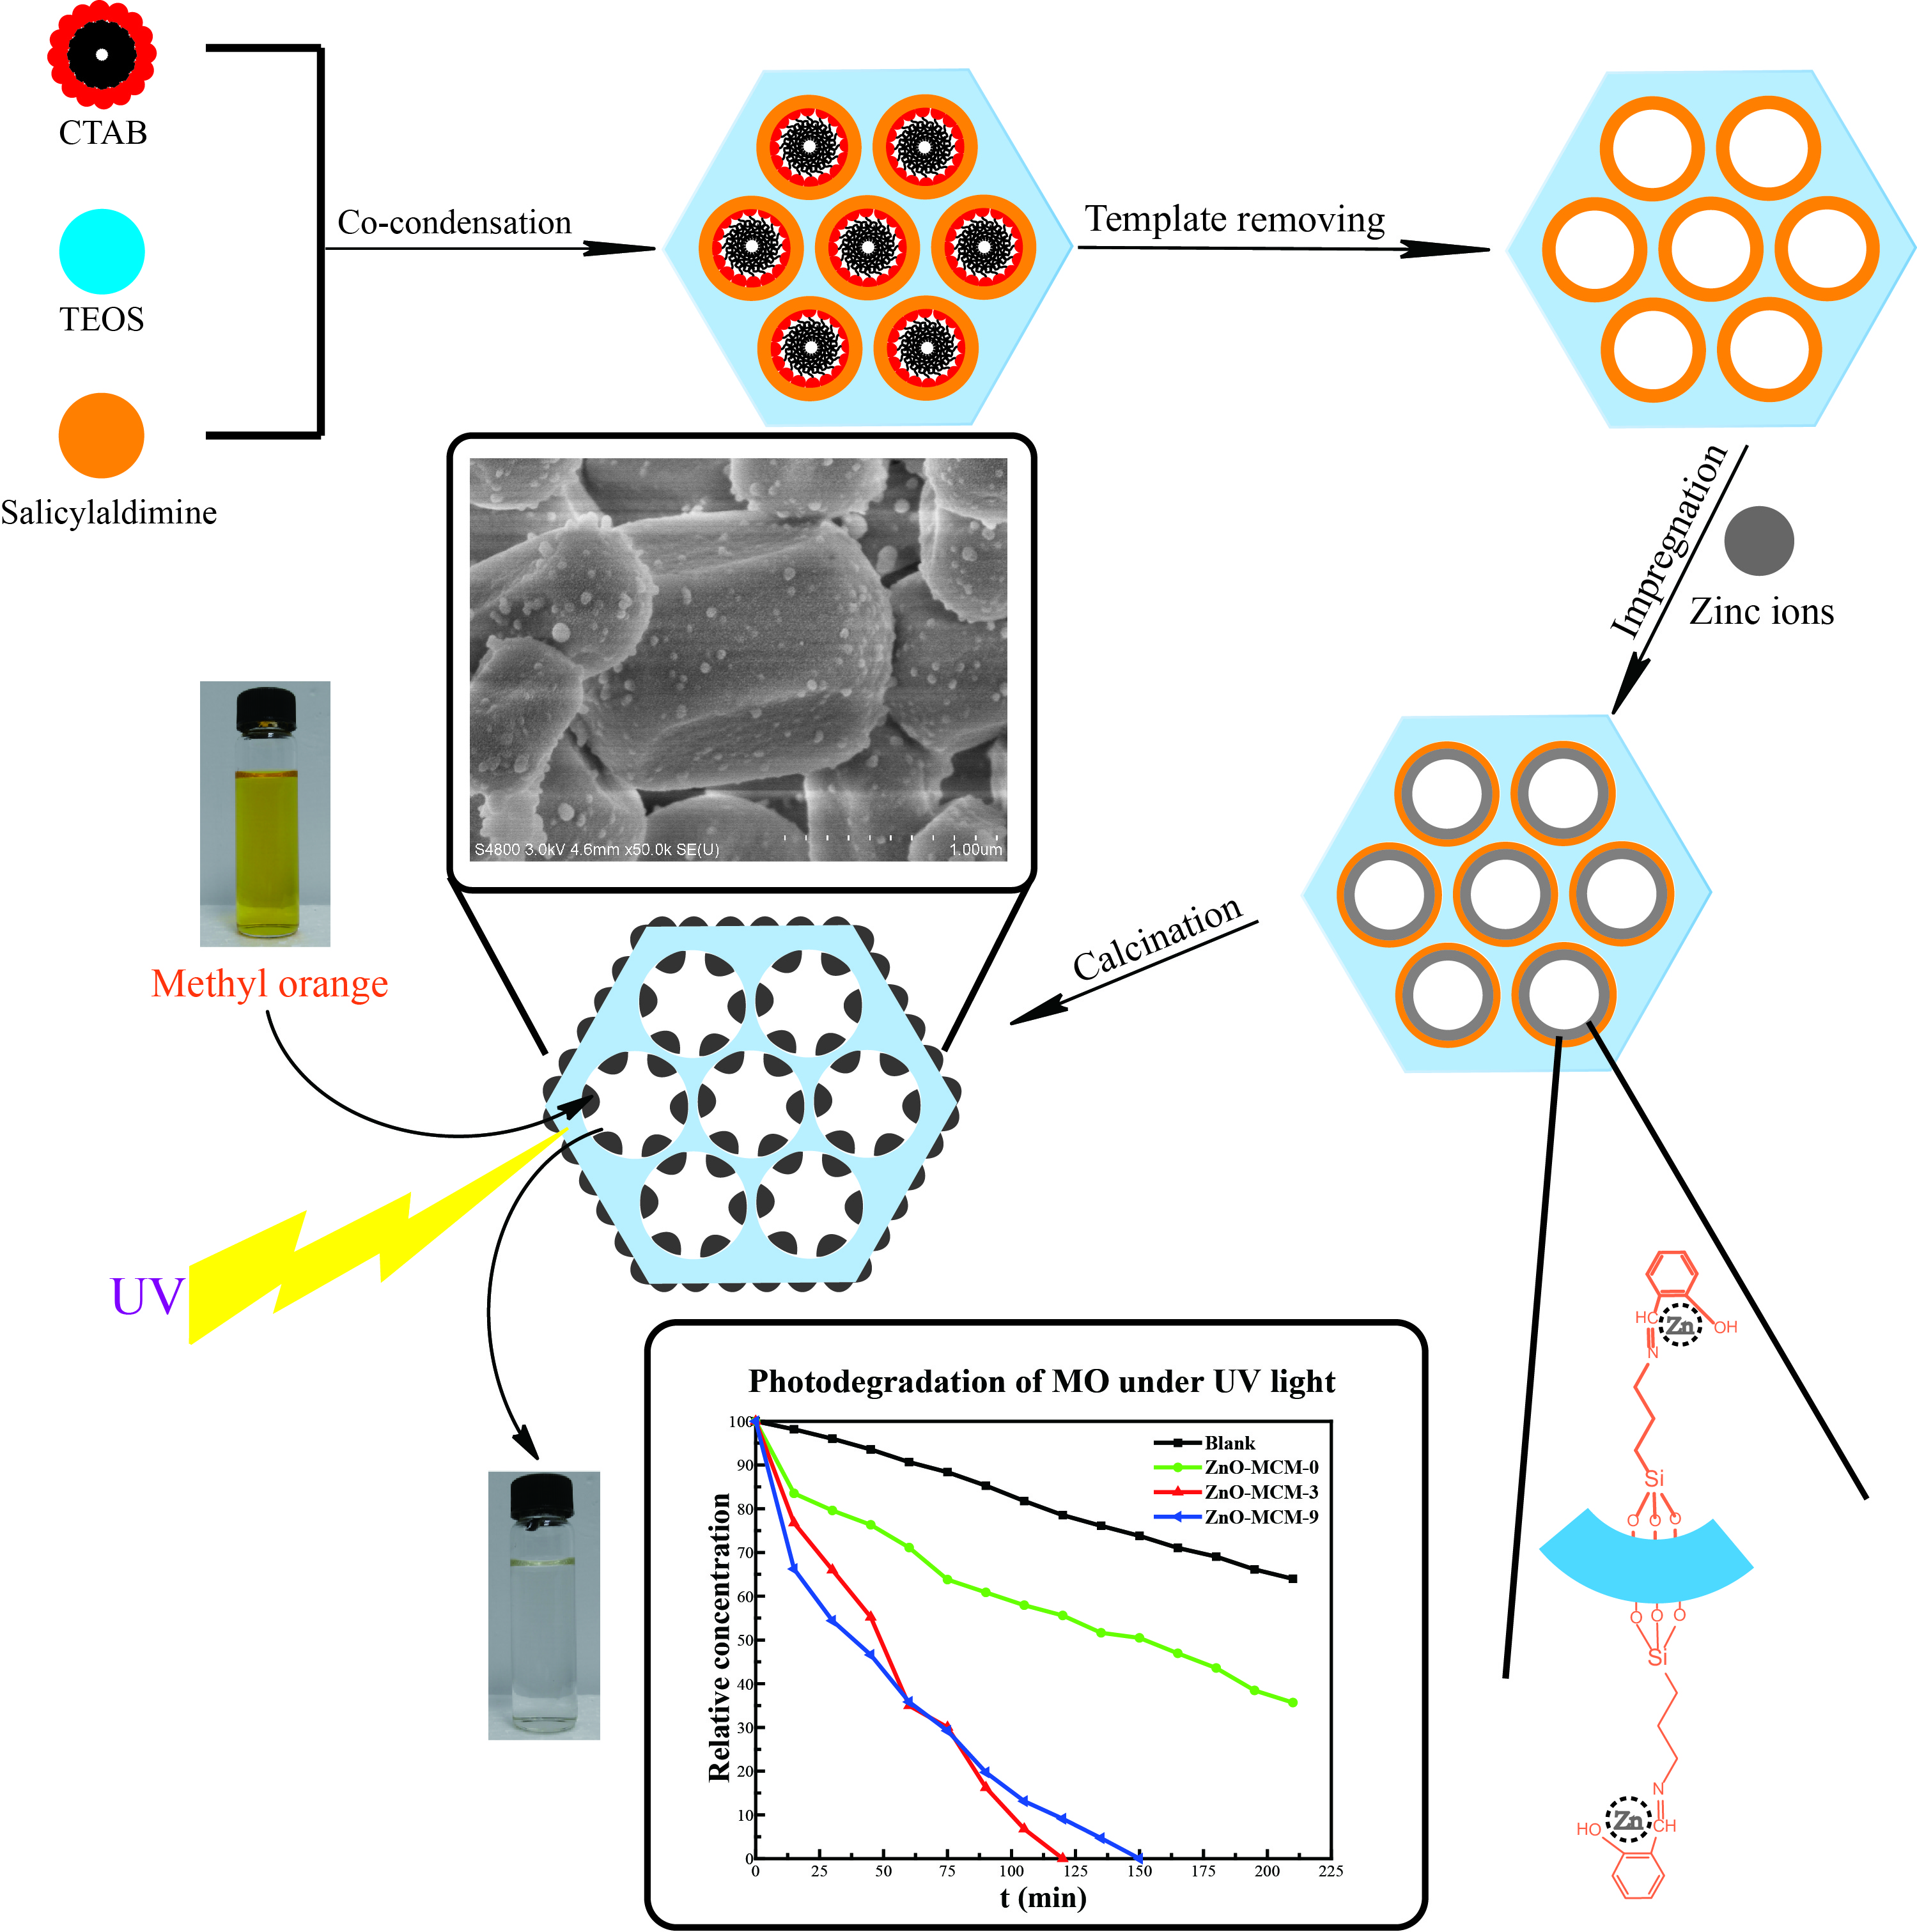
Synthesis of Nano-Zinc Oxide Loaded on Mesoporous Silica by Coordination Effect and Its Photocatalytic Degradation Property of Methyl Orange

Abstract

1. Introduction
2. Experimental
2.1. Chemicals
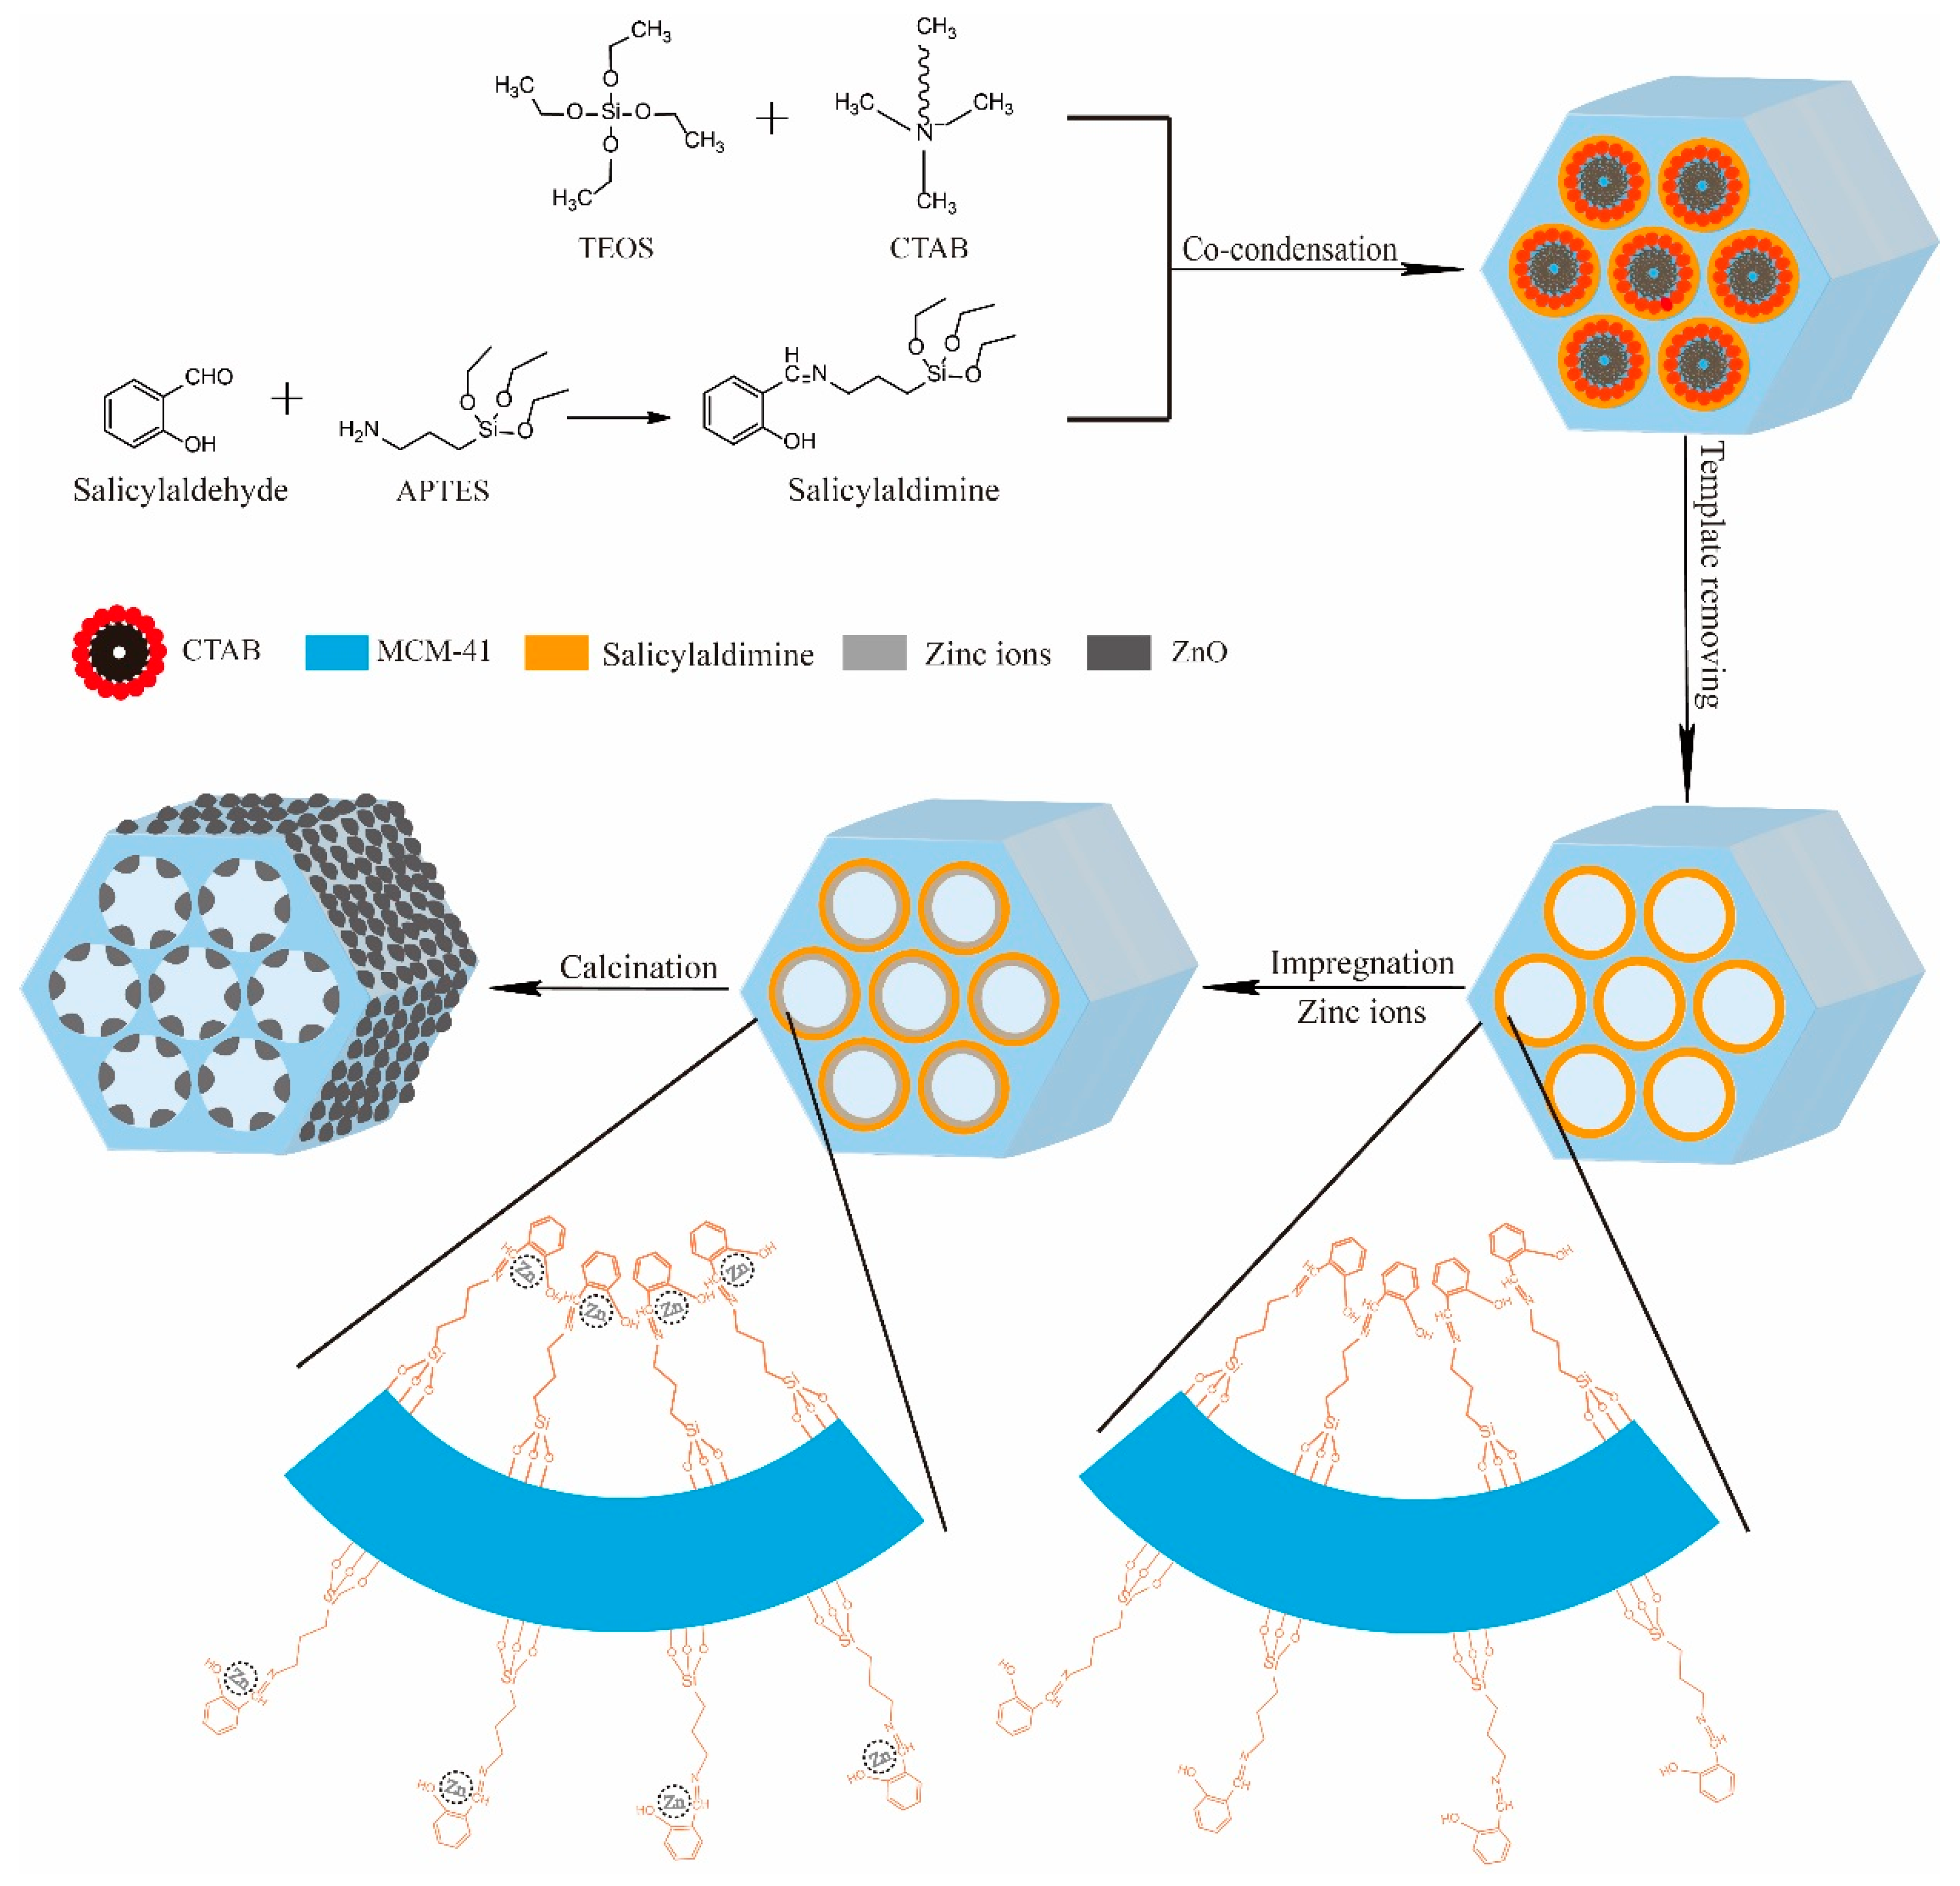
2.2. Synthesis
2.2.1. Preparation of Salicylaldimine
2.2.2. Preparation of Salicylaldimine-Modified Mesoporous Silica (Sal-MCM)
2.2.3. Preparation of Zinc Oxide Supported by Mesoporous Silica (ZnO-MCM)
2.3. Photocatalytic Degradation of MO and Reusablity Study
2.4. Characterization
3. Results and Discussion
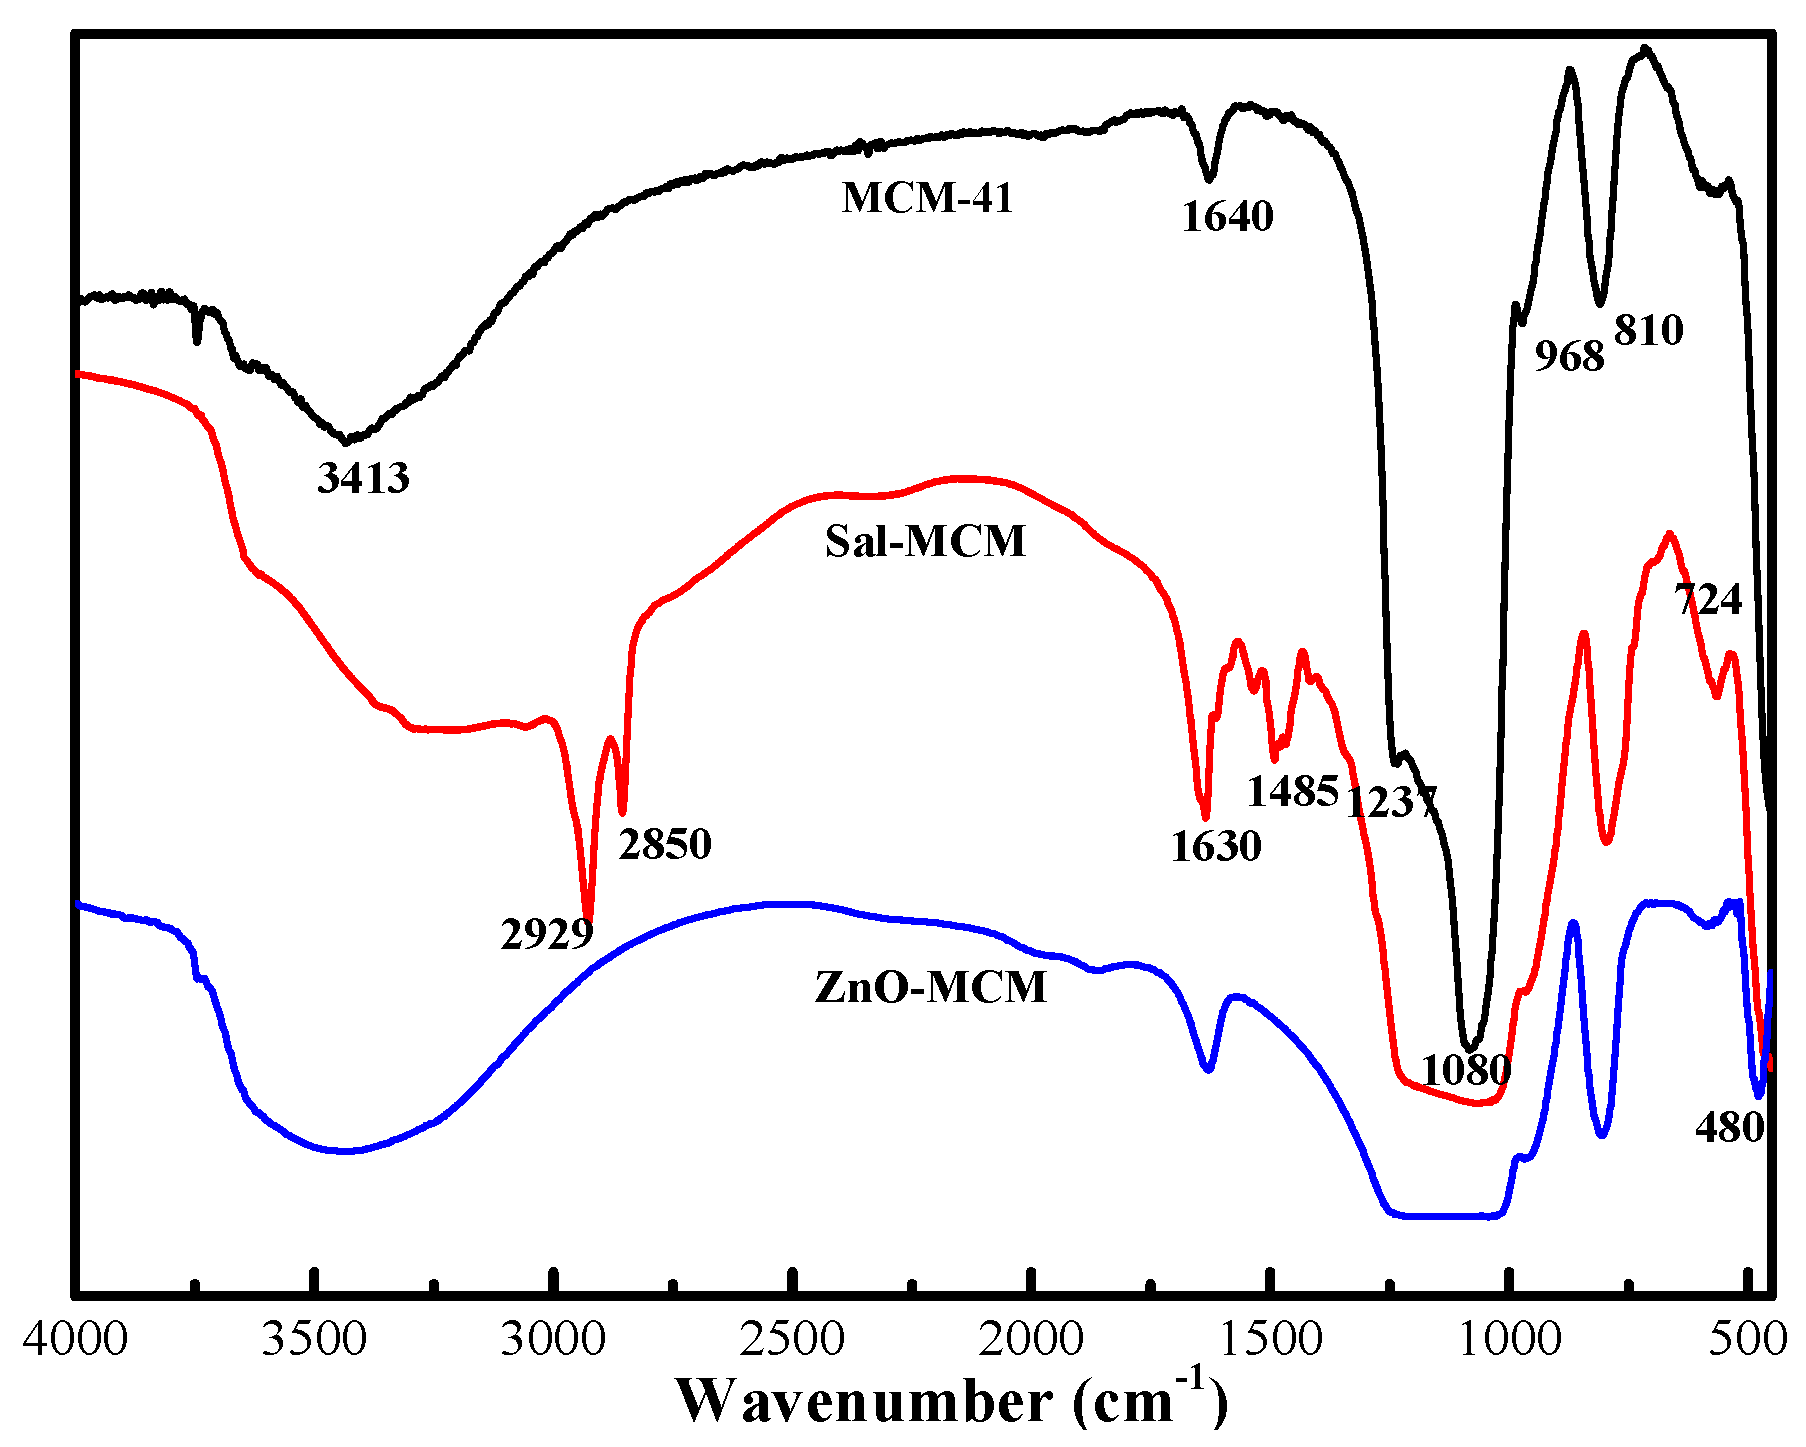
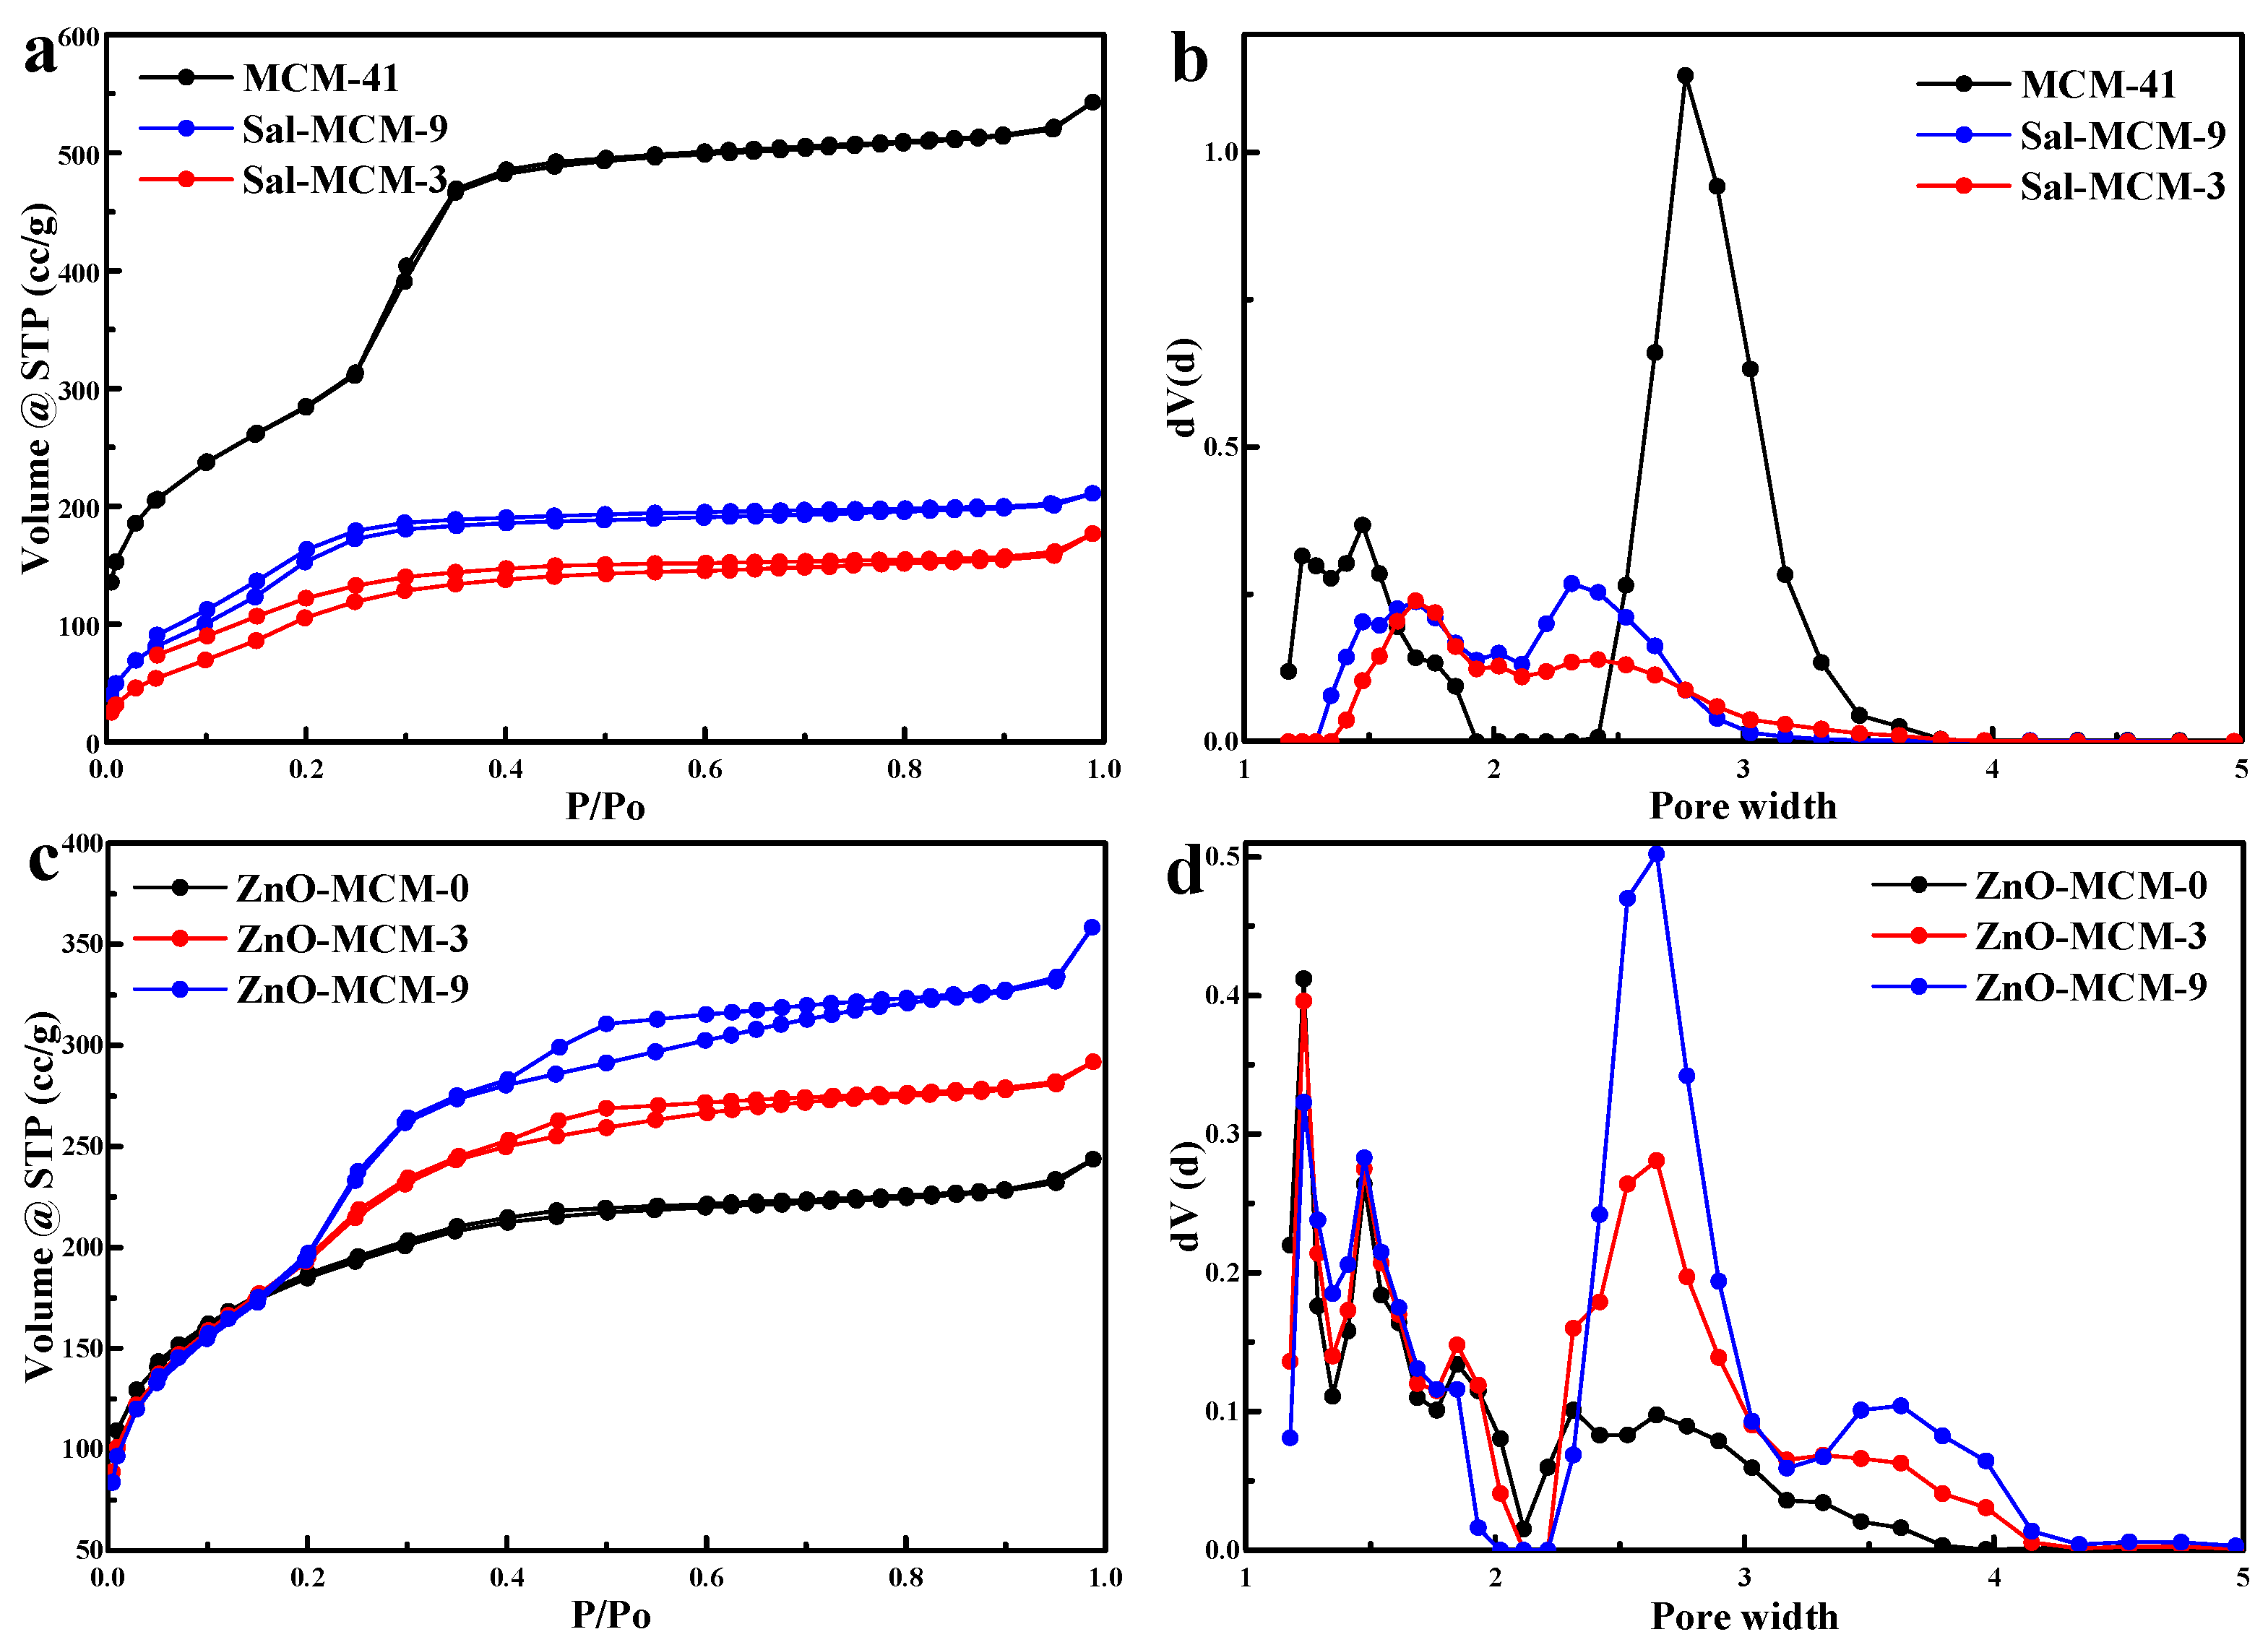
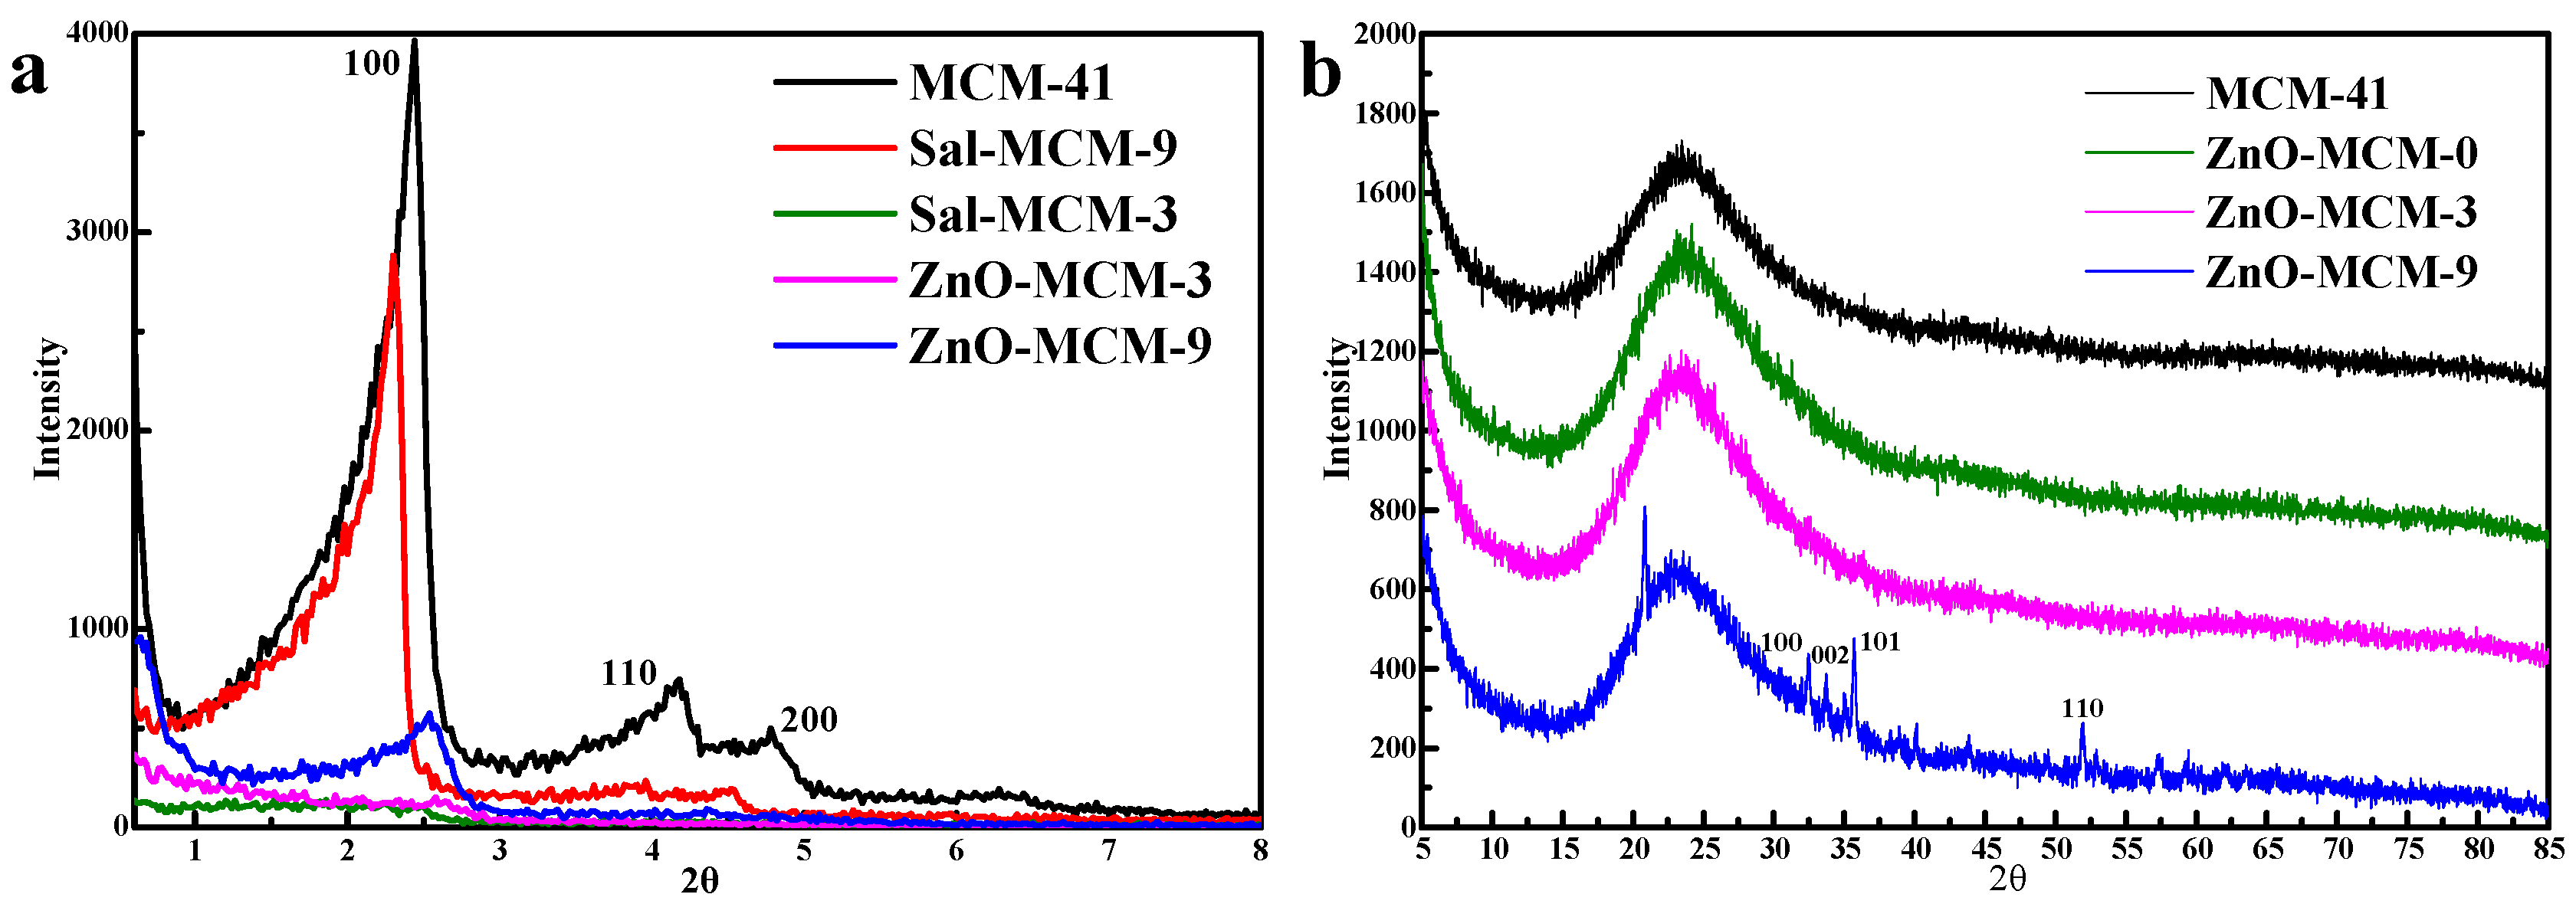
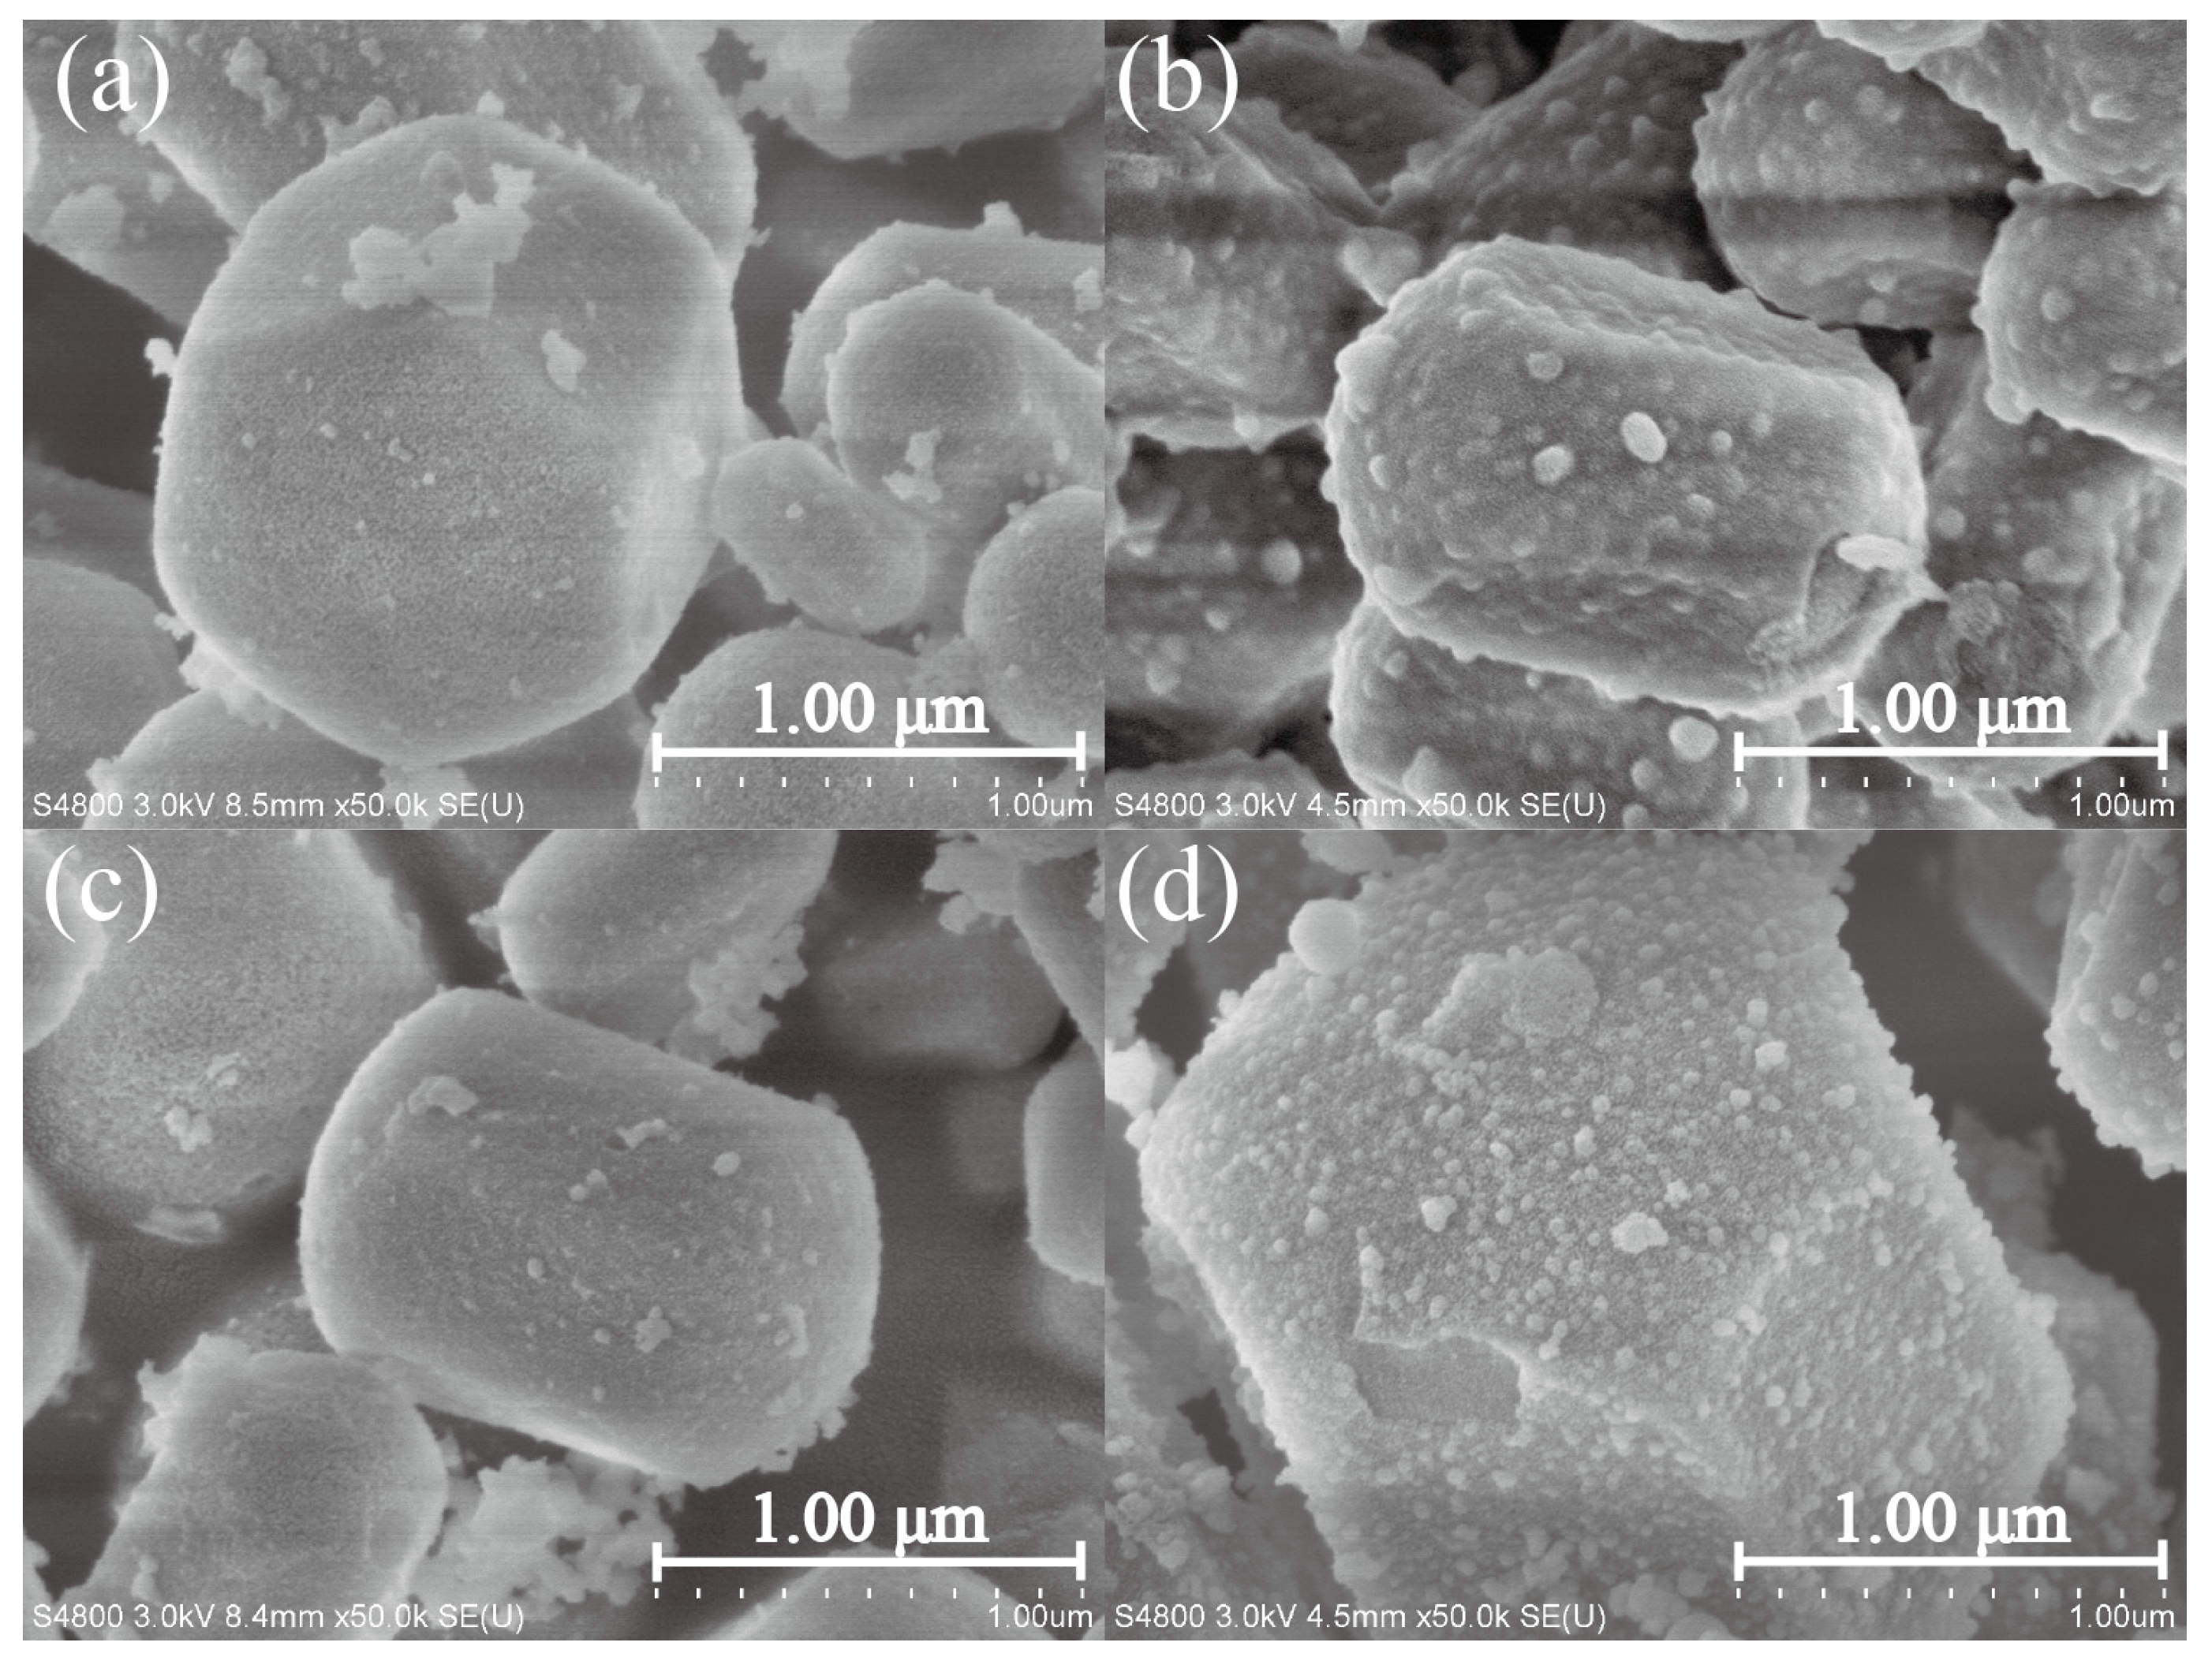
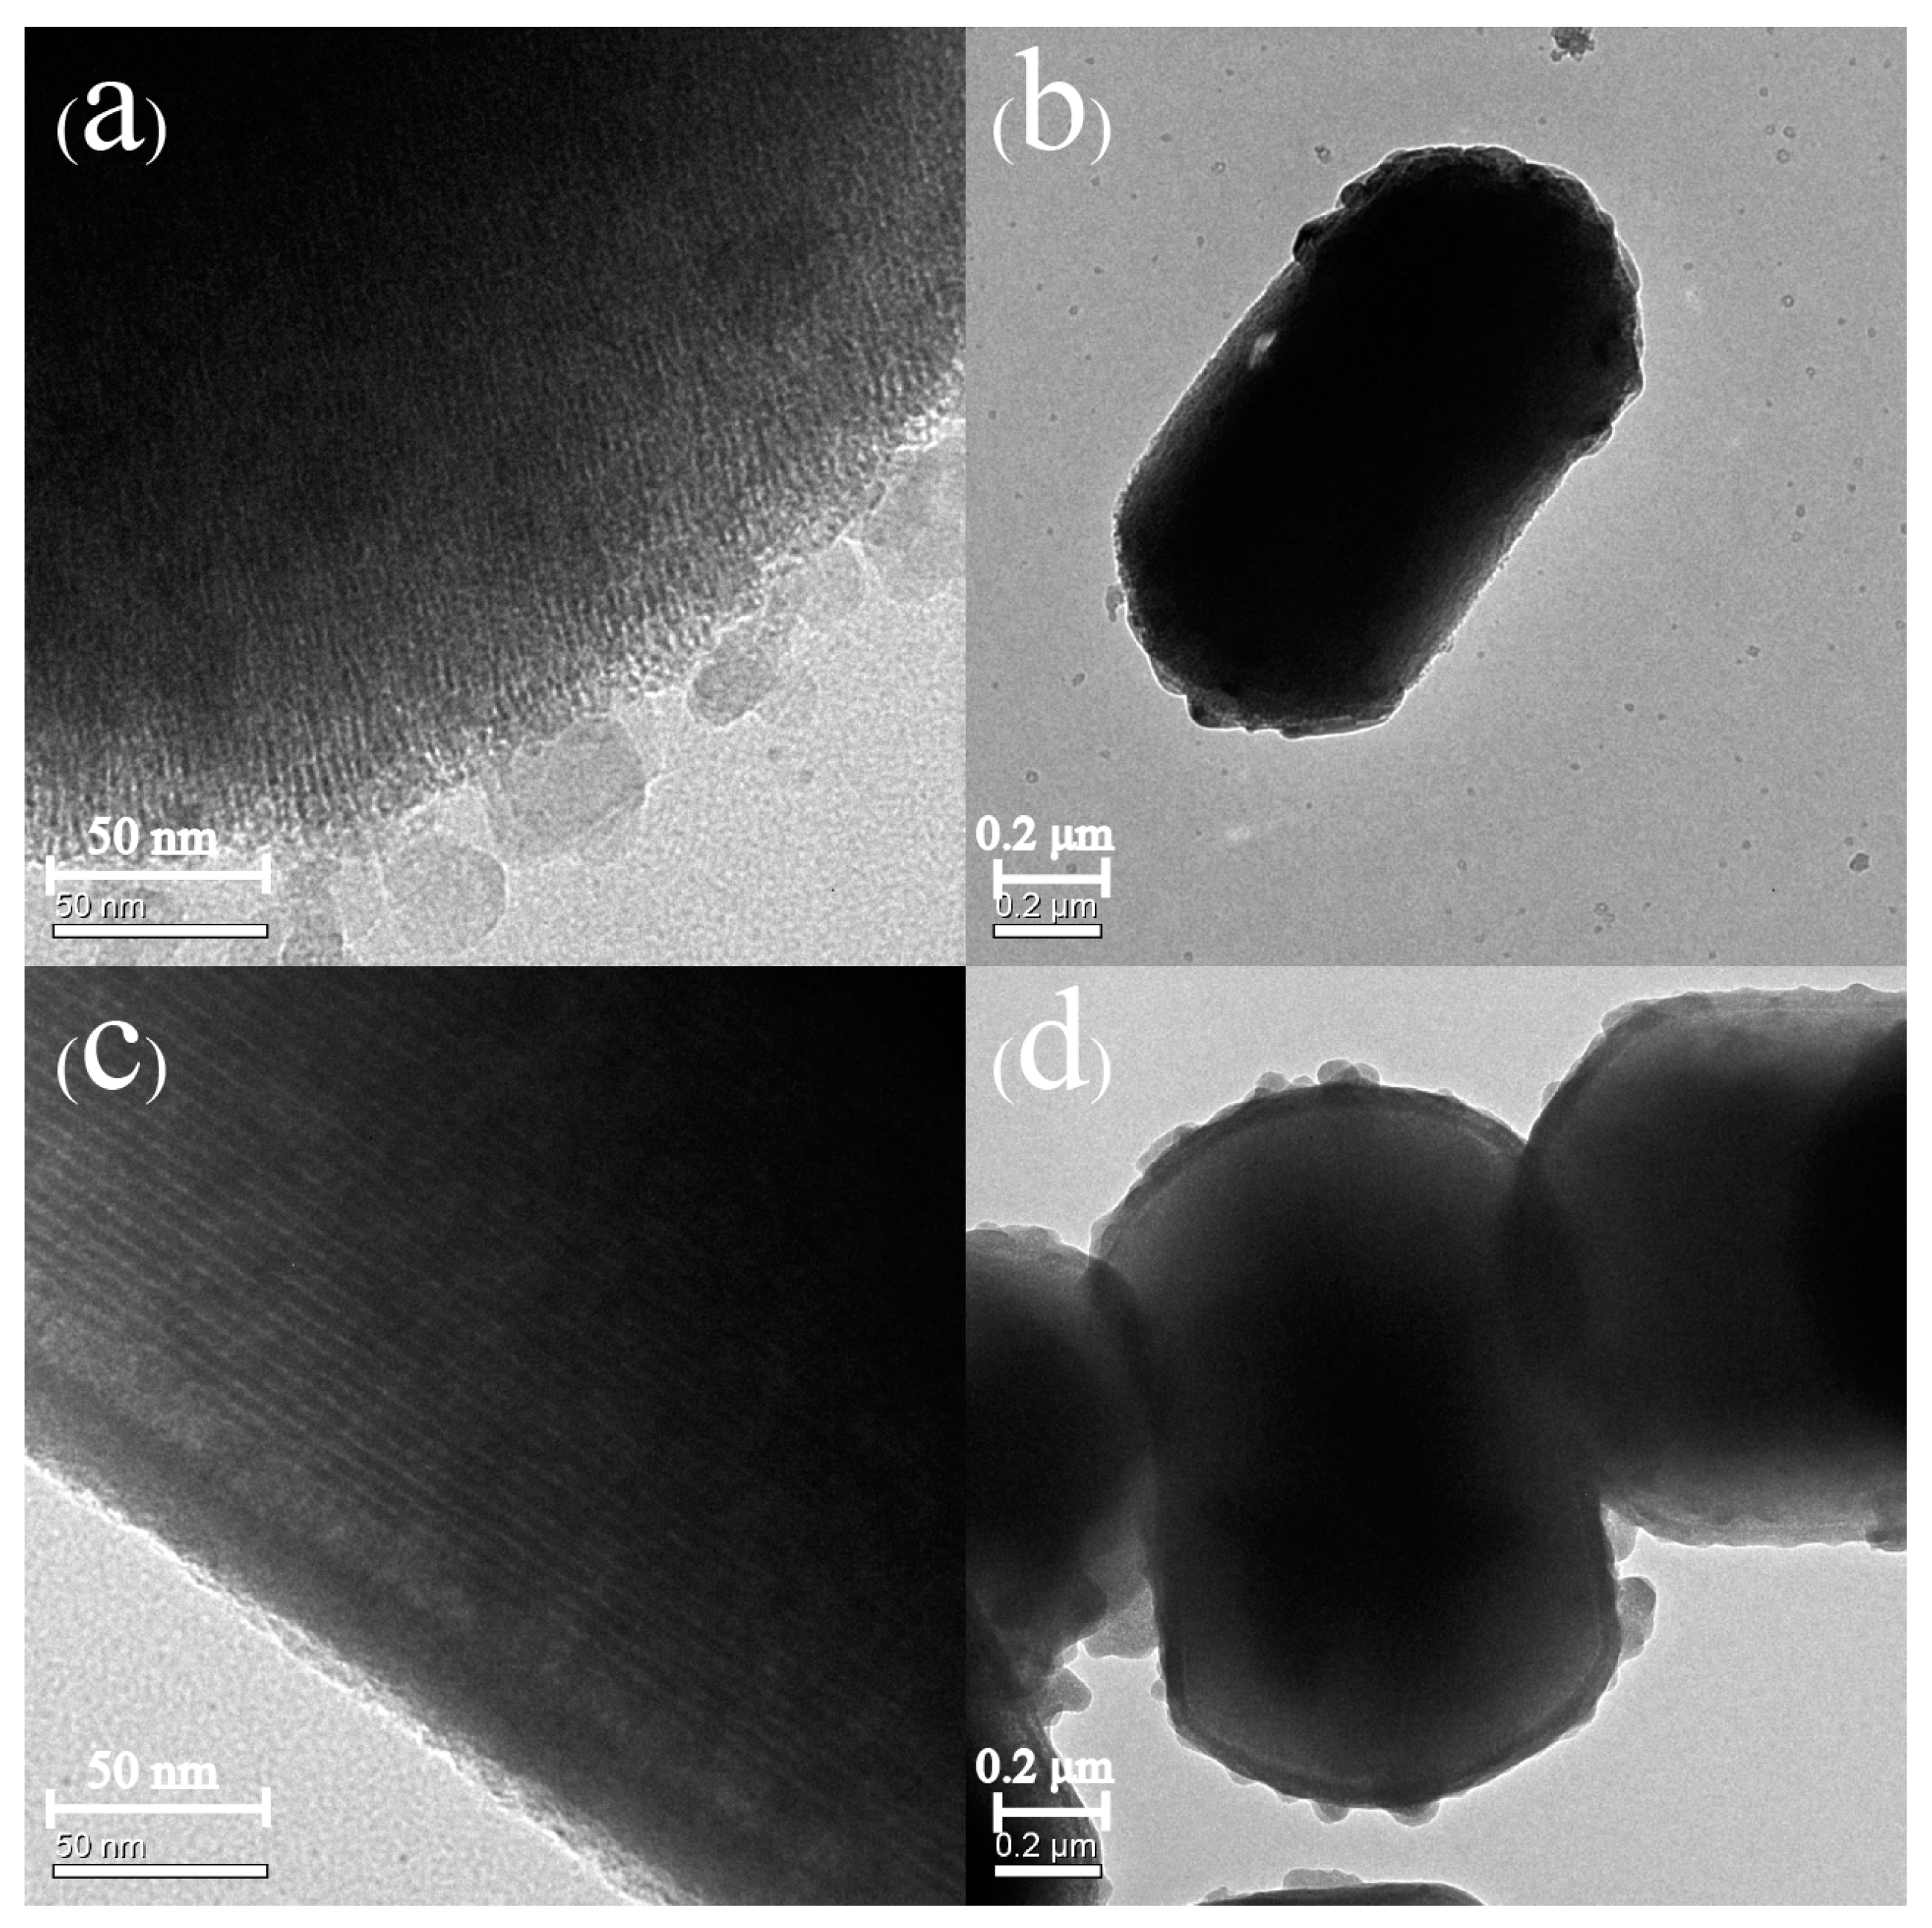
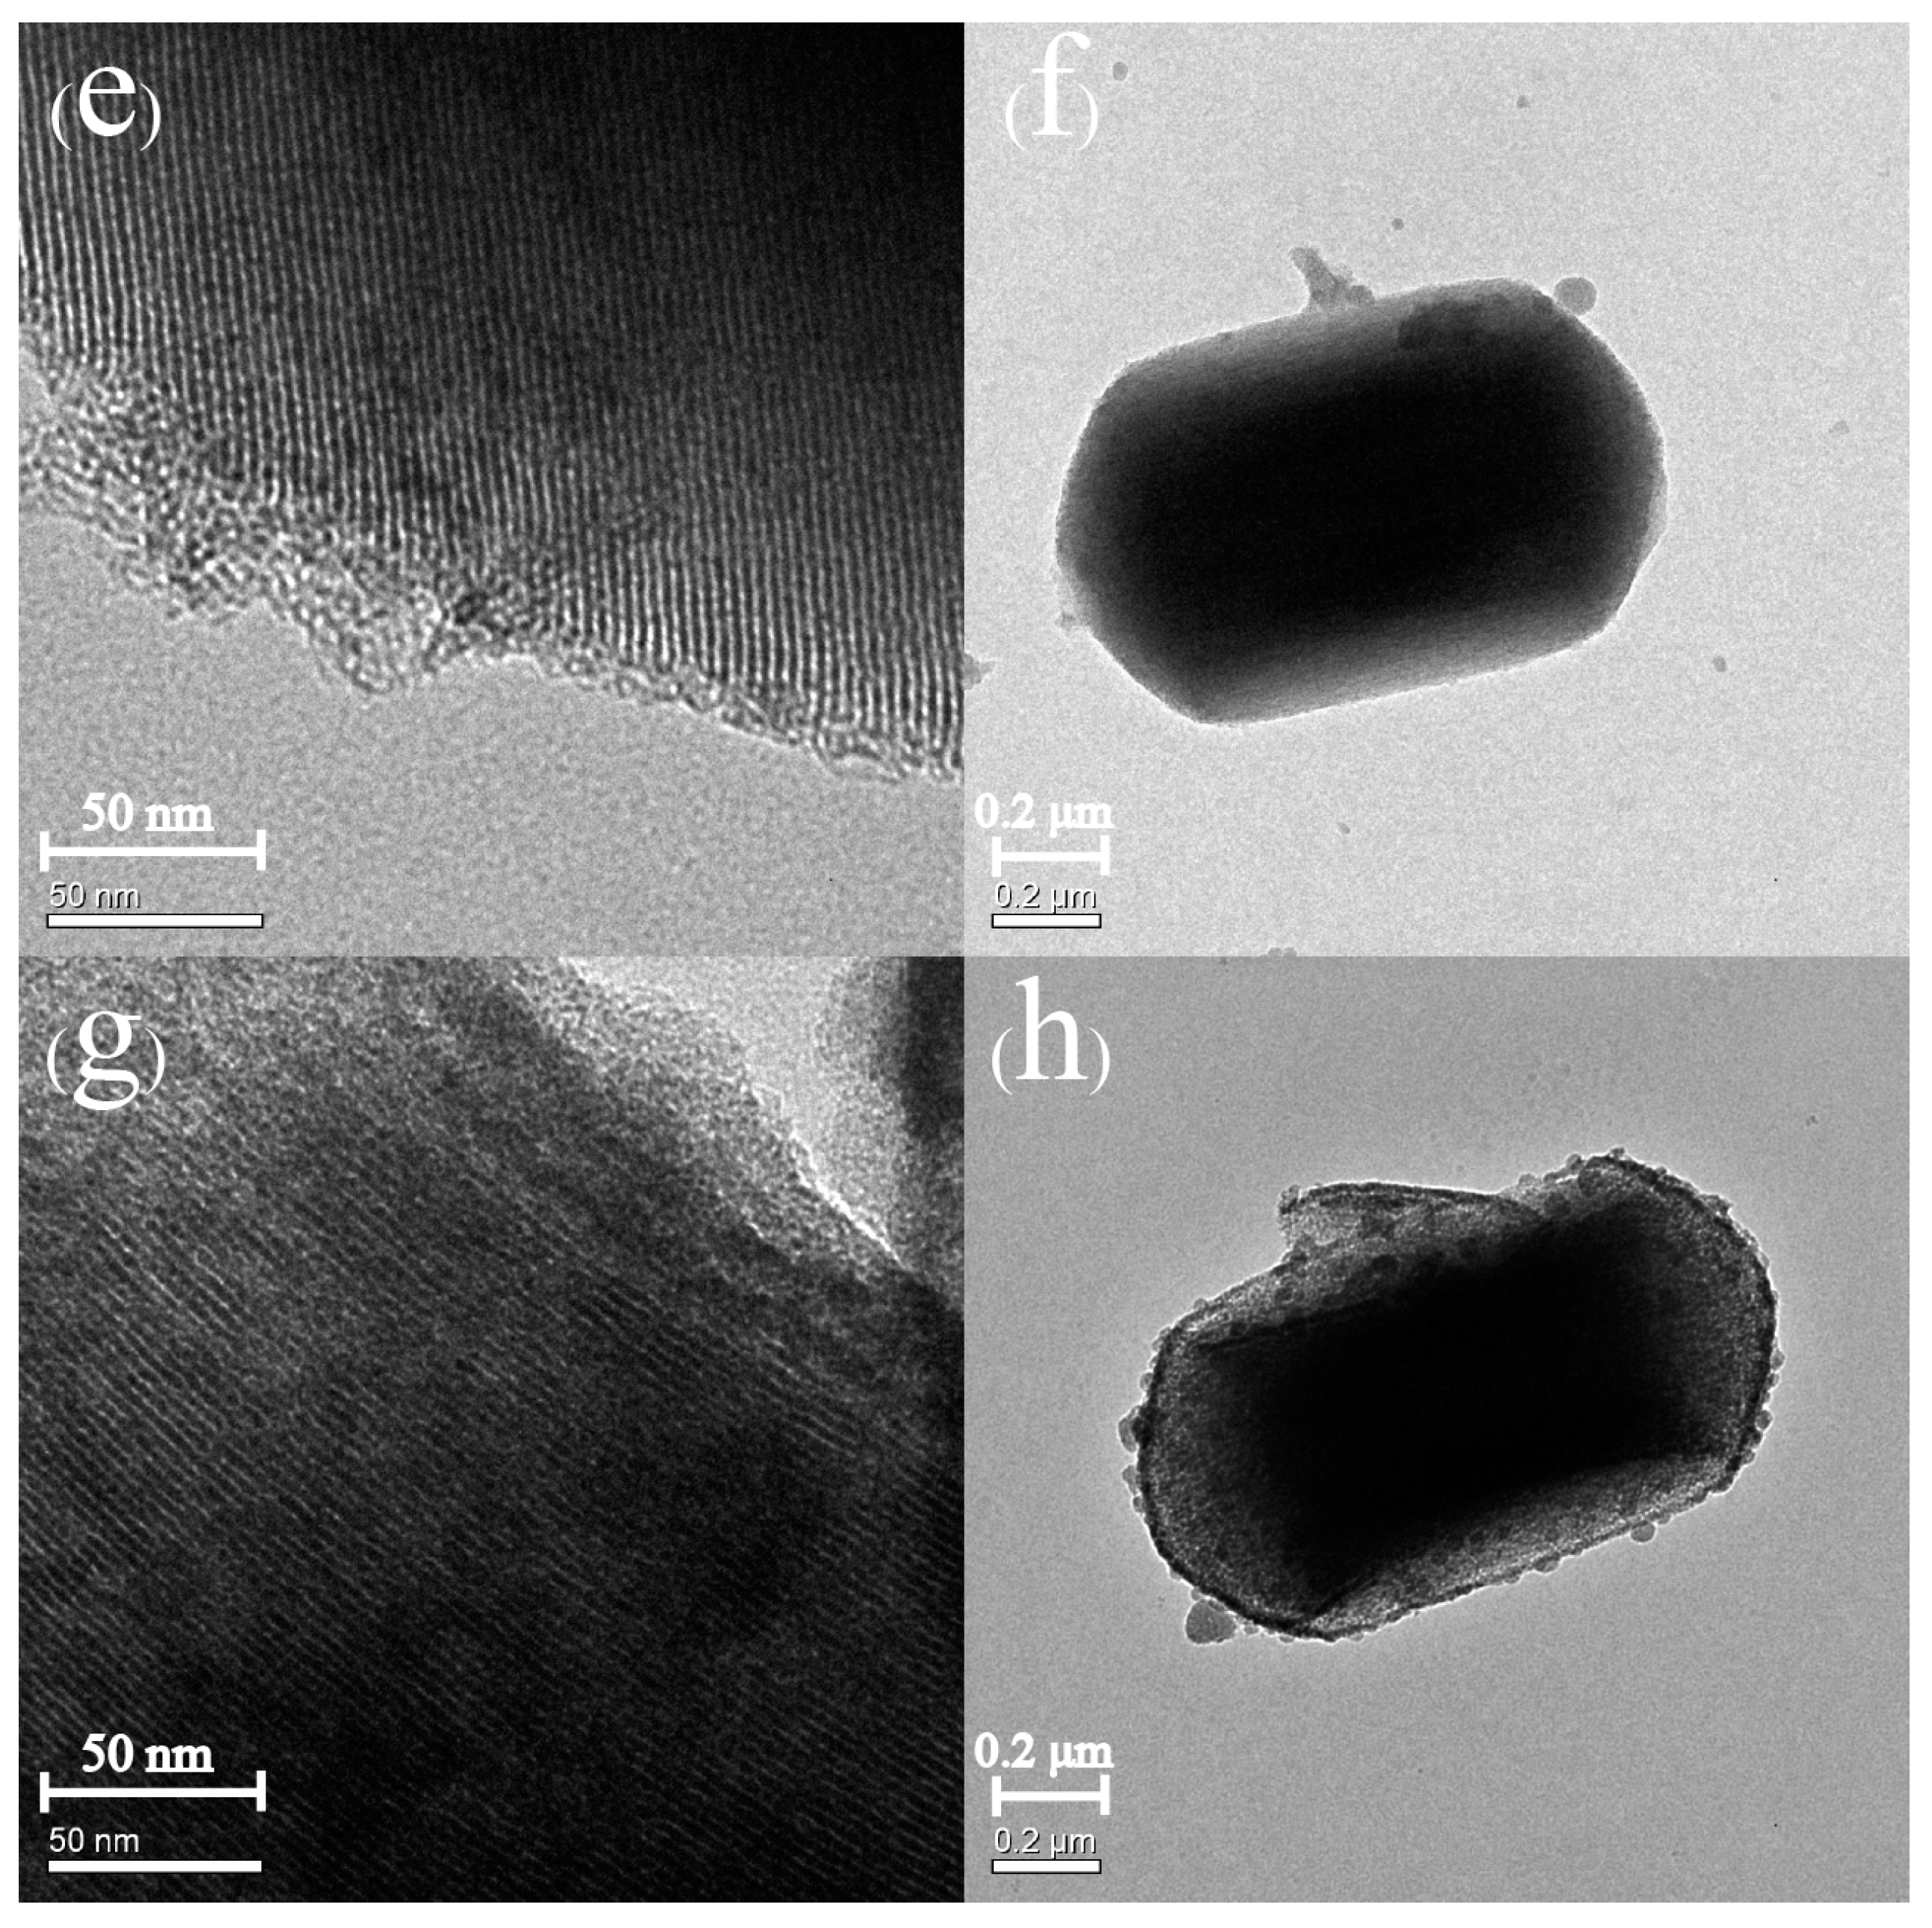
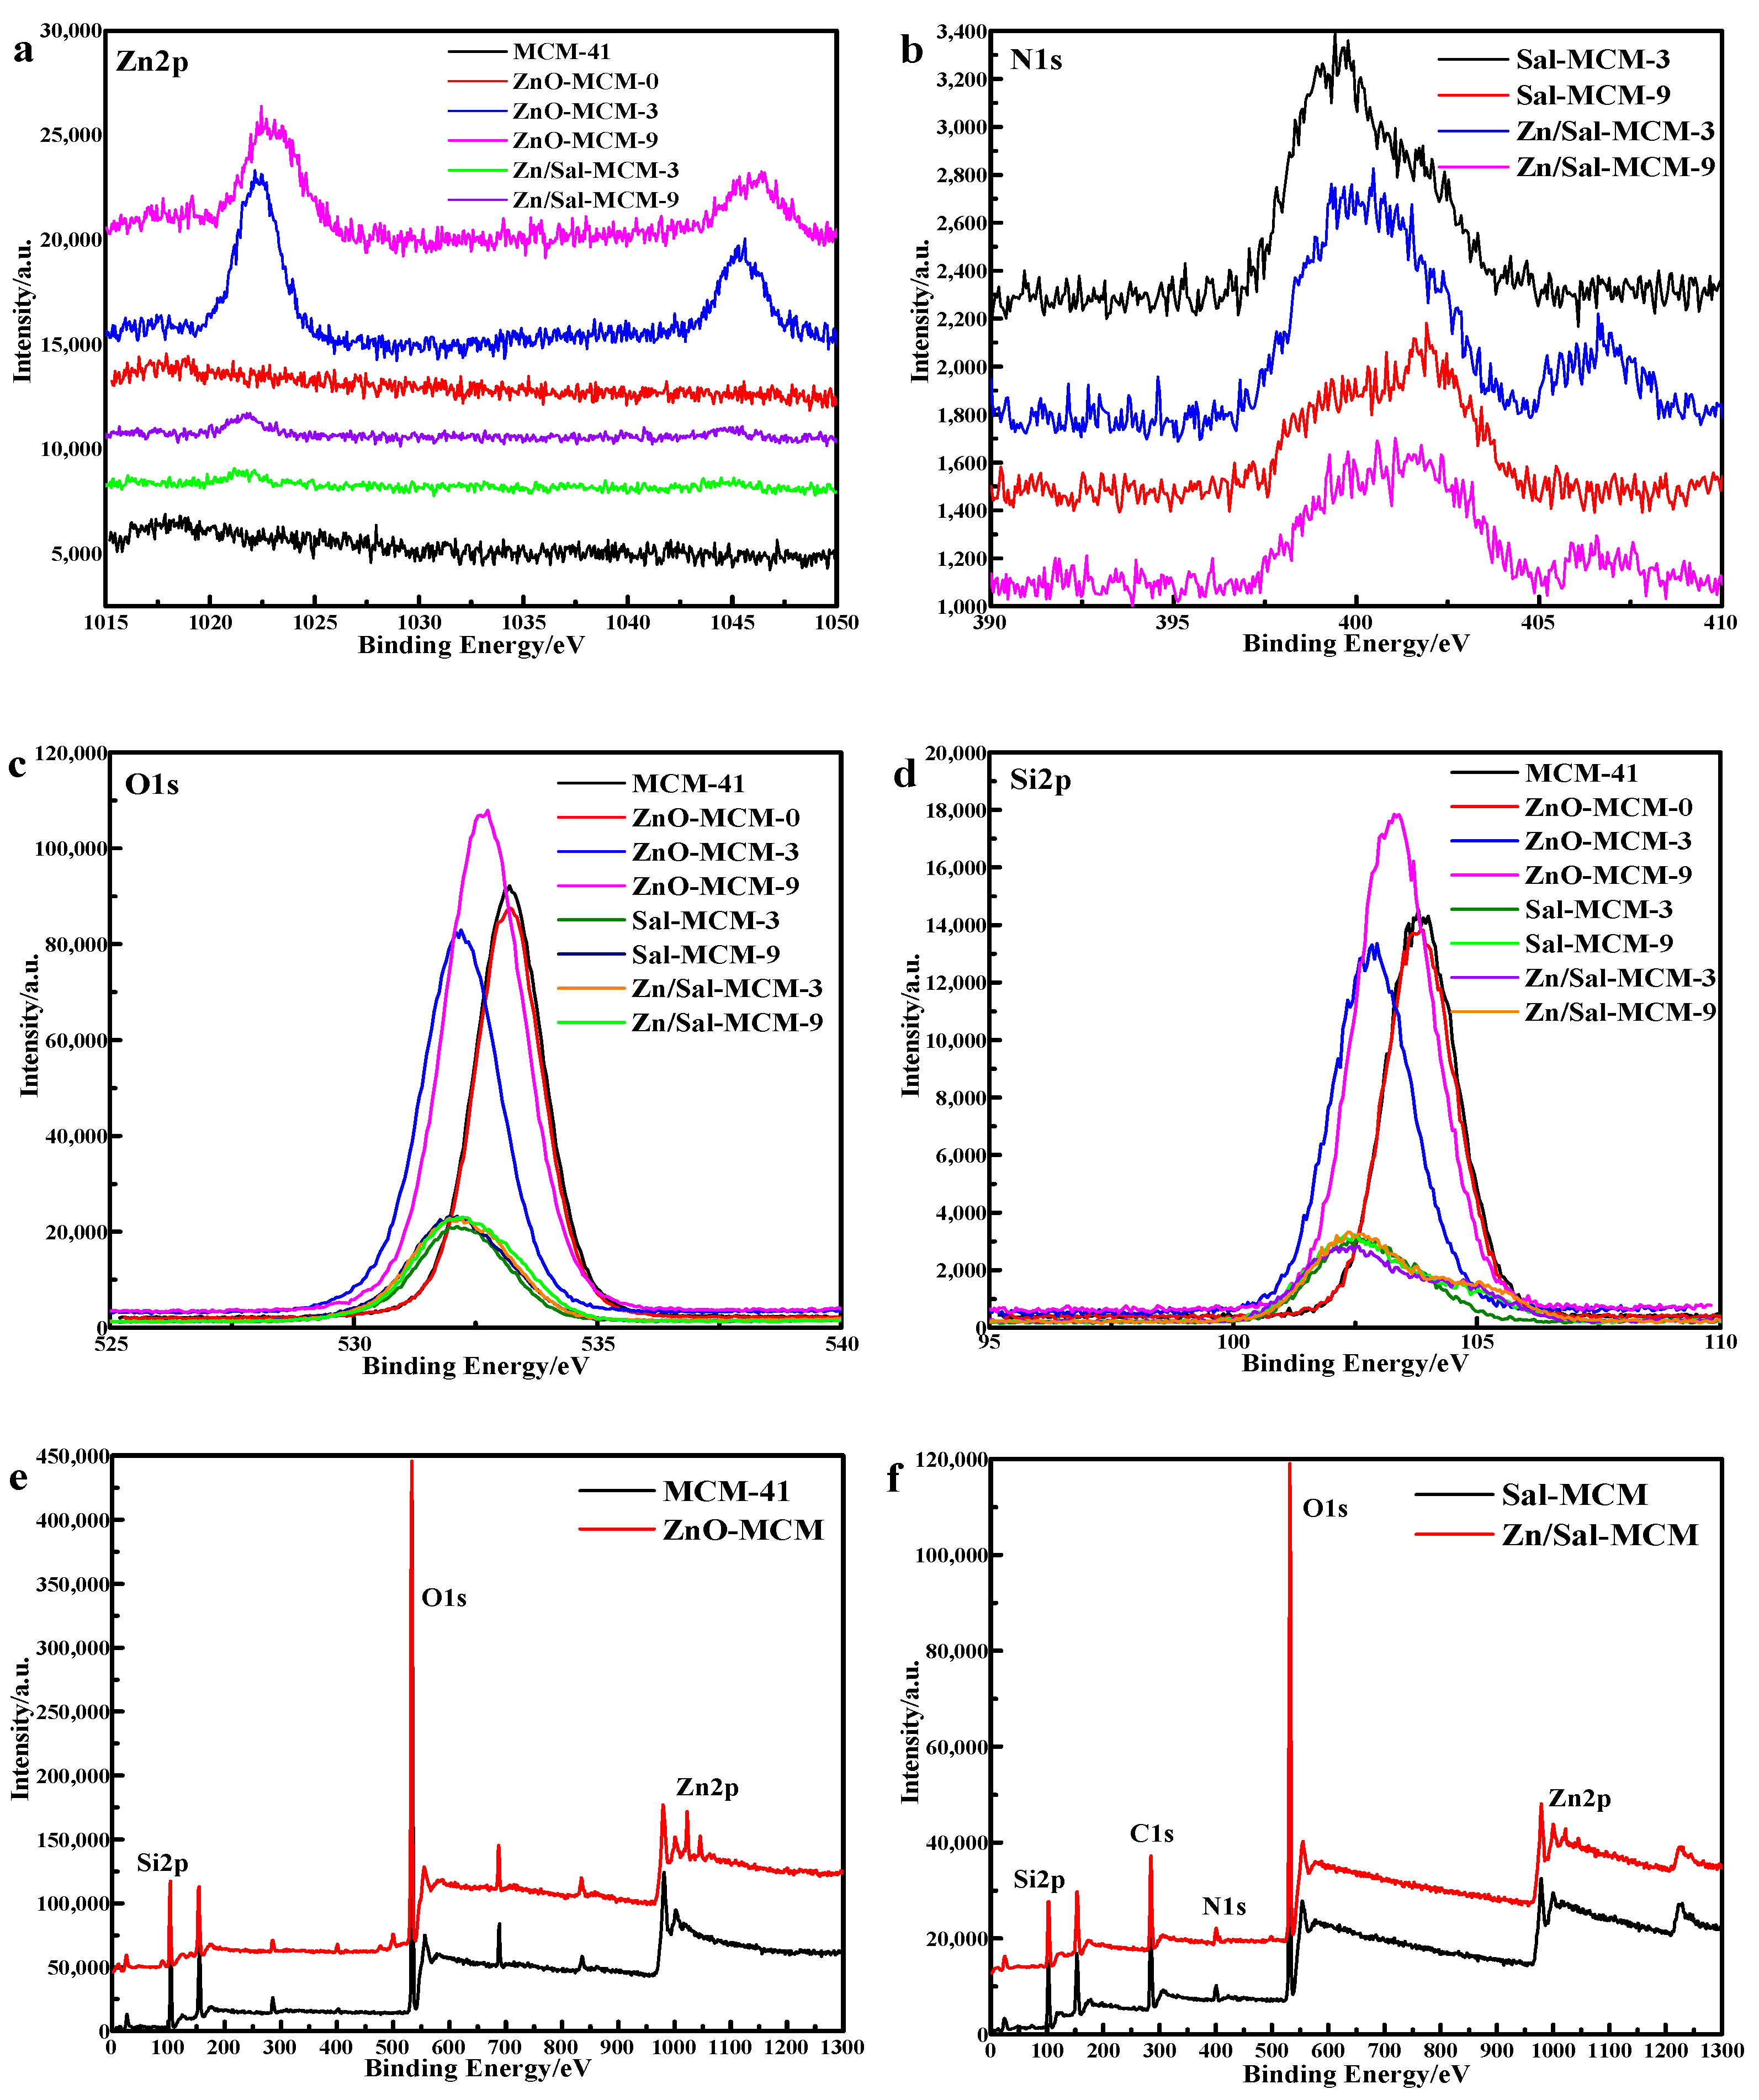
3.1. Characterization
3.2. Degradation of MO
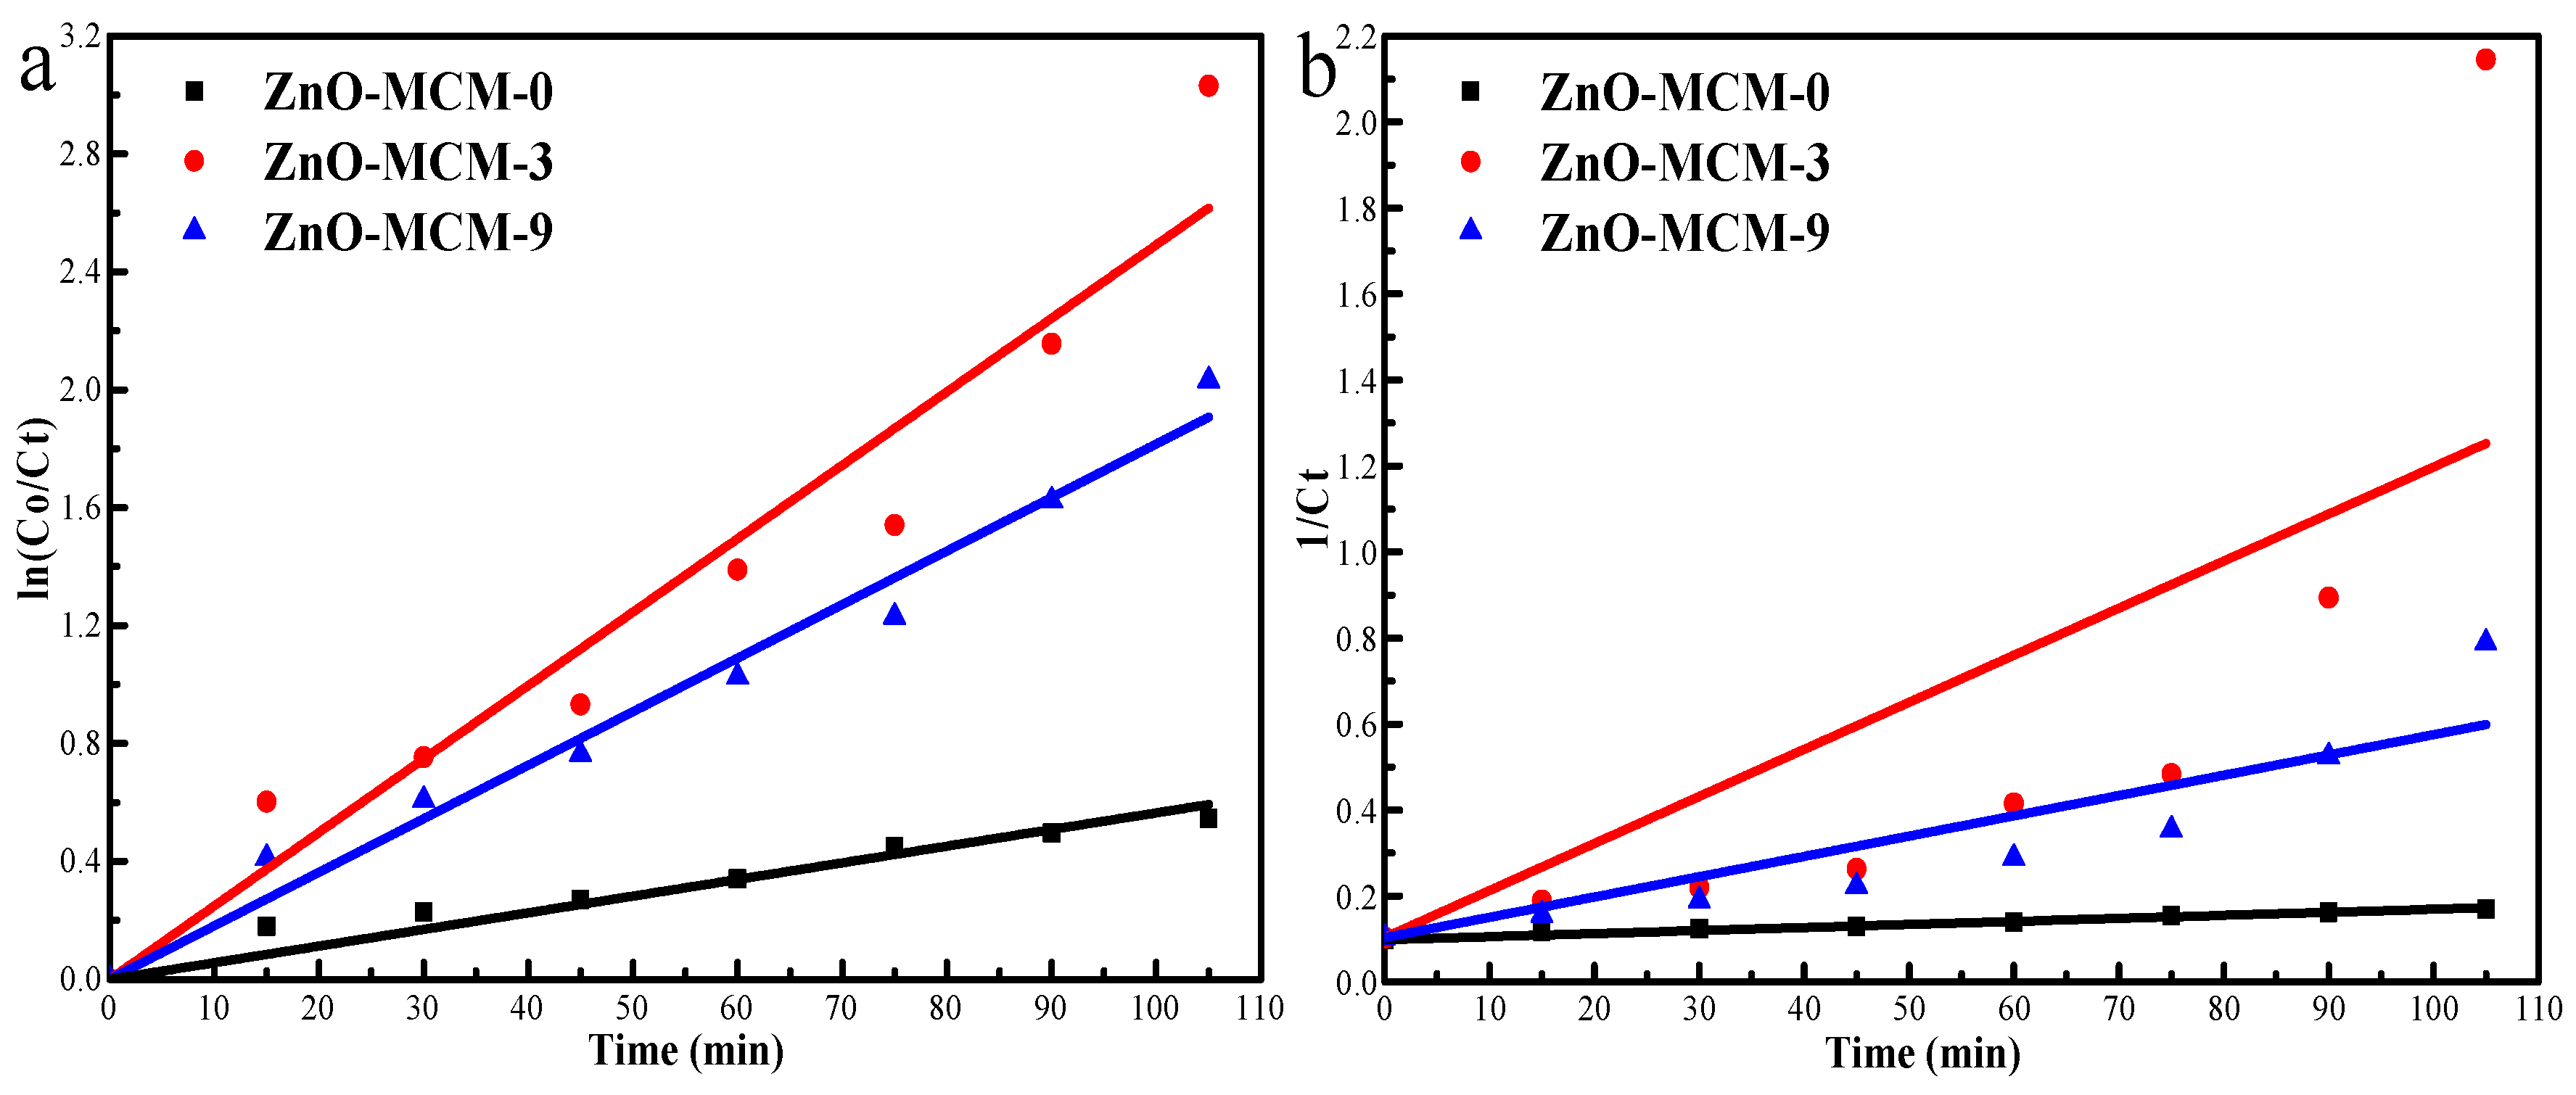
3.3. Degradation Kinetics Study
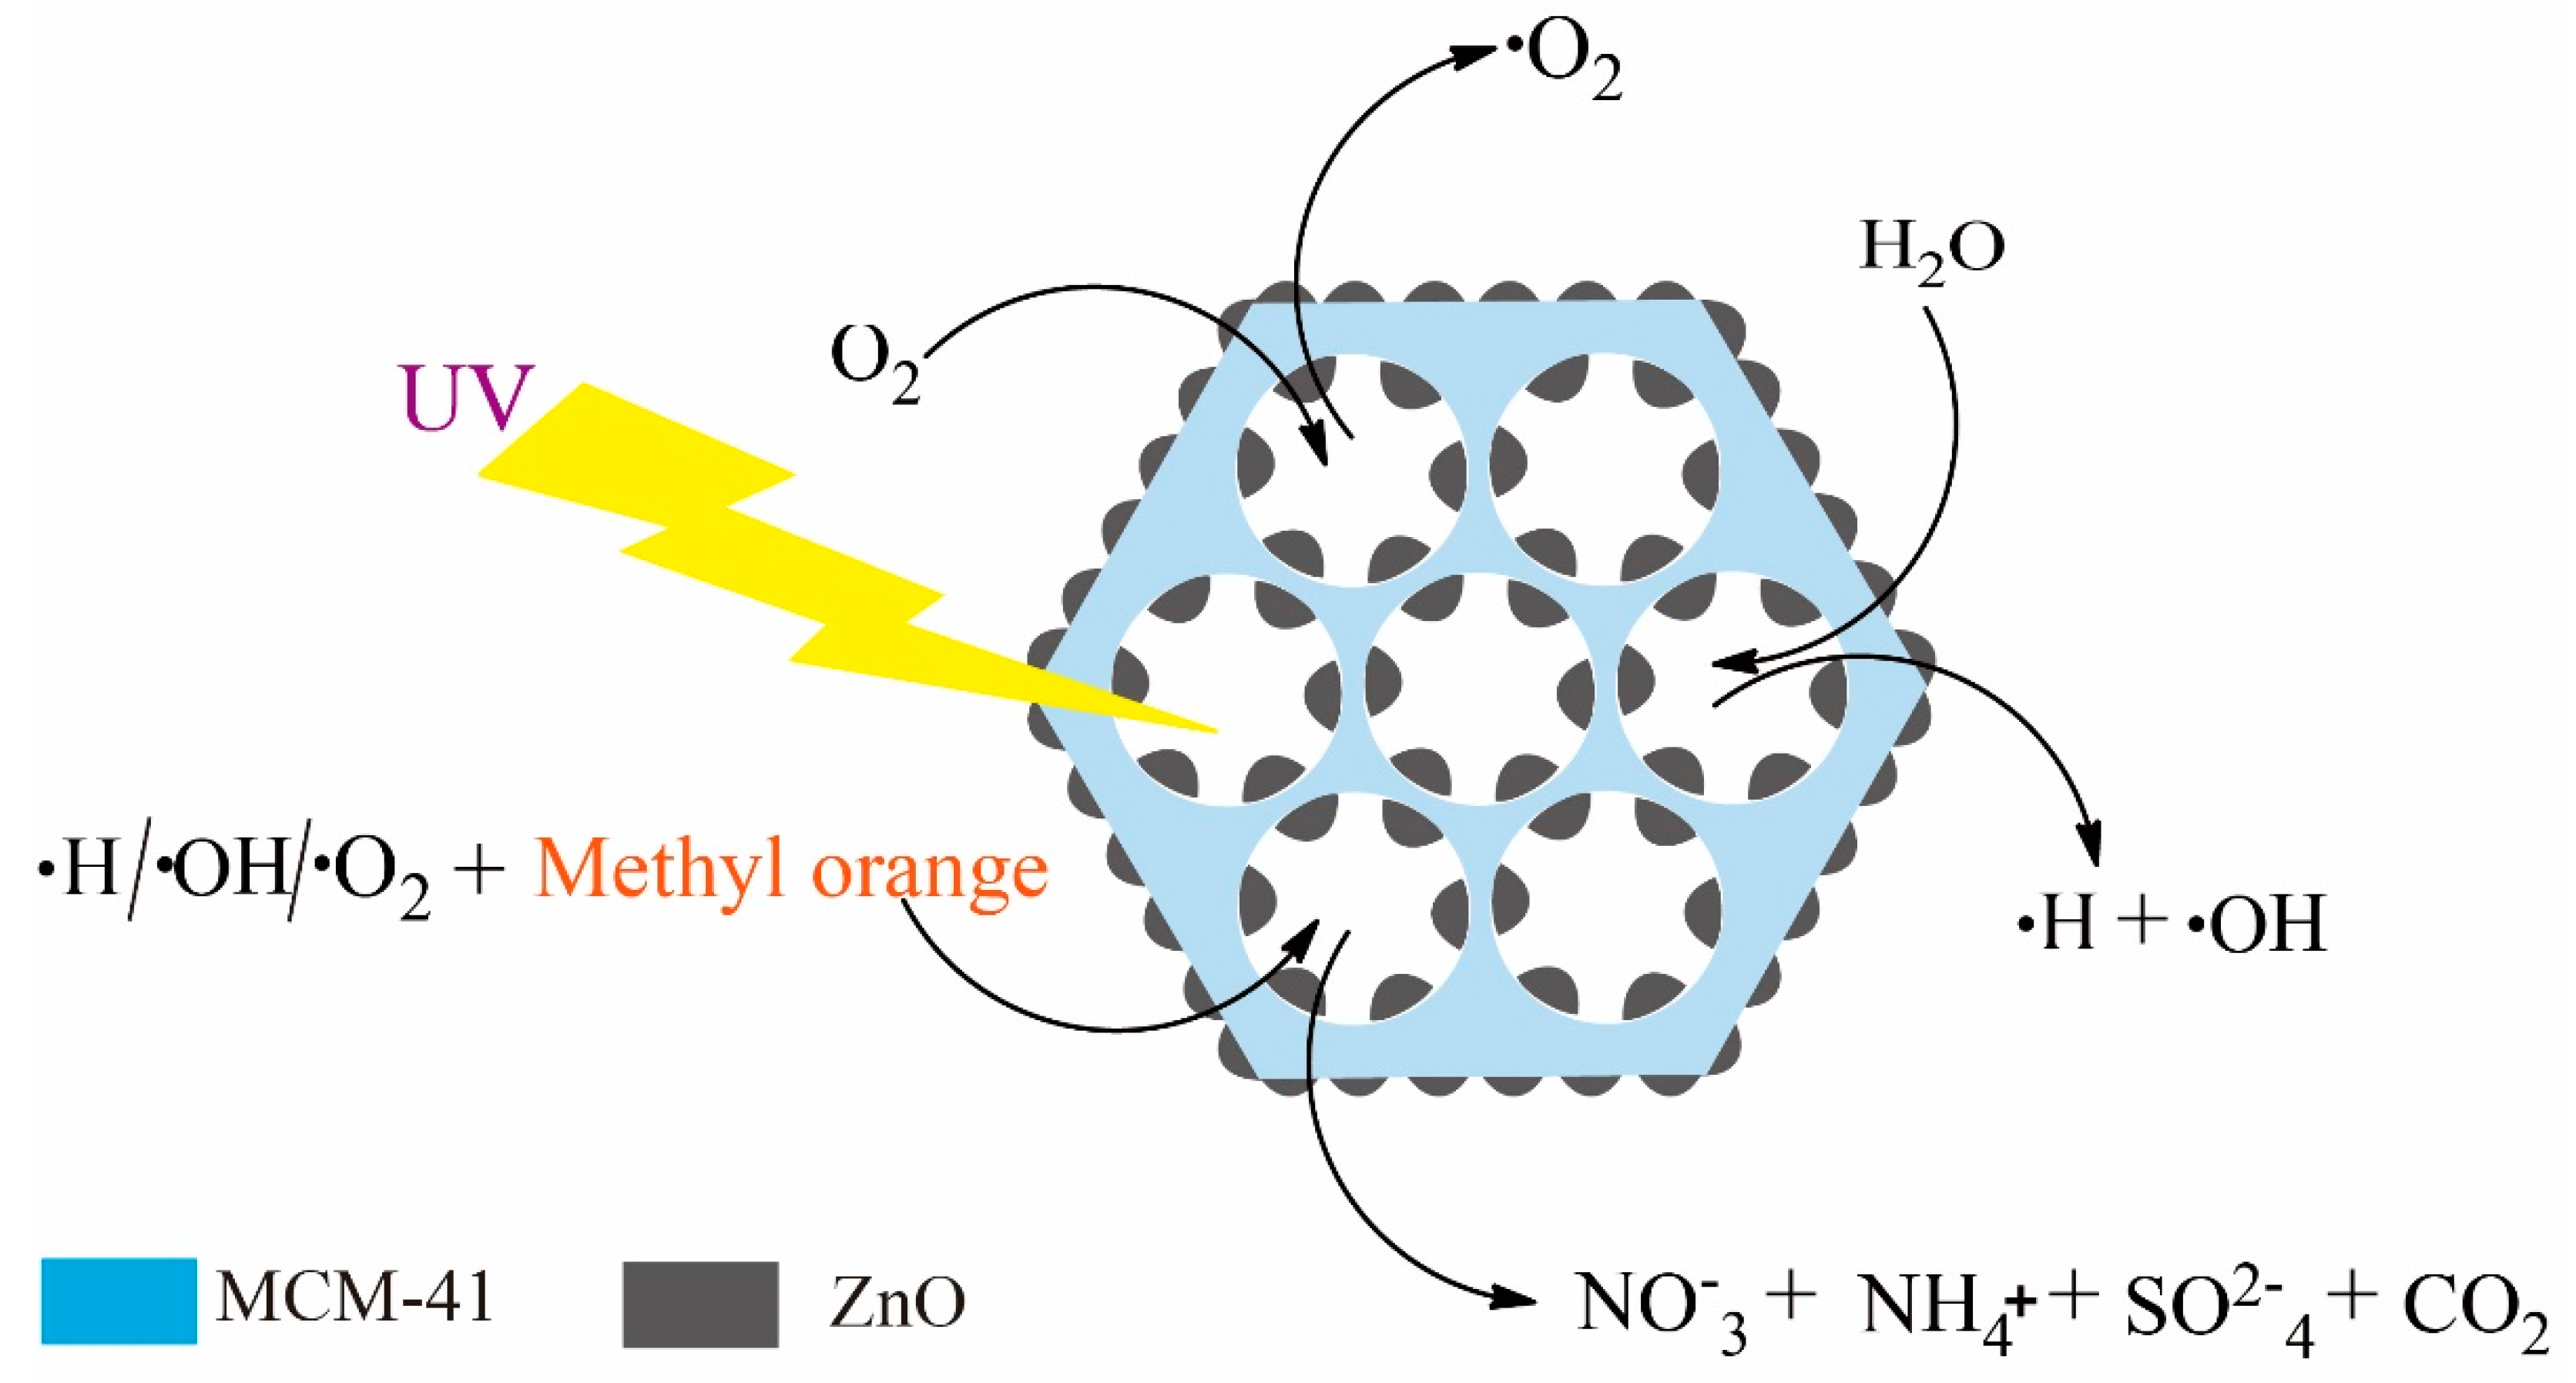
3.4. Degradation Mechanism
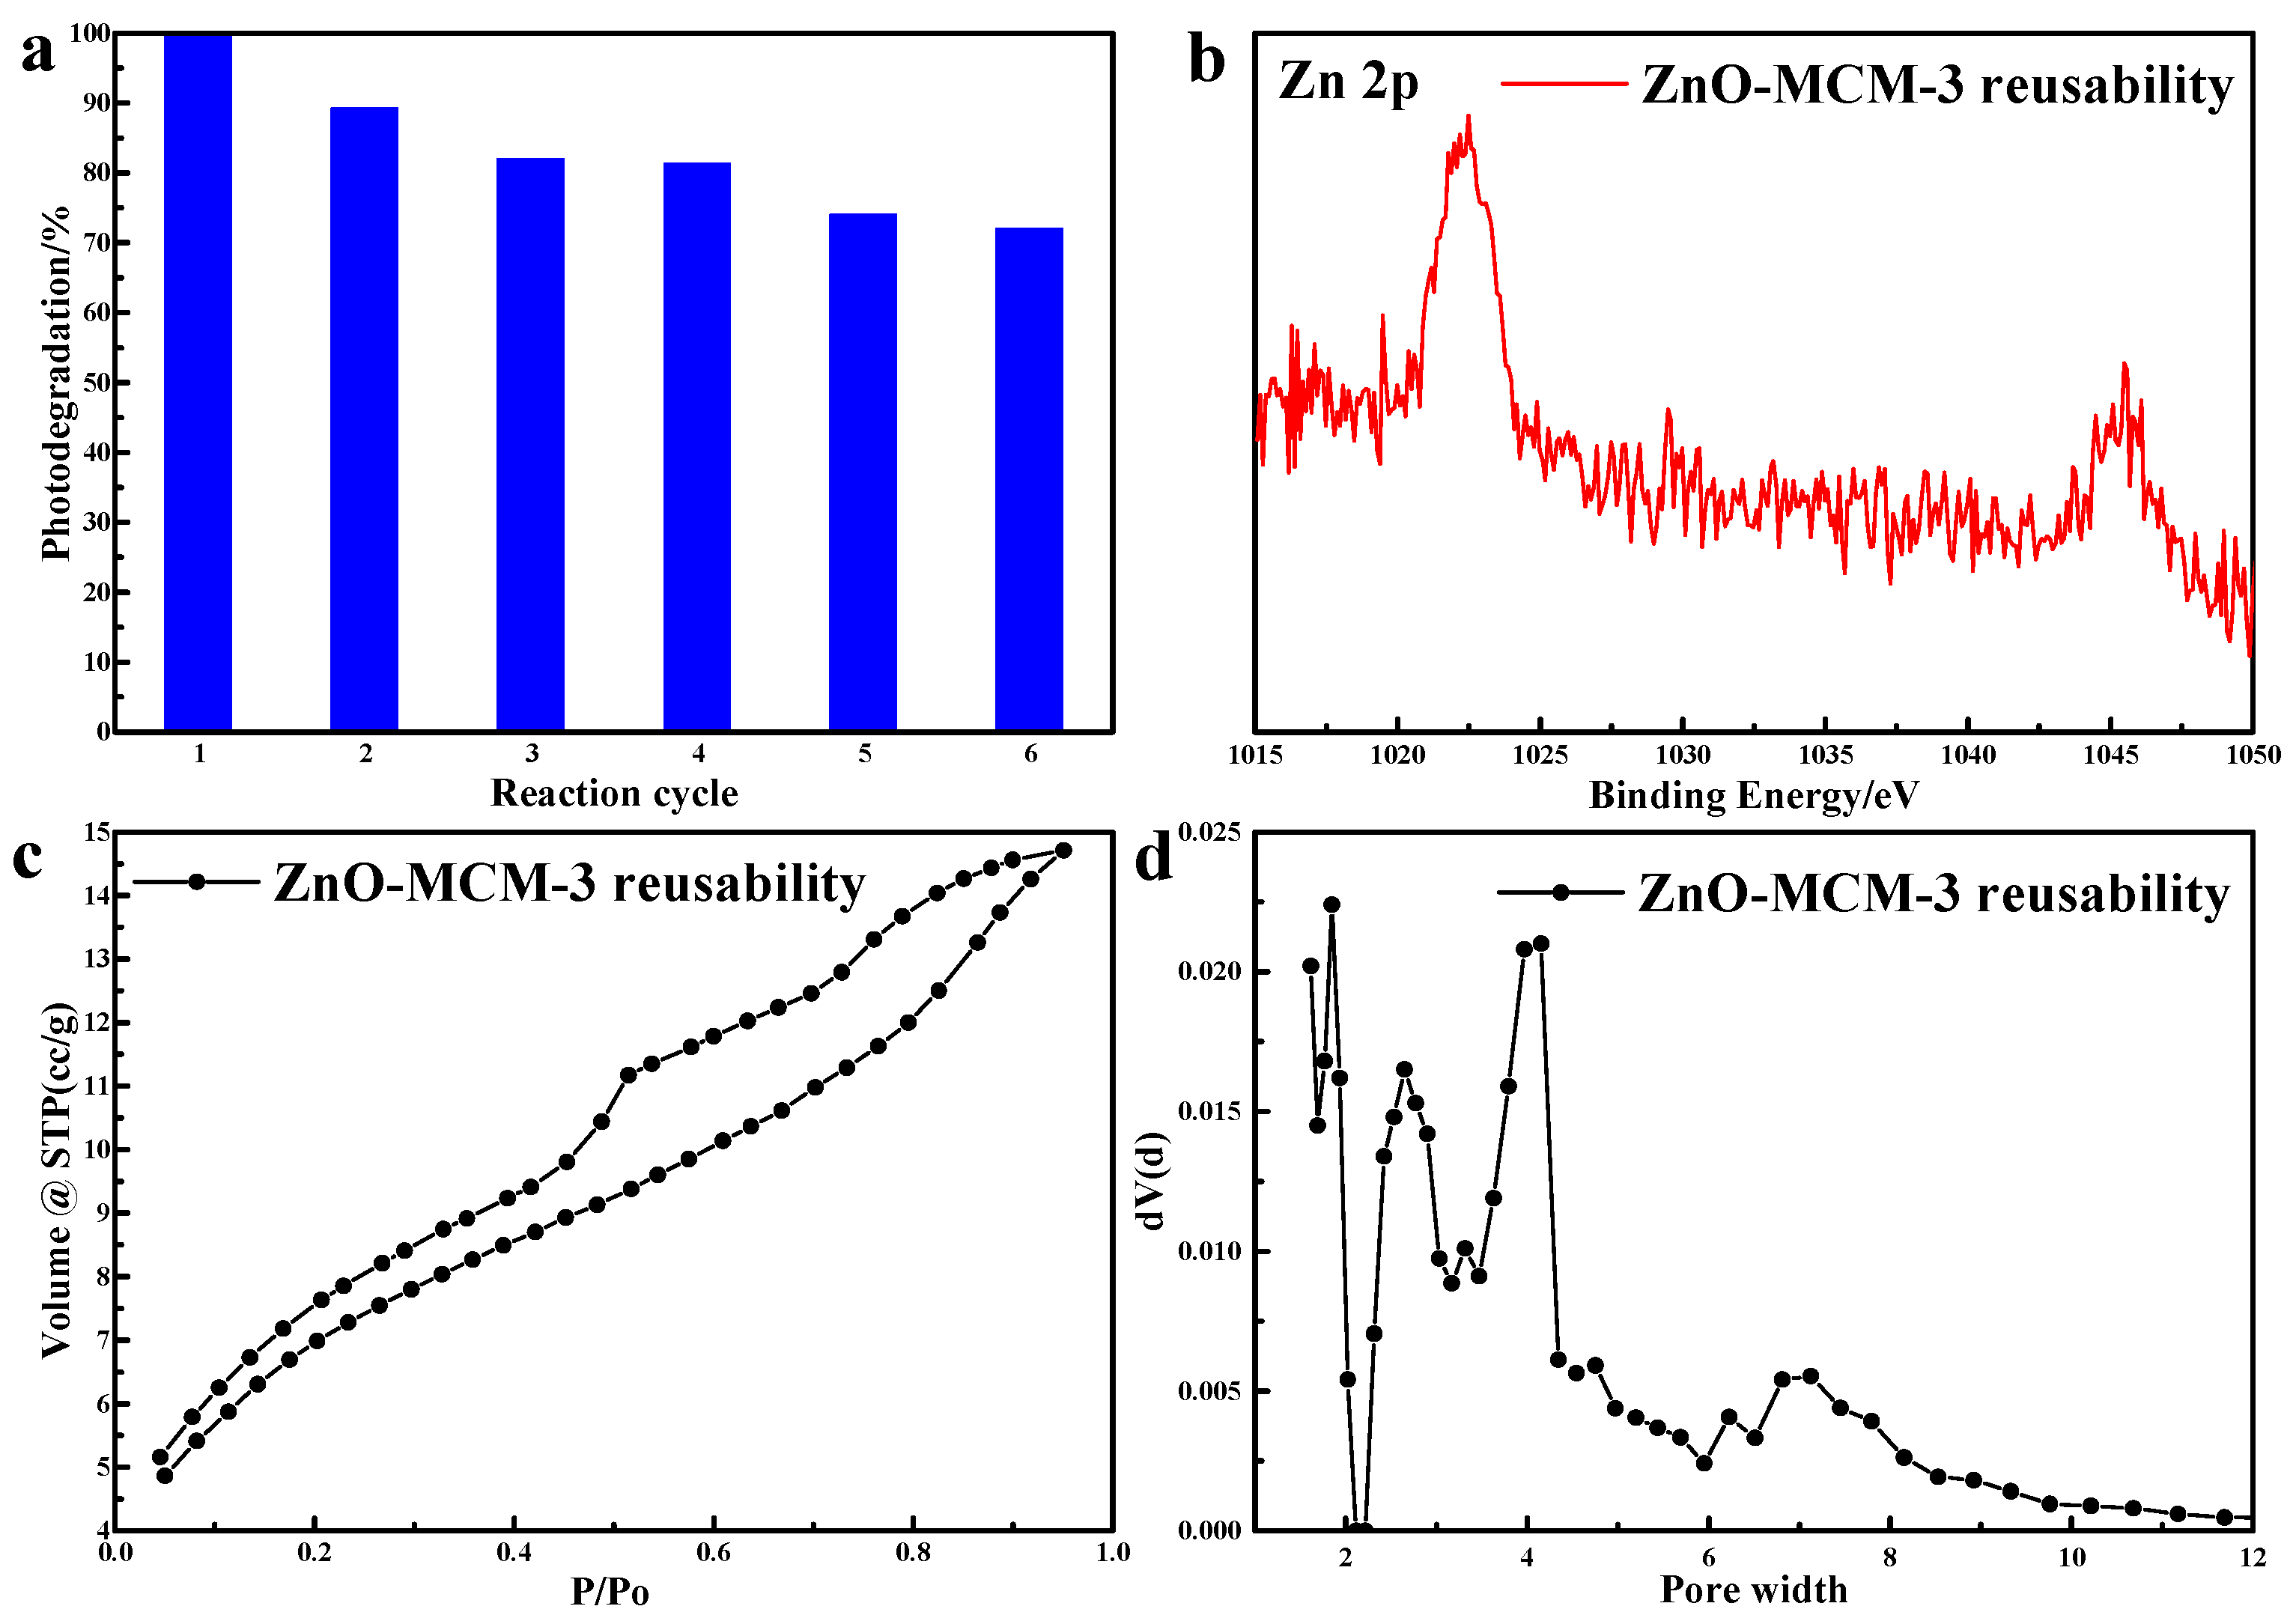
3.5. Reusability Performance
4. Conclusions
Author Contributions
Funding
Conflicts of Interest
References
- Lakshmi Kantam, M.; Kumar, K.B.S.; Sridhar, C. Nanocrystalline ZnO as an efficient heterogeneous catalyst for the synthesis of 5-Substituted 1H-Tetrazoles. Adv. Synth. Catal. 2005, 347, 1212–1214. [Google Scholar] [CrossRef]
- Chen, H.; Tang, M.; Rui, Z.; Wang, X.; Ji, H. ZnO modified TiO2 nanotube array supported Pt catalyst for HCHO removal under mild conditions. Catal. Today 2016, 264, 23–30. [Google Scholar] [CrossRef]
- Johar, M.A.; Afzal, R.A.; Alazba, A.A.; Manzoor, U. Photocatalysis and bandgap engineering using ZnO nanocomposites. Adv. Mater. Sci. Eng. 2015, 2015, 934587. [Google Scholar] [CrossRef]
- Hoseinzadeh, E.; Makhdoumi, P.; Taha, P.; Hossini, H.; Stelling, J.; Kamal, M.A.; Ashraf, G.M. A review on nano-antimicrobials: Metal nanoparticles, methods and mechanisms. Curr. Drug Metab. 2017, 18, 120–128. [Google Scholar] [CrossRef] [PubMed]
- Koch, U.; Fojtik, A.; Henglein, H.W.A.A. Photochemistry of semiconductor colloids. Preparation of extremely small ZnO particles, fluorescence phenomena and size quantization effects. Chem. Phys. Lett. 1985, 122, 507–510. [Google Scholar] [CrossRef]
- Lihitkar, P.B.; Violet, S.; Shirolkar, M.; Singh, J.; Srivastava, O.N.; Naik, R.H.; Kulkarni, S.K. Confinement of zinc oxide nanoparticles in ordered mesoporous silica MCM-41. Mater. Chem. Phys. 2012, 133, 850–856. [Google Scholar] [CrossRef]
- Sowri Babu, K.; Ramachandra Reddy, A.; Sujatha, C.; Venugopal Reddy, K. Effect of Mg doping on photoluminescence of ZnO/MCM-41 nanocomposite. Ceram. Int. 2012, 38, 5949–5956. [Google Scholar] [CrossRef]
- Lee, K.M.; Lai, C.W.; Ngai, K.S.; Juan, J.C. Recent developments of zinc oxide based photocatalyst in water treatment technology: A review. Water Res. 2016, 88, 428–448. [Google Scholar] [CrossRef] [PubMed]
- Mishra, Y.K.; Adelung, R. ZnO Tetrapod Materials for Functional Applications. Mater. Today 2017. [Google Scholar] [CrossRef]
- Yin, Q.; Qiao, R.; Li, Z.; Zhang, X.L.; Zhu, L. Hierarchical nanostructures of nickel-doped zinc oxide: Morphology controlled synthesis and enhanced visible-light photocatalytic activity. J. Alloys Compd. 2015, 618, 318–325. [Google Scholar] [CrossRef]
- Tamaddon, F.; Moradi, S. Controllable selectivity in Biginelli and Hantzsch reactions using nano ZnO as a structure base catalyst. J. Mol. Catal. A Chem. 2013, 370, 117–122. [Google Scholar] [CrossRef]
- Tamaddon, F.; Aboee, F.; Nasiri, A. ZnO nanofluid as a structure base catalyst for chemoselective amidation of aliphatic carboxylic acids. Catal. Commun. 2011, 16, 194–197. [Google Scholar] [CrossRef]
- Gupta, M.; Paul, S.; Gupta, R.; Loupy, A. ZnO: A versatile agent for benzylic oxidations. Tetrahedron Lett. 2005, 46, 4957–4960. [Google Scholar] [CrossRef]
- Bhuyan, D.; Saikia, M.; Saikia, L. ZnO nanoparticles embedded in SBA-15 as an efficient heterogeneous catalyst for the synthesis of dihydropyrimidinones via Biginelli condensation reaction. Microporous Mesoporous Mater. 2018, 256, 39–48. [Google Scholar] [CrossRef]
- Hou, Y.; Abdullah, H.; Kuo, D.; Leu, S.; Gultom, N.S.; Su, C. A comparison study of SiO2/nano metal oxide composite sphere for antibacterial application. Compos. Part B Eng. 2018, 133, 166–176. [Google Scholar] [CrossRef]
- Qin, P.; Yang, Y.; Zhang, X.; Niu, J.; Yang, H.; Tian, S.; Zhu, J.; Lu, M. Highly efficient, rapid, and simultaneous removal of cationic dyes from aqueous solution using monodispersed mesoporous silica nanoparticles as the adsorbent. Nanomaterials 2018, 8, 4. [Google Scholar] [CrossRef] [PubMed]
- Watermann, A.; Brieger, J. Mesoporous silica nanoparticles as drug delivery vehicles in cancer. Nanomaterials 2017, 7, 189. [Google Scholar] [CrossRef] [PubMed]
- Wagner, T.; Haffer, S.; Weinberger, C.; Klaus, D.; Tiemann, M. Mesoporous materials as gas sensors. Chem. Soc. Rev. 2013, 42, 4036–4053. [Google Scholar] [CrossRef] [PubMed]
- Jasiorski, M.; Leszkiewicz, A.; Brzeziński, S.; Bugla-Płoskońska, G.; Malinowska, G.; Borak, B.; Karbownik, I.; Baszczuk, A.; Stręk, W.; Doroszkiewicz, W. Textile with silver silica spheres: Its antimicrobial activity against Escherichia coli and Staphylococcus aureus. J. Sol-Gel Sci. Technol. 2009, 51, 330–334. [Google Scholar] [CrossRef]
- Reinosa, J.J.; Leretb, P.; Álvarez-Docioa, C.M.; Del Campoa, A.D.; Fernándeza, J.F. Enhancement of UV absorption behavior in ZnO–TiO2 composites. Bol. Soc. Esp. Ceram. Vidr. 2016, 55, 55–62. [Google Scholar] [CrossRef]
- Reinosaa, J.J.; Leretb, P.; Álvarez-Docioa, C.M.; Campoa, A.D.; Fernándeza, J.F. Hierarchical nano ZnO-micro TiO2 composites: High UV protection yield lowering photodegradation in sunscreens. Bol. Soc. Esp. Ceram. Vidr. 2018, 44, 2827–2834. [Google Scholar]
- Zhou, W.Z. Mesoporous crystals of transition metal oxides. Solid State Phenom. 2008, 140, 37–46. [Google Scholar] [CrossRef]
- Zhang, Y.; Xie, T.; Jiang, T.; Wei, X.; Pang, S.; Wang, X.; Wang, D. Surface photovoltage characterization of a ZnO nanowire array/CdS quantum dot heterogeneous film and its application for photovoltaic devices. Nanotechnology 2009, 20, 155707. [Google Scholar] [CrossRef] [PubMed]
- Baxter, J.B.; Aydil, E.S. Dye-sensitized solar cells based on semiconductor morphologies with ZnO nanowires. Sol. Energy Mater. Sol. Cells 2006, 90, 607–622. [Google Scholar] [CrossRef]
- Da’Na, E. Adsorption of heavy metals on functionalized-mesoporous silica: A review. Microporous Mesoporous Mater. 2017, 247, 145–157. [Google Scholar] [CrossRef]
- Nasreen, S.; Urooj, A.; Rafique, U.; Ehrman, S. Functionalized mesoporous silica: Absorbents for water purification. Desalin. Water Treat. 2016, 57, 29352–29362. [Google Scholar] [CrossRef]
- Chouyyok, W.; Shin, Y.; Davidson, J.; Samuels, W.D.; Lafemina, N.H.; Rutledge, R.D.; Fryxell, G.E.; Sangvanich, T.; Yantasee, W. Selective removal of copper(II) from natural waters by nanoporous sorbents functionalized with chelating diamines. Environ. Sci. Technol. 2010, 44, 6390–6395. [Google Scholar] [CrossRef] [PubMed]
- He, R.; Wang, Z.; Tan, L.; Zhong, Y.; Li, W.; Xing, D.; Wei, C.; Tang, Y. Design and fabrication of highly ordered ion imprinted SBA-15 and MCM-41 mesoporous organosilicas for efficient removal of Ni2+ from different properties of wastewaters. Microporous Mesoporous Mater. 2018, 257, 212–221. [Google Scholar] [CrossRef]
- Zhang, W.; Shi, J.; Wang, L.; Yan, D. Preparation and Characterization of ZnO Clusters inside Mesoporous Silica. Chem. Mater. 2000, 12, 1408–1413. [Google Scholar] [CrossRef]
- Chen, H. The preparation and photoluminescence properties of ZnO-MCM-41. Opt. Mater. 2004, 25, 79–84. [Google Scholar] [CrossRef]
- Haggag, S.M.S.; Abdel-Hamid, I.A.M. A tridentate (O, N, O) donor Schiff base zinc(II) nano complex. J. Therm. Anal. Calorim. 2015, 119, 737–746. [Google Scholar] [CrossRef]
- Mureseanu, M.; Reiss, A.; Stefanescu, I.; David, E.; Parvulescu, V.; Renard, G.; Hulea, V. Modified SBA-15 mesoporous silica for heavy metal ions remediation. Chemosphere 2008, 73, 1499–1504. [Google Scholar] [CrossRef] [PubMed]
- Khalaji, A.D.; Nikookar, M.; Das, D. Co(III), Ni(II), and Cu(II) complexes of bidentate N,O-donor Schiff base ligand derived from 4-methoxy-2-nitroaniline and salicylaldehyde. J. Therm. Anal. Calorim. 2014, 115, 409–417. [Google Scholar] [CrossRef]
- Li, H.; You, Z.; Zhang, C.; Yang, M.; Gao, L.; Wang, L. Zinc and thiocyanate-mediated oxazolidine ring formation in a trinuclear zinc(II) complex: Synthesis, structure, and properties. Inorg. Chem. Commun. 2013, 29, 118–122. [Google Scholar] [CrossRef]
- Hoffmann, F.; Cornelius, M.; Morell, J.; Fröba, M. Silica-based mesoporous organic–inorganic hybrid materials. Angew. Chem. Int. Ed. 2006, 45, 3216–3251. [Google Scholar] [CrossRef] [PubMed]
- Jantawasu, P.; Sreethawong, T.; Chavadej, S. Photocatalytic activity of nanocrystalline mesoporous-assembled TiO2 photocatalyst for degradation of methyl orange monoazo dye in aqueous wastewater. Chem. Eng. J. 2009, 155, 223–233. [Google Scholar] [CrossRef]
- Rostamizadeh, S.; Nojavan, M. An environmentally benign multicomponent synthesis of some novel 2-Methylthio pyrimidine derivatives using MCM-41-NH2 as nanoreactor and nanocatalyst. J. Heterocycl. Chem. 2014, 51, 418–422. [Google Scholar] [CrossRef]
- He, L.; Huang, Y.; Zhu, H.; Pang, G.; Zheng, W.; Wong, Y.; Chen, T. Cancer-targeted monodisperse mesoporous silica nanoparticles as carrier of ruthenium polypyridyl complexes to enhance theranostic effects. Adv. Funct. Mater. 2014, 24, 2754–2763. [Google Scholar] [CrossRef]
- Jiang, Q.; Wu, Z.Y.; Wang, Y.M.; Cao, Y.; Zhou, C.F.; Zhu, J.H. Fabrication of photoluminescent ZnO/SBA-15 through directly dispersing zinc nitrate into the as-prepared mesoporous silica occluded with template. J. Mater. Chem. 2006, 16, 1536–1542. [Google Scholar] [CrossRef]
- Pourdayhimi, P.; Koh, P.W.; Salleh, M.M.; Nur, H.; Lee, S.L. Zinc oxide nanoparticles-immobilized mesoporous hollow silica spheres for photodegradation of sodium dodecylbenzenesulfonate. Aust. J. Chem. 2016, 69, 790–797. [Google Scholar] [CrossRef]
- Zhou, W.Z.; Zhao, D.Y.; Wan, Y. Ordered Mesoporous Molecular Sieve Materials; Liu, J.B., Ed.; Higher Education Press: Beijing, China, 2013. [Google Scholar]
- Kang, J.; Park, J.; Kim, J.; Lee, C.; Kim, S. Surface functionalization of mesoporous silica MCM-41 with 3-aminopropyltrimethoxysilane for dye removal: Kinetic, equilibrium, and thermodynamic studies. Desalin. Water Treat. 2015, 57, 7066–7078. [Google Scholar] [CrossRef]
- Budi Hartono, S.; Qiao, S.; Jack, K.; Ladewig, B.P.; Hao, Z.; Lu, G.M. Improving adsorbent properties of cage-like ordered amine functionalized mesoporous silica with very large pores for bioadsorption. Langmuir 2009, 25, 6413–6424. [Google Scholar] [CrossRef] [PubMed]
- Moosavi, A.; Sarrafi, M.; Aghaei, A.; Hessari, F.A.; Keyanpour-Rad, M. Synthesis of mesoporous ZnO/SBA-15 composite via sonochemical route. Micro Nano Lett. 2012, 7, 130–133. [Google Scholar] [CrossRef]
- Babu, K.S.; Reddy, A.R.; Sujatha, C.; Reddy, K.V. Effects of precursor, temperature, surface area and excitation wavelength on photoluminescence of ZnO/mesoporous silica nanocomposite. Ceram. Int. 2013, 39, 3055–3064. [Google Scholar] [CrossRef]
- Jeong, B.; Kim, D.H.; Park, E.J.; Jeong, M.; Kim, K.; Seo, H.O.; Kim, Y.D.; Uhm, S. ZnO shell on mesoporous silica by atomic layer deposition: Removal of organic dye in water by an adsorbent and its photocatalytic regeneration. Appl. Surf. Sci. 2014, 307, 468–474. [Google Scholar] [CrossRef]
- Yantasee, W.; Lin, Y.; Fryxell, G.E.; Busche, B.J.; Birnbaum, J.C. Removal of heavy metals from aqueous solution using novel nanoengineered sorbents: Self-assembled carbamoylphosphonic acids on mesoporous Silica. Sep. Sci. Technol. 2003, 15, 3809–3825. [Google Scholar] [CrossRef]
- Rakhshaei, R.; Namazi, H. A potential bioactive wound dressing based on carboxymethyl cellulose/ZnO impregnated MCM-41 nanocomposite hydrogel. Mater. Sci. Eng. C 2017, 73, 456–464. [Google Scholar] [CrossRef] [PubMed]
- Bhattacharjee, S. DLS and zeta potential—What they are and what they are not? J. Control. Release 2016, 235, 337–351. [Google Scholar] [CrossRef] [PubMed]
- Dai, P.; Yan, T.; Yu, X.; Bai, Z.; Wu, M. Two-solvent method synthesis of NiO/ZnO nanoparticles embedded in mesoporous SBA-15: Photocatalytic properties study. Nanoscale Res. Lett. 2016, 11, 226. [Google Scholar] [CrossRef] [PubMed]
- Kaur, A.; Ibhadon, A.O.; Kansal, S.K. Photocatalytic degradation of ketorolac tromethamine (KTC) using Ag-doped ZnO microplates. J. Mater. Sci. 2017, 52, 5256–5267. [Google Scholar] [CrossRef]
- Chen, H.Y.; Lin, Y.S.; Zhou, H.J.; Zhou, X.H.; Gong, S.; Xu, H. Synthesis and characterization of chlorpyrifos/copper(II) schiff base mesoporous silica with pH sensitivity for pesticide sustained release. J. Agric. Food Chem. 2016, 64, 8095–8102. [Google Scholar] [CrossRef] [PubMed]
- Volokitin, Y.; Sinzig, J.; de Jongh, L.J.; Schmid, G.; Vargaftik, M.N.; Moiseevi, I.I. Quantum-size effects in the thermodynamic properties of metallic nanoparticles. Nature 1996, 384, 621. [Google Scholar] [CrossRef]
- Tayebee, R.; Javadi, F.; Argi, G. Easy single-step preparation of ZnO nano-particles by sedimentation method and studying their catalytic performance in the synthesis of 2-aminothiophenes via Gewald reaction. J. Mol. Catal. A Chem. 2013, 368–369, 16–23. [Google Scholar] [CrossRef]
- Raza, W.; Haque, M.M.; Muneer, M. Synthesis of visible light driven ZnO: Characterization and photocatalytic performance. Appl. Surf. Sci. 2014, 322, 215–224. [Google Scholar] [CrossRef]
- Liu, C.; Lai, N.; Liou, S.; Chu, M.; Chen, C.; Yang, C. Deposition and thermal transformation of metal oxides in mesoporous SBA-15 silica with hydrophobic mesopores. Microporous Mesoporous Mater. 2013, 179, 40–47. [Google Scholar] [CrossRef]
- Nekouei, F.; Nekouei, S. Comparative study of photocatalytic activities of Zn5(OH)8Cl2·H2O and ZnO nanostructures in ciprofloxacin degradation: Response surface methodology and kinetic studies. Sci. Total Environ. 2017, 601–602, 508–517. [Google Scholar] [CrossRef] [PubMed]
- Assi, N.; Azar, P.A.; Tehrani, M.S.; Husain, S.W. Studies on photocatalytic performance and photodegradation kinetics of zinc oxide nanoparticles prepared by microwave-assisted sol–gel technique using ethylene glycol. J. Iran. Chem. Soc. 2016, 13, 1593–1602. [Google Scholar] [CrossRef]
- Keng, P.; Lee, S.; Ha, S.; Hung, Y.; Ong, S. Cheap materials to clean heavy metal polluted waters. In Green Materials for Energy, Products and Depollution; Lichtfouse, E., Ed.; Springer Press: Berlin, Germany, 2013. [Google Scholar]
- Wang, J.; Jiang, Z.; Zhang, L.; Kang, P.; Xie, Y.; Lv, Y.; Xu, R.; Zhang, X. Sonocatalytic degradation of some dyestuffs and comparison of catalytic activities of nano-sized TiO2, nano-sized ZnO and composite TiO2/ZnO powders under ultrasonic irradiation. Ultrason. Sonochem. 2009, 16, 225–231. [Google Scholar] [CrossRef] [PubMed]
- Lin, J.; Zhao, X.; Liu, D.; Yu, Z.; Zhang, Y.; Xu, H. The decoloration and mineralization of azo dye C.I. Acid Red 14 by sonochemical process: Rate improvement via Fenton’s reactions. J. Hazard. Mater. 2008, 157, 541–546. [Google Scholar] [CrossRef] [PubMed]
- Joseph, J.M.; Destaillats, H.; Hung, H.; Hoffmann, M.R. The sonochemical degradation of azobenzene and related azo dyes: Rate enhancements via fenton’s reactions. J. Phys. Chem. A 2000, 104, 301–307. [Google Scholar] [CrossRef]
- Nam, S.; Han, S.; Kang, J.; Choi, H. Kinetics and mechanisms of the sonolytic destruction of non-volatile organic compounds: Investigation of the sonochemical reaction zone using several OH monitoring techniques. Ultrason. Sonochem. 2003, 10, 139–147. [Google Scholar] [CrossRef]
- Okitsu, K.; Nanzai, B.; Kawasaki, K.; Takenaka, N.; Bandow, H. Sonochemical decomposition of organic acids in aqueous solution: Understanding of molecular behavior during cavitation by the analysis of a heterogeneous reaction kinetics model. Ultrason. Sonochem. 2009, 16, 155–162. [Google Scholar] [CrossRef] [PubMed]
- Serpone, N.; Terzian, R.; Hidaka, H.; Pelizzetti, E. Ultrasonic induced dehalogenation and oxidation of 2-, 3-, and 4-chlorophenol in air-equilibrated aqueous media. Similarities with irradiated semiconductor particulates. J. Phys. Chem. 1994, 98, 2634–2640. [Google Scholar] [CrossRef]
- Tani, T.; Mädler, L.; Pratsinis, S. Homogeneous ZnO nanoparticles by flame spray pyrolysis. J. Nanopart. Res. 2002, 4, 337–343. [Google Scholar] [CrossRef]
- Mishra, Y.K.; Modi, G.; Cretu, V.; Postica, V.; Lupan, O.; Reimer, T.; Paulowicz, I.; Hrkac, V.; Benecke, W.; Kienle, L.; et al. Direct growth of freestanding ZnO tetrapod networks for multifunctional applications in photocatalysis, UV photodetection, and gas sensing. ACS Appl. Mater. Interfaces 2015, 7, 14303–14316. [Google Scholar] [CrossRef] [PubMed]
- Liqiang, J.; Yichun, Q.; Baiqi, W.; Shudan, L.; Baojiang, J.; Libin, Y.; Wei, F.; Honggang, F.; Jiazhong, S. Review of photoluminescence performance of nano-sized semiconductor materials and its relationships with photocatalytic activity. Sol. Energy Mater. Sol. Cells 2006, 90, 1773–1787. [Google Scholar] [CrossRef]
- Augugliaro, V.; Bellardita, M.; Loddo, V.; Palmisano, G.; Palmisano, L.; Yurdakal, S. Overview on oxidation mechanisms of organic compounds by TiO2 in heterogeneous photocatalysis. J. Photochem. Photobiol. C 2012, 13, 224–245. [Google Scholar] [CrossRef]


| Materials | Surface Area (m2/g) | Pore Diameter Dv (nm) | Pore Volume (m3/g) |
|---|---|---|---|
| MCM | 1187.377 | 2.444 | 0.993 |
| ZnO-MCM-0 | 625.657 | 0.887 | 0.429 |
| Sal-MCM-3 | 453.385 | 1.934 | 0.388 |
| ZnO-MCM-3 | 739.543 | 2.180 | 0.547 |
| Sal-MCM-9 | 634.437 | 1.932 | 0.478 |
| ZnO-MCM-9 | 848.967 | 2.176 | 0.682 |
| Materials | MCM-41 | Sal-MCM-3 | ZnO-MCM-3 |
|---|---|---|---|
| Zeta Potential (mV) | −35.38 | 40.08 | −23.08 |
| Material | BE/eV | Atomic/% | ||||
|---|---|---|---|---|---|---|
| Zn 2p | N 1s | Si 2p | O 1s | Zn 2p | Zn 2p3s | |
| MCM | - | - | 103.83 | 533.19 | - | - |
| Sal-MCM-3 | - | 399.44 | 102.63 | 532.20 | - | - |
| Sal-MCM-9 | - | 401.87 | 102.47 | 532.09 | - | - |
| Zn/Sal-MCM-3 | 1021.26 | 400.14 | 102.40 | 532.17 | - | 0.334 |
| Zn/Sal-MCM-9 | 1021.75 | 401.14 | 102.54 | 532.24 | - | 0.415 |
| ZnO-MCM-0 | 1017.90 | - | 103.81 | 533.18 | 0.39 | - |
| ZnO-MCM-3 | 1022.27 | - | 102.84 | 532.19 | 2.03 | - |
| ZnO-MCM-9 | 1022.90 | - | 103.29 | 532.67 | 1.27 | - |
| Kinetic Models | Fitting Equation | R2 |
|---|---|---|
| pseudo first-order | 0.98225 | |
| 0.97787 | ||
| 0.99306 | ||
| pseudo second-order | 0.99913 | |
| 0.74946 | ||
| 0.93623 |
| Materials | Surface Area (m2/g) | Pore Diameter Dv (nm) | Pore Volume (m3/g) |
|---|---|---|---|
| ZnO-MCM-3 | 739.543 | 2.180 | 0.547 |
| Reusable ZnO-MCM-3 | 420.100 | 3.043 | 0.233 |
| Material | BE/eV | Atomic/% | |||
|---|---|---|---|---|---|
| Zn 2p | N 1s | Si 2p | O 1s | Zn 2p | |
| ZnO-MCM-3 | 1022.27 | - | 102.84 | 532.19 | 2.03 |
| Reusable ZnO-MCM-3 | 1022.37 | - | 102.92 | 531.89 | 0.63 |
© 2018 by the authors. Licensee MDPI, Basel, Switzerland. This article is an open access article distributed under the terms and conditions of the Creative Commons Attribution (CC BY) license (http://creativecommons.org/licenses/by/4.0/).
Share and Cite
Shen, Z.; Zhou, H.; Chen, H.; Xu, H.; Feng, C.; Zhou, X. Synthesis of Nano-Zinc Oxide Loaded on Mesoporous Silica by Coordination Effect and Its Photocatalytic Degradation Property of Methyl Orange. Nanomaterials 2018, 8, 317. https://doi.org/10.3390/nano8050317
Shen Z, Zhou H, Chen H, Xu H, Feng C, Zhou X. Synthesis of Nano-Zinc Oxide Loaded on Mesoporous Silica by Coordination Effect and Its Photocatalytic Degradation Property of Methyl Orange. Nanomaterials. 2018; 8(5):317. https://doi.org/10.3390/nano8050317
Chicago/Turabian StyleShen, Zhichuan, Hongjun Zhou, Huayao Chen, Hua Xu, Chunhua Feng, and Xinhua Zhou. 2018. "Synthesis of Nano-Zinc Oxide Loaded on Mesoporous Silica by Coordination Effect and Its Photocatalytic Degradation Property of Methyl Orange" Nanomaterials 8, no. 5: 317. https://doi.org/10.3390/nano8050317
APA StyleShen, Z., Zhou, H., Chen, H., Xu, H., Feng, C., & Zhou, X. (2018). Synthesis of Nano-Zinc Oxide Loaded on Mesoporous Silica by Coordination Effect and Its Photocatalytic Degradation Property of Methyl Orange. Nanomaterials, 8(5), 317. https://doi.org/10.3390/nano8050317