Article

Phenanthroline-Derivative Functionalized Carbon Dots for Highly Selective and Sensitive Detection of Cu2+ and S2− and Imaging inside Live Cells

1
College of Chemistry and Chemical Engineering, Henan Polytechnic University, Jiaozuo 454003, China
2
Henan Key Laboratory of Coal Green Conversion, Jiaozuo 454003, China
*
Authors to whom correspondence should be addressed.
Nanomaterials 2018, 8(12), 1071; https://doi.org/10.3390/nano8121071
Submission received: 8 November 2018 / Revised: 2 December 2018 / Accepted: 17 December 2018 / Published: 19 December 2018

Abstract

:
Developing effective methods for the instant detection of Cu2+ and S2− is highly desired in the biological and environmental fields. Herein, a novel fluorescent nanoprobe was elaborately designed and synthesized by grafting a phenanthroline derivative onto the surface of carbon dots (CDs). The obtained functionalized CDs (FCDs) exhibited blue fluorescence (FL) with excellent photostability and possessed a mean diameter around 4 nm. Cu2+ can be selectively captured by the phenanthroline group of FCDs to generate an absorptive complex in situ, leading to obvious quenching of the FCDs’ FL signal through an inner filter effect. Furthermore, the FL of the FCD–Cu2+ can be effectively recovered by S2− anions due to the release of FCDs from the FCD–Cu2+ complex owing to the formation of stable CuS (Ksp = 1.27 × 10−36) between S2− and Cu2+. The detection limits of the FCDs were determined to be 40.1 nM and 88.9 nM for Cu2+ and S2−, respectively. Moreover, this nanoprobe can also be used for the imaging of intracellular Cu2+ and S2−, which shows strong application prospects in the field of biology.

1. Introduction

Copper ion (Cu2+) and sulfide anion (S2−) have attracted increasing attention in recent years owing to their vital roles in various pathological/physiological processes and their being highly toxic to the environment and human health [1,2]. As an essential metal in biological systems, copper acts as a cofactor for many enzymes and proteins, and thus abnormal levels of Cu2+ may cause neurological problems or damage to livers and kidneys [1]. Meanwhile, Cu2+ is also a priority pollutant as listed by the US Environmental Protection Agency (EPA) [3]. Similarly, S2− is a well-known toxic pollutant for the environment [4] and an important anion in biological organisms [5]. Exposure to high concentrations of S2− can induce unconsciousness and suffocation [6], while unbalanced S2− levels in life systems are related to multiple diseases, for instance, Alzheimer’s disease and diabetes [7]. Developing simple and effective methods for the instant detection of Cu2+ and S2− is highly desirable in biological and environmental fields.
To date, many methods have been developed for the detection of Cu2+ and S2−, including electrochemical methods [8,9], inductively coupled plasma atomic emission spectroscopy [10,11], fluorescence (FL) spectrometry [12,13,14], and others. Among those analytical methods, combining FL spectrometry with specific fluorescent sensors has become a promising way to detect Cu2+ and S2− because of its non-invasive, economic, real-time, highly selective, and sensitive properties. Recently, various fluorescent sensors have been synthesized for the monitoring of Cu2+ or S2− [12,13,14]. However, most of these reported sensors were fabricated on the base of conventional fluorescence materials, such as organic dye molecules or semiconductor quantum dots (QDs) [13,14]. The poor luminescence stability of organic dye molecules [15] and the high toxicity of semiconductor QDs [16] severely restrict their practical applications. Very recently, carbon dots (CDs), as a new family member of carbon nanomaterials, have emerged as promising photoluminescent nanoparticles due to their outstanding properties such as nontoxicity, FL stability, high biocompatibility, water solubility, and facile preparation [17,18]. With these features, CDs exhibit prospective applications in sensing [19,20], FL markers [21], drug delivery [22], and bioimaging [23]. However, it is worth noting that pristine CDs usually show unsatisfactory selectivity or have very limited analytes in sensing applications [7,24,25]. Therefore, it is very important to integrate highly specific recognition molecules into CDs to extend their sensing applications.
We grafted (2,3-f)-Pyrazino(1,10)phenanthroline-2,3-dicarboxylic acid (PPDA), a molecule specific for Cu2+ identification [26], onto the surface of carbon dots and provided an effective strategy for the detection and imaging of intracellular Cu2+ and S2−. The FL interactions between Cu2+ and the FCDs were investigated in detail. The phenanthroline groups of the functionalized QDs (FQDs) can selectively capture Cu2+ to generate an absorptive complex in situ, which can lead to an intense quenching of the FQDs’ FL through an inner filter effect [24]. Moreover, the FL of the FCD–Cu2+ can be effectively recovered by S2− anions due to the release of FCDs from the FCD–Cu2+ complex owing to the formation of stable CuS (Ksp = 1.27 × 10−36) (Figure 1) [27]. Furthermore, the FCDs showed remarkable FL stability and can be used for the imaging of intracellular Cu2+ and S2−. The comparison of several existing CD-based methods for Cu2+ or/and S2− detection is listed in Table S1, indicating the good sensitivity and other merits of our sensing system compared with previously reported sensing systems [6,7,27].

2. Materials and Methods

2.1. Materials

N-Hydroxysuccinimide (NHS, Energy Chemical, Shanghai, China), (2,3-f)-Pyrazino(1,10)phenanthroline-2,3-dicarboxy-lic acid (PPDA, Energy Chemical, Shanghai, China), Ethylenediamine (Energy Chemical), 1-(3-dimethylaminopropyl)-3-ethyl-carbodiimide hydro chloride (EDC, Energy Chemical, Shanghai, China), citric acid (Energy Chemical, Shanghai, China), HEPES (Energy Chemical, Shanghai, China), nitrate salts of metal ion and sodium salts of anion of analytic grade were used as received. HeLa cells (Human cervix carcinoma cell) were purchased from a cell bank in Shanghai (Shanghai, China).

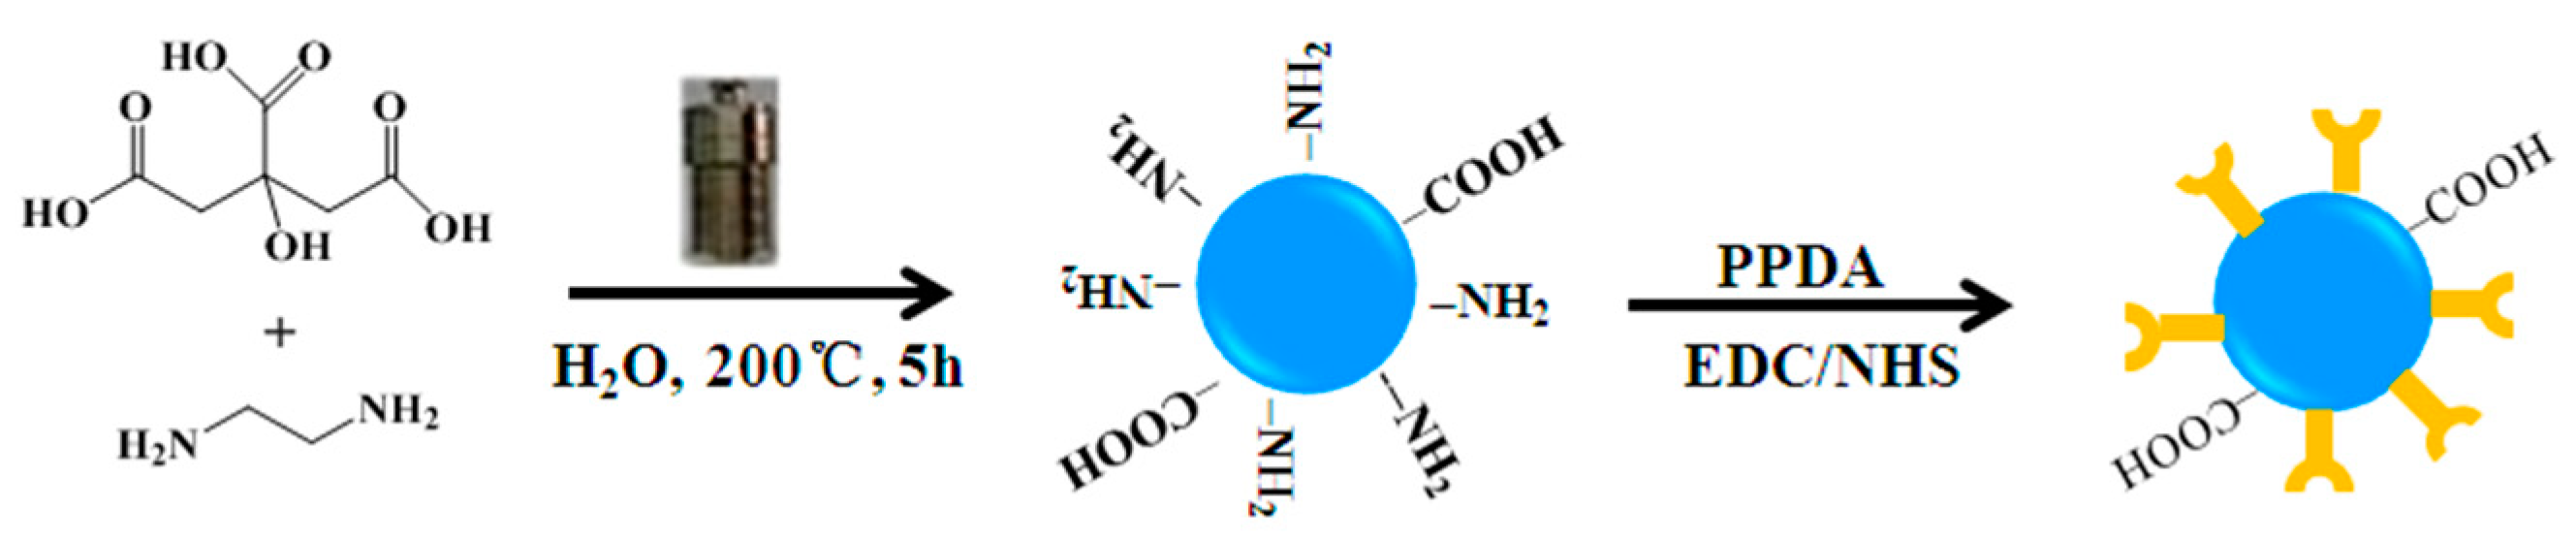
2.2. Preparation of CDs

The CDs were prepared according to a modified hydrothermal method [28]. Briefly, 1.0600 g citric acid and 340 μL ethylenediamine were added to 8 mL distilled water under drastically stirring. The generated clear solution was diverted to a Teflon-lined stainless steel vessel (23 mL) and heated at 200 °C for 5 h. Then the product was cooled naturally and subjected to dialysis. Redundant precursors were removed over 24 h via a cellulose membrane (MWCO 500) in pure water. After drying by lyophilization, CD powders were collected (yield: 46%).

2.3. Synthesis of PPDA-Functionalized CDs (FCDs)

The ligand PPDA (0.1 mmol) was dispersed in 10 mL of DMSO (Dimethyl sulfoxide), and then 0.2 mmol NHS and 0.2 mmol EDC were added to activate the carboxyl groups of the ligand. The mixtures were stirred for 2 days in the dark. Then, 10 mL aqueous solution of CDs (6 mg/L) was added dropwise to the mixture and the resulting solution was further stirred for 3 days at room temperature. Then, the reaction solution was dialyzed against water for 24 h to obtain the FCDs.

2.4. Characterization

The size distribution of the FCDs was measured by a Tecnai G2 F20 TEM characterization (FEI, Hillsboro, OR, USA). Absorption spectra were determined on a Perkin-Elmer-Lambda 900 spectrometer (PerkinElmer, Waltham, MA, USA). FL spectra were measured on a FluoroMax-P spectrophotometer (Horiba Jobin Yvon, Paris, France). Infrared spectra (IR) were measured on a Prestige IR21 FTIR spectrometer (Shimadzu, Kyoto, Japan).

2.5. Fluorescence Detection for Cu2+ and S2−

For the FL detection of Cu2+, different amounts of Cu2+ (0–50 µM) were added into FCDs dispersed in pH 7.4 HEPES buffered water. Different metal ions (Zn2+, Na+, Fe3+, Mg2+, Fe2+, Mn2+, Ni2+, Pb2+, Co2+, and Cd2+) were selected to assess the selectivity of the FCDs towards Cu2+.
For the monitoring of S2−, different amounts of S2− (0–20 µM) were added into a mixture of 20 µM of Cu2+ and FCDs dispersed in pH 7.4 HEPES buffered water. Different anions (F, Cl, HCO3, SO42−, NO3, CO32−, and HPO42−) were selected to evaluate the selectivity of the FCDs for S2−.
The following equation was used to calculate the limit of detection for Cu2+ (or S2−): the limit of detection = 3SB/S, where SB is standard error for the blank test and where S is the slope of the calibration curve.

2.6. Cell Culture and Fluorescence Imaging

HeLa cells were cultured in RPMI-1640 medium (a class of media developed by Roswell Park Memorial Institut) containing 1% of penicillin-streptomycin and 10% fetal bovine serum (FBS). The cells were grown at 37 °C in an incubator with a 5% CO2 atmosphere for 24 h. After removal of the culture medium, cells were incubated with the prepared FCD sensor in 2 mL fresh culture medium at 37 °C for 6 h. Then the medium was removed, and the cells were washed three times with phosphate buffer solution (PBS) to remove the residual nanoparticles. Subsequently, the cells were treated with a certain amount of Cu2+ (0, 50, and 100 µM) in 2 mL refresh medium at 37 °C for 1.5 h. After removing the medium and washing it three times with PBS, the cells were suspended in 0.5 mL of PBS and observed under an Olympus FV1000-IX81 laser confocal microscope (Olympus Corporation, Tokyo, Japan).
The S2− imaging experiments were performed using the same procedure as for Cu2+, except that cells were first treated using a medium containing the sensor FCD–Cu2+ and then by S2− (0, 75, and 150 µM each). Blue emissions from FCDs was excited at 405 nm.

3. Results

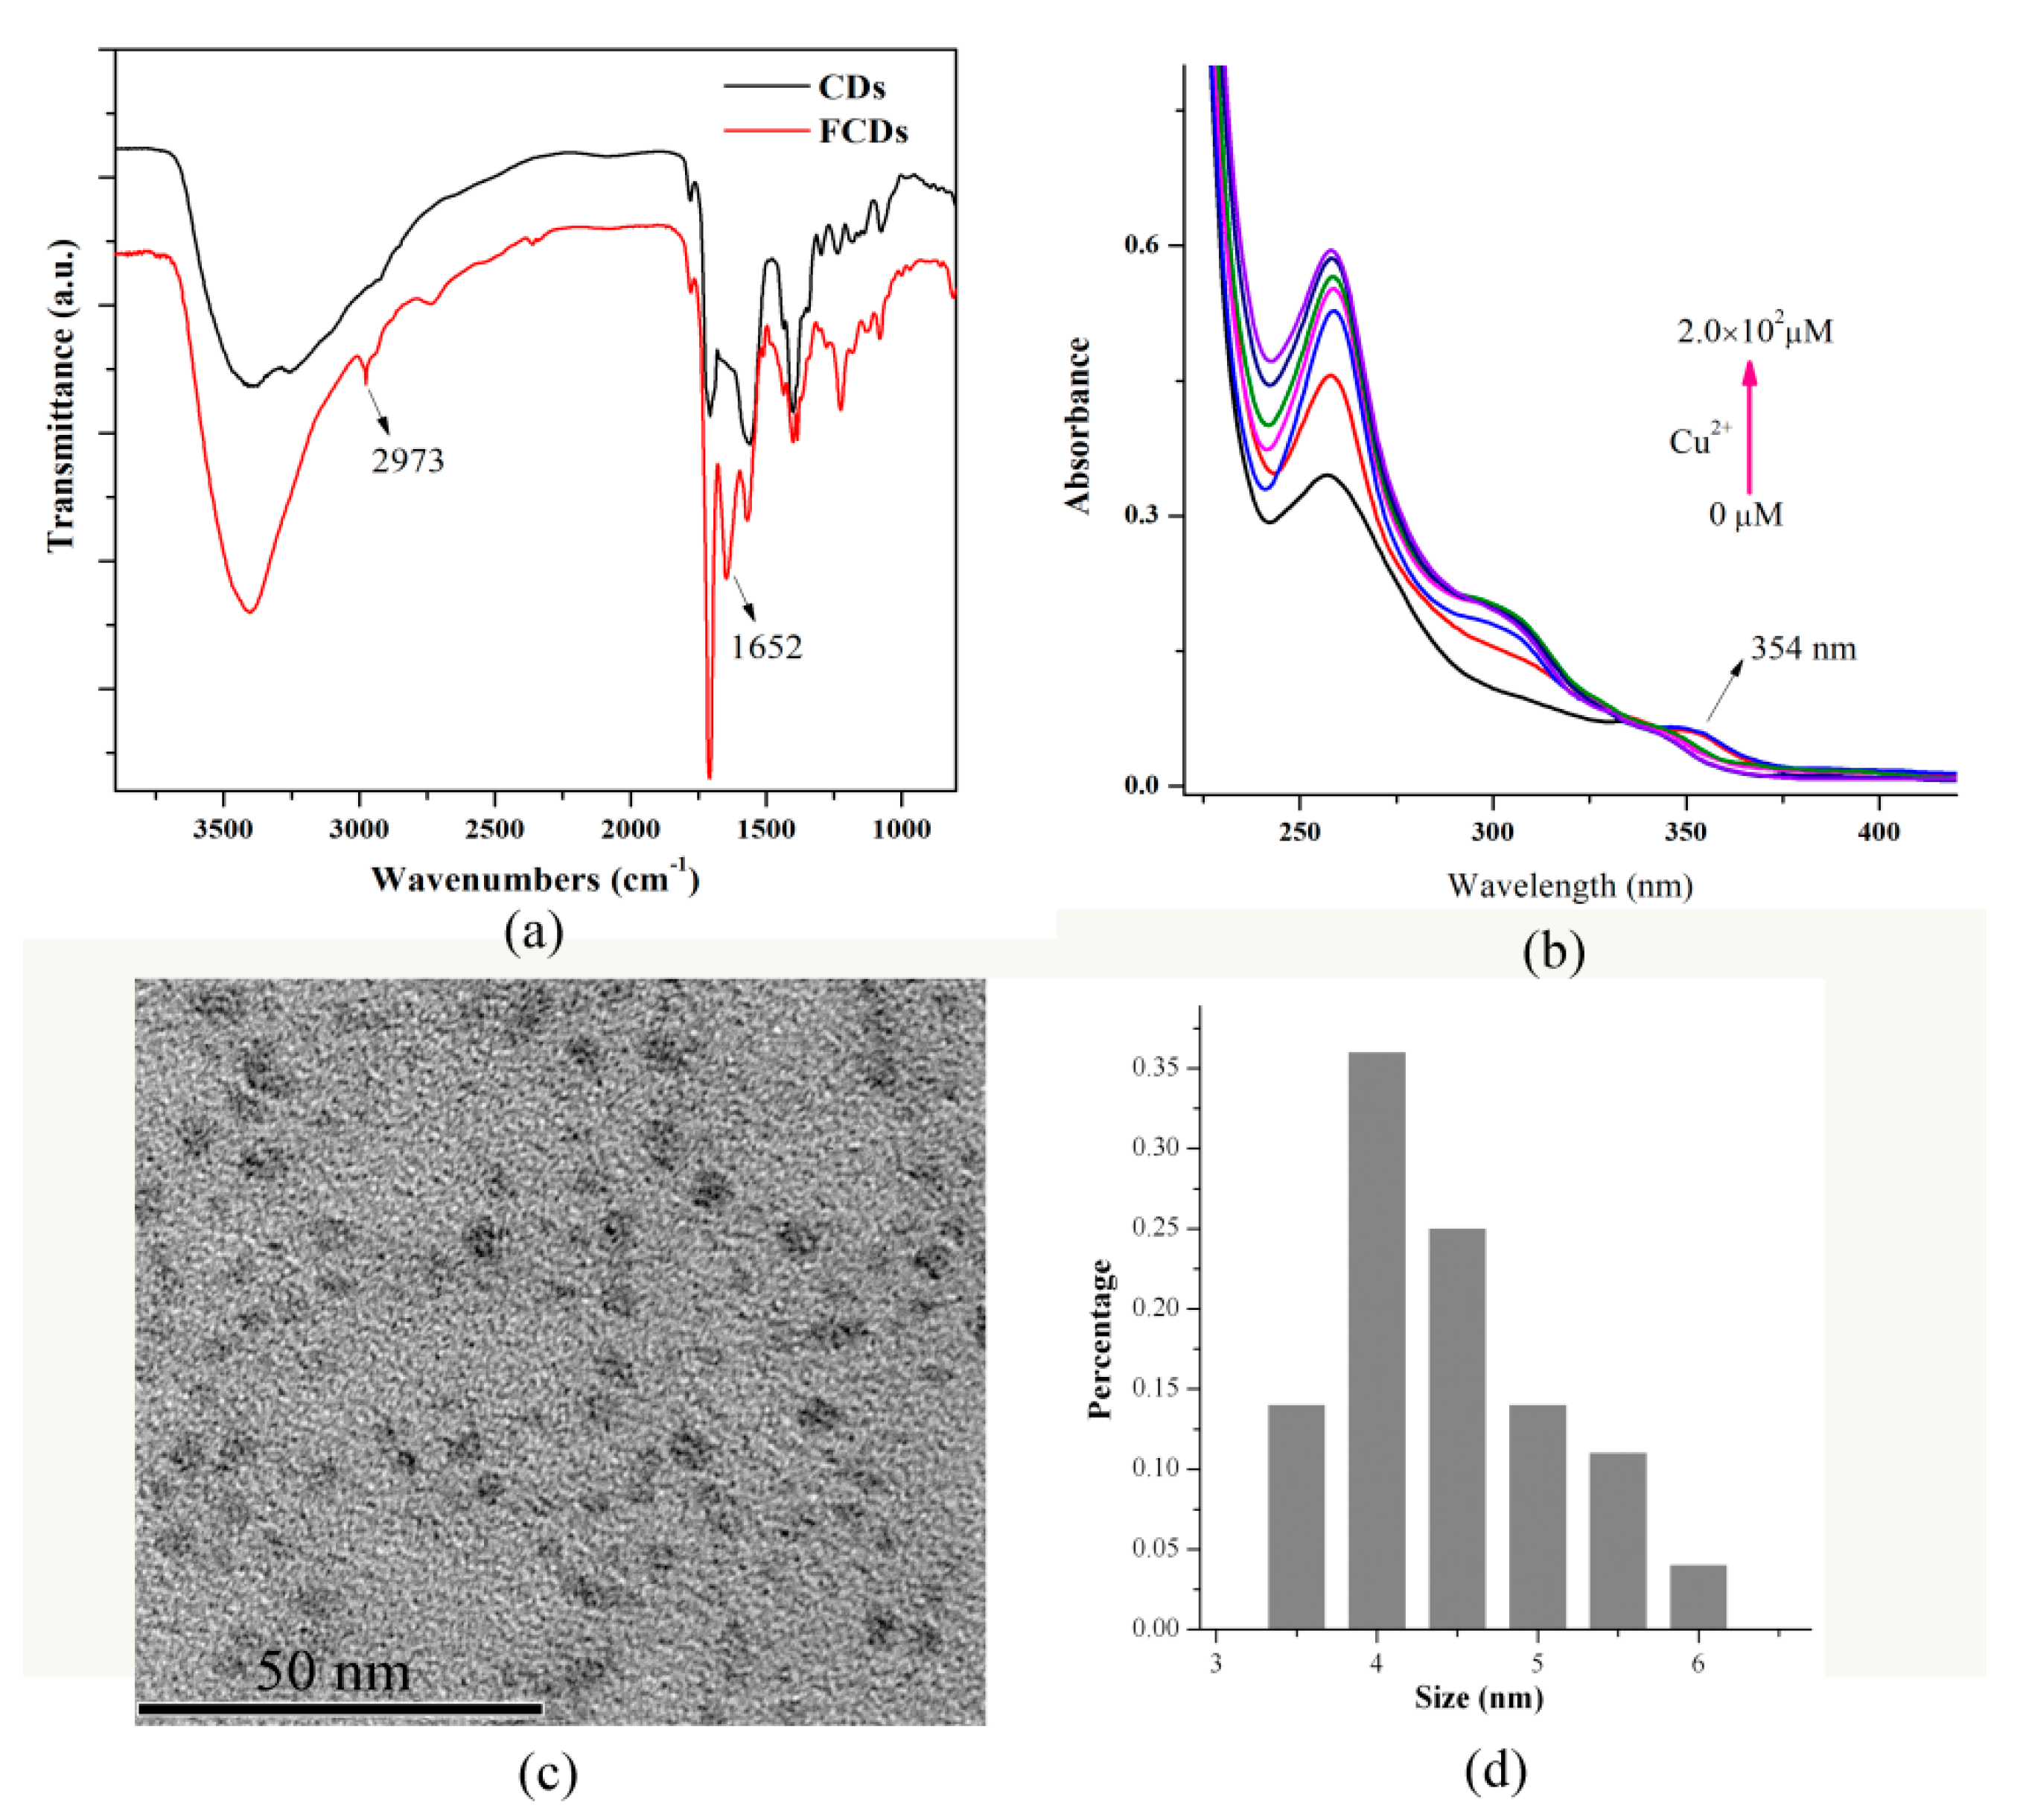
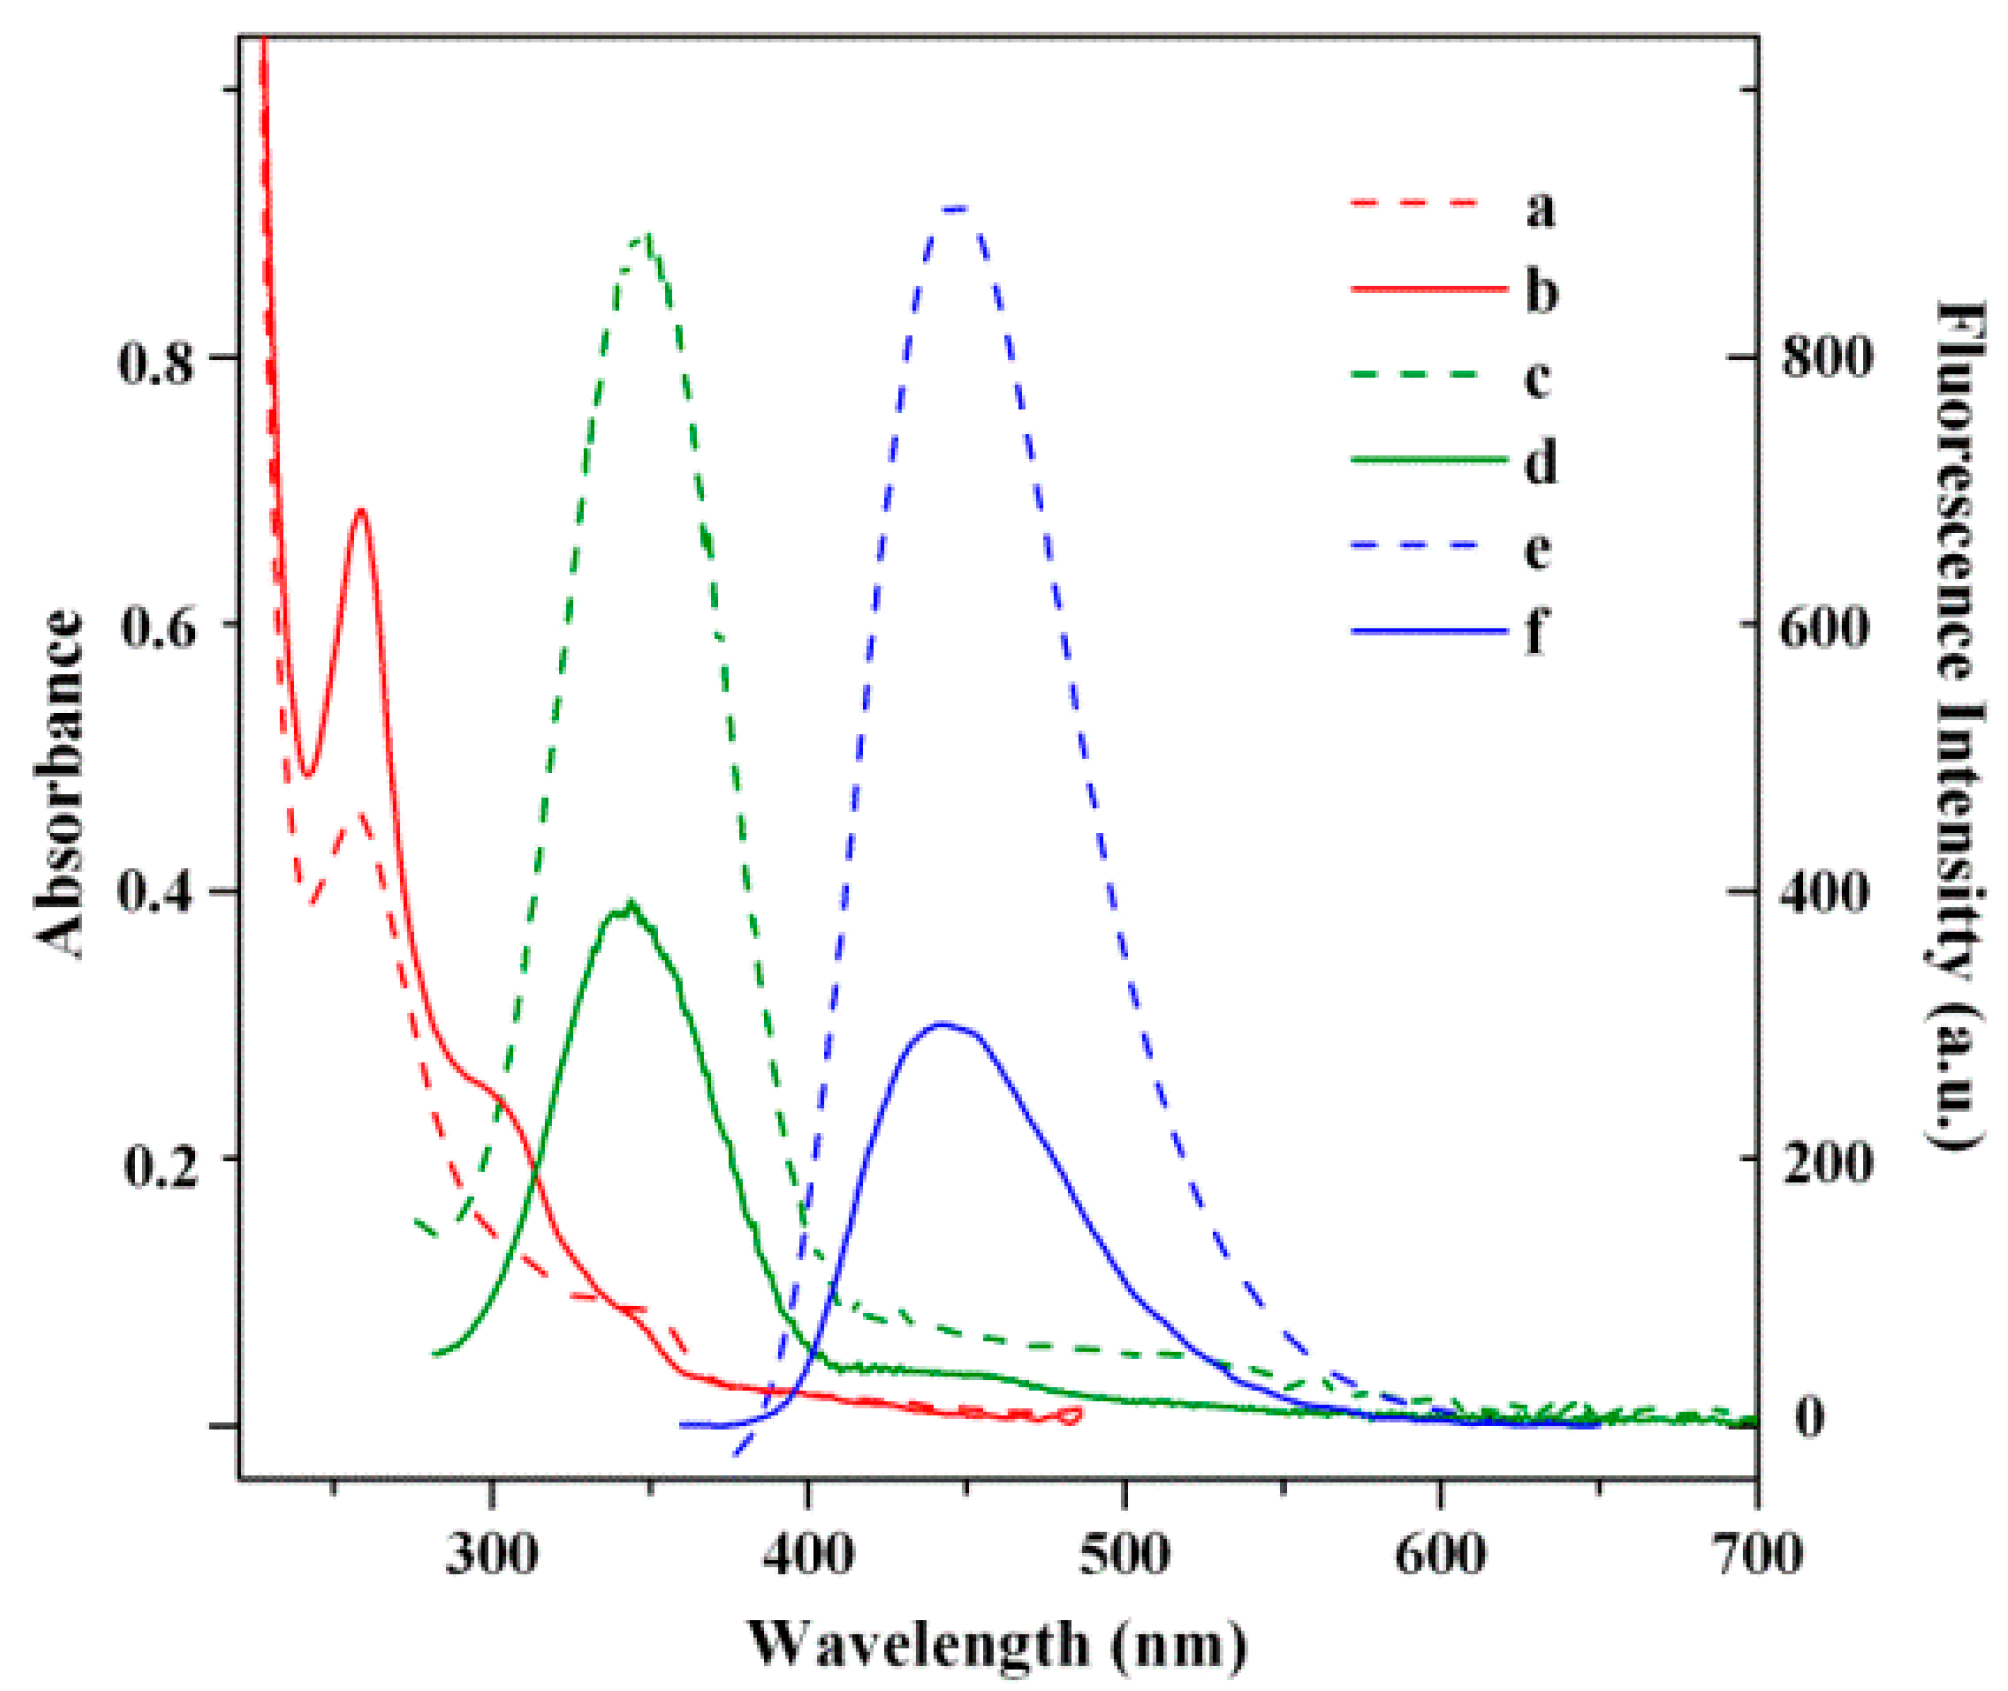
3.1. Synthesis and Characterization of the FCDs

As portrayed in Figure 2, FCDs were prepared through a modified hydrothermal method and subsequent surface functionalization technique. For this work, PPDA was selected as functional molecules to modify FCDs for two main reasons. Firstly, PPDA can be easily grafted onto the surface of the pristine CDs due to the reaction between the amino group of the CDs and the carboxyl group of PPDA. Secondly, a PPDA with a phenanthroline group has an excellent affinity for Cu2+ and has been successfully applied in the selective recognition of Cu2+ in a Eu-MOF [26].
As demonstrated in Figure S1, the UV-vis absorption spectrum of the pristine CDs exhibited a peak at around 346 nm, while its FL spectra (Figure S2) show a typical excitation-dependent property, demonstrating the synthesis of the desirable CDs [28]. In the IR spectrum (Figure 3a) of the CDs, the peaks observed around 3417, 3248, 1705, 1564, and 1404 cm−1 correspond to the O–H stretching, N–H stretching, C=O vibration, N–H bending, and amido C–N stretching vibration, respectively [28]. After grafting PPDA onto the surface of the CDs, new peaks at around 2973 and 1652 cm−1 were observed, which correspond to C=C/C=N stretch of polycyclic aromatic hydrocarbons [29]. The appearance of the C=C/C=N stretch in the IR spectrum indicates the formation of PPDA-functionalized CDs.
As shown in Figure 3b, the FCDs exhibit two absorption bands centered at 258 and 354 nm. The band located at 258 nm can be primarily attributed to the π–π* electronic transitions of the ligand PPDA, while the band centered at 354 nm can be ascribed to the absorption of CDs. Upon the addition of Cu2+, a new UV absorption band centered at 306 nm appeared and increased gradually, while the absorption intensity of the band centered at 354 nm decreased significantly. These results indicate the interaction between Cu2+ and the ligand PPDA and also demonstrate the successful synthesis of the FCDs.
The TEM image (Figure 3c) reveals that the FCDs a1re uniform in morphology with an average diameter of around 4 nm (Figure 3d).

3.2. Detection of Cu2+ by FCDs

Figure 4a illustrates the FL changes of the FCDs under different concentrations of Cu2+. The FL intensity of FCDs clearly decreased with the addition of 5 μM Cu2+. For comparison, the FL intensity of the pristine CDs changed a little when 200 μM of Cu2+ were added (Figure S3). This clearly shows the interaction between Cu2+ and the FCDs, which resulted in the apparent FL decrease of the FCDs. Good linearity between the FL intensity of the FCDs and the Cu2+ concentrations was obtained in the range of 0–6.0 µM (Y = 693.4717 − 56.5662X, R2 = 0.9966, Figure 4b). The detection limit of this sensor was calculated to be 40.1 nM, which is well suited for detecting copper ion in drinking water and blood systems [30].

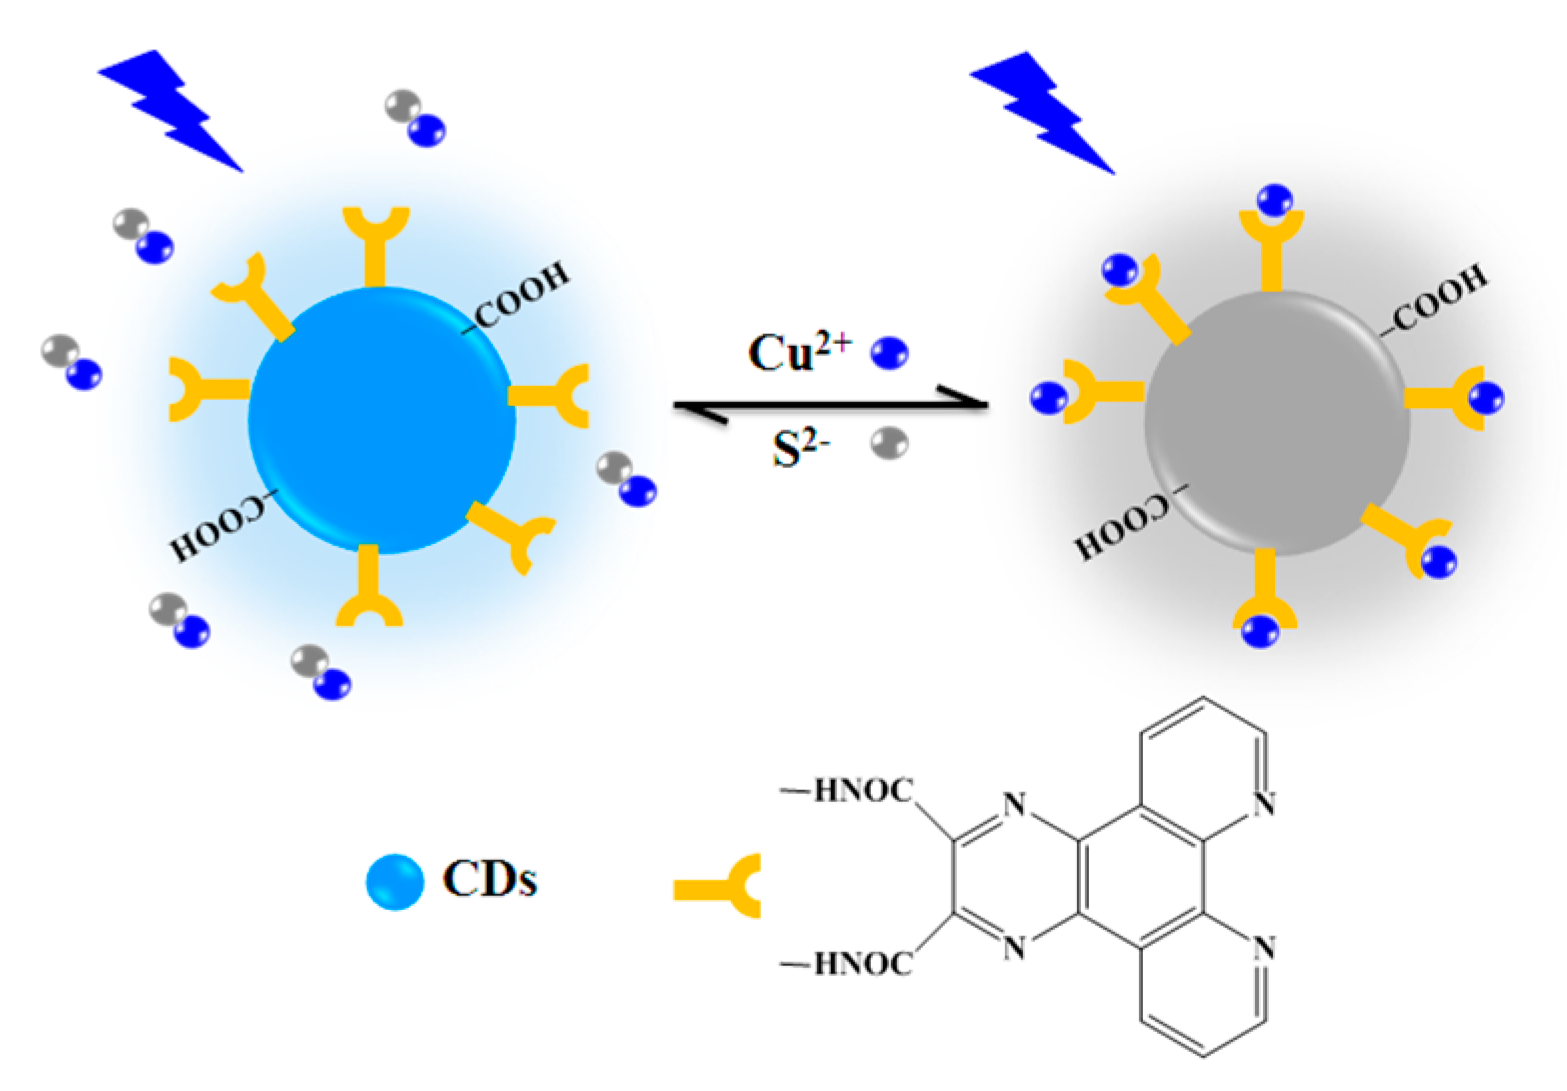
3.3. Mechanism for Cu2+ Detection Using FCDs

The quenching mechanism can be explained as follows. As mentioned above, the introduction of Cu2+ into the FCDs results in a new UV absorbance band centered at 306 nm. Notably, the solution of Cu2+ shows almost no absorption peak above 250 nm (Figure S4), while such a new absorption band can also appear when 140 μM Cu2+ was added into the PPDA solution. Considering that the synthesized FCDs are PPDA-capped, we speculate that the new absorbance peak can be attributed to the addition of Cu2+ with the PPDA on the surface of FCDs. Moreover, the absorbance band located at 306 nm (Figure 5 line b) partially overlapped with the excitation spectrum of the FCDs (Figure 5 line c). The overlapping between the absorption band of an absorber (in this case, the PPDA–Cu2+ complex) and the FL excitation (and/or emission) spectrum of the fluorophores (in this case, FCDs) can result in a decrease of the FL intensity of the fluorophore, which is the so-called inner filter effect (IFE) [24]. In short, the quenching of the FCDs’ FL by Cu2+ ions may be attributed to the formation of PPDA–Cu2+ complexes at the surface of FCDs that can absorb the excitation light of FCDs; in other words, the addition of Cu2+ decreases the concentration of the fluorescent FCDs.

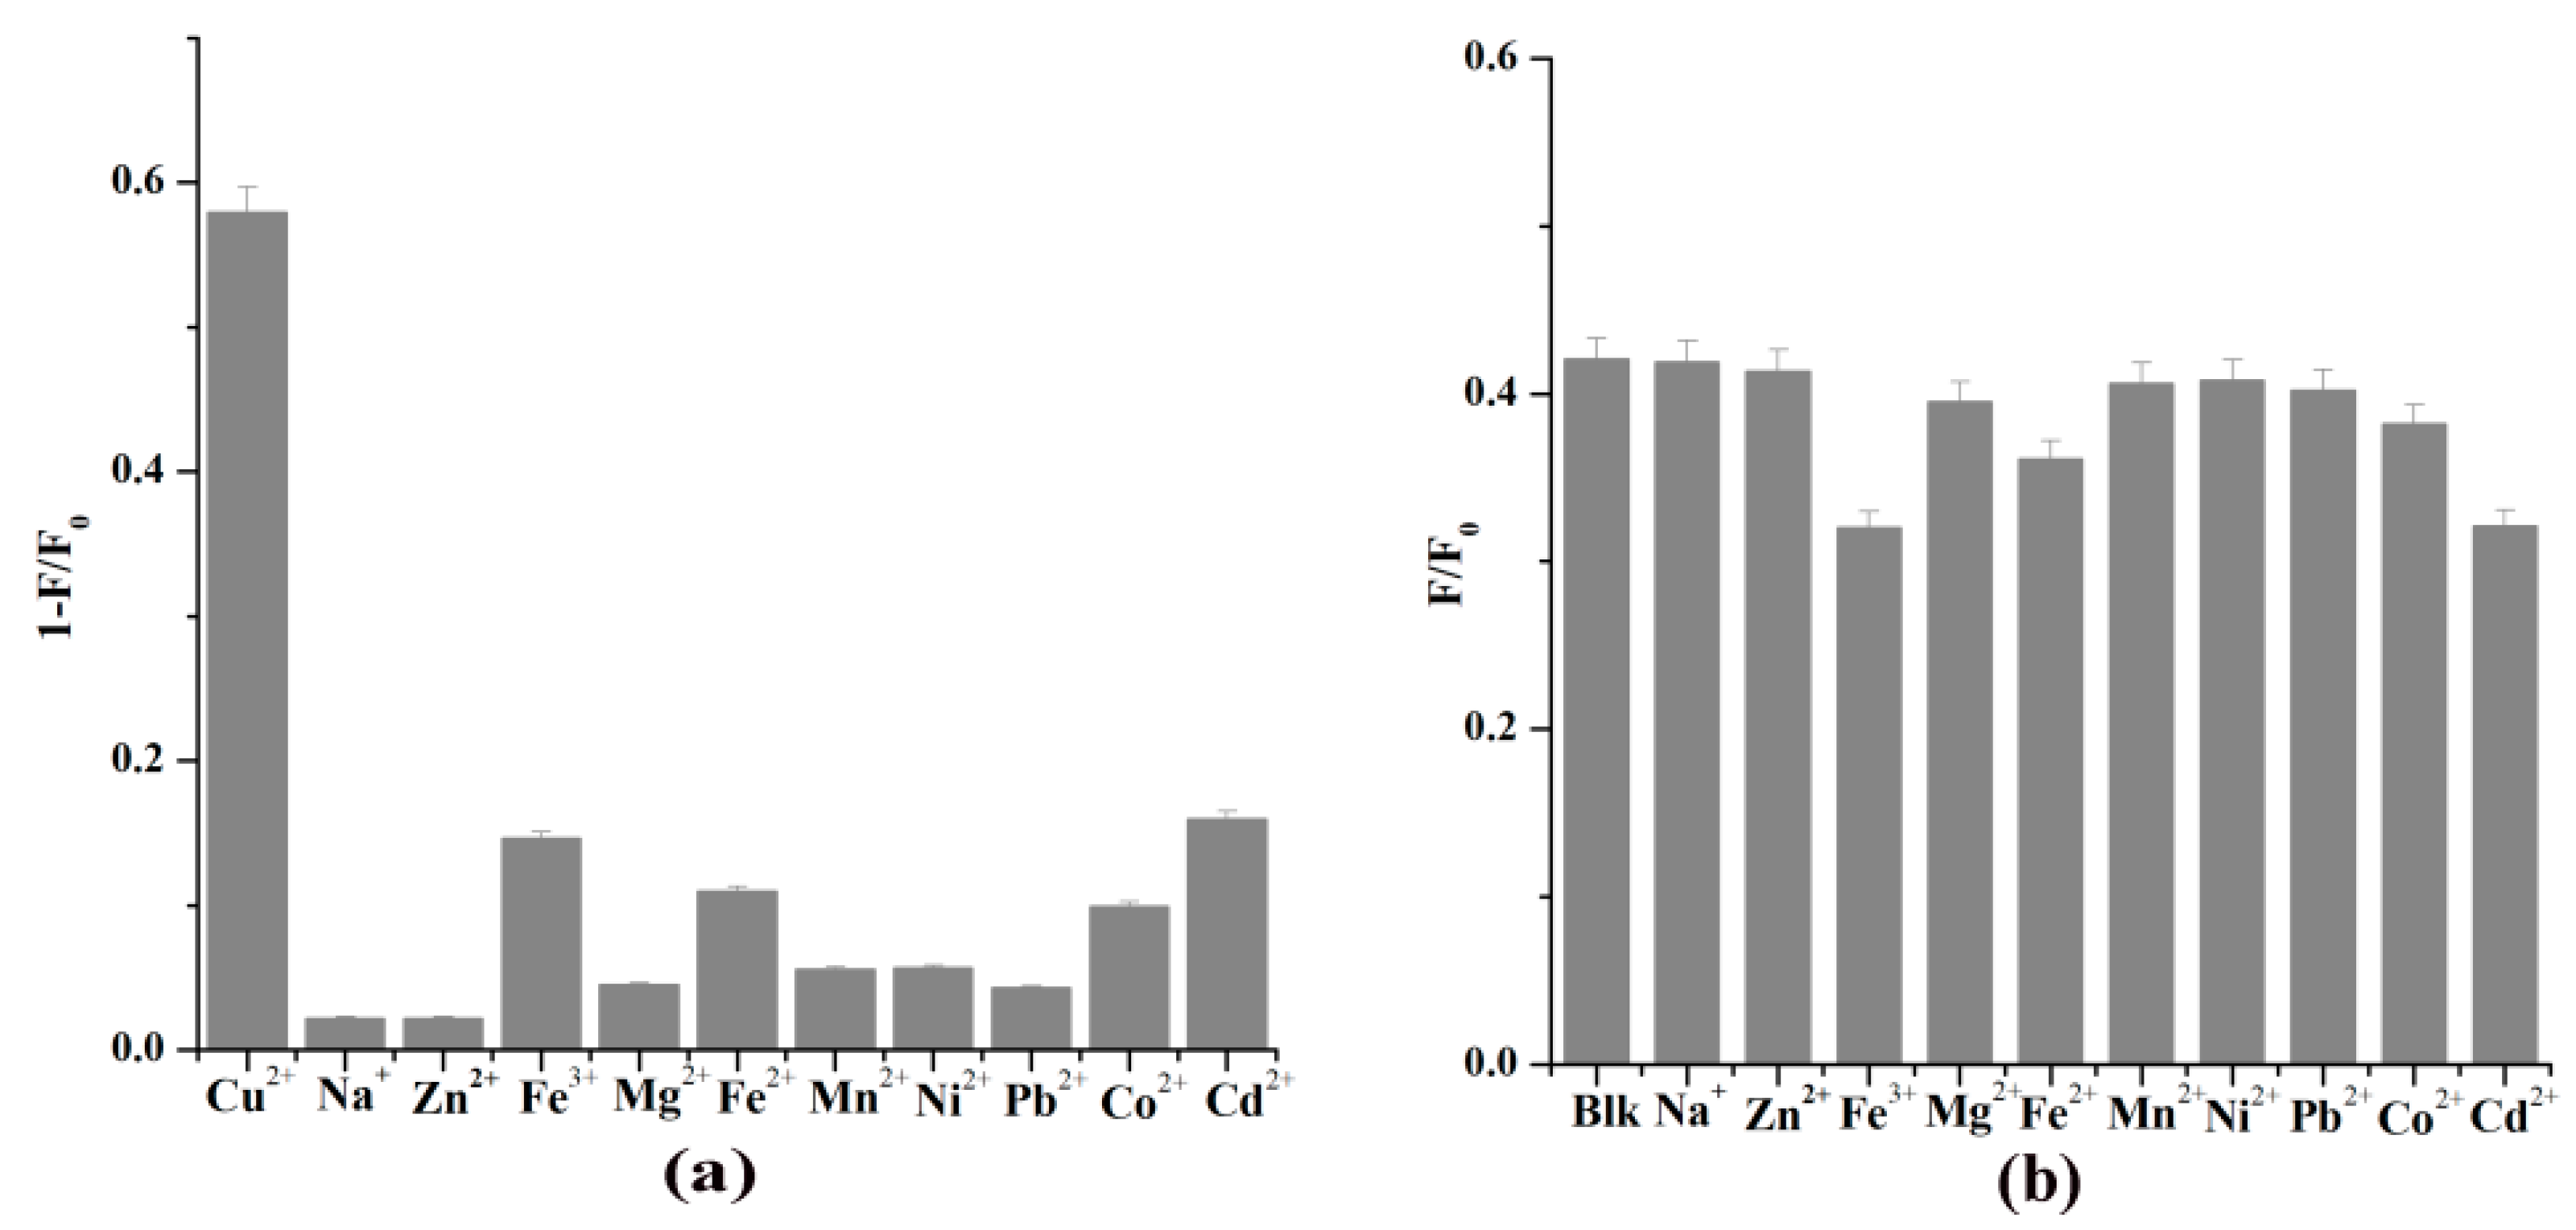
3.4. Selective Detection of Cu2+ in Water

To assess the selectivity of FCDs toward Cu2+, the quenching effect of other metal cations (Zn2+, Na+, Fe3+, Mg2+, Fe2+, Mn2+, Ni2+, Pb2+, Co2+, and Cd2+), as well as the mixture of Cu2+ and one of the above cations were investigated. The addition of Cu2+ resulted in apparent PL quenching, while other metal cations induced quite a few changes in the FL intensity of the FCDs (Figure 6a). Furthermore, the coexistence of other cations did not cause obvious interference for FCDs when sensing Cu2+ (Figure 6b) and allowed for the highly selective detection of Cu2+.
It should be noted here that 1,10-phenantroline is a commonly used reagent for the determination of Fe3+. However, the FL intensity of the FCDs was not significantly quenched with the addition of Fe3+. We then examined the effect of Fe3+ ions on the absorption spectra of the FCDs. As can be seen from Figure S5, under the addition of Fe3+, the absorption bands at 350 nm increased slightly, and no new peak appeared. This phenomenon may illustrate the weak interaction between Fe3+ and the FCDs, which may be responsible for the weak quenching effect of Fe3+ on the FL intensity of FCDs.

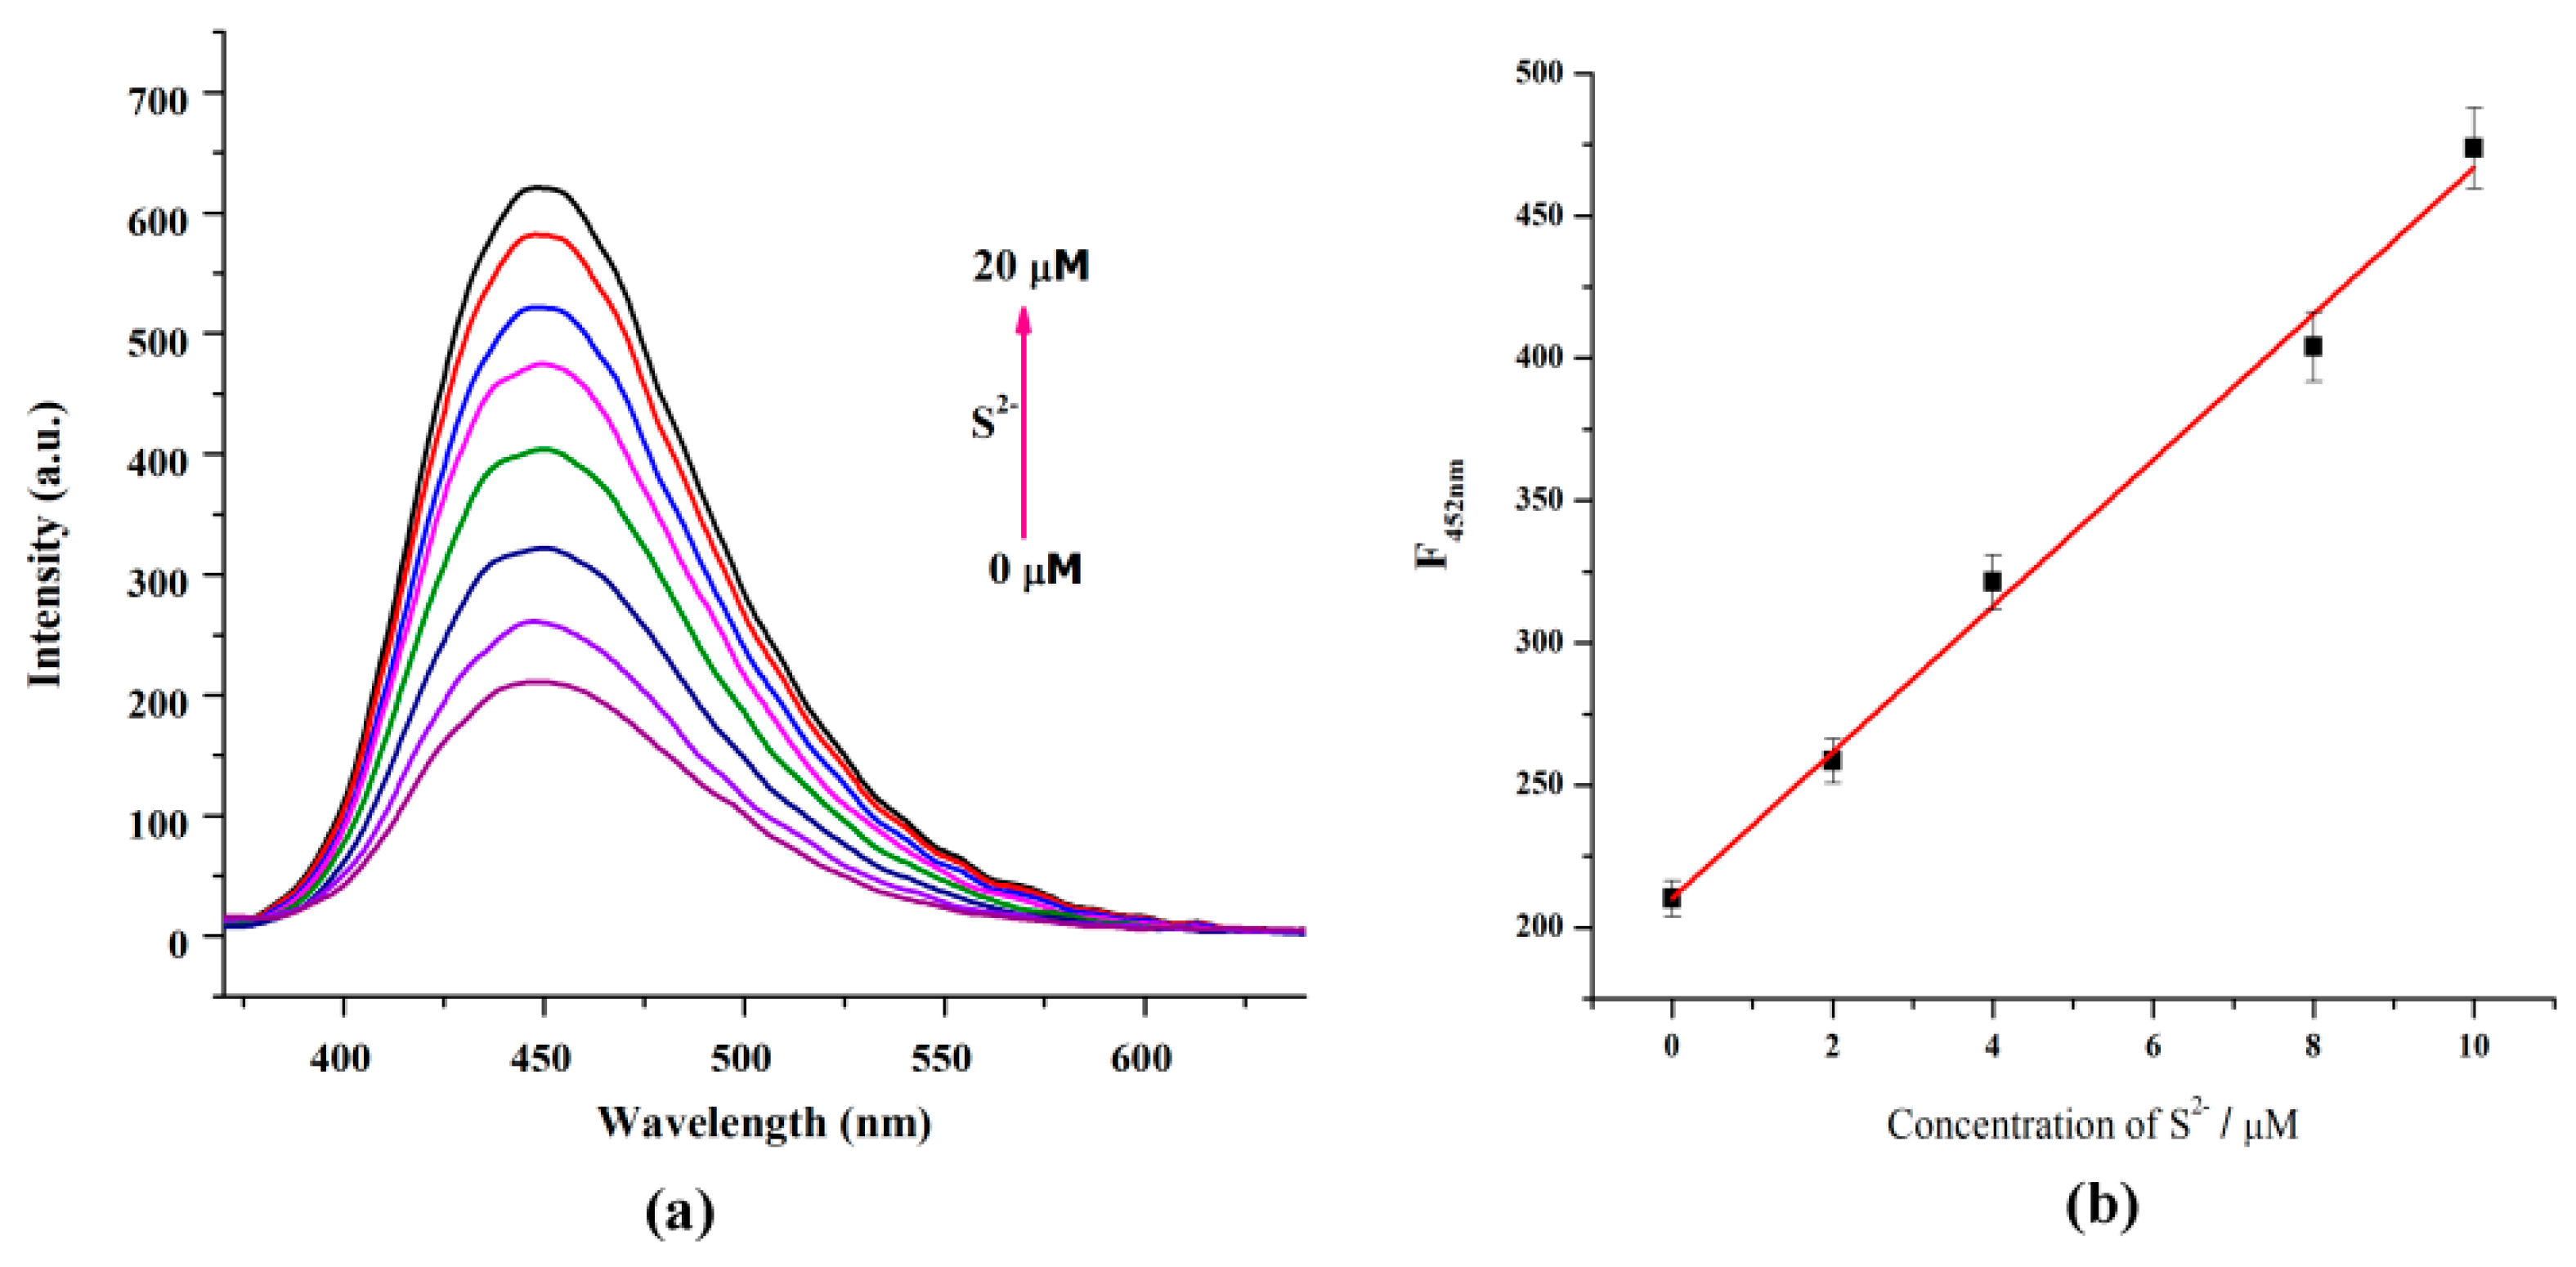
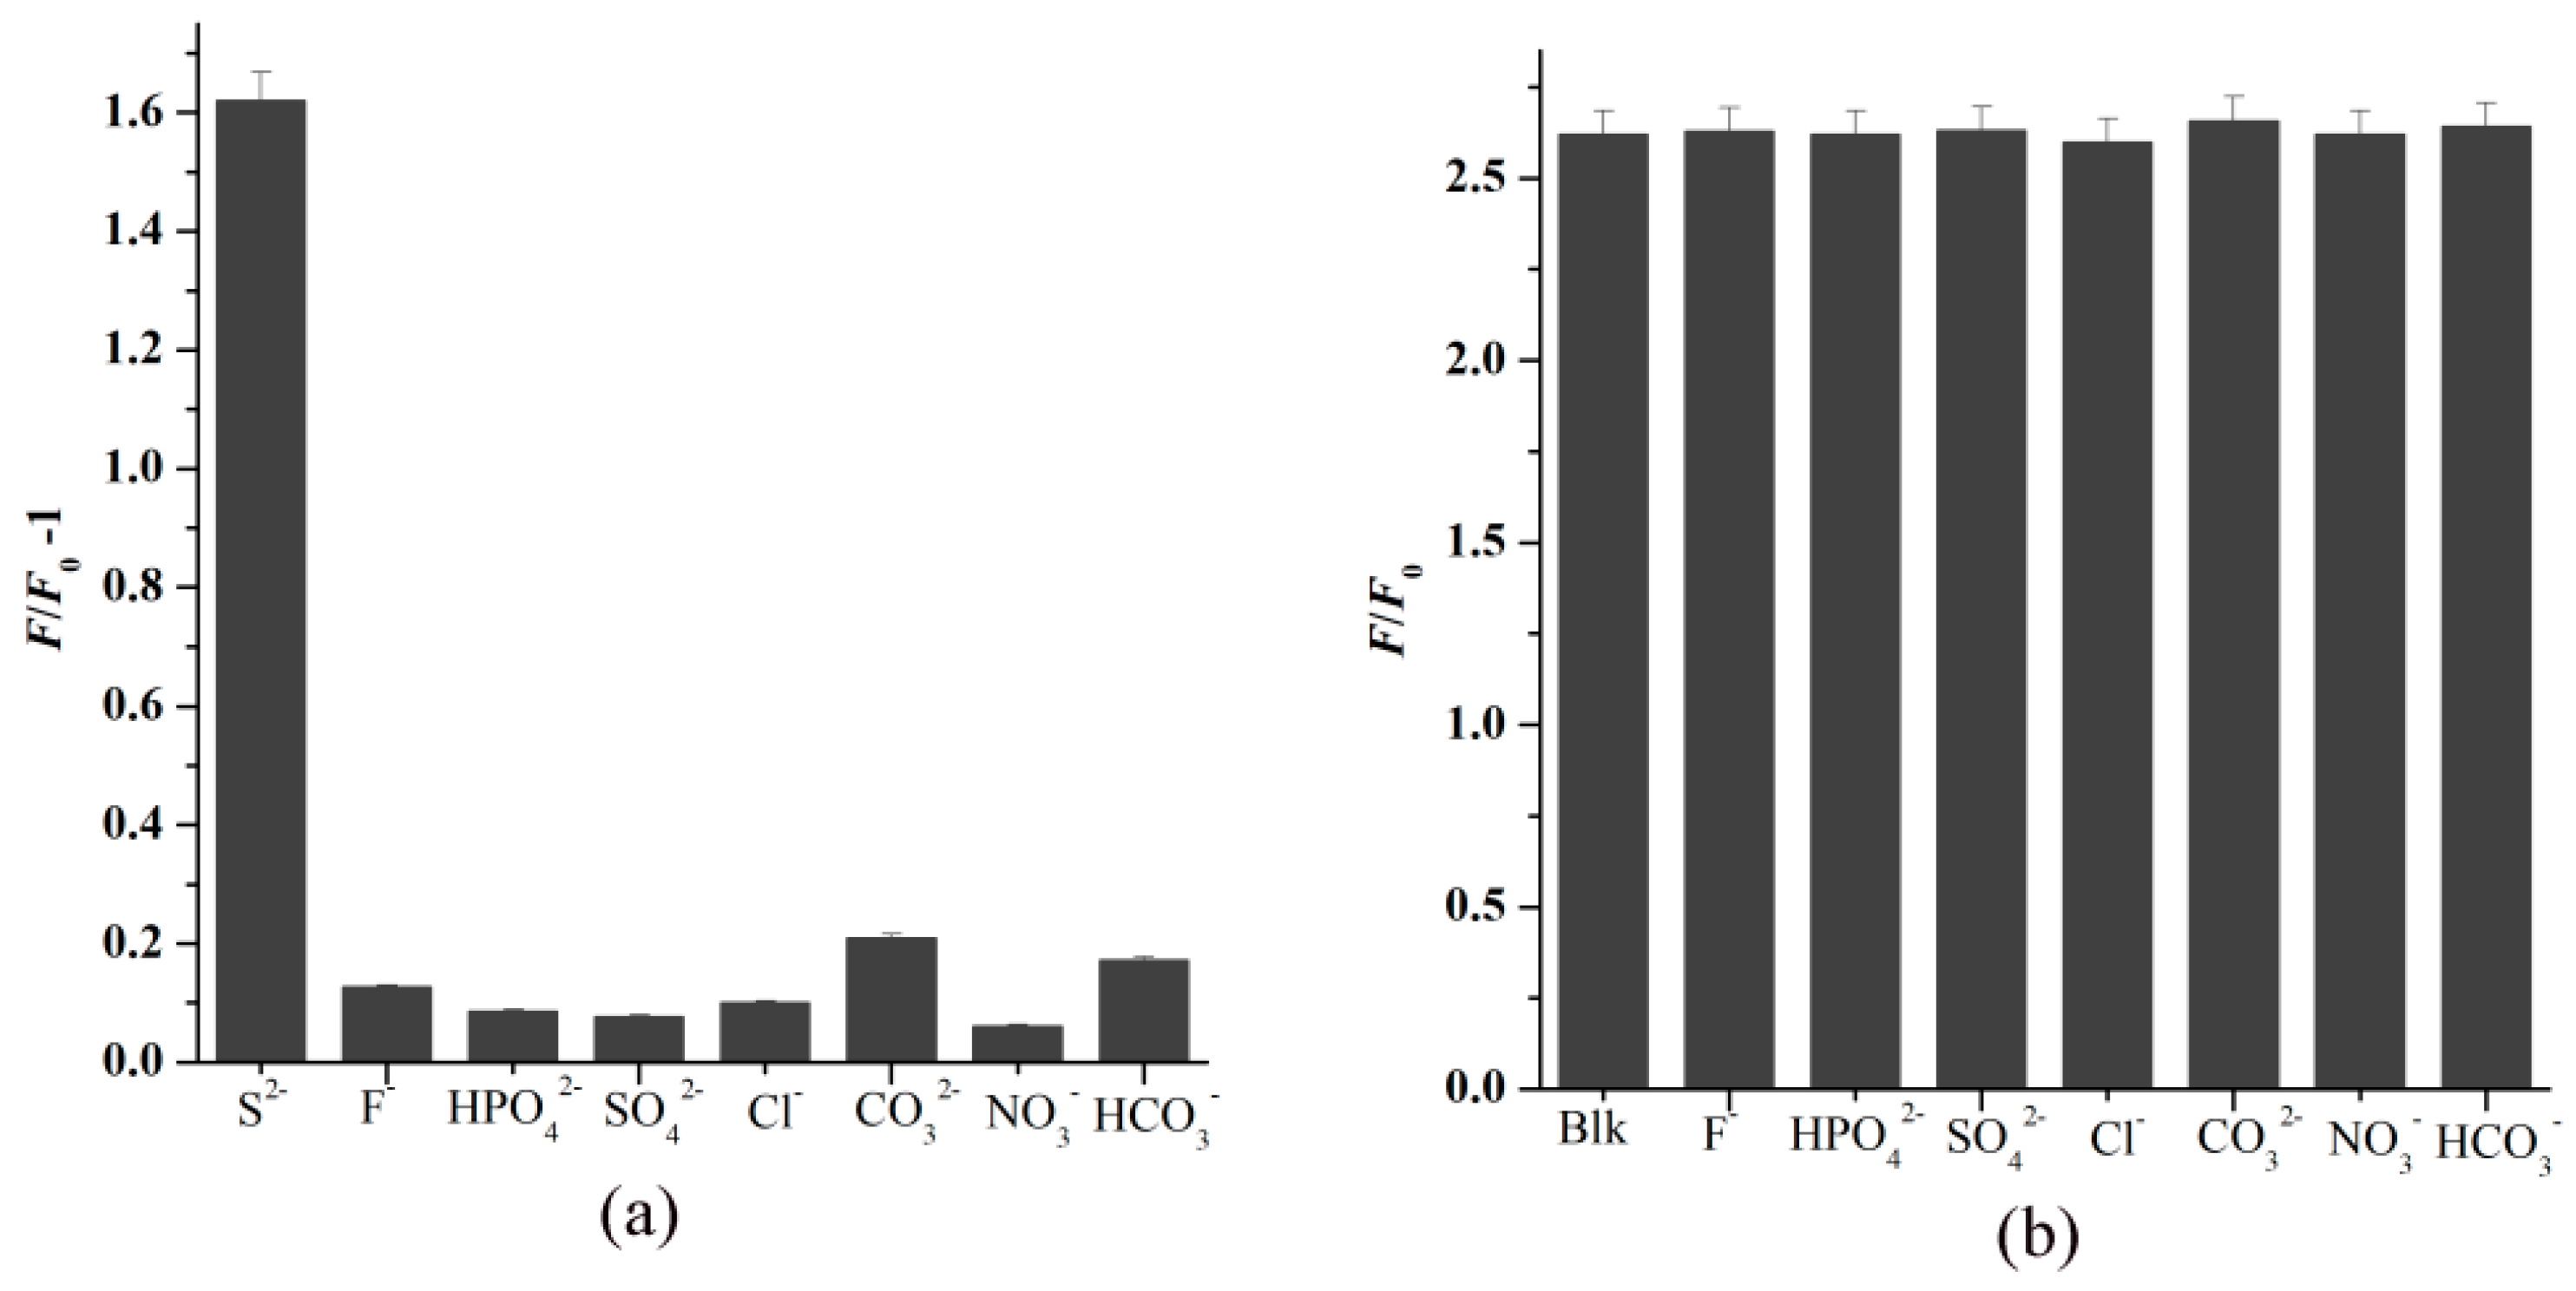
3.5. S2− Detection by FCD–Cu2+

Since S2− can react with Cu2+ and generate a very stable CuS species [22], the addition of S2− into the FCD–Cu2+ complex may result in the release of FCDs, which can make the FCD–Cu2+ possible to use as a turn-on FL sensor for S2−. Based on the above considerations, fluorescent titration was carried out to assess the FL response of the FCD–Cu2+ complex to S2−. As delineated in Figure 7a, the FL intensity of the FCD–Cu2+ complex was gradually enhanced after the addition of S2−.
The FL intensity increased nearly three-fold when the S2− concentration was 20 µM. The FL intensity of FCD–Cu2+ and the S2− concentrations show a linear relationship in the range of 0–10 µM (Y = 210.3426 + 25.6692X, R2 = 0.9971, Figure 7b). The detection limit of the FCD–Cu2+ for S2− was determined to be 88.9 nM, which is clearly below the recommended maximum S2− concentration in drinking water (about 15 µM) [31]. Therefore, the sensor can be used for S2− detection in water quality monitoring.
To study the selectivity of FCD–Cu2+ toward S2−, the quenching effect of other anions (F, Cl, HCO3, SO42−, NO3, CO32−, and HPO42−), the mixture of S2−, and one of the above anions were investigated. Only the introduction of S2− can result in the apparent PL enhancement of FCD–Cu2+ (Figure 8a), exhibiting outstanding selectivity for S2− detection. Moreover, the coexistence of other anions shows a negligible effect on the FL enhancement of the FCD–Cu2+ complex (Figure 8b), which indicates that FCD–Cu2+ can be used as an effective sensor for S2− with high selectivity.

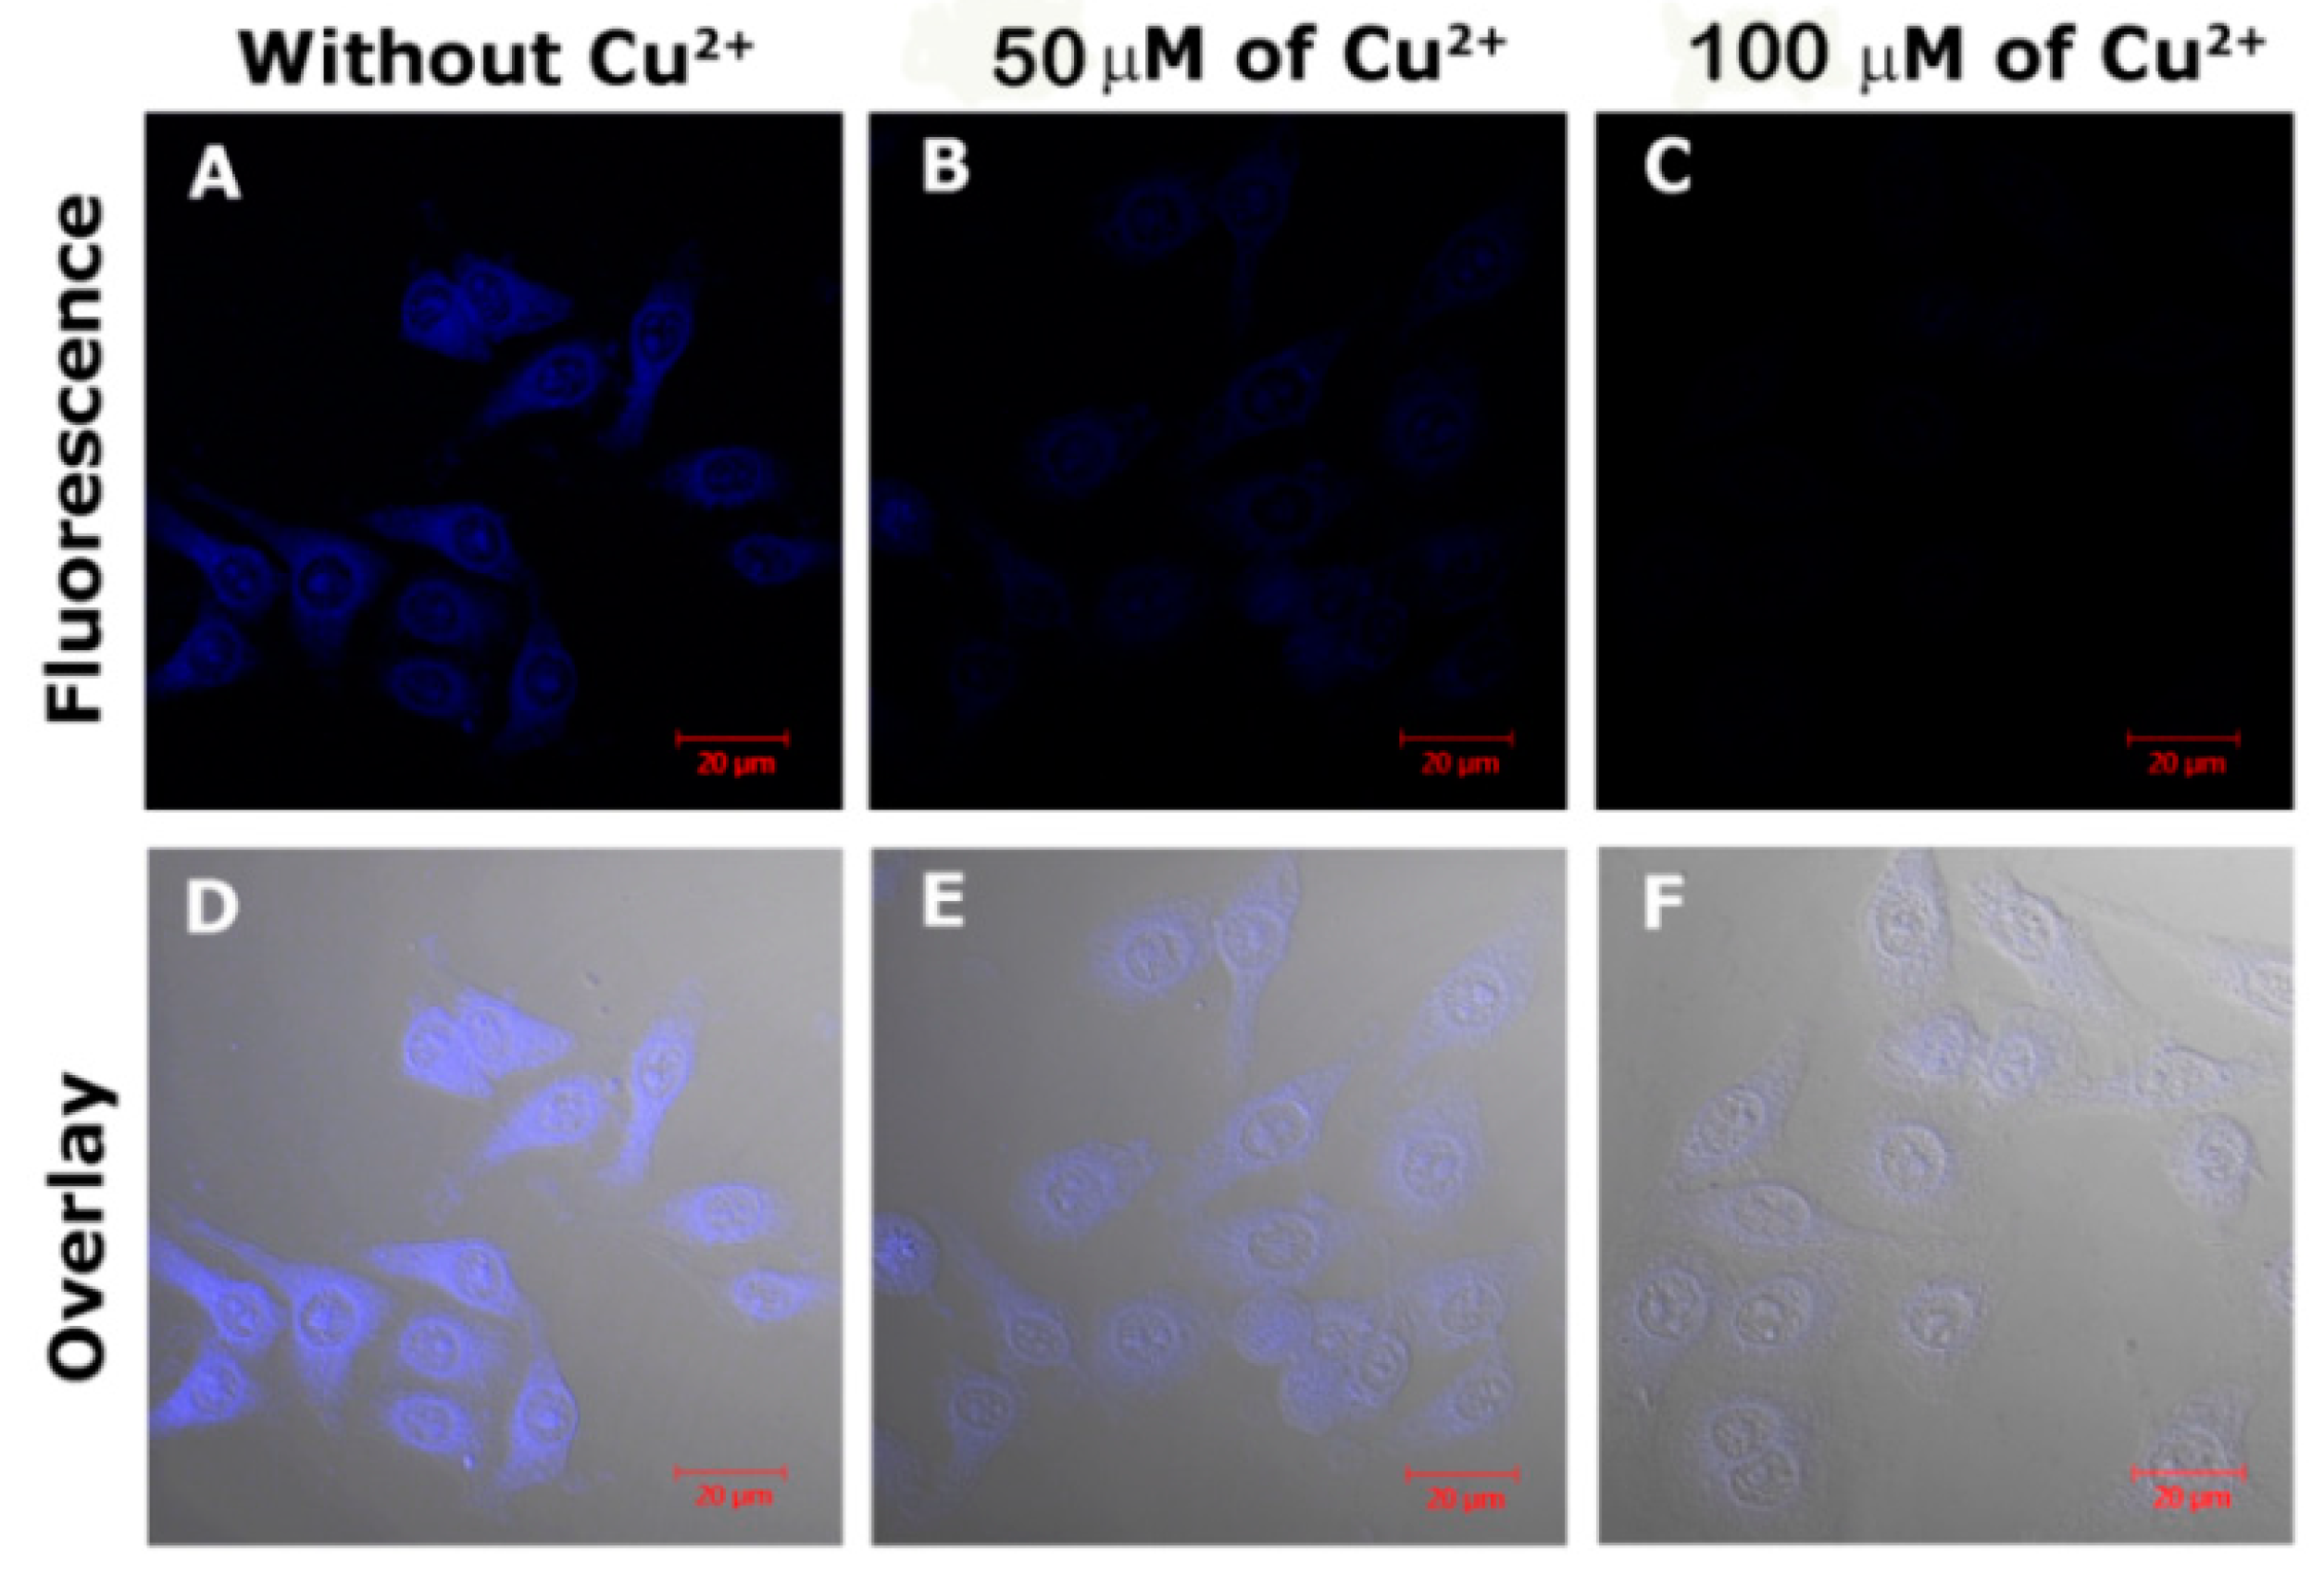
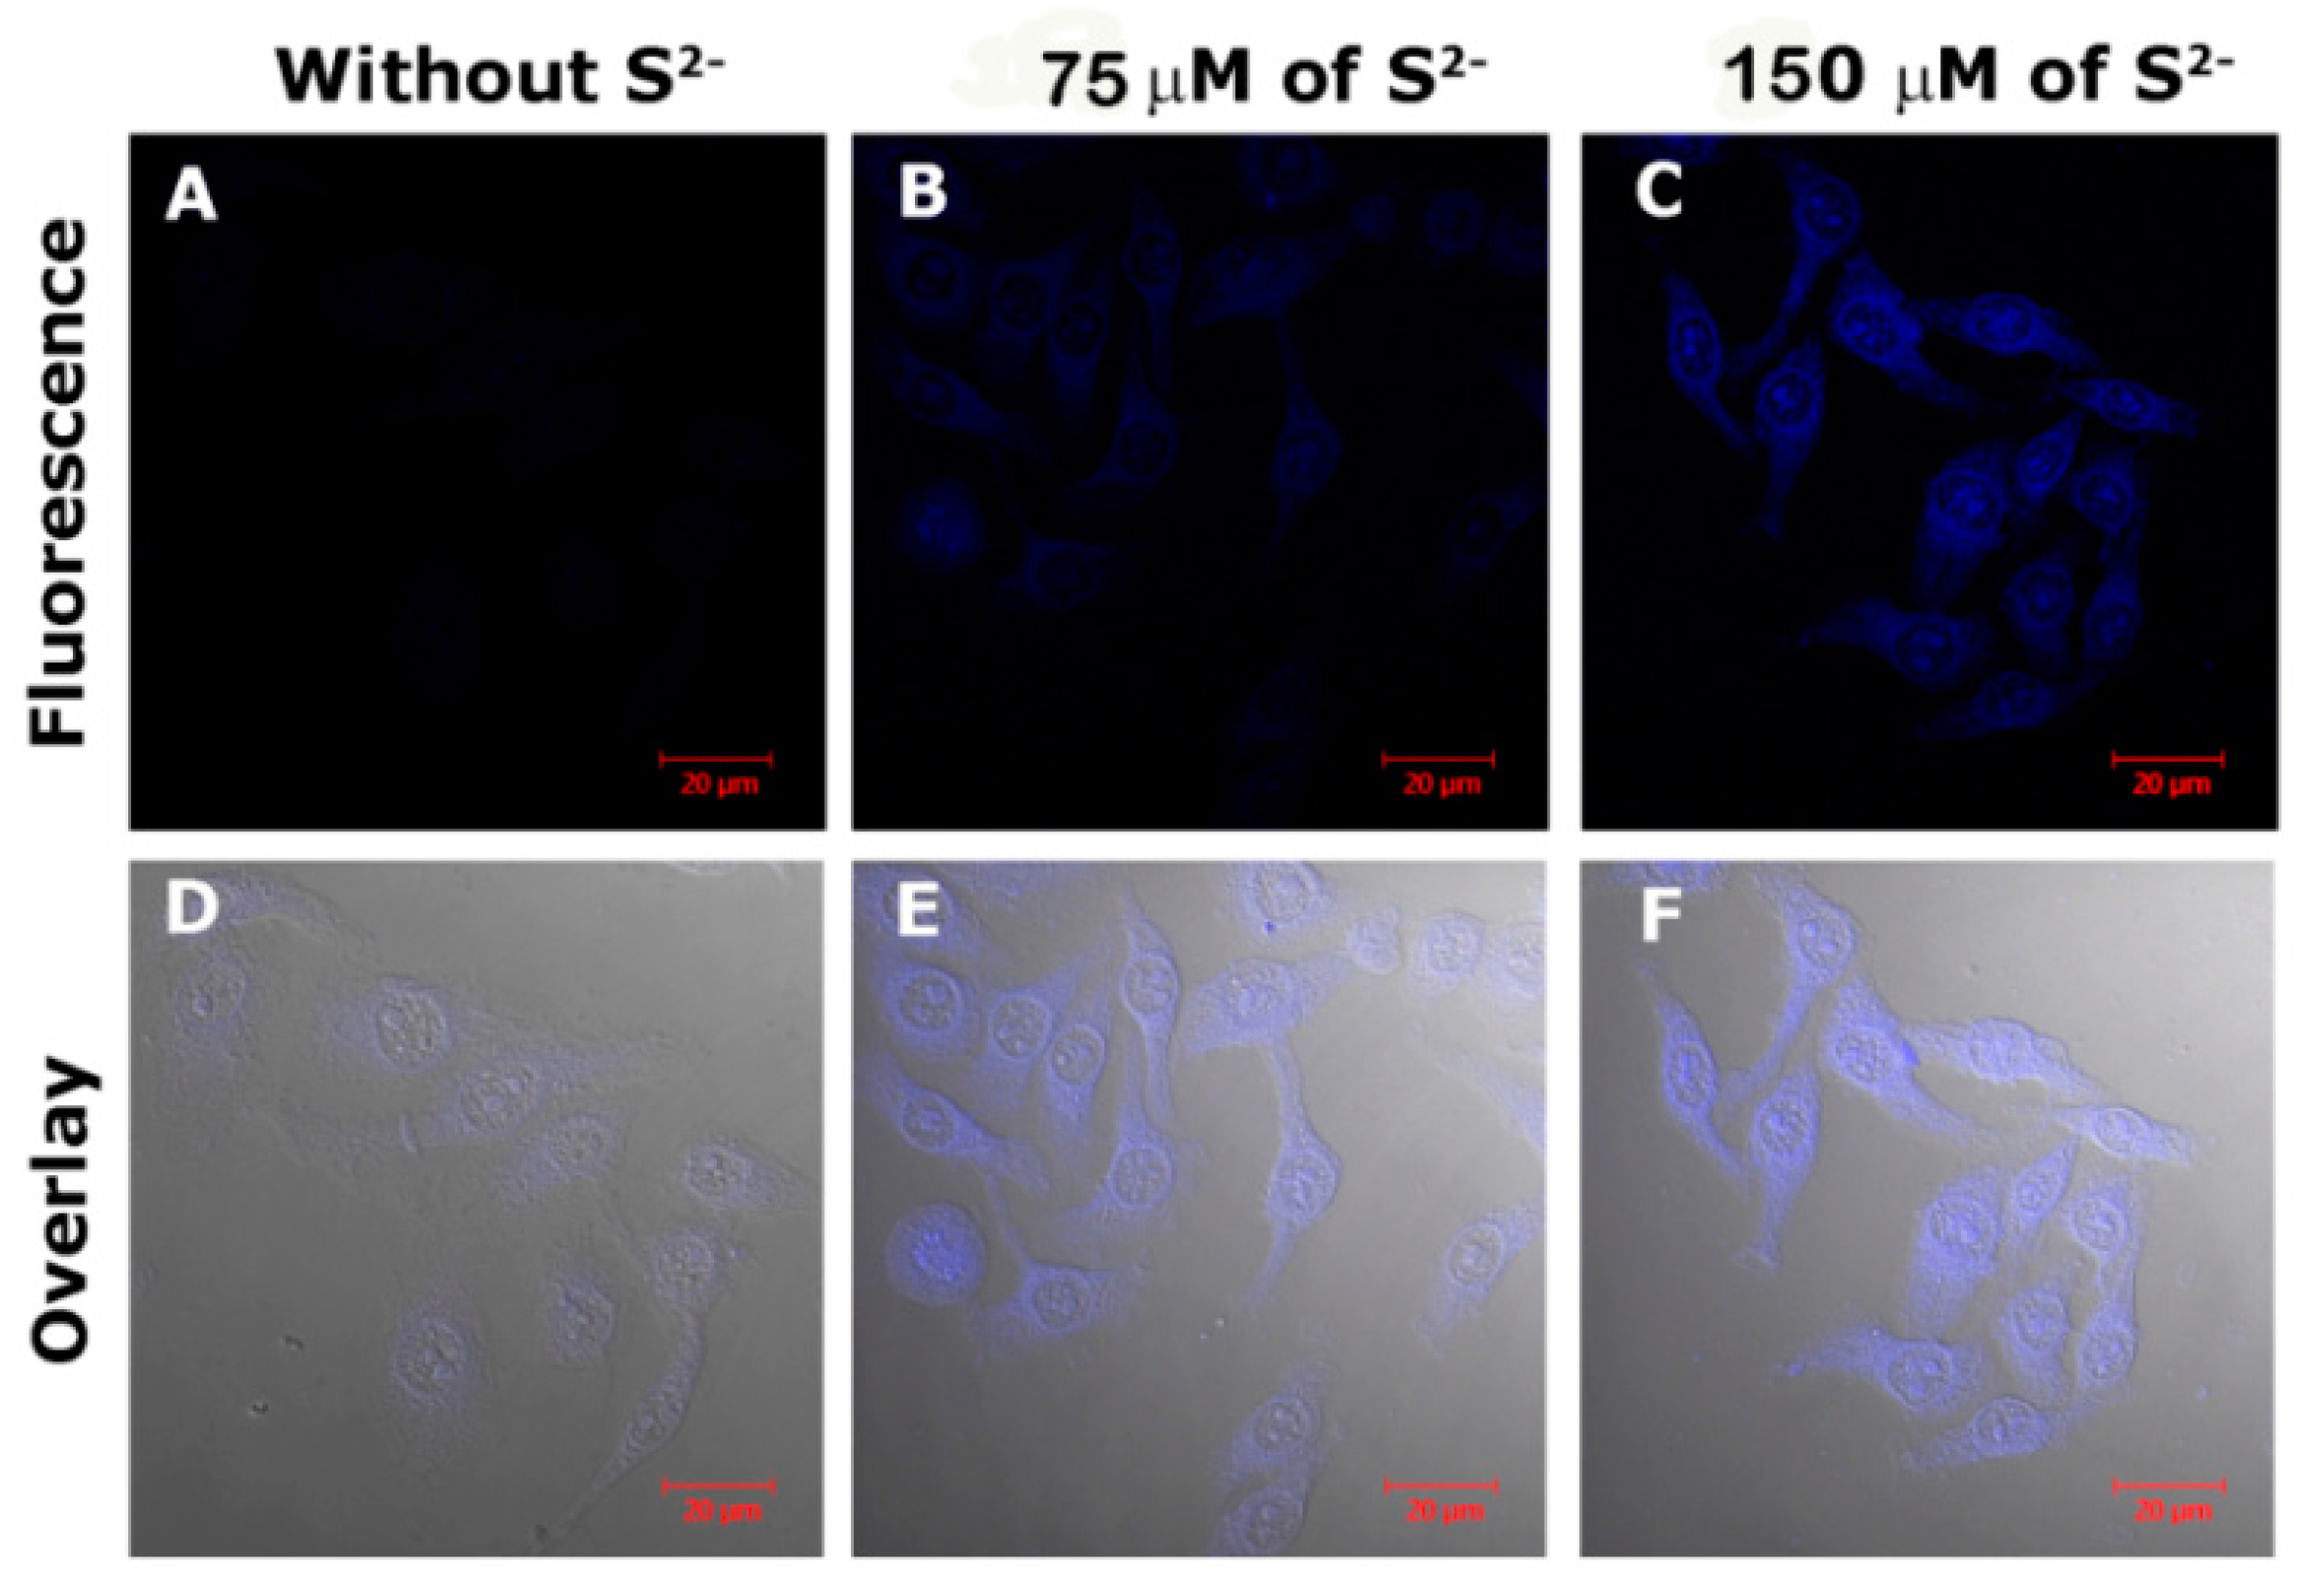
3.6. Intracellular FL imaging of Cu2+ and S2−

To evaluate the feasibility of FCDs for Cu2+ imaging in live cells, HeLa cells were chosen to be incubated with the FCDs. As depicted in Figure 9, after the introduction of Cu2+ to the HeLa cells, the FL intensity of the FCDs decreased significantly and almost disappeared with 100 µM of Cu2+. Furthermore, the ability of the FCD–Cu2+ complex to monitor intracellular S2− was also tested. HeLa cells were firstly incubated with the FCD–Cu2+ and subsequently treated with S2−. As shown in Figure 10, with the increasing S2−, the FL intensity of the cell also clearly increased (recovered). These results indicate the great potential of FCDs and FCD–Cu2+ for monitoring Cu2+ and S2− in live cells.

3.7. Photostability of FCDs

The as-synthesized FCDs exhibited prominent photostability under different conditions. The FL intensity of the FCDs solution remained almost unchanged under continuous excitation (80 min) using 365 nm UV light (Figure S6). Moreover, when the FCDs were stored for 40 days, negligible changes (<3%) in the F/F0 intensity of the FCDs in the presence of Cu2+ (15 µM) were observed (Figure S7). No obvious F/F0 changes of the FCDs were noticed in the biologically-related pH range 5.0–9.0 after the addition of small concentrations of Cu2+ (Figure S8). These results indicate that the FCDs possess favorable FL stability under light excitation, air conditions, and pH variation, and can be used for the detecting and imaging of Cu2+ in complex environments.

3.8. Analysis in a Real Sample

To further test the applicability of this sensing system for detecting Cu2+ in a real sample, we used a standard addition method to detect the concentration of Cu2+ ions in several tap water samples. As displayed in Table S2, the relative standard deviation (RSD) for all tests are less than 0.38% while recoveries were in the range from 85% to 99.5%. These results indicated the high precision and accuracy of this CD-based FL sensing method for the detection of Cu2+ in real samples.

4. Conclusion

In summary, a novel fluorescent nanoprobe was elaborately fabricated by grafting a phenanthroline derivative onto the surface of CDs. This nanoprobe exhibits good selectivity and sensitivity (detection limit: 40.1 nM) for Cu2+ detection due to a specific inner filter effect. The generated FCD–Cu2+ complex can be further used as an effective off–on-type sensor for the detection of S2− with a detection limit of 88.9 nM. Furthermore, the FCD sensor with excellent photostability can also be applied for the monitoring intracellular Cu2+ and S2−. These CDs-based nanoprobe may have great prospects in the biological field in the future. This work may provide some meaningful insights for constructing CD-based multifunctional FL sensors to detect analytes in the biological and environmental fields.

Supplementary Materials

The following are available online at https://www.mdpi.com/2079-4991/8/12/1071/s1, Figure S1: The UV–vis and fluorescence emission spectra of the pristine CDs (λex = 360 nm); Figure S2: The fluorescence emission spectra of CDs under different excitation wavelength (λex = 280~460 nm); Figure S3: Fluorescence titration of the un-functionalized CDs sample with different Cu2+ concentrations (λex = 320 nm); Figure S4: UV spectra of 140 μM Cu2+ ions, 100 μM PPDA, and 140 μM Cu2+ ions + 100 μM PPDA; Figure S5: UV spectra of FCDs upon addition of Fe3+; Figure S6: Fluorescence intensity changes of the FCDs under a continuous 365 nm UV lamp irradiation (λex = 365 nm, λem = 452 nm); Figure S7: Longterm photostability of FCDs dispersion for Cu2+ recognition (Cu2+ concentration: 15 μM, λex = 320 nm, λem = 452 nm); Figure S8: Fluorescence intensity changes of the FCDs under pH range 5.0–9.0 upon addition of Cu2+ (Cu2+ concentration: 10 μM, λex = 320 nm, λem = 452 nm); Table S1: Comparison of representative CDs-based sensors for Cu2+ or/and S2− detection; Table S2: Determination of Cu2+ in tap water.

Author Contributions

L.Z. and Y.F. conceived and designed the experiments; Z.W. and J.Z. performed the experiments; L.Z., Y.F., J.J., D.Z., and Z.W. analyzed the data; Z.W. contributed reagents/materials/analysis tools; L.Z. wrote the paper.

Acknowledgments

This work was financially supported by the National Natural Science Foundation of China (21805071); the Key Scientific Research Project of Henan Province (16A150052); the Fundamental Research Funds for the Universities of Henan Province (NSFRF170911); Program for Innovative Research Team of Henan Polytechnic University (T2018-3), and Dr. Funds of Henan polytechnic university (B2016-47).

Conflicts of Interest

The authors declare no conflict of interest.

References

  1. Cotruvo, J.A.; Aron, A.T.; Ramos-Torres, K.M.; Chang, C.J. Synthetic fluorescent probes for studying copper in biological systems. Chem. Soc. Rev. 2015, 44, 4400–4414. [Google Scholar] [CrossRef] [PubMed] [Green Version]
  2. Kong, D.; Yan, F.; Shi, D.; Ye, Q.; Han, Z.; Chen, L.; Wang, L. Carbon dots: Synthetic methods and applications as fluorescent probes for the detection of metal ions, inorganic anions and organic molecules. J. Iran. Chem. Soc. 2015, 12, 1841–1857. [Google Scholar] [CrossRef]
  3. Liu, Y.S.; Zhao, Y.N.; Zhang, Y.Y. One-step green synthesized fluorescent carbon nanodots from bamboo leaves for copper(II) ion detection. Sens. Actuators B-Chem. 2014, 192, 647–652. [Google Scholar] [CrossRef]
  4. Barati, A.; Shamsipur, M.; Abdollahi, H. Metal-ion-mediated fluorescent carbon dots for indirect detection of sulfide ions. Sensor. Actuat. B-Chem. 2016, 230, 289–297. [Google Scholar] [CrossRef]
  5. Kimura, H. Hydrogen sulfide: Its production, release and functions. Amino Acids 2011, 41, 113–121. [Google Scholar] [CrossRef] [PubMed]
  6. Hou, X.F.; Zeng, F.; Du, F.K.; Wu, S.Z. Carbon-dot-based fluorescent turn-on sensor for selectively detecting sulfide anions in totally aqueous media and imaging inside live cells. Nanotechnology 2013, 14, 335502–335510. [Google Scholar] [CrossRef] [PubMed]
  7. Chen, J.; Li, Y.; Lv, K.; Zhong, W.; Wang, H.; Wu, Z.; Yi, P.; Jiang, J. Cyclam-functionalized carbon dots sensor for sensitive and selective detection of copper(II) ion and sulfide anion in aqueous media and its imaging in live cells. Sensor. Actuat. B-Chem. 2016, 224, 298–306. [Google Scholar] [CrossRef]
  8. Xiong, W.; Zhou, L.; Liu, S.T. Development of gold-doped carbon foams as a sensitive electrochemical sensor for simultaneous determination of Pb (II) and Cu (II). Chem. Eng. J. 2016, 284, 650–656. [Google Scholar] [CrossRef]
  9. Spilker, B.; Randhahn, J.; Grabow, H.; Beikirch, H.; Jeroschewski, P. New electro-chemical sensor for the detection of hydrogen sulfide and other redox activespecies. J. Electroanal. Chem. 2008, 612, 121–130. [Google Scholar] [CrossRef]
  10. Liu, Y.; Liang, P.; Guo, L. Nanometer titanium dioxide immobilized on silica gel as sorbent for preconcentration of metal ions prior to their determination by inductively coupled plasma atomic emission spectrometry. Talanta 2005, 68, 25–30. [Google Scholar] [CrossRef]
  11. Colon, M.; Todoli, J.L.; Hidalgo, M.; Iglesias, M. Development of novel and sensitive methods for the determination of sulfide in aqueous samples by hydrogensulfide generation-inductively coupled plasma-atomic emission spectroscopy. Chem. Phys. Lett. 2008, 609, 160–168. [Google Scholar]
  12. Carter, K.P.; Young, A.M.; Palmer, A.E. Fluorescent sensors for measuring metal ions in living systems. Chem. Rev. 2014, 114, 4564–4601. [Google Scholar] [CrossRef]
  13. Xuan, W.M.; Sheng, C.Q.; Cao, Y.T.; He, W.H.; Wang, W. Fluorescent probes for the detection of hydrogen sulfide in biological systems. Angew. Chem. Int. Ed. 2012, 51, 2282–2284. [Google Scholar] [CrossRef] [PubMed]
  14. Yan, Y.; Yu, H.; Zhang, Y.; Zhang, K.; Zhu, H.; Yu, T.; Jiang, H.; Wang, S. Molecularly engineered quantum dots for visualization of hydrogen sulfide. ACS. Appl. Mater. Int. 2015, 7, 3547–3553. [Google Scholar] [CrossRef] [PubMed]
  15. Ute, R.G.; Markus, G.; Sara, C.J.; Roland, N.; Thomas, N. Quantum dots versus organic dyes as fluorescent labels. Nat. Methods 2008, 5, 763–775. [Google Scholar]
  16. Kirchner, C.; Liedl, T.; Kudera, S.; Pellegrino, T.; Muñoz Javier, A.; Gaub, H.E.; Stölzle, S.; Fertig, N.; Parak, W.J. Cytotoxicity of colloidal CdSe and CdSe/ZnS nanoparticles. Nano Lett. 2005, 5, 331–338. [Google Scholar] [CrossRef] [PubMed]
  17. Niu, F.H.; Ying, Y.L.; Hua, X.; Niu, Y.S.; Xu, Y.H.; Long, Y.T. Electrochemically generated green-fluorescent N-doped carbon quantum dots for facile monitoring alkaline phosphatase activity based on the Fe3+-mediating on-off-on-off fluorescence principle. Carbon 2018, 127, 340–348. [Google Scholar] [CrossRef]
  18. Namdari, P.; Negahdari, B.; Eatemadi, A. Synthesis, properties and biomedical applications of carbon-based quantum dots: An updated review. Biomed. Pharmacother. 2017, 87, 209–222. [Google Scholar] [CrossRef]
  19. Du, Y.; Guo, S.J. Chemically doped fluorescent carbon and graphene quantum dots for bioimaging, sensor, catalytic and photoelectronic applications. Nanoscale 2016, 8, 2532–2543. [Google Scholar] [CrossRef]
  20. Das, P.; Ganguly, S.; Mondal, S.; Bose, M.; Das, A.K.; Banerjee, S.; Das, N.C. Heteroatom doped photoluminescent carbon dots for sensitive detection of acetone in human fluids. Sens. Actuators B-Chem. 2018, 266, 583–593. [Google Scholar] [CrossRef]
  21. Li, X.; Xie, Y.; Song, B.; Zhang, H.-L.; Chen, H.; Cai, H.; Liu, W.; Tang, Y. A stimuli-responsive smart lanthanide nanocomposite for multidimensional optical recording and encryption. Angew. Chem. Int. Ed. 2017, 56, 2689–2693. [Google Scholar] [CrossRef] [PubMed]
  22. Wang, Q.; Huang, X.; Long, Y.; Wang, X.; Zhang, H.; Zhu, R.; Liang, L.; Teng, P.; Zheng, H. Hollow luminescent carbon dots for drug delivery. Carbon 2013, 59, 192–199. [Google Scholar] [CrossRef]
  23. Zheng, X.T.; Ananthanarayanan, A.; Luo, K.Q.; Chen, P. Glowing graphene quantum dots and carbon dots: properties, syntheses, and biological applications. Small 2015, 11, 1620–1636. [Google Scholar] [CrossRef] [PubMed]
  24. Dong, Y.Q.; Wang, R.X.; Li, G.L.; Chen, C.Q.; Chi, Y.W.; Chen, G.N. Polyamine-functionalized carbon quantum dots as fluorescent probes for selective and sensitive detection of copper ions. Anal. Chem. 2012, 84, 6220–6224. [Google Scholar] [CrossRef] [PubMed]
  25. Wang, Q.; Liu, X.; Zhang, L.C.; Lv, Y. Microwave-assisted synthesis of carbonnanodots through an eggshell membrane and their fluorescent application. Analyst 2012, 137, 5392–5397. [Google Scholar] [CrossRef] [PubMed]
  26. Zhang, L.N.; Liu, A.L.; Liu, Y.X.; Shen, J.X.; Du, C.X.; Hou, H.W. A luminescent europium metal-organic framework with free phenanthroline sites for highly selective and sensitive sensing of Cu2+ in aqueous solution. Inorg. Chem. Commun. 2015, 56, 137–140. [Google Scholar] [CrossRef]
  27. Zhu, A.; Luo, Z.; Ding, C.; Li, B.; Zhou, S.; Wang, R.; Tian, Y. A two-photon “turn-on” fluorescent probe based on carbon nanodots for imaging and selective biosensing of hydrogen sulfide in live cells and tissues. Analyst 2014, 139, 1945–1952. [Google Scholar] [CrossRef]
  28. Zhu, S.; Meng, Q.; Wang, L.; Zhang, J.; Song, Y.; Jin, H.; Zhang, K.; Sun, H.; Wang, H.; Yang, B. Highly photoluminescent carbon dots for multicolor patterning, sensors, and bioimaging. Angew. Chem. Int. Ed. 2013, 52, 3953–3957. [Google Scholar] [CrossRef]
  29. Zhu, A.W.; Qu, Q.; Shao, X.L.; Kong, B.; Tian, Y. Carbon-dot-based dual-emission nanohybrid produces a ratiometric fluorescent sensor for in vivo imaging of cellular copper ions. Angew. Chem. Int. Ed. 2012, 51, 7185–7189. [Google Scholar] [CrossRef]
  30. Liu, X.J.; Zhang, N.; Bing, T.; Shangguan, D.H. Carbon dots based dual-emission silica nanoparticles as a ratiometric nanosensor for Cu2+. Anal. Chem. 2014, 86, 2289–2296. [Google Scholar] [CrossRef]
  31. Baker, C.; Laminack, W.; Gole, J.L. Sensitive and selective detection of H2S and application in the presence of toluene, benzene, and xylene. Sens. Actuators B-Chem. 2015, 212, 28–34. [Google Scholar] [CrossRef]
Figure 1. Schematic diagram of functionalized carbon dots (FCDs) for Cu2+ and S2− recognition.
Nanomaterials 08 01071 g001
Figure 2. Schematic diagram of the preparation for FCDs.
Nanomaterials 08 01071 g002
Figure 3. (a) IR spectra of carbon dots (CDs) and FCDs; (b) UV spectra of FCDs upon addition of Cu2+; (c) TEM and (d) the size distribution histogram of the FCDs.
Nanomaterials 08 01071 g003
Figure 4. (a) Fluorescence (FL) spectra (λex = 320 nm) of FCDs upon addition of Cu2+; (b) Plot of the FL intensity of FCDs against Cu2+ concentration, λex = 320 nm, λem = 452 nm.
Nanomaterials 08 01071 g004
Figure 5. UV–vis (a, b), FL excitation (c, d) and FL emission spectra (e, f) of the FCD solution in the absence (a, c, e) and presence (b, d, f) of 50 μM Cu2+.
Nanomaterials 08 01071 g005
Figure 6. (a) FL intensity changes (F/F0) of FCDs upon addition of various metal ions (10 μM). (b) The effect of coexisting metal ions (10 μM) on selective sensing of Cu2+ by FCDs (Blk is only 10 µM Cu2+, λex = 320 nm, λem = 452 nm).
Nanomaterials 08 01071 g006
Figure 7. (a) FL response of the FCD–Cu2+ system (20 µM of Cu2+ in dilute FCD dispersion) upon the addition of S2− (0–20 µM, λex = 320 nm). (b) Plot of FL intensity of FCD–Cu2+ against S2− concentration, λex = 320 nm, λem = 452 nm.
Nanomaterials 08 01071 g007
Figure 8. (a) FL response of FCD–Cu2+ upon addition of various anions (15 µM). (b) The effect of various coexisting anions (15 µM) on selective sensing of S2− by FCD–Cu2+ system (Blk is 20 µM Cu2+ and 15 µM S2−, λex = 320 nm, λem = 452 nm).
Nanomaterials 08 01071 g008
Figure 9. Confocal images of HeLa cells incubated with FCDs sensor (FCD, 50 µg mL−1, A,D) and treated with 50 µM (B,E) and 100 µM (C,F) of Cu2+. The overlay images confirm the signals are from in-cell FCDs, not interference.
Nanomaterials 08 01071 g009
Figure 10. Confocal images of HeLa cells incubated with the FCD sensor (FCD, 50 µg mL−1) and 100 µM of Cu2+ (A,D), and then treated with 75 µM (B,E) and 150 µM of S2− (C,F). The overlay images confirm the signals are from in-cell FCDs, not interference.
Nanomaterials 08 01071 g010

