Article

High Performance Acetylene Sensor with Heterostructure Based on WO3 Nanolamellae/Reduced Graphene Oxide (rGO) Nanosheets Operating at Low Temperature

1
State Key Laboratory of Power Transmission Equipment & System Security and New Technology, Chongqing University, Chongqing 400044, China
2
School of Electrical Engineering, Chongqing University, Chongqing 400044, China
3
State Grid Zhejiang Electric Power Co., Ltd., Hangzhou 310000, China
*
Authors to whom correspondence should be addressed.
Nanomaterials 2018, 8(11), 909; https://doi.org/10.3390/nano8110909
Submission received: 6 October 2018 / Revised: 24 October 2018 / Accepted: 3 November 2018 / Published: 5 November 2018

Abstract

:
The development of functionalized metal oxide/reduced graphene oxide (rGO) hybrid nanocomposites concerning power equipment failure diagnosis is one of the most recent topics. In this work, WO3 nanolamellae/reduced graphene oxide (rGO) nanocomposites with different contents of GO (0.5 wt %, 1 wt %, 2 wt %, 4 wt %) were synthesized via controlled hydrothermal method. X-ray diffraction (XRD), transmission electron microscopy (TEM), Raman spectroscopy, X-ray photoelectron spectroscopy (XPS), thermogravimetric analyses-derivative thermogravimetric analysis-differential scanning calorimetry (TG-DTG-DSC), BET, and photoluminescence (PL) spectroscopy were utilized to investigate morphological characterizations of prepared gas sensing materials and indicated that high quality WO3 nanolamellae were widely distributed among graphene sheets. Experimental ceramic planar gas sensors composing of interdigitated alumina substrates, Au electrodes, and RuO2 heating layer were coated with WO3 nanolamellae/reduced graphene oxide (rGO) films by spin-coating technique and then tested for gas sensing towards multi-concentrations of acetylene (C2H2) gases in a carrier gas with operating temperature ranging from 50 °C to 400 °C. Among four contents of prepared samples, sensing materials with 1 wt % GO nanocomposite exhibited the best C2H2 sensing performance with lower optimal working temperature (150 °C), higher sensor response (15.0 toward 50 ppm), faster response-recovery time (52 s and 27 s), lower detection limitation (1.3 ppm), long-term stability, and excellent repeatability. The gas sensing mechanism for enhanced sensing performance of nanocomposite is possibly attributed to the formation of p-n heterojunction and the active interaction between WO3 nanolamellae and rGO sheets. Besides, the introduction of rGO nanosheets leads to the impurity of synthesized materials, which creates more defects and promotes larger specific area for gas adsorption, outstanding conductivity, and faster carrier transport. The superior gas sensing properties of WO3/rGO based gas sensor may contribute to the development of a high-performance ppm-level gas sensor for the online monitoring of dissolved C2H2 gas in large-scale transformer oil.

1. Introduction

Large-scale power transformers are one of the most essential equipment in power system and the stability of the power system will be seriously disturbed when faults occur during the normal operation of power transformers [1]. These faults have the possibility to cause the degradation of power quality, blackouts, and lead to a considerable property loss [2]. Therefore, it is significant to monitoring the operation state of large-scale power transformers and guarantee their proper functioning. During the long-time running of power transformers, incipient thermal or discharge faults might occur at high voltage working condition and cause physical damage to the insulation system inside power transformers which is mainly composed of paper and oil [3,4]. Hence, the C-C and C-H bond may decompose and generate a serious of hydrogen and carbon compound when the insulation system is exposed to extreme heat and discharging [5]. These hydrogen and carbon might react with each other and lead to the formation of various dissolved gases, like hydrogen (H2), carbon monoxide (CO), carbon oxide (CO2), methane (CH4), and acetylene (C2H2) [6]. Existing faults diagnosis methods, such as IEC ratio method [7], Rogers ratio method [8], are mainly based on the concentrations proportion of different dissolved gases. Therefore, it is necessary to detect concentrations of dissolved gases in power transformer. In addition, the C2H2 gas is a colorless combustible hydrocarbon with fragrance, which is widely utilized in many industrial fields, like welding, metal cutting, and in dry-cell batteries, etc. However, the explosion limit of C2H2 gas is 2.3–72.3% (Vol) and it has the danger of explosion under conditions, like heating, shake, and electric spark [9,10]. Thus, it is crucial to detect the concentrations of C2H2 gas in other industrial fields as well except the C2H2 detection on power transformer faults monitoring and diagnosis field.
Metal Oxides (MOs), which change their resistance in ambient gases, are promising materials for gas type and concentration detection [11]. Many MOs are appropriate for gas detection, such as CuO, NiO, TiO3, ZnO, etc. Among various MOs, tungsten trioxide (WO3) is an important n-type semiconductor and it has been considered as one of the outstanding gas sensing materials because of its applicability for reducing and oxidizing gases detection, low cost, and being environmentally friendly [12,13,14]. Furthermore, morphological modulation and doping of WO3 has been utilized to enhance the sensing response. Flower-like WO3 [15], Pd-doped WO3 [16], and Pt-doped WO3 [17] have been reported for WO3 gas sensing performance promotion. However, drawbacks like high working temperature, poor selectivity still restrain the application of WO3 gas sensing materials [18].
To overcome these limitations and improve the gas sensing performance of WO3 sensing materials, the hybridization of WO3 and reduced graphene oxide (rGO) have been investigated. The strong interaction between WO3 and rGO improves sensing properties, because of excellent chemical, electronic, and mechanical properties of rGO. rGO provides more adsorption sites, larger specific areas, and high conductivity to enhance the gas sensing capability. Kaur et al. [19] investigated the influence of temperature on selective detection of hydrogen and acetone based on WO3/rGO nanocomposites and found that the introduction of rGO reduced the optimal temperature. Shi et al. [20] investigated H2S sensing by employing reduced graphene oxide/hexagonal WO3 nanosheet composites. Although, other research groups have devoted plenty of time on the trace H2, CO2, CO, H2S, and CH4 gas detection and many promising detection achievements have been obtained. However, there are few studies on C2H2 gas detection at the ppm level. Our group has reported Au and Pt-doped SnO2 nanocomposites that were prepared by hydrothermal method for acetylene detection, which is restrained by the cost [21]. Zhang et al. [22] has reported WO3 nanowire and nanorod were used to detect acetylene. However, the concentration of acetylene detected cannot meet requirements for transformer faults diagnosis. The application of WO3/rGO nanocomposites prepared through simple hydrothermal method for acetylene detection has not been investigated yet, and it is significant to find such a material for ppm level acetylene detection. Nanocomposites based high performance sensors are cost effective which make it practical for industrial production.
In this work, we investigated gas sensing properties of prepared materials, including the optimal working temperature, dynamic sensing transient, response and recovery time, long-term stability, and repeatability. We employed hydrothermal method to synthesize four contents of WO3/rGO nanocomposites (0.5, 1, 2, 4 wt %). Pure WO3 and rGO were synthesized as comparison as well. Subsequently, prepared samples were characterized by X-ray diffraction (XRD), Raman spectra, transmission electron microscopy (TEM), X-ray photoelectron spectroscopy (XPS), thermogravimetric analyses (TG), differential scanning calorimetry (DSC), derivative thermogravimetric analysis (DTG), BET analyses, and photoluminescence (PL) emission. Afterwards, ceramic planar gas sensors were fabricated to examine the gas sensing performance to ppm level C2H2 gas. Ultimately, the gas sensing mechanism was discussed. The main aim of this work is to fabricate a high-performance C2H2 gas sensor that can operate at low temperature for large power transformer faults monitoring.

2. Materials and Methods

2.1. Materials

The commercially available extra pure graphite fine powder was purchased from XFNANO Materials Technology Co., Ltd. (Nanjing, China). Sulphuric acid (98%), potassium permanganate (99%), Hydrazine hydrate (80%), ammonia solution (30%), and diallyldimethylammonium chloride (PDDA) solution (60%) were purchased from Aladdin Chemical Reagent Co., Ltd. (Shanghai, China). Sodium tungstate dihydrate (Na2WO4·2H2O) and hydrochloric acid (35–38%) were purchased from Chuandong Chemical Reagent Co., Ltd. (Chongqing, China). All the chemicals were used as received without further purification.

2.2. Synthesis of WO3/rGO Nanocomposites

Graphite oxide (GO), which is the precursor of rGO, has been prepared from extra pure graphite powder by utilizing the well-known modified Hummer’s method [23]. Four proportions of WO3/rGO nanocomposites were synthesized via hydrothermal method by using different amount of GO (0.5, 1, 2, and 4 wt %). Firstly, an appropriate amount of GO was added into 50 mL deionized water that contained 4 mL of PDDA and then ultrasonicated for 1 h to achieve a dispersed suspension. It is worth to be noticed that nanocomposites prepared without use of PDDA result in almost no attachment between WO3 nanolamellae and rGO sheets. Next, 2 g of Na2WO4·2H2O was dissolved into the above precursor solution and was kept stirring for 0.5 h. Afterwards, a certain ratio of acid solution (10 mL HCI in 20 mL deionized water) was added dropwise into the above solution under sustaining stirring until the pH value was adjusted to 2.0. Furthermore, 1 mL of hydrazine hydrate was added into the mixed solution. The hydrazine hydrate was used here to reduce GO into rGO. Subsequently, the solution was transferred to 100 mL Teflon-lined, stainless-steel autoclave that was heated at 180 °C for 24 h. The obtained products were collected in culture dishes after centrifugal separation and washing for several times. Ultimately, culture dishes with products were moved to a drying oven for overnight drying at 60 °C.
The pure WO3 samples were prepared as a comparison group as well and the preparation process is the same as above steps, except the addition of GO and PDDA.

2.3. Characterization Techniques

The microstructure and morphology of prepared samples were analyzed. X-ray diffraction (XRD) data were recorded on Bruker D8 Advance (Bruker, Karlsruhe, Germany) at 40 kV/30 mA with Cu k α radiation ( λ = 0.15418 nm). Transmission electron microscopy (TEM) and high-resolution microscopy (HRTEM) were analyzed on JEOL JEM-2000EX (JEOL, Tokyo, Japan). Raman spectra was conducted on HORIBA Jobin Yvon LaRam (HORIBA Jobin Yvon, Paris, France), equipped with a 532 nm wavelength laser and full-range grating. X-ray photoelectron spectroscopy (XPS) was utilized to study surface chemical analysis by Thermo ESCALAB 250Xi spectrometer (Thermo Fisher Scientific, Waltham, MA, USA) with an Al- k α radiation source. TG-DSC-DTG analysis was operated on PerkinElmer TGA-8000 (PerkinElmer, Waltham, MA, USA) in nitrogen atmosphere at a heating rate of 10 °C min−1 at the temperature ranging from room temperature to 800 °C. The specific surface area was measured on JWGB JW-BK 100 (JWGB, Beijing, China). Photoluminescence emission spectra (PL) were obtained using 280 nm as an excitation wavelength on PerkinElmer Lamba 45 (PerkinElmer, Waltham, MA, USA).

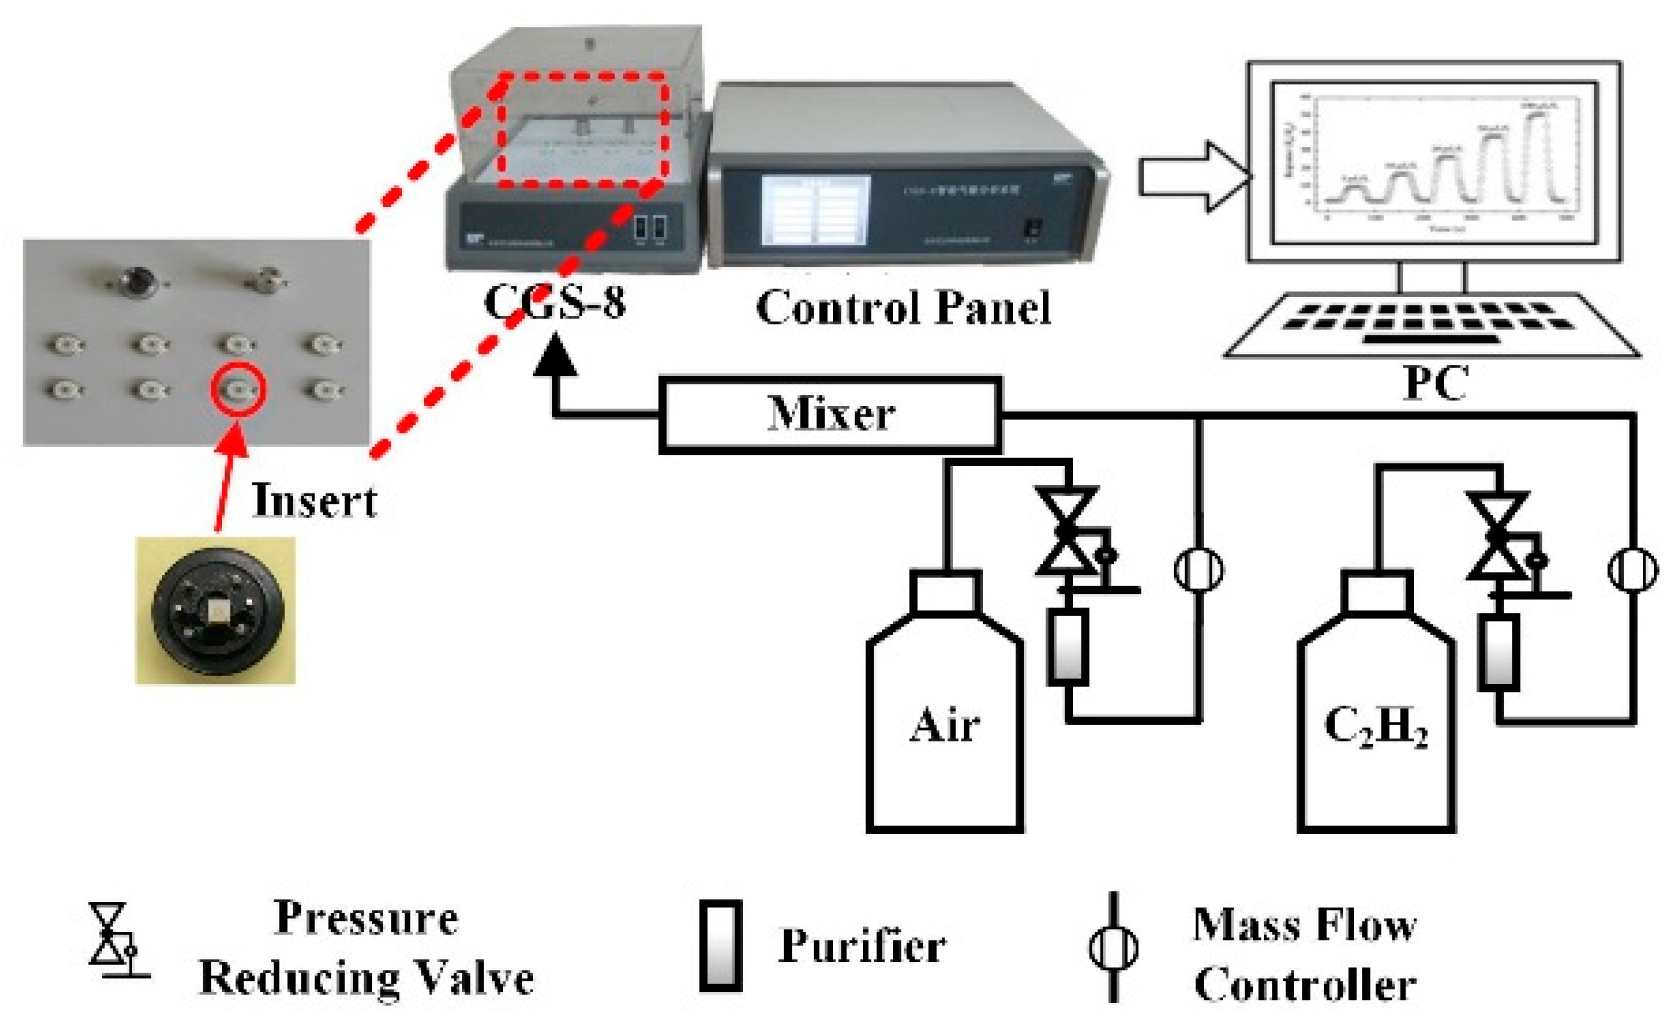
2.4. Fabrication of Planar Gas Sensor

To study the gas sensing effect of synthesized samples, a ceramic planar gas sensor was fabricated. The sensor is mainly composed of fours parts: sensing layer, Au electrode, Al2O3 substrate, and RuO2 heating layer. Figure 1 is the schematic diagram of adoptive planar sensor in this work. Interdigital Au electrode with approximately 300 nm thick foil, 0.2 mm electrode width is manufactured via Chemical Vapor Deposition (CVD) method, and spacing by screen printing technique on 3 × 3 × 0.25 mm (Length × Width × Height) Al2O3 substrate [24,25]. RuO2 layer with approximately 300 nm thick and 0.4 mm2 area is deposited on the back side of Al2O3 substrate as a heater. RuO2 heating layer have properties, like low power dissipation, corrosion resistance, and reliable operation [26]. Therefore, it has been used for chemical sensors for many cases.
Four contents of WO3/rGO nanocomposites were evenly dispersed in a mixture of distilled water and ethanol (ratio 1:1). Next, the binder solution comprising ethyl cellulose (Aladdin Ltd., Shanghai, China, 90–110 mPa) and α -terpineol (Aladdin Ltd., Shanghai, China, 90%) is added into the mixture. Samples were then transferred to a mortar for a 30 min grind to obtain homogeneous gas sensing test paste. Well-mixed test paste was spin-coated on Al2O3 substrate and interdigitated electrodes at 3000 rpm for 30 s to acquire a dense and uniform coating [27]. Subsequently, planar sensors that were coated with corresponding gas sensing materials were aged at 150 °C for 1 h and then annealed at 300 °C for 2 h in an oven for binder removal. Sensors fabricated from pure rGO, pure WO3 and WO3 with 0.5, 1, 2, and 4 wt % GO were labelled as W0G, WG0, WG0.5, WG1, WG2, and WG4, respectively.

2.5. Gas Sensing Measurements

The gas sensing effect of prepared ceramic planar gas sensors for C2H2 were investigated by our gas sensing test analysis system. The total test system that is shown in Figure 2 is made up of a PC, an automatic gas distribution system, a CGS-8 gas sensing characterization analysis system (Elite Technology Co., Ltd., Beijing, China), and a control panel. This analysis system is convenient for adjusting experimental condition and obtaining experimental parameters (working voltage, operating temperature, ambient condition, ohm characteristics, etc.).
Steps of gas sensing test are described below. First, the ceramic planar gas sensors coated with prepared samples were welded on experimental interfaces, which is shown in Figure 1d. Then, well-welded gas sensors were connected to CGS-8 gas sensing characterization analysis system. Subsequently, the operating temperature of sensors was set and air as a carrier gas was injected into the experimental chamber at a constant flux. Next, C2H2 gas was injected when the resistance of planar gas sensors remained stable. After the response data was obtained, air was injected into the chamber again to carry the C2H2 gas out. The concentration of C2H2 gas was controlled by the mass flow controllers (MFCs) with the following equation:
Gas concentration ( ppm ) = Flux   rate C 2 H 2 Flux   rate air + Flux   rate C 2 H 2  
Sensors were tested at temperature ranging from 50 °C to 400 °C for various concentrations of C2H2 gas. The response of sensors was defined as the ratio S = Ra/Rg, where Ra is the resistance of sensors in air and Rg is the resistance of sensors in C2H2 gas at the corresponding concentration. The response time is defined as the time that is taken for sensors to reach 90% of the total resistance change while the recovery time denotes the time needed that 90% of baseline resistance is recovered. The environmental temperature (30 °C) and humidity (25% RH) were kept the constant during the whole experimental process.

3. Results and Discussion

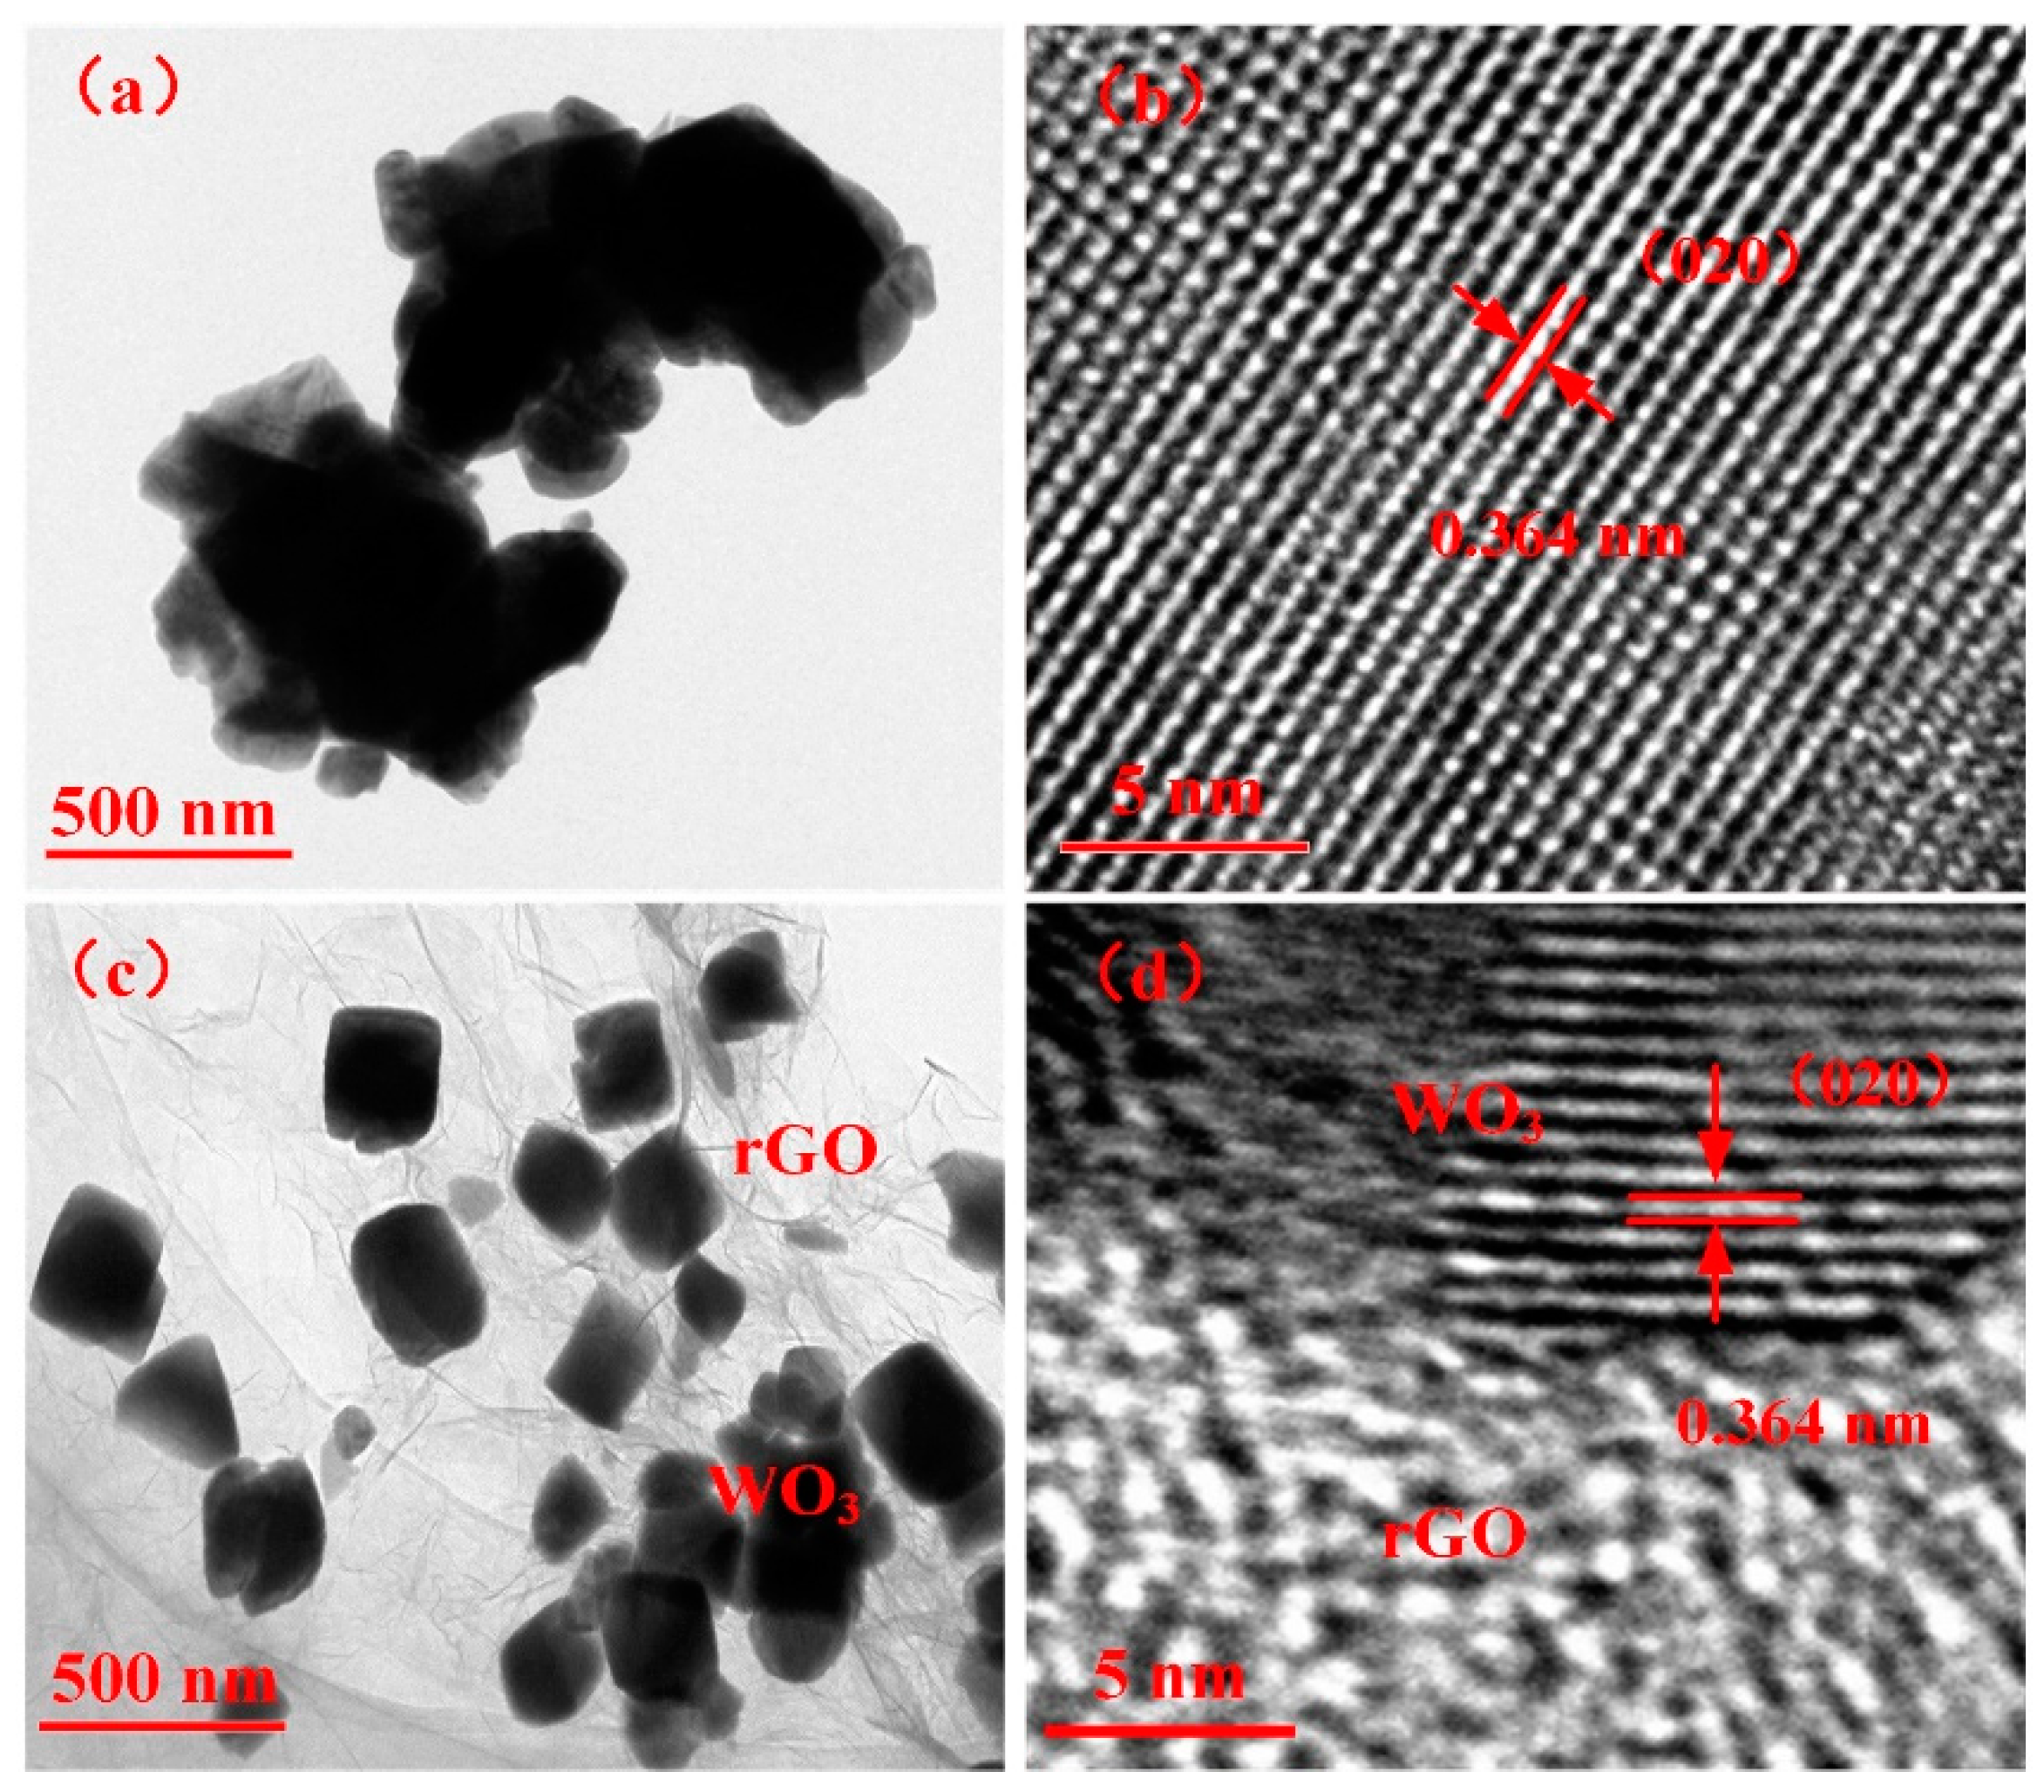
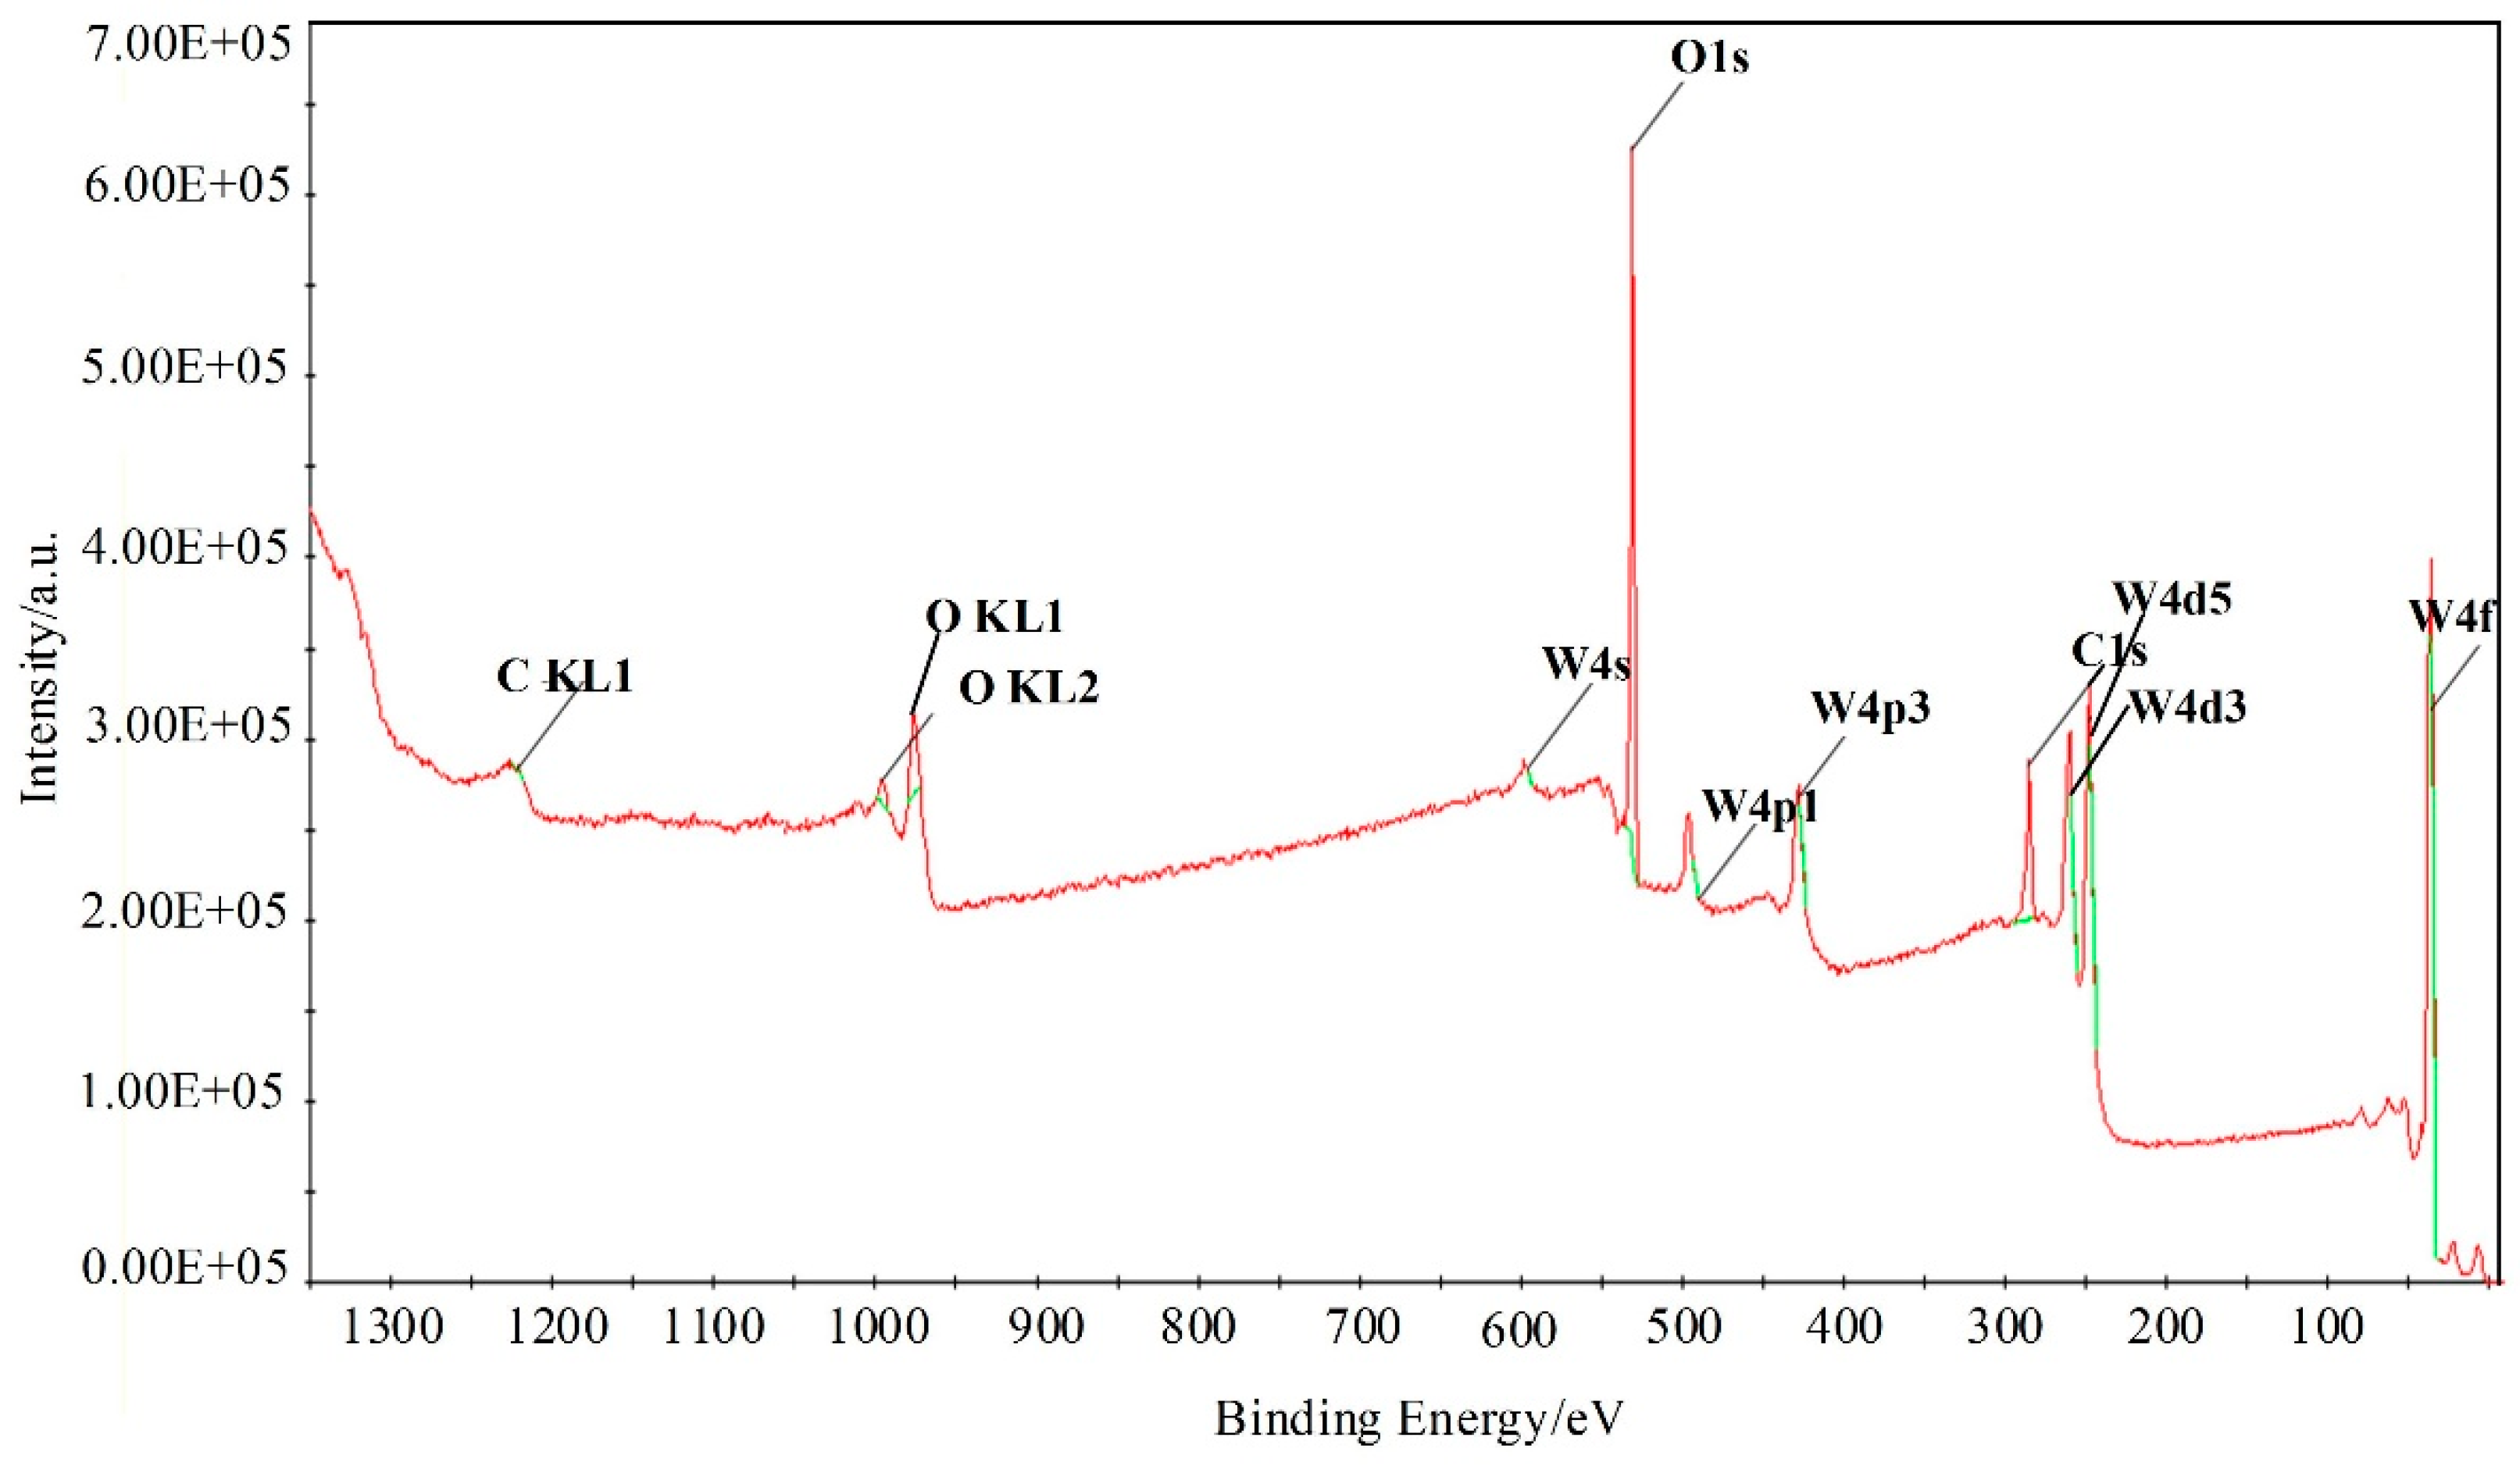
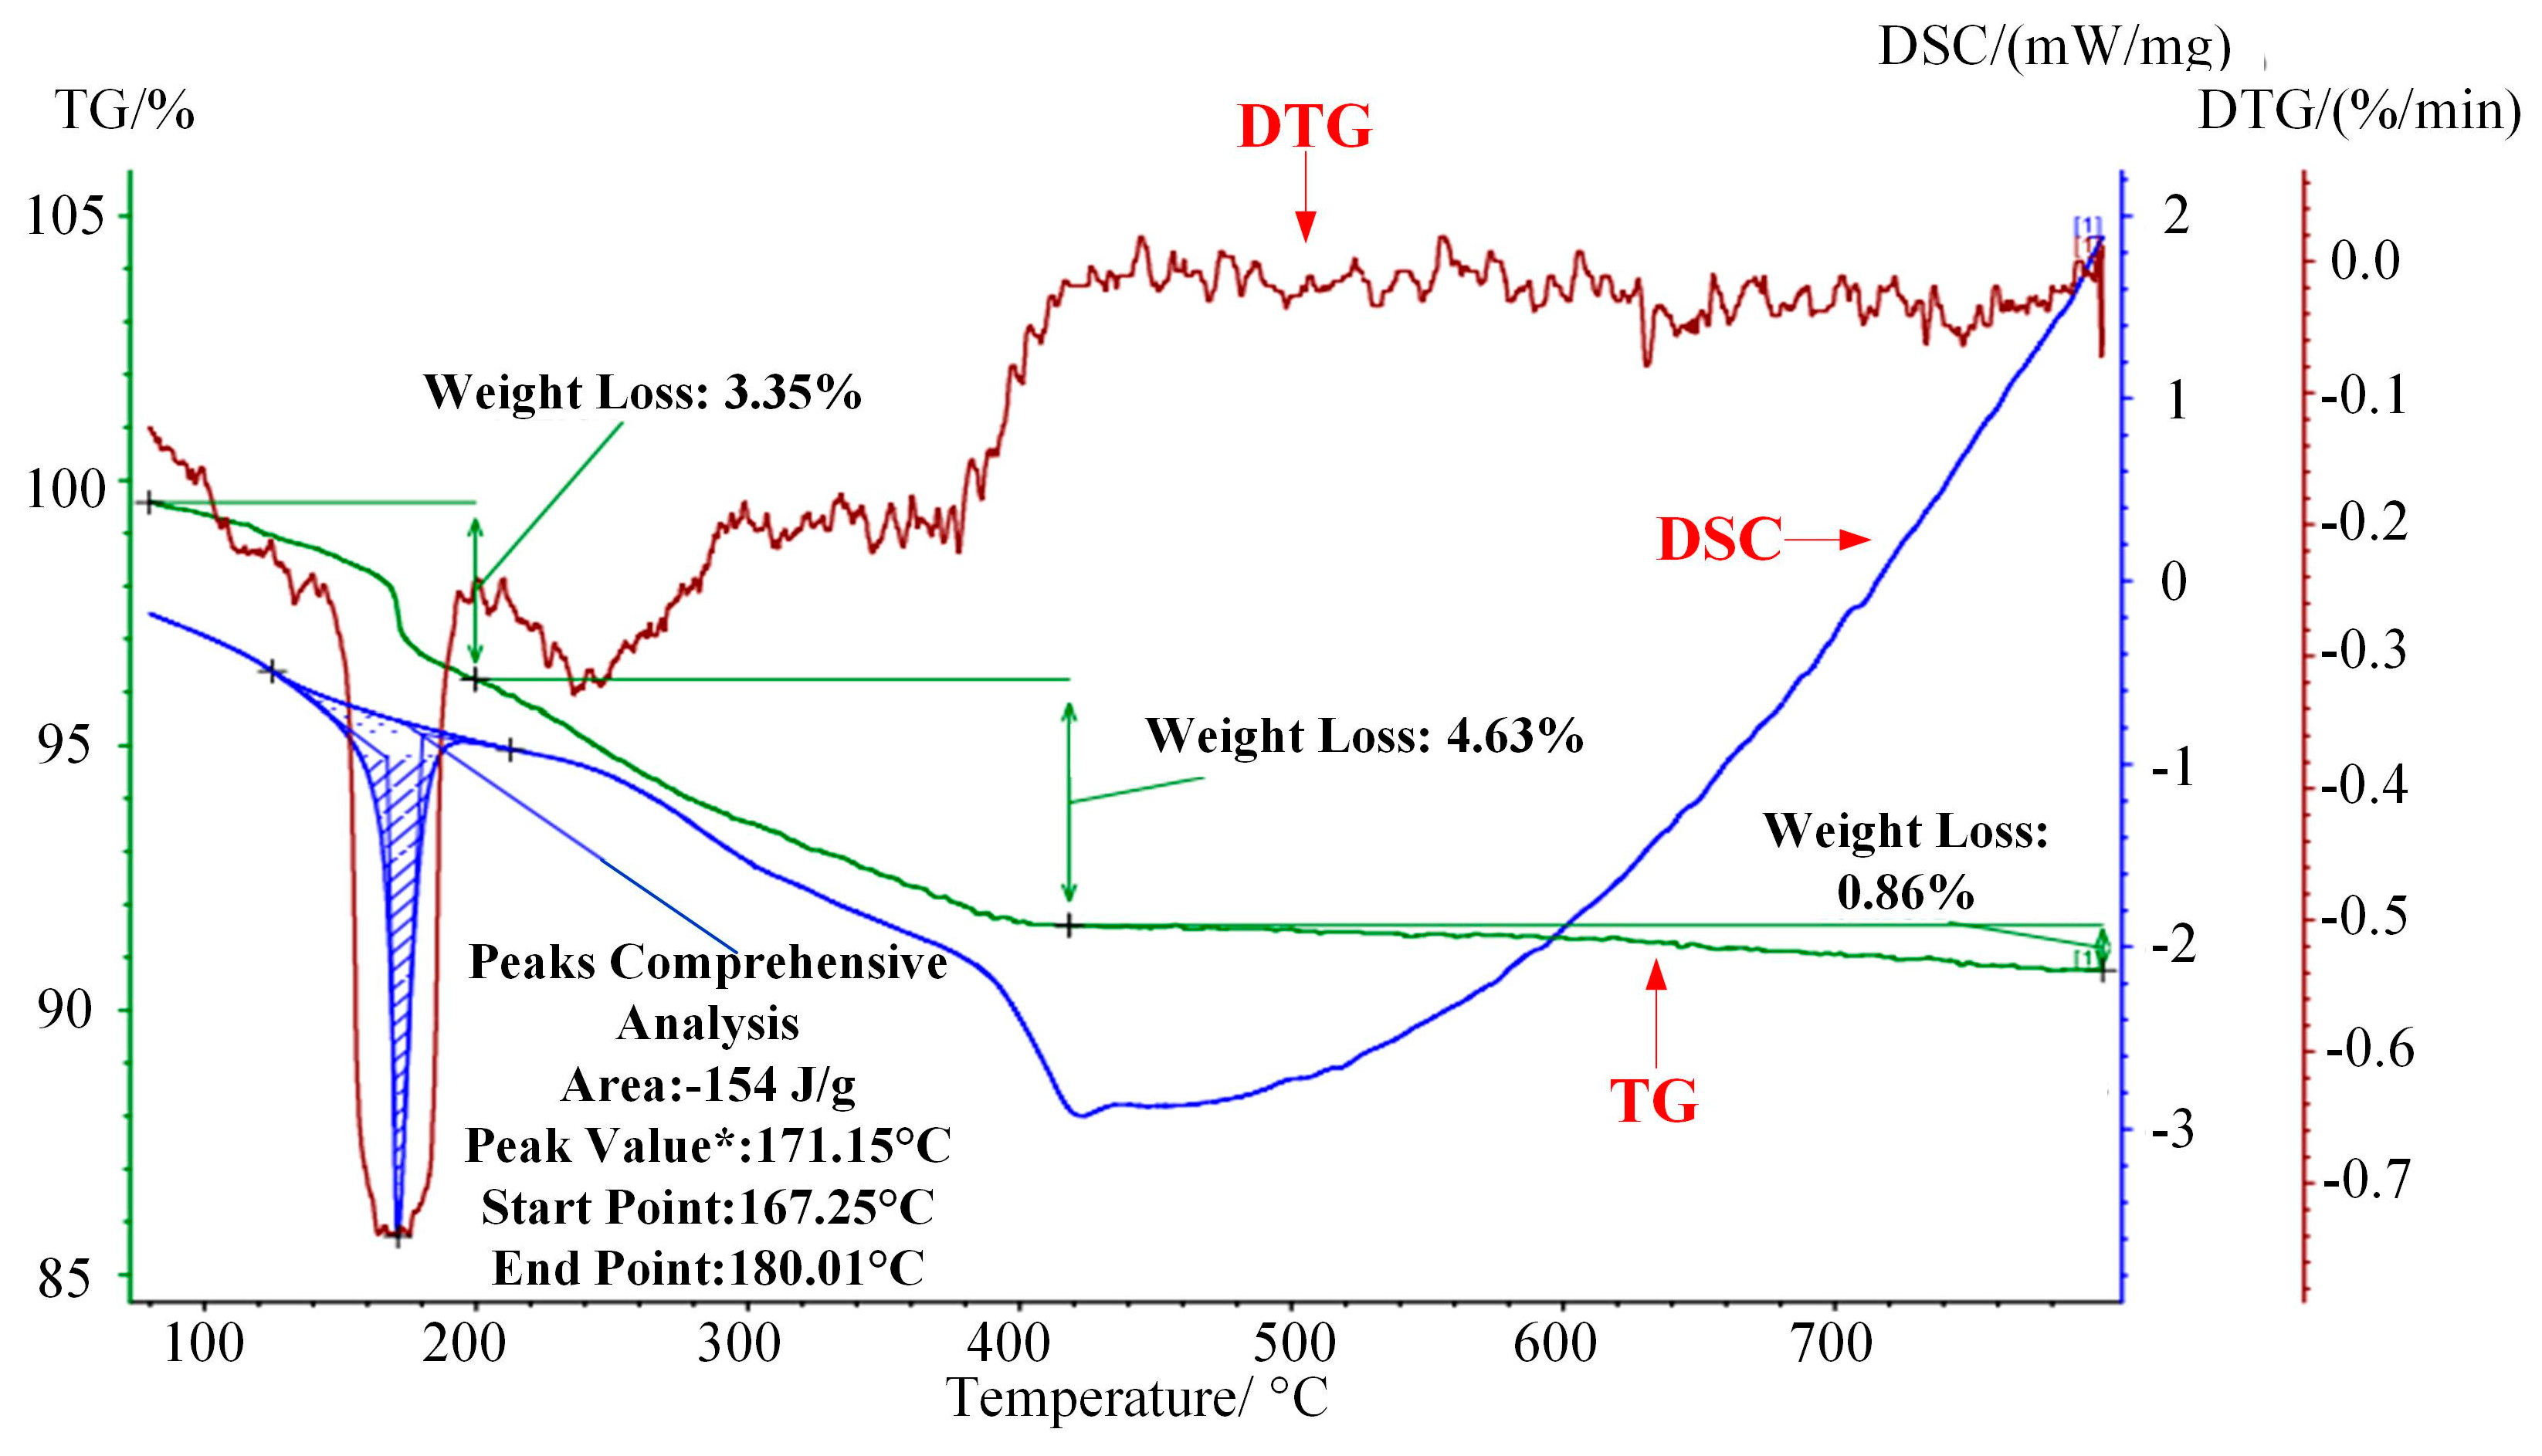
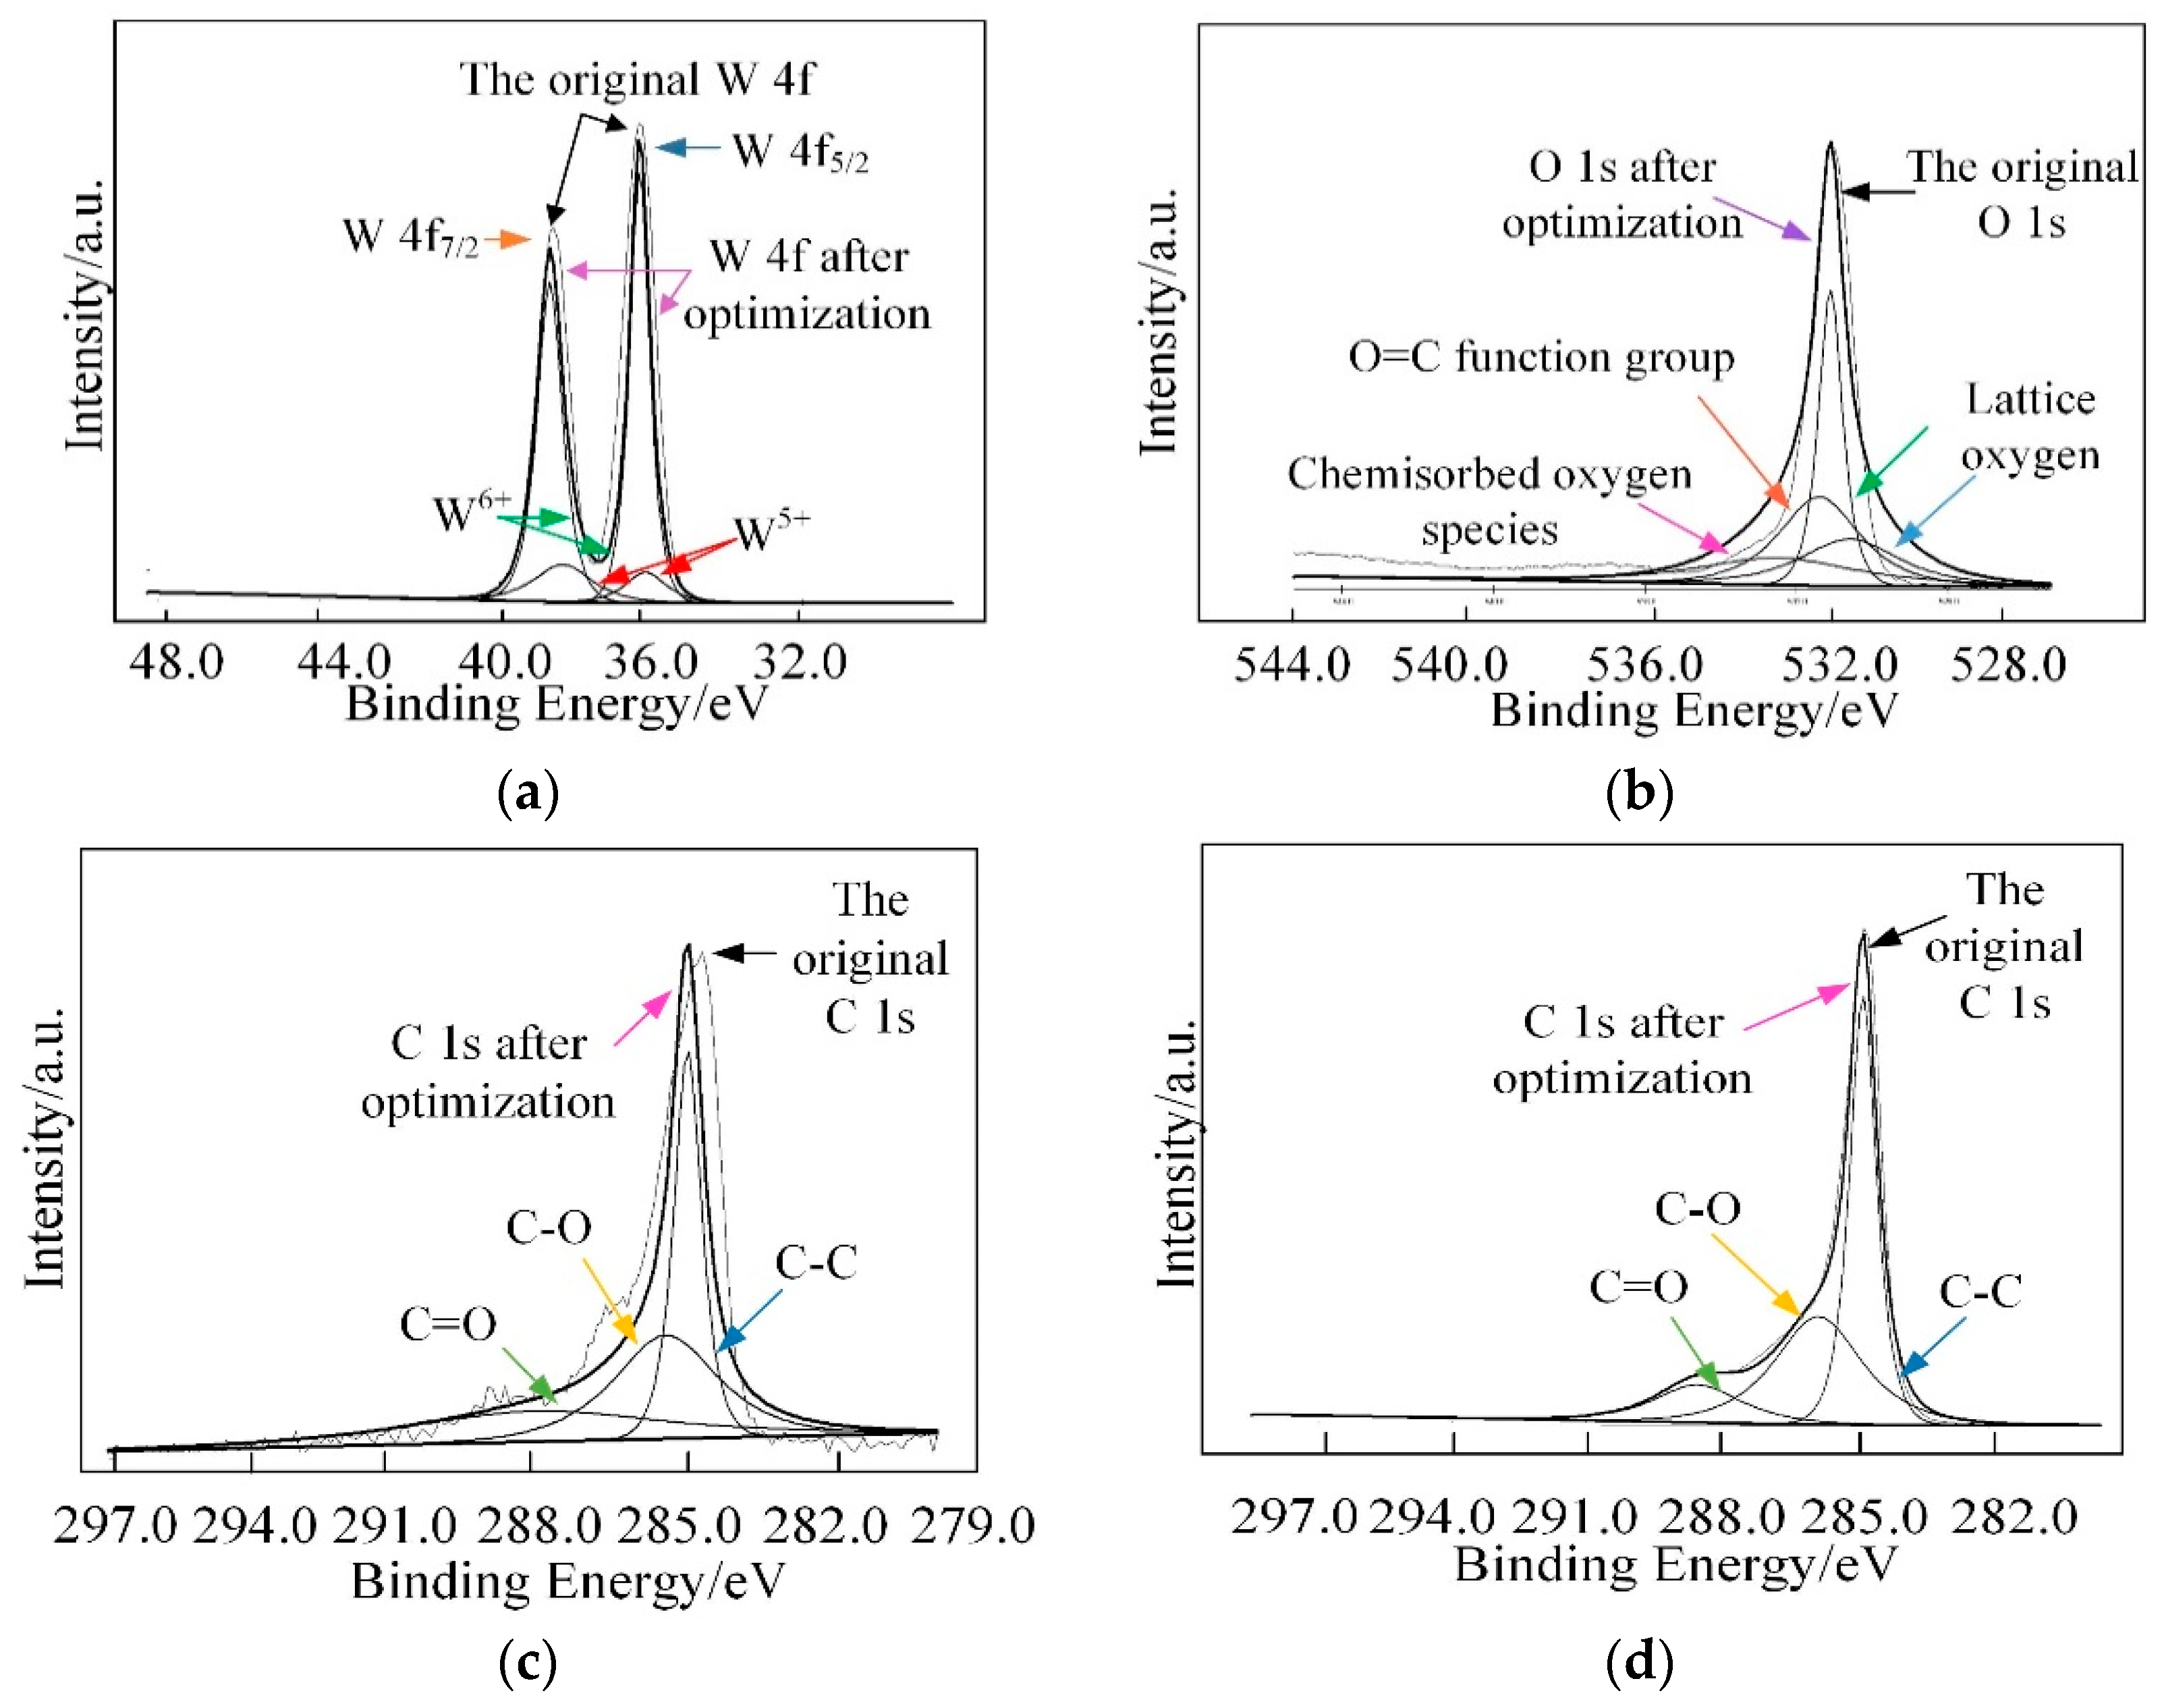
3.1. Structural Characterization

The morphological and structure characterization of prepared sample were detected before gas sensing performance measurement. The crystal structure and phase purity of prepared samples were characterized by XRD. Figure 3a,b illustrates the XRD patterns of GO, rGO, pure WO3, and four contents of WO3/rGO. In Figure 3a, a strong peak at 2θ = 10.90° in XRD pattern of GO, which is related to (001) crystal plane was observed. This peak vanishes when GO are reduced into rGO and replaced by a new peak at 2θ = 24.50° related to (002) crystal plane of rGO (JCPDS-41-1445) [28,29]. In Figure 3b, the XRD pattern of the pure WO3 shows three strong peaks ranging from 22 ° to 25 ° , which correspond to crystal planes (200), (020), and (002), and these three planes are consistent with the monoclinic phase of WO3 nanostructure (JCPDS-43-1035) [30]. Interestingly, in WO3/rGO nanocomposites, no peak related to GO or rGO appears in XRD patterns and the intensity of four contents of WO3/rGO almost have no difference. This is possibly due to the low content and proper exfoliation of rGO sheets [31,32].
The TEM and high-resolution TEM (HRTEM) micrographs of WO3 and WG1 nanocomposites are displayed in Figure 4. Figure 4a shows the TEM micrograph of WO3 and it demonstrates the nanolamellae-like micrograph of the pure WO3 sample. The TEM micrograph of WG1 nanocomposites is exhibited in Figure 4c. The micrograph of WO3/rGO proves the excellent quality of prepared nanocomposites because WO3 nanolamellae are radicated on crumpled rGO sheets. Besides, obvious fold boundary is observed, which indicates the strong interaction between WO3 nanolamellae and rGO sheets. The HRTEM image of WO3 nanolamellae and WO3/rGO nanocomposites are shown in Figure 4b,d, which demonstrates a homogeneous neighboring fringe spacing of WO3 is 0.364 nm and it corresponds to the (020) plane of monoclinic WO3.
Figure 5 shows the Raman spectra of prepared GO, rGO, pure WO3 and WG1 nanocomposites. Raman spectra is a non-destructive and fast method to characterize WO3 and WO3 derivatives [33]. In this work, a 532 nm wavelength laser as an excitation was utilized. The Raman spectroscopy of GO shows three remarkable peaks located at 1342 cm−1, 1600 cm−1, and 2698 cm−1. These three peaks are the well-known disorder-induced (D) band, tangential (G) band, and second-order (2D) band of graphitic materials, respectively [34,35]. After the ultrasonic exfoliation and hydrothermal method, GO was successfully reduced and a tiny shifting of D and G band to lower wavenumbers was observed in rGO and WG1 nanocomposites. Besides, the intensity ratio of the D and G bands (ID/IG) was calculated. The intensity ratio of WG1 and rGO increased compared with GO which also proved GO has been reduced to rGO. The increase of intensity ratio value in WG1 nanocomposite and rGO possibly attributed to the presence of plenty of defects and disorder [36]. Generally, the higher the intensity ratio is, the more defects and disorder are generated in carbon materials [35]. These defects promote the adsorption of oxygen and gas molecules which enhance the gas sensing response [37]. The characteristic bands of WO3 were also detected in WG1 nanocomposites sample. Two strong Raman bands appeared at about 812 cm−1 and 707 cm−1 and this two bands are allocated to stretching vibrational modes of tungsten oxygen bond [38]. Raman bands at about 272 cm−1 and 83 cm−1 are allocated to bending vibrational modes of tungsten oxygen bond [39]. When compared with rGO, the D band is slightly blue-shift by 8 cm−1 in the WG1 nanocomposite, while the G band shows a red-shift of 3 cm−1. These shifts in Raman peak could be attributed to the interaction between WO3 and rGO again. Xu et al. [40] have reported similar experimental results when exploring the Raman peak shift of ZnO/graphene composites. Besides, the tiny bands shifting of D and G band observed in WG1 could be possibly explained by tensile stress at the interface of WO3 and rGO as well. Similarly, experimental phenomenon has been observed by Lo et al. [41].
Furthermore, X-ray photoelectron spectroscopy (XPS) analysis was employed to investigate the surface compositions and chemical states of WG1 nanocomposites, which is shown in Figure 6. As Figure 6 depicted, the peaks of element W, C, and O were present in XPS. Two peaks with binding energy of 36.00 and 38.16 eV are corresponding to W 4f5/2 and W4 f7/2, respectively. These two peaks indicate the existence of W6+. Another two lower intensity peaks at 35.90 and 37.95 eV that are related to W5+ are observed simultaneously. Three peaks at 529.8, 530.7, and 531.7 eV were obtained after deconvolution of the O 1s peak. Among these three peaks, the 530.6 eV and 531.1 eV peaks are attributed to oxidized metal ions in the lattice of WO3, while 531.4 eV peak corresponds to O=C surface groups in GO and the oxygen in WO3. The 532.5 eV peak originated from the oxygen chemisorbed on the surface of prepared nanocomposites. The C 1s peak of WG1 can be separated into three peaks by deconvolution at 285.0 285.5, and 288.5 eV, which are corresponding to the binding energy of C-C, C-O, and C=O, respectively. To ensure a successful reduction reaction of GO in prepared WG1 sample, the C 1s peak of rGO was shown in Figure 7d. Three peaks located at 284.8, 285.8, and 288.5 eV were demonstrated after deconvolution on the original C 1s peak of rGO. The binding energy of C-C, C-O, and C=O in C 1s peak of rGO were in good agreement with the outcomes of C 1s peak in prepared WG1 sample.
The combustion characteristics of WG1 nanocomposites were investigated by utilizing thermogravimetric analysis (TG), differential scanning calorimetry (DSC), and derivative thermogravimetric analysis (DTG). Experimental settings were described, as follows: temperature scanning rate: 10 °C/min; temperature range 80–800 °C and protective atmosphere: N2. As the Figure 8 depicted, the first 3.35% mass loss at around 170 °C, which was accompanied by a sharp DSC peak, was due to the elimination of adsorbed water molecular and the DTG curves showed that a rapid weight loss happened here [42]. Subsequently, a 4.63% weight loss occurred ranging from 200 to 420 °C because of the elimination of oxygen-containing functional groups. CO, CO2, and steam generated along with the pyrolysis of oxygen-containing functional groups, which was along with a progressively decreasing DSC curve [43]. Further weight loss occurred with the pyrolysis of carbon skeleton when temperature was above 450 °C, which was also proved by the curve trend of DSC [44]. It can be concluded that prepared WG1 nanocomposites have good thermal stability at high temperature and the microstructure of WG1 nanocomposites remain stable under 300 °C without much weight loss. The combustion characteristics of WG1 results from the strong interaction between WO3 nanolamellae and rGO sheets.
BET was employed to investigate the specific area of prepared samples. Specific area is a significant factor for the application of synthesized gas sensing materials. Larger specific area can supply more active sites for gas adsorption and enhance the gas sensing response [45]. The BET specific area of WO3 nanolamellae and WG1 nanocomposites were examined. From the measurement outcomes, it showed the BET specific area of WG1 nanocomposites was 25.32 m2/g and much larger than the specific area of pure WO3 nanolamellae, which was 6.3 m2/g. Based on the BET analysis results, it proved that the introduction of rGO enlarge the specific areas of nanocomposites as compared to pure WO3 nanolamellae. As a result, interactions between the detection gas and gas sensing materials are improved and sensor response is enhanced.
Photoluminescence (PL) emission results from the combination of electrons and holes and it can be employed to analyze the impurity and defects distribution of synthesized materials [46]. In the emission spectra, low emission intensity represents a low combination rate of electron hole pairs. Besides, it also supplies the information about the energy states of conduction band and valence band. In this work, PL measurements of WO3, WG1, and WO3-rGO (mechanical mixture of WO3 and 1%wt GO) nanocomposites were operated at room temperature (30 °C) and the spectra was recorded under the excitation of 280 nm wavelength laser. Three highlighted peaks at 356, 434, and 467 nm were presented in Figure 9, which represented the PL spectra of WO3. Among these three peaks, the peak at 356 nm is caused by the near-band edge transition, while the peak at 434 nm is related to the band-to-band transition [47,48]. Besides, the 467 nm band is corresponding to existence of oxygen vacancies [49]. When compared to the PL emission results of WO3, the PL emission band peak of WG1 nanocomposites is notably quenched by rGO [50]. Similar experimental outcomes have been reported. Zhou et al. [51] have reported metal oxide/rGO nanocomposites had significant PL intensity decreasing as compared to same metal oxide nanocomposites without rGO. Yu et al. [52] observed that Sn3O4/rGO heterostructure shows much lower intensity of the emission peak when compared to Sn3O4 nanosheets in the same wavelength range. This outcome demonstrated that the rGO sheets serve as electrons receivers for the WO3 nanolamellae anchoring on them and weak the radiative recombination of electrons and holes. Because rGO sheets serve as electrons receivers, an additional pathway for electrons transfer from the conduction band of excited WO3 to conducting rGO sheets is formed. Consequently, electrons flow across the WO3-rGO interface was markedly enhanced by the electrons that transfer from WO3 nanolamellae to rGO sheets, and the rGO also has a good transport capability, which enhances the performance of prepared nanocomposites [53]. Besides, the introduction of rGO sheets in WO3 nanolamellae prevents the recombination of electrons holes pairs to some degree. Hence, it reduces oxygen to create superoxide radical species with proficient oxidation ability for gas reaction [54]. Ultimately, the PL measurement was operated on the WO3-rGO sample, as well to verify the interaction between WO3 nanolamellae and rGO nanosheets. It is interesting to notice that the PL emission intensity of WO3-rGO is between those of WO3 and WG1. Moreover, the intensity of WO3-rGO decreases lightly, which is possibly attributed to the poor contact of mechanical mixing WO3 and rGO. Chen et al. [55] has reported similar PL emission intensity outcomes when studying the PL properties of pure g-Nis, g-C3N4/NiS-1.5%, and mechanical mixture of g-C3N4 and NiS.

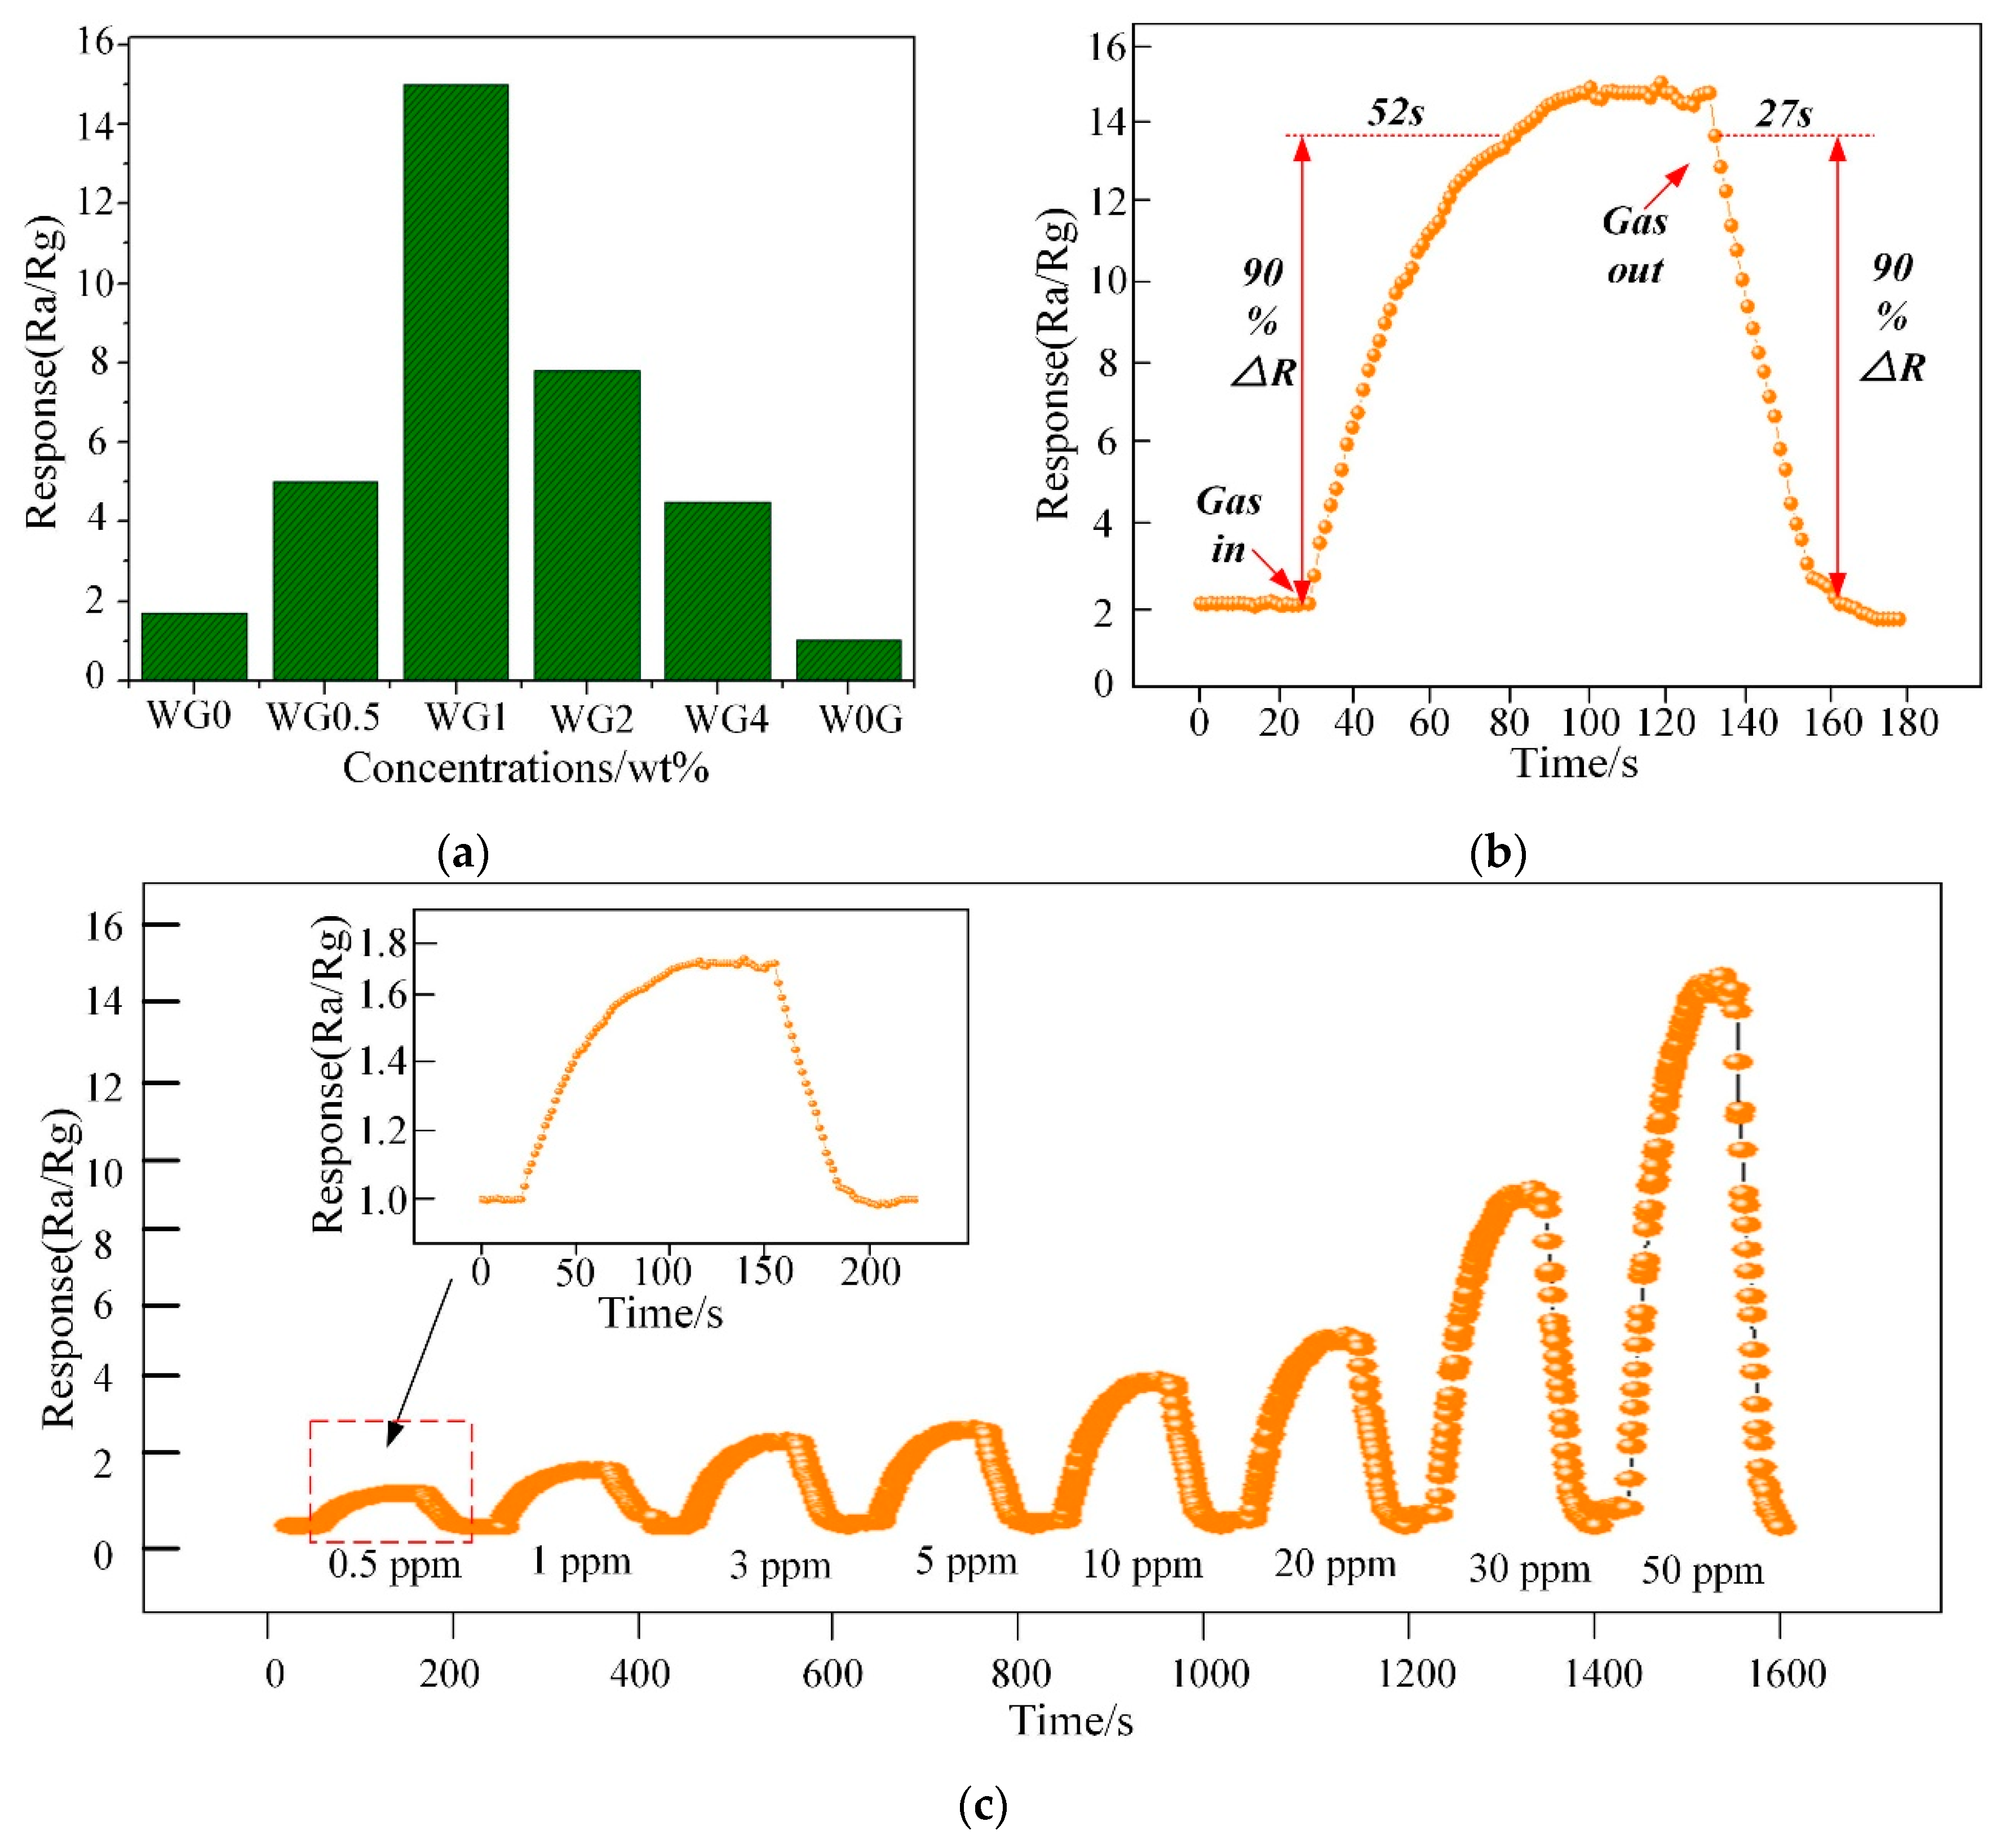
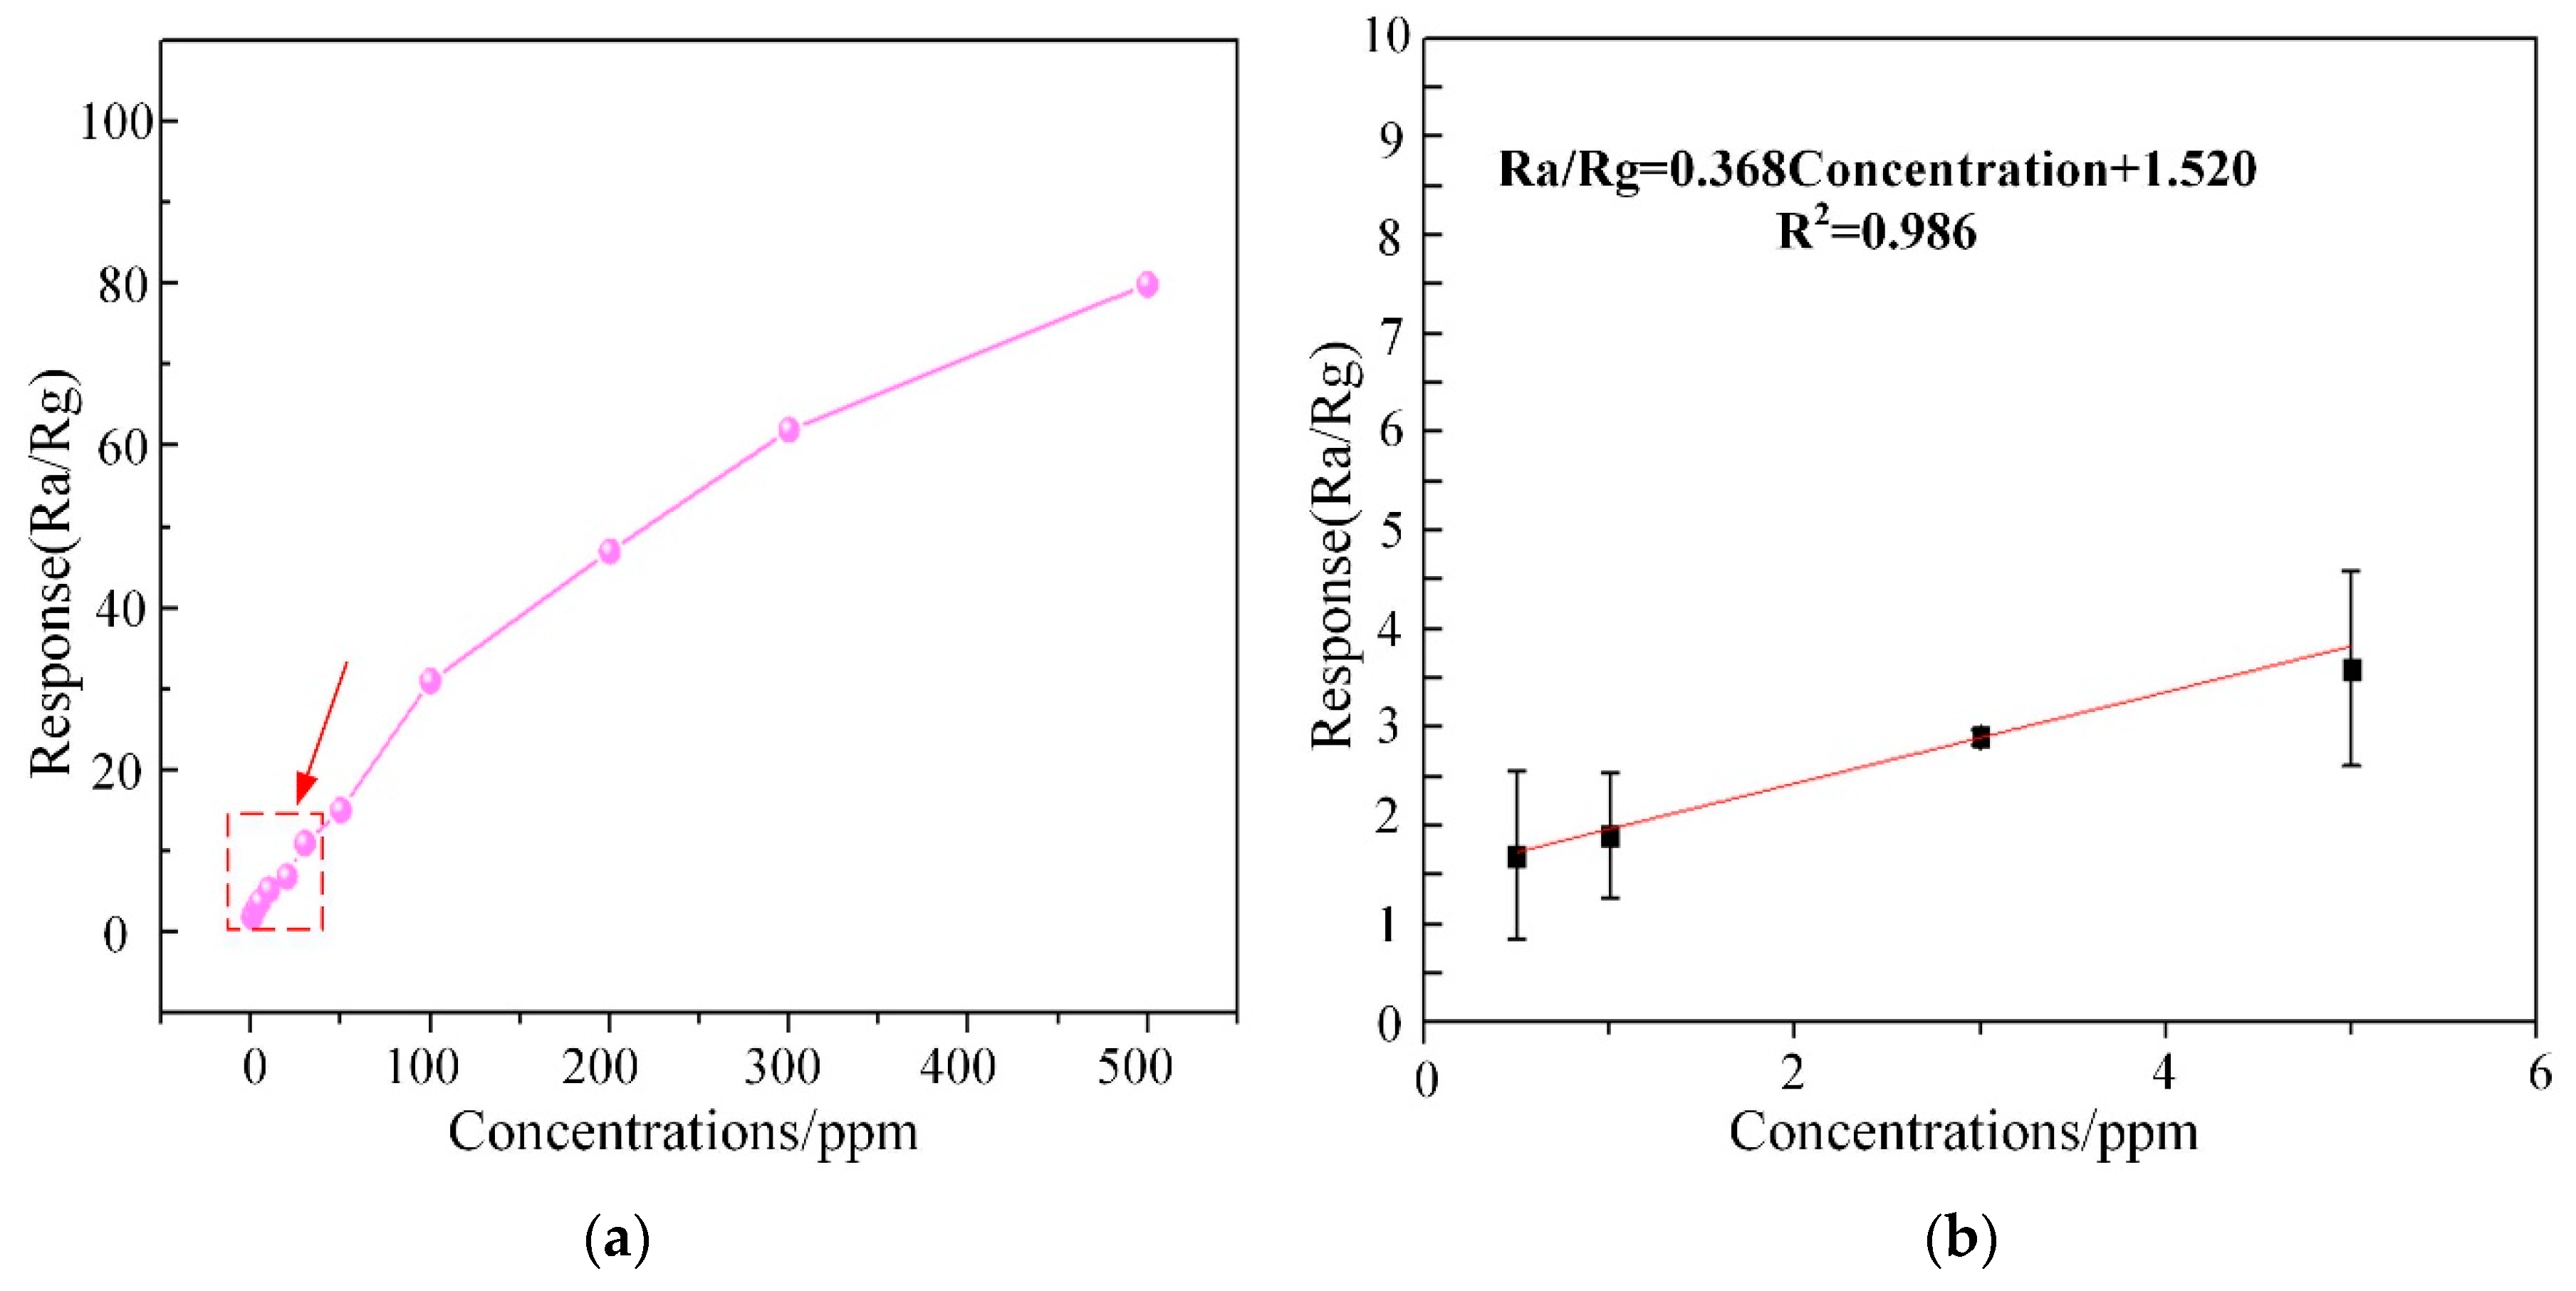
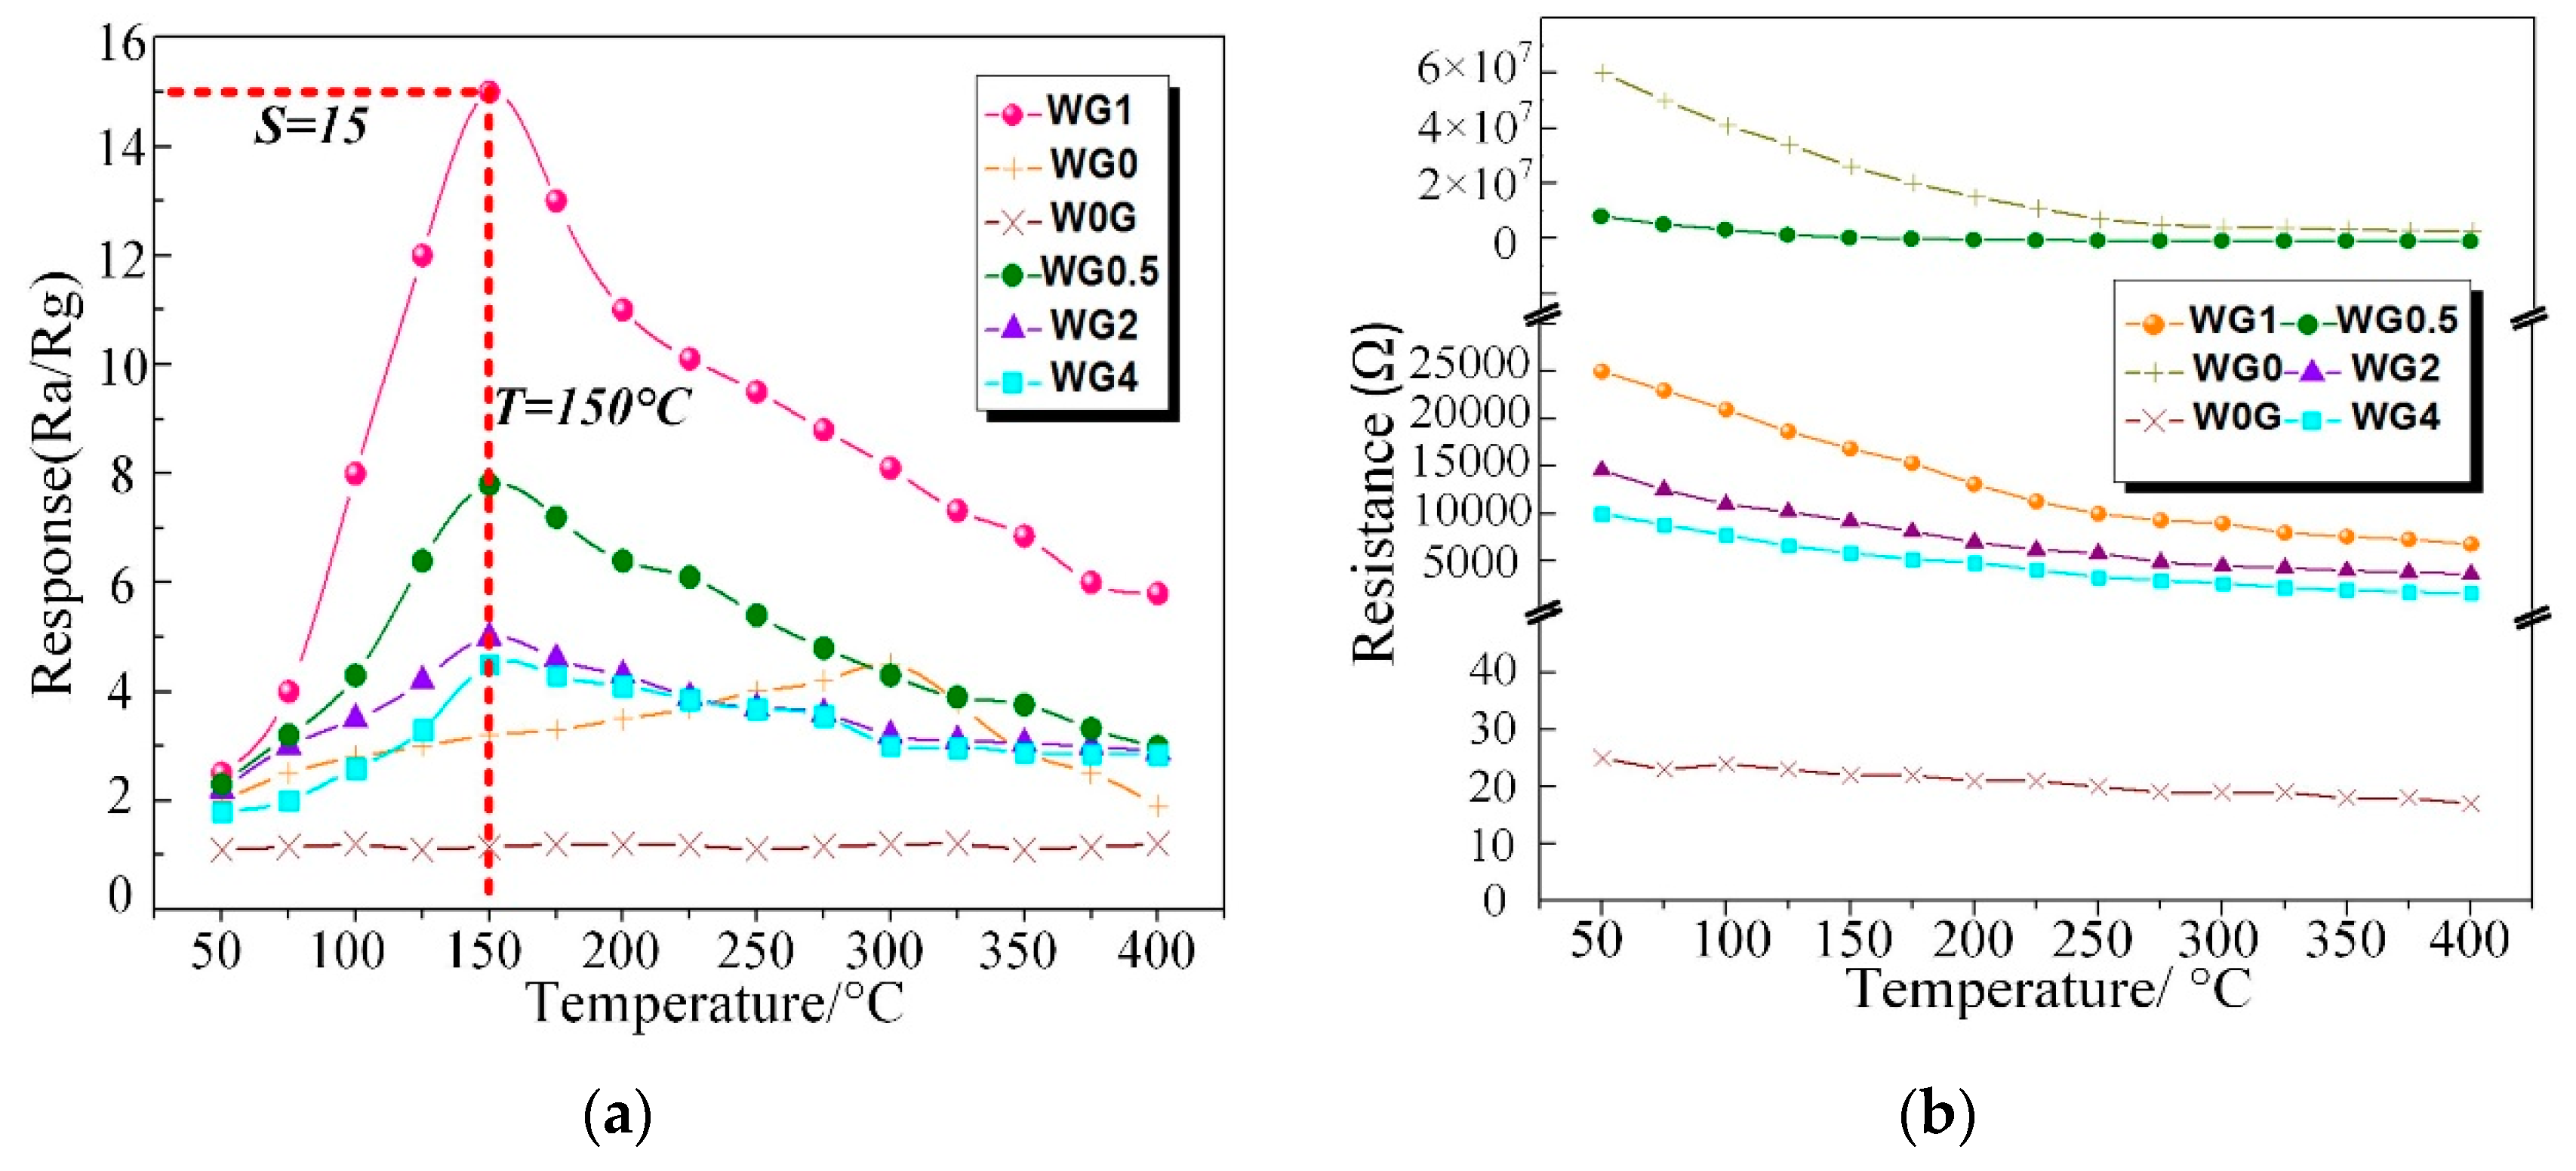
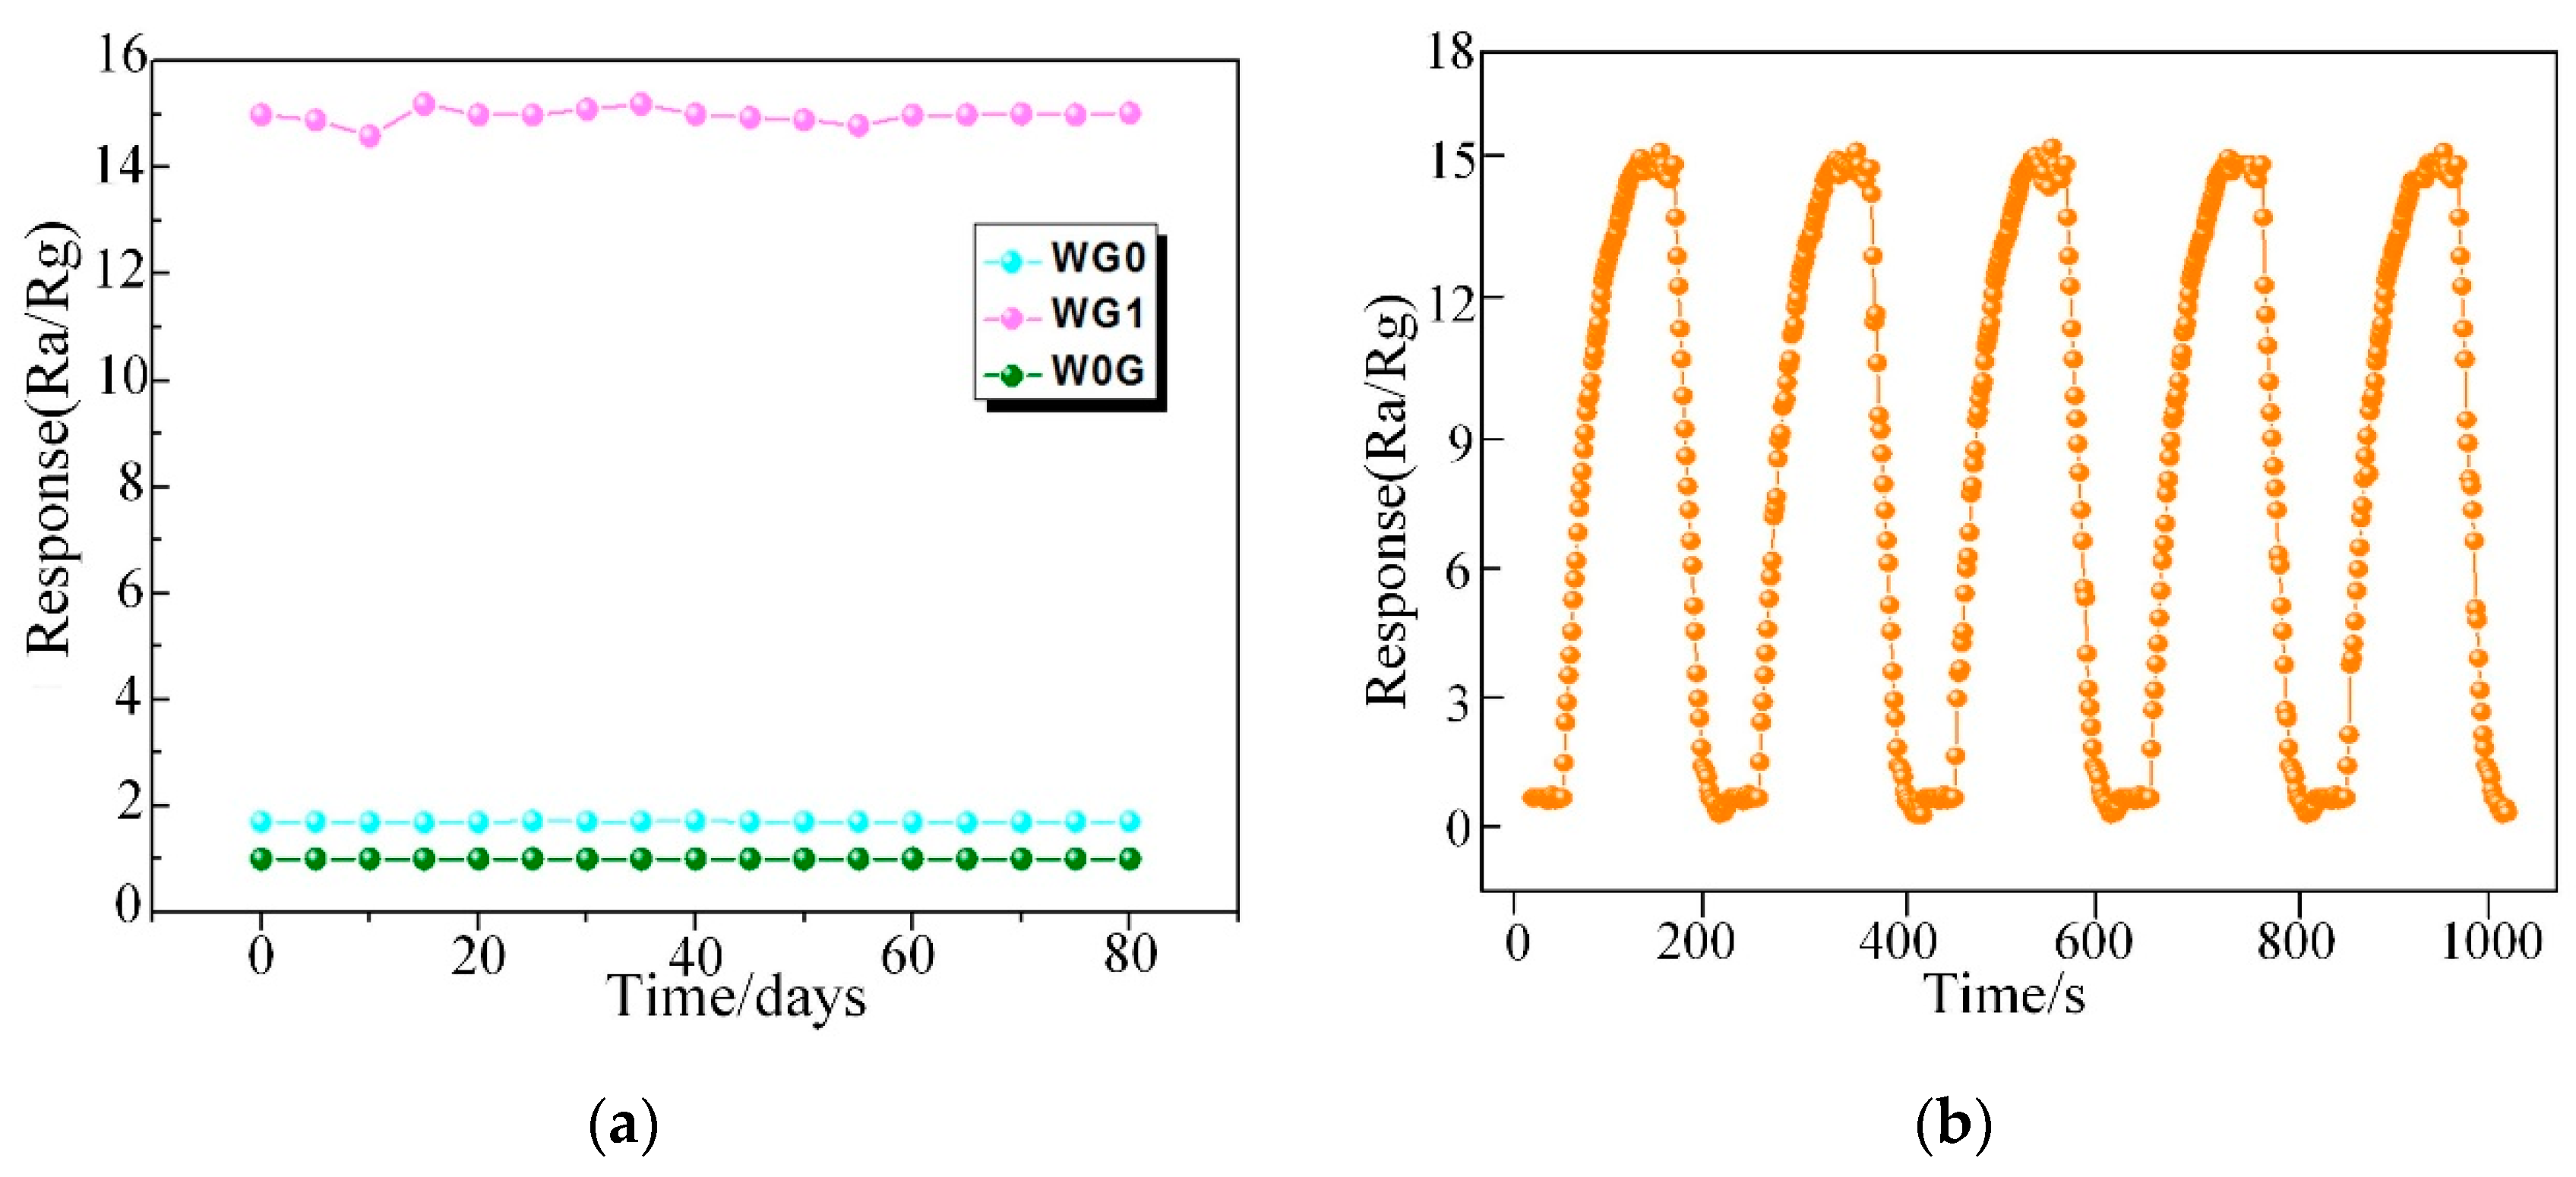
3.2. C2H2 Gas Sensing Properties

C2H2 gas is one of the dominant fault characteristic gases dissolved in power transformer oil and the power station staff can recognize the fault type based on the amount of C2H2 gas generated [56]. Therefore, the performance of our fabricated WO3/rGO nanocomposites sensors need to be tested to investigate the sensing properties to C2H2 gas. To obtain the optimal working temperature, W0G, WG0, WG0.5, WG1, WG2, and WG4 were exposed to 50 ppm C2H2 gas in the experimental chamber at the temperature ranging from 50 °C to 400 °C with the interval of 50 °C. Figure 10a shows the relationship between sensing response of different sensors and working temperature. The results that were obtained distinctly exhibit that the sensors response of WG0, WG0.5, WG1, WG2, and WG4 increase firstly and decrease then with the temperature rise. However, no clear fluctuation is observed for W0G curve in Figure 10a and W0G shows a weak response to C2H2 gas. Besides, the resistance curve (resistance of W0G, WG0, WG0.5, WG1, WG2, and WG4 in the air versus temperature) was given in Figure 10b. It can be clearly observed that WG0.5, WG1, WG2, and WG4 show an evidently enhancement in electrical conductivity as compared to WG0. Furthermore, the resistance of WG0.5, WG1, WG2, and WG4 decreases dramatically with the increase of GO contents.
Besides, the optimal working temperature of WG0.5, WG1, WG2, and WG4 (about 150 °C) is lower than WG0 (about 300 °C) and the sensor response of WG1 is much higher than W0G, WG0, WG0.5, WG2, and WG4 at their best working temperature. The possible explanation for this experimental phenomenon is that sensors have a small chemical activation at low working temperature and a potential barrier formed by the chemisorbed oxygen ions on the gas sensing materials surface prevents the reaction between C2H2 gas and materials. The activity of prepared materials is activated progressively with the rising of temperature, and therefore, sensors response have an enhancement. However, the adsorbed gas molecular may escape before reaction with the sustained rise of temperature, which leads to a response drop. Besides, the elimination of oxygen-containing functional groups may lead to a response decrease at high temperature as well. It can be concluded that the optimal working temperature of sensors with hybridization of WO3 and rGO can be efficiently reduced as compared to pure WO3 or rGO sensors and the gas response is highly improved with the hybridization at optimum working temperature.
Figure 11a illustrates the response of WG0, W0G, WG0.5, WG1, WG2, and WG4 to 50 ppm C2H2 gas at 150 °C. It can be observed that WG1 has the optimal response Ra/Rg = 15 to the C2H2 gas and hence the WG1 was selected for further characterizations. The response-recovery curve of WG1 to 50 ppm C2H2 gas at the best working temperature is demonstrated in Figure 11b and the WG1 has the best response with minimum response (52s) and recovery time (27s). Furthermore, WG1 was exposed to different concentrations of C2H2 gas ranging from 0.5 ppm to 50 ppm to investigate the dynamic response-recovery curve. As Figure 11c depicted, it is obvious to be noticed that the response of WG1 increased when C2H2 was injected into experimental chamber and the response decreased to the base line value when C2H2 was carried out via air.
The alarm value of C2H2 gas concentration in operative 220 kV and below power transformer is 5 ppm. Therefore, the detection of low concentration of C2H2 gas is highly important. The WG1 nanocomposites sensor can detect even 1.3 ppm efficiently, and it shows practicability in power transformer fault characteristic gas detection and fault type estimation.
Subsequently, the response curve of WG1 gas sensor to multi-concentrations of C2H2 gas ranging from 0.5 ppm to 400 ppm at the best working temperature was depicted in Figure 12a. The response of WG1 increased progressively at low C2H2 gas concentration and it got saturation at high concentration. The potential explanation is that no more adsorption sites on the WG1 surface can be supplied for C2H2 gas and the reaction between WG1 and C2H2 gas molecular has reached a dynamic equilibrium. Besides, Figure 12b, which is the enlarged view of box part in Figure 12a, shows that the gas concentration-response curve of WG1 has a good linearity when the C2H2 concentration is below 10 ppm. The linear relationship between concentrations and response can be summarized as one equation, exhibited below:
  y   =   0.368 x   +   1.520  
In this work, we defined the lowest detection limitation that can be reached was the lowest concentrations when the response reached 2. Hence, it can be calculated that the lowest detection limitation was 1.3 ppm when the response went to 2.
Ultimately, the long term stability of WG0, WG1, and W0G gas sensors were investigated and it is significant for practical application. In this work, W0G, WG0, and WG1 gas sensors were exposed towards 50 ppm C2H2 gas for 80 days with an interval of five days and the time-response curve was recorded. The outcomes in Figure 13a demonstrate a good long-term stability of WG1 gas sensor. Besides, the repeatability of WG1 gas sensor was tested towards 50 ppm C2H2 gas for five cycles and the performance of WG1 gas sensor in Figure 13b exhibited a good repeatability during the five cycles.
A lot of previous work has been done by other researchers to study the gas sensing properties of their fabricated gas sensors towards C2H2 gas. A comparison between our WG1 composites gas sensors and reported gas sensor is given in Table 1.

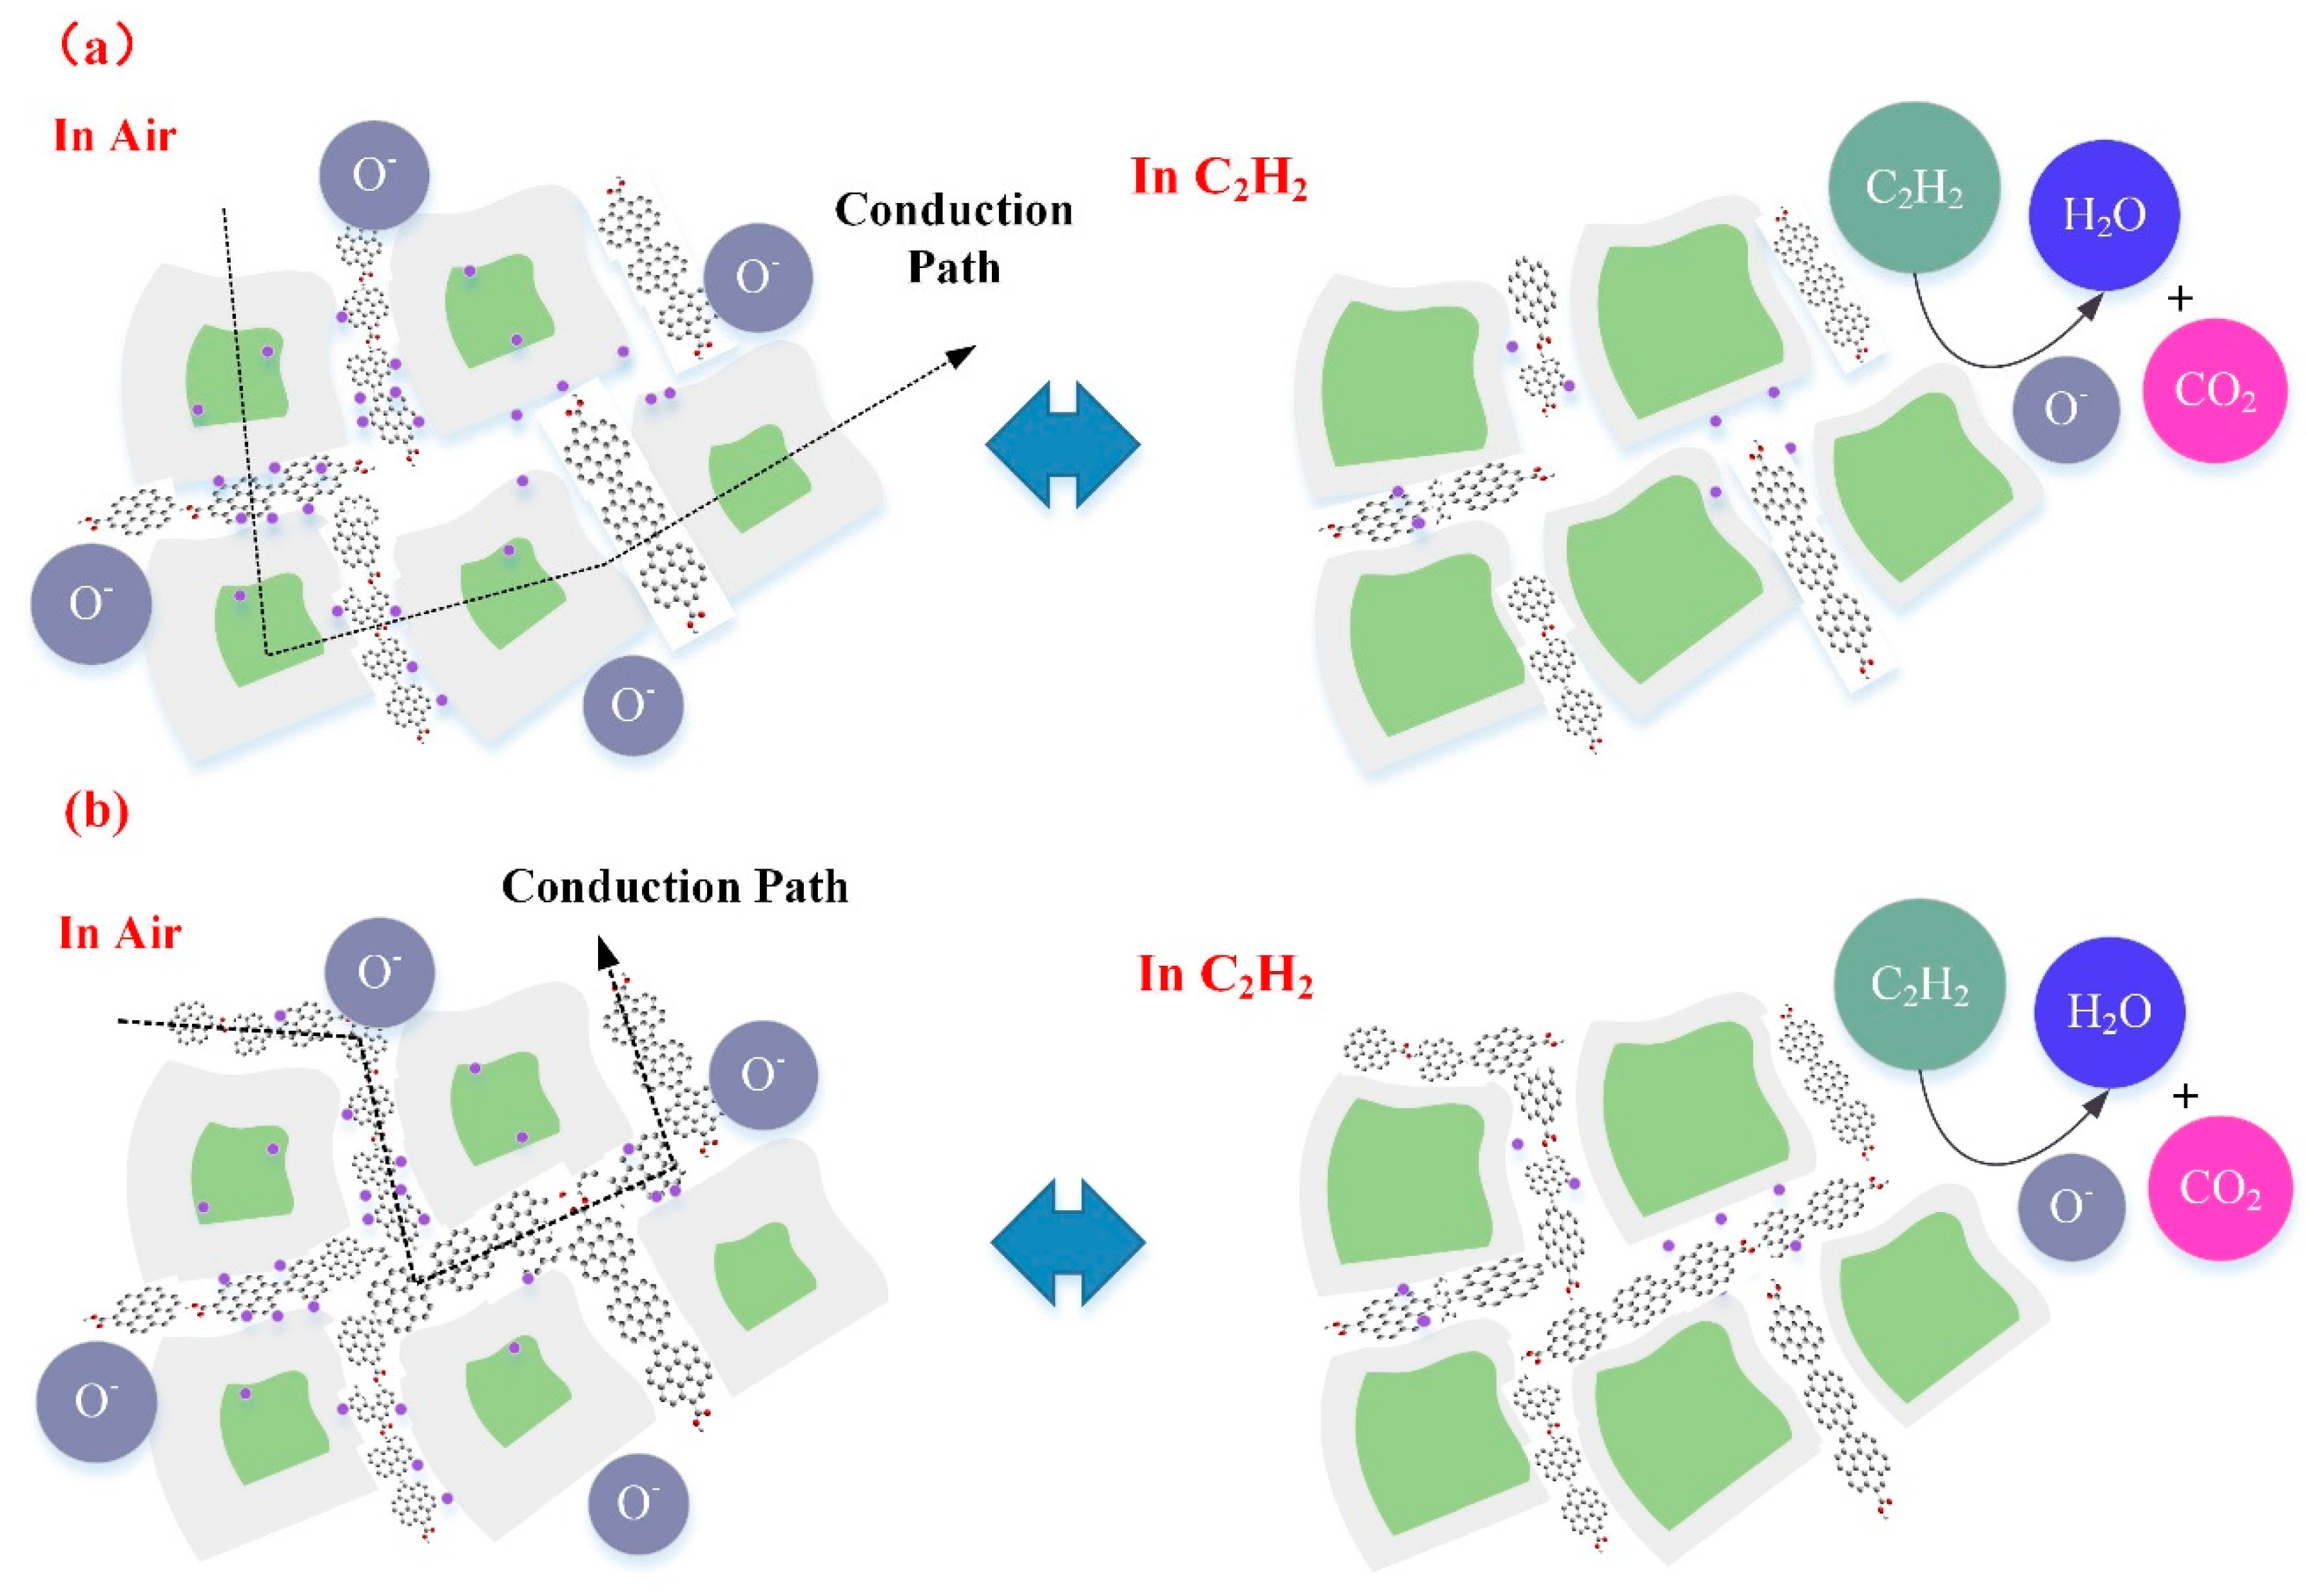
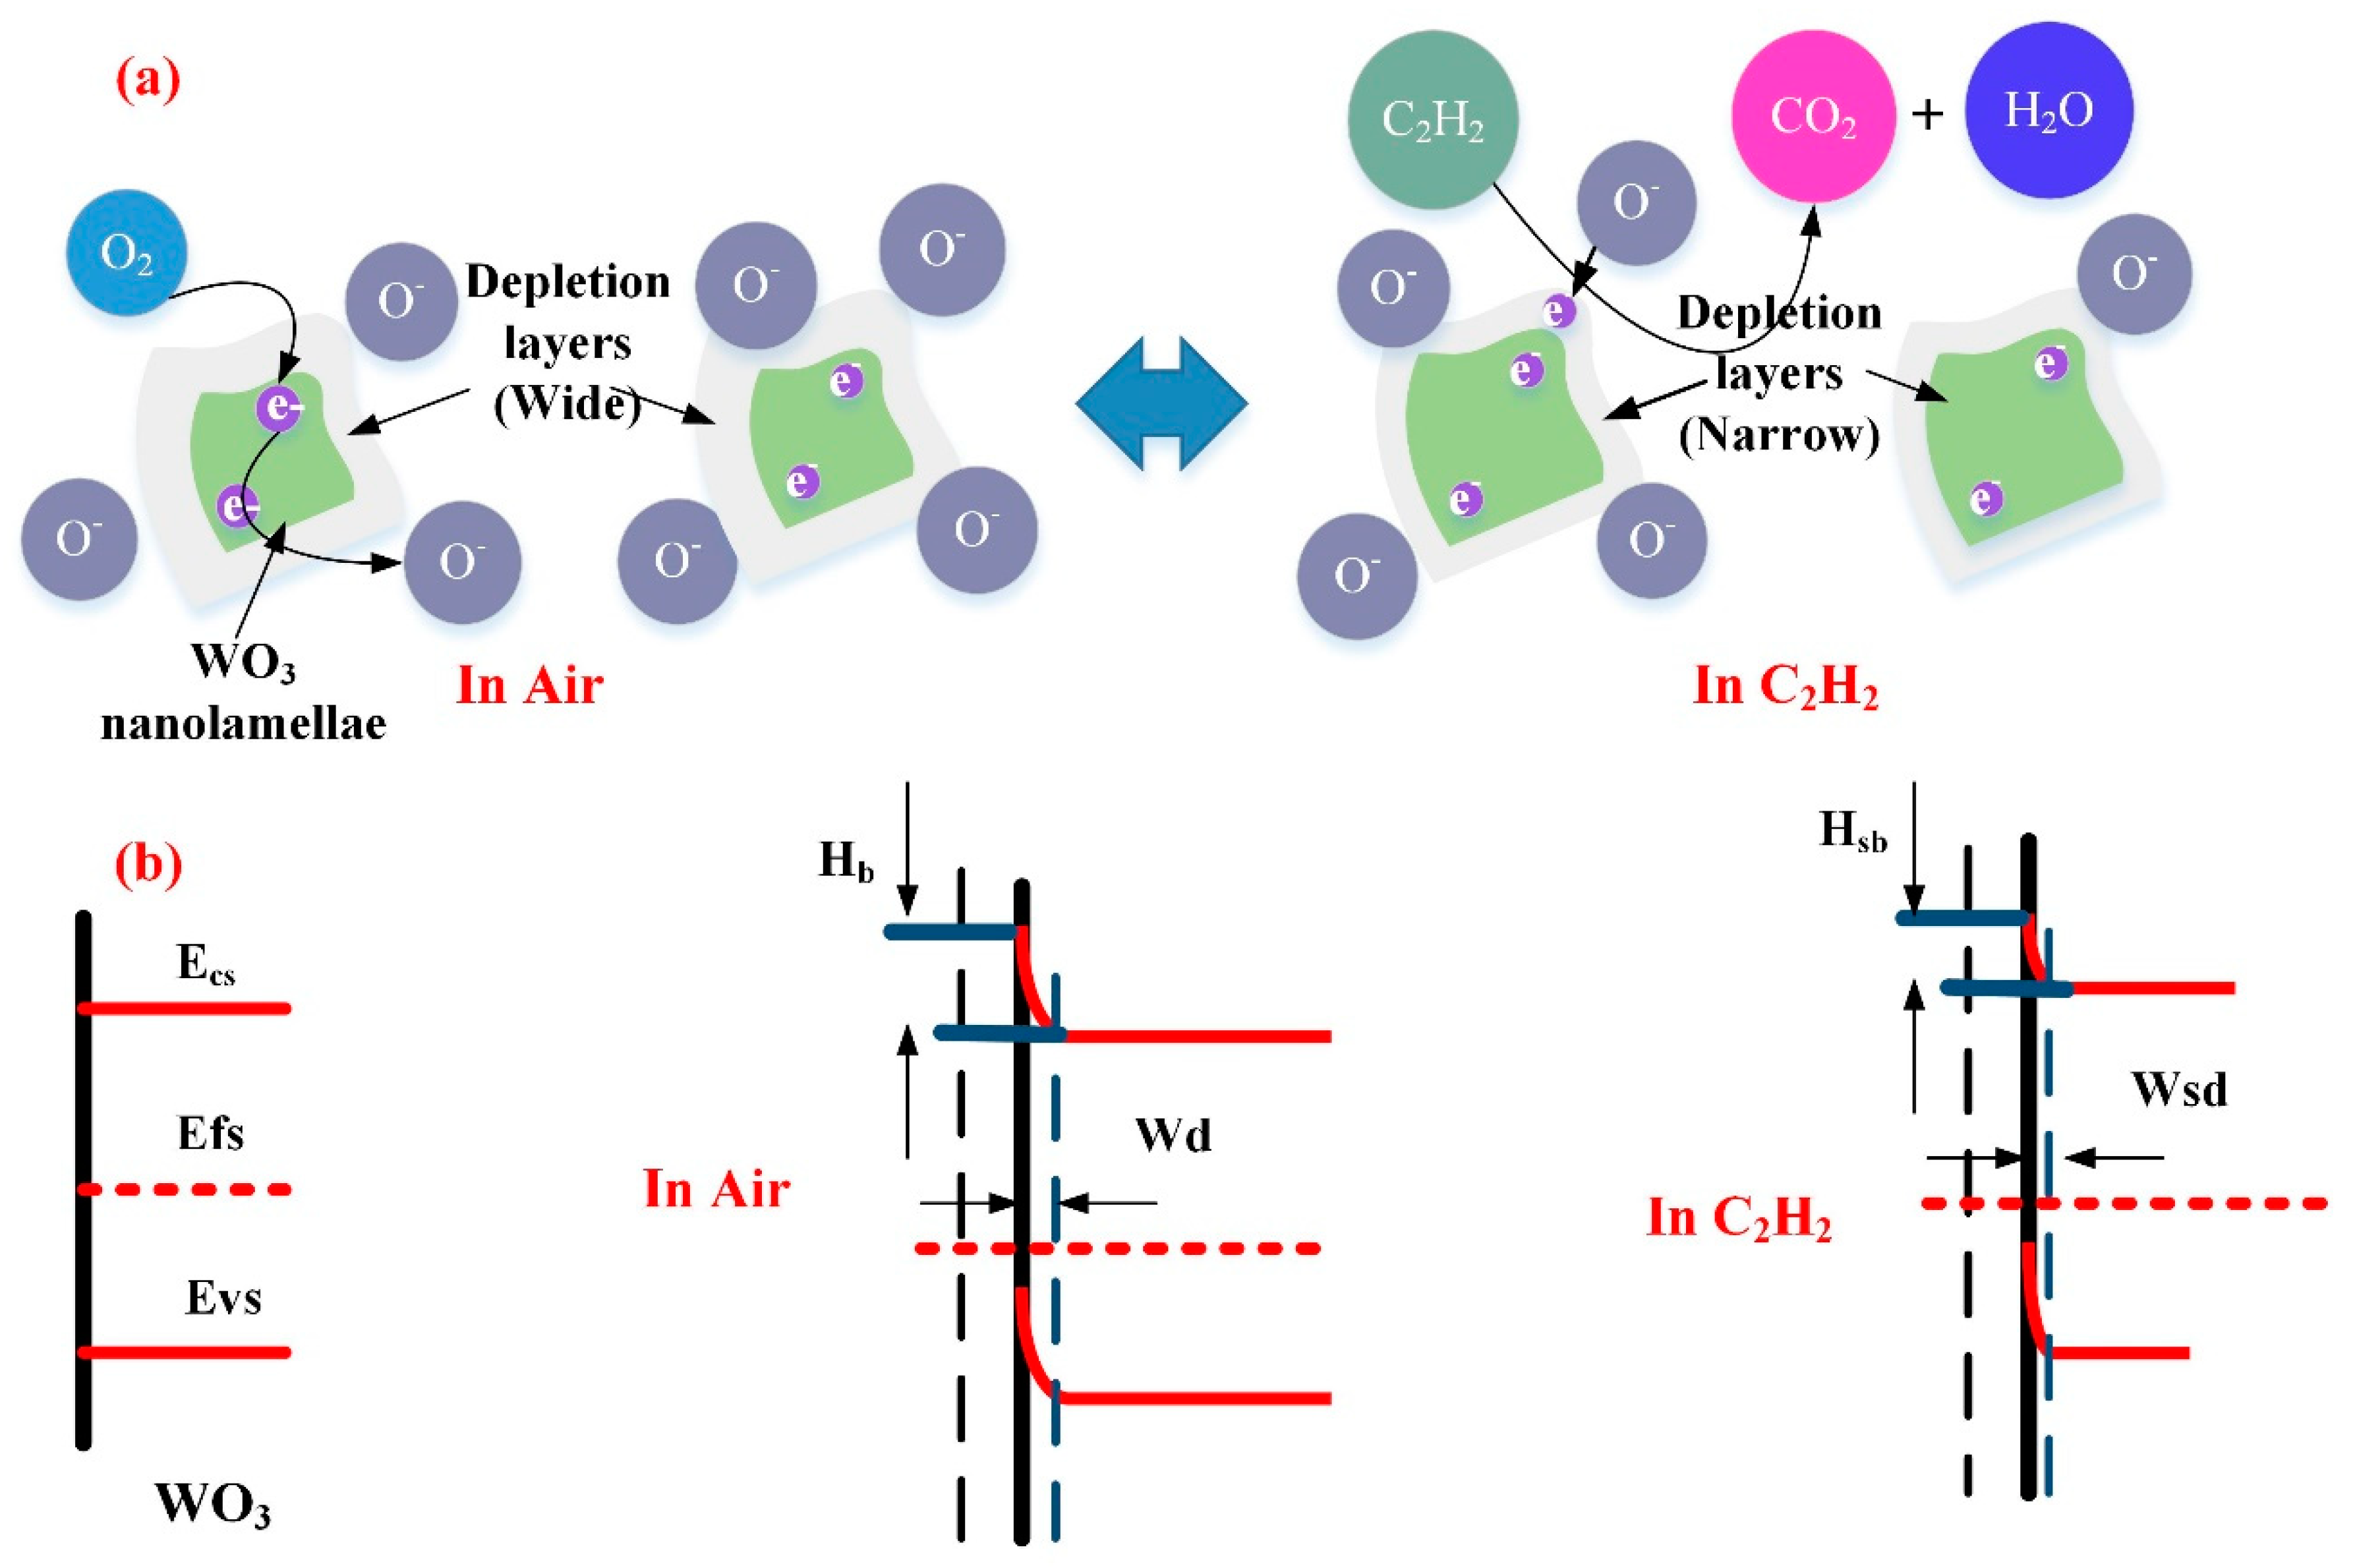
3.3. Gas Sensing Mechanism

The WG1 gas sensor demonstrated an excellent performance on 50 ppm C2H2 gas detection at 150 °C based on experimental results. Besides, WG0, WG0.5, WG2, and WG4 gas sensors showed the detectability towards 50 ppm C2H2 gas at 150 °C, which were about 3.2, 7.8, 5.1, and 4.5, respectively. Furthermore, the W0G sensor showed a very low detection capability to C2H2 gas. Here, the gas sensing mechanism of fabricated gas sensing materials is discussed, as follows.
Firstly, the experimental outcomes showed that W0G gas sensor showed a p-type gas sensing behavior with very low response towards C2H2 gas. The p-type C2H2 gas sensing mechanism can be explained via band diagram, which is illustrated in Figure 14.
It is well-known that rGO has a semi-metallic energy band structure, which means that the conduction band (Ec) and valence band (Ev) of rGO meet at the Dirac point K (Ef) near the edge of Brillouin zone and valence band is full of valence electrons [62,63]. The Fermi level passes the K point under the natural state. When W0G gas sensor is exposed to air at a working temperature, the oxygen molecules adsorbed on the surface of rGO will grasp electrons from the conduction band to form oxygen species (O2 and O) and an amount of holes, namely, positive charge carriers are generated at the same time [64]. Therefore, the W0G exhibits a p-type property with Fermi level below the K point. When W0G is exposed to C2H2 gas, C2H2 gas will interact with adsorbed oxygen species, releasing electrons back to the surface of rGO nanosheets, and results in a decrease of holes and rise of sensors resistance. However, the resistance increase in p-type rGO is tiny, because the charge carriers that are generated by gas reaction is much less than charger carriers in rGO sheets. So, W0G gas sensor has a very poor performance on C2H2 detection.
In case of the WG0 gas sensor, the oxygen molecular will extract electrons from the conduction band of WO3 to form the adsorbed oxygen ions which contributes to the formation of depletion region on the surface of WO3 with a depletion width (Wd) and barrier height (Hb). When electrons are extracted from the conduction band of WO3, electrons will pass two adjacent depletion layers and a neutral region. This electrons transfer is mainly based on the thermionic conduction mechanism and only electrons with high-energy can be motivated to move across energy barriers. According to the thermionic conduction mechanism, the electrons mobility will increase exponentially with the decreasing of barrier height [65]. Hence, the specific resistance will decline exponentially with the decreasing of barrier height. When pure WO3 is exposed to C2H2 gas, the adsorbed oxygen ions react with the C2H2 molecules and the trapped electrons will be released back to the surface of WO3 and the barrier height will be reduced, which leads to a decline of resistivity. The possible reaction process [66] is given, as follows:
  O 2 ( ads ) + 2 e 2 O ( ads )  
  C 2 H 2 ( gas )   +   O ( ads ) CO 2   +   H 2 O   +   e  
When electrons move across different WO3 nanoparticles, the width of depletion region (Wsd) and barrier height (Hsb) are influenced by the interaction between adsorbed oxygen molecular ions and target gases. Hence, by monitoring the change of depletion region width and barrier height, the sensing response of WO3 can be measured. Figure 15a,b shows the representative physical models and energy band models for C2H2 gas sensing mechanisms.
For WG1 gas sensor, the formation of p-n heterojunctions and active interaction between WO3 and rGO are the potential reasons for its high performance to C2H2 gas detection. rGO sheets thata re dispersed discretely among the WO3 nanolamellae and p-n heterojunctions are formed between WO3 nanolameallae and rGO sheets. Before the adsorption of oxygen molecules ions in air, heterojunctions are ohmic, since the work function of WO3 is smaller than rGO. Hence, electrons in WO3 will be transferred to rGO and accumulate on the surface of rGO sheets. When the WG1 is exposed in air, the depletion region will form with a barrier height. When comparing the depletion region width and barrier height of WG1 with pure WO3, the magnitudes of depletion region width and barrier height of WG1 is larger than pure WO3 since the less electrons are acquired from WO3. Figure 16a illustrates the physical models for C2H2 gas sensing mechanisms of WG1.
When WG1 gas sensor is exposed to C2H2 gas, the C2H2 gas molecules are strongly adsorbed on the interface of WO3 nanolamellae and rGO nanosheets because of highly active sites (oxygen functional groups, vacancies, etc.), which has been verified by the BET analysis as well. The enhanced C2H2 gas adsorption at the interface will lead an extensive decreasing in the width of depletion region and barrier height. Therefore, the response of WG1, which is the ratio of the resistance in the air and the resistance after C2H2 reaction, is highly enhanced by two aspects: larger resistance in air and smaller resistance in C2H2 gas. Additionally, the rGO can act as spacers and prevent the aggregation of WO3 nanolamellae. So that, the efficient adsorption and desorption processes can occur. Besides, the introduction of rGO sheets increase the conduction of prepared gas sensing materials, which leads to a faster response and recovery time. All of these factors make the high performance of WG1 gas sensor possible.
For the WG2 and WG4 gas sensor, the response towards C2H2 gas is smaller than WG1. The reasons from the gas sensing mechanism aspects are discussed, as follows. At a relative high concentration of GO, the rGO sheets homogeneous distributed among the WO3 nanolamellae and connected themselves. Because of the connection of rGO sheets, electrons can be transferred easily through the rGO sheets channel and results in a resistance decreasing in air. The width of depletion layers and barrier height will become small as well when C2H2 gas reacts with adsorbed oxygen molecules ions and contributes to a resistance decline. However, with the increase concentration of GO, the conduction of electrons is partially through the rGO sheets and rGO sheets has a p-type gas sensing property. Therefore, a smaller decrease of resistance can be observed as compared to the WG1 gas sensor. Figure 16b illustrates the physical models for C2H2 gas sensing mechanisms of WG1.

4. Conclusions

In this work, high-performance WO3/rGO nanocomposites that were prepared by hydrothermal method were systematically investigated for C2H2 gas detection. Characterizations by XRD, TEM, Raman spectroscopy, XPS, TG-DTG-DSC, and PL have confirmed that WO3 nanolamellae evenly anchored on the high-quality rGO sheets. Gas sensing results revealed that 1%wt GO contents exhibited a high response (15.0–50 ppm), an excellent dynamic response (0.5–50 ppm), a low detection limitation (1.3 ppm), fast response-recovery time (52 s, 27 s), long-term stability, and outstanding repeatability at a relative low optimal working temperature (150 °C). The potential gas sensing mechanism corresponding to different ratio of WO3 and rGO were proposed based on the grain boundary theory, formation of p-n heterojunctions, and interaction of WO3 nanolamellae and rGO sheets. Therefore, the hydrothermal method WO3/rGO nanocomposites sensors are promising high-performance candidates for dissolved C2H2 gas detection in oil-immersed at ppm-level.

Author Contributions

Z.J. and W.C. conceived and designed the experiments; L.J. and F.C. performed the experiments; Z.S. analyzed the data; Z.J. wrote the paper. Z.J. and W.C. reviewed and revised the manuscript. All authors read and approved the manuscript.

Funding

This work was supported by National Natural Science Foundation of China (Grant No. U1766217), State Grid Corporation of China Science and Technology Project (52110418000Q) and Chongqing university innovation team construction plan (CXTDX201601001)

Acknowledgments

I would like to express my appreciation to my advisor Weigen Chen, my lovely girlfriend Jiayang Zhang and all fellows from my research group. Additionally, I would express my profound gratitude to peer reviewers for giving me precious suggestions.

Conflicts of Interest

The authors declare no conflict of interest.

References

  1. Wang, Y.Y.; Gong, S.L.; Grzybowski, S. Reliability evaluation method for oil-paper insulation in power transformers. Energies 2011, 4, 1362–1375. [Google Scholar] [CrossRef]
  2. Illias, H.A.; Liang, W.Z. Identification of transformer fault based on dissolved gas analysis using hybrid support vector machine-modified evolutionary particle swarm optimisation. PLoS ONE 2018, 13, e0191366. [Google Scholar] [CrossRef] [PubMed]
  3. Wei, C.; Tang, W.; Wu, Q. Dissolved gas analysis method based on novel feature prioritisation and support vector machine. IET Electr. Power Appl. 2014, 8, 320–328. [Google Scholar] [CrossRef]
  4. Lundgaard, L.E.; Hansen, W.; Linhjell, D.; Painter, T.G. Aging of oil-impregnated paper in power transformers. IEEE Trans. Power Deliv. 2004, 19, 230–239. [Google Scholar] [CrossRef]
  5. Wang, Z. Artificial Intelligence Applications in the Diagnosis of Power Transformer Incipient Faults. Available online: https://vtechworks.lib.vt.edu/handle/10919/28594 (accessed on 1 November 2018).
  6. Sang, Z.X.; Mao, C.X.; Lu, J.M.; Wang, D. Analysis and simulation of fault characteristics of power switch failures in distribution electronic power transformers. Energies 2013, 6, 4246–4268. [Google Scholar] [CrossRef]
  7. Mineral Oil-Impregnated Electrical Equipment in Service—Guide to the Interpretation of Dissolved and Free Gases Analysis. Available online: https://www.vde-verlag.de/iec-normen/preview-pdf/info_iec60599%7Bed2.1%7Db.pdf (accessed on 1 November 2018).
  8. Souahlia, S.; Bacha, K.; Chaari, A. MLP neural network-based decision for power transformers fault diagnosis using an improved combination of rogers and doernenburg ratios DGA. Int. J. Electr. Power Energy Syst. 2012, 43, 1346–1353. [Google Scholar] [CrossRef]
  9. Coward, H.F.; Jones, G.W. Limits of inflammability of gases and vapors. J. Franklin Inst. 1928, 203, 161. [Google Scholar] [CrossRef]
  10. Cashdollar, K.L.; Zlochower, I.A.; Green, G.M.; Thomas, R.A.; Hertzberg, M. Flammability of methane, propane, and hydrogen gases. J. Loss Prev. Process Ind. 2000, 13, 327–340. [Google Scholar] [CrossRef]
  11. Wang, L.W.; Kang, Y.F.; Liu, X.H.; Zhang, S.M.; Huang, W.P.; Wang, S.R. ZnO nanorod gas sensor for ethanol detection. Sens. Actuators B Chem. 2012, 162, 237–243. [Google Scholar] [CrossRef]
  12. Meng, D.; Yamazaki, T.; Shen, Y.; Liu, Z.; Kikuta, T. Preparation of WO3 nanoparticles and application to NO2 sensor. Appl. Surf. Sci. 2009, 256, 1050–1053. [Google Scholar] [CrossRef]
  13. Zou, X.; Li, G.; Wang, P.; Su, J.; Zhao, J.; Zhou, L.; Wang, Y.N.; Chen, J. A precursor route to single-crystalline WO3 nano-plates with an uneven surface and enhanced sensing properties. Dalton Trans. 2012, 41, 9773–9780. [Google Scholar] [CrossRef] [PubMed]
  14. Zhang, H.; Liu, Z.; Yang, J.; Guo, W.; Zhu, L.; Zheng, W. Temperature and acidity effects on WO3 nanostructures and gas-sensing properties of WO3 nanoplates. Mater. Res. Bull. 2014, 57, 260–267. [Google Scholar] [CrossRef]
  15. Wei, S.; Xing, Y.; Li, Y.; Zhao, Y.; Du, W.; Zhou, M. Preparation and gas sensing properties of flower-like WO3 hierarchical architecture. Vacuum 2016, 129, 13–19. [Google Scholar] [CrossRef]
  16. Nikfarjam, A.; Fardindoost, S.; Zad, A.I. Fabrication of Pd Doped WO3 Nanofiber as Hydrogen Sensor. Polymers 2013, 5, 45–55. [Google Scholar] [CrossRef]
  17. Hu, T.; Wang, D.; Wang, M.; Li, Z.; Yang, M. Miniature Hydrogen Sensor Based on Fiber Inner Cavity and Pt-doped WO3 Coating. IEEE Photonics Technol. Lett. 2014, 26, 1458–1461. [Google Scholar] [CrossRef]
  18. Kaur, J.; Anand, K.; Kohli, N.; Kaur, A.; Singh, R.C. Temperature dependent selective detection of hydrogen and acetone using Pd doped WO3/Reduced graphene oxide nanocomposite. Chem. Phys. Lett. 2018, 701, 115–125. [Google Scholar] [CrossRef]
  19. Kuar, J.; Anand, K.; Kaur, A.; Singh, R.C. Sensitive and selective acetone sensor based on Gd doped WO3/reduced graphene oxide nanocomposite. Sens. Actuators B Chem. 2017, 258, 1022–1035. [Google Scholar] [CrossRef]
  20. Shi, J.; Chenga, Z.; Gao, L.; Zhang, Y.; Xu, J.; Zhao, H. Facile synthesis of reduced graphene oxide/hexagonal WO3 nanosheets composites with enhanced H2S sensing properties. Sens. Actuators B Chem. 2016, 230, 736–745. [Google Scholar] [CrossRef]
  21. Chen, W.; Zhou, Q.; Gao, T.; Su, X.; Wan, Fu. Pd-doped SnO2-based sensor detecting characteristic fault hydrocarbon gases in transformer oil. J. Nanomater. 2013, 2013. [Google Scholar] [CrossRef]
  22. Zhang, H. Hierarchically porous WO3 microstructures with networks for acetylene sensing application. Mater. Lett. 2018, 214, 198–201. [Google Scholar] [CrossRef]
  23. Hummers, W.S.; Offeman, R.E. Preparation of graphitic oxide. J. Am. Chem. Soc. 1958, 80, 1339. [Google Scholar] [CrossRef]
  24. Liu, Y.; Koep, E.; Liu, M. A highly sensitive and fast-responding SnO2 sensor fabricated by combustion chemical vapor deposition. Chem. Mater. 2005, 17, 3997–4000. [Google Scholar] [CrossRef]
  25. Rossi, C.; Conto, T.D.; Estève, D.; Larangot, B. Design, fabrication and modelling of MEMS-based microthrusters for space application. Smart Mater. Struct. 2001, 10, 1156. [Google Scholar] [CrossRef]
  26. Matsui, M. Thermal Stability of Au Thin Film Deposited on Al2O3 Substrate with RuO2 Adhesion Layer. J. Ceram. Soc. Jpn. 2001, 109, 574–575. [Google Scholar] [CrossRef]
  27. Norris, B.J.; Anderson, J.; Wager, J.F.; Keszler, D.A. Spin-coated zinc oxide transparent transistors. J. Phys. D Appl. Phys. 2003, 36, L105. [Google Scholar] [CrossRef]
  28. Zhang, M.; Lei, D.; Du, Z.; Yin, X.; Chen, L.; Li, Q.; Wang, Y.; Wang, T. Fast synthesis of SnO2/graphene composites by reducing graphene oxide with stannous ions. J. Mater. Chem. 2011, 21, 1673–1676. [Google Scholar] [CrossRef]
  29. Chen, X.; Kalenczuk, R.J.; Wajda, A.; Łapczuk, J.; Kurzewski, M.; Drozdzik, M.; Chu, P.K.; Palen, E.B. Synthesis, disper-sion, and cytocompatibility of graphene oxide and reduced graphene oxide. Colliods Surf. B 2012, 89, 79–85. [Google Scholar]
  30. Upadhyay, S.B.; Mishra, R.K.; Sahay, P.P. Enhanced acetone response in co-precipitated WO3 nanostructures upon indium doping. Sens. Actuators B Chem. 2015, 209, 368–376. [Google Scholar] [CrossRef]
  31. Tang, L.; Wan, Y.; Yan, D.; Pei, Y.; Zhao, L.; Li, Y.; Wu, L.; Jiang, J.; Lai, G. The effect of graphene dispersion on the mechanical properties of graphene/epoxy composites. Carbon 2013, 60, 16–27. [Google Scholar] [CrossRef]
  32. Ji, Z.; Shen, X.; Zhu, G.; Zhou, H.; Yuan, A. Reduced graphene oxide/nickel nanocomposites: Facile synthesis, magnetic and catalytic properties. J. Mater. Chem. 2012, 22, 3471–3477. [Google Scholar] [CrossRef]
  33. Garciasanchez, R.F.; Ahmido, T.; Casimir, D.; Baliga, S.; Misra, P. Thermal Effects Associated with the Raman Spectroscopy of WO3 Gas-Sensor Materials. J. Phys. Chem. A 2013, 117, 13825–13831. [Google Scholar] [CrossRef] [PubMed]
  34. Park, O.; Hahm, M.G.; Lee, S.; Joh, H.; Na, S.; Vajtai, R.; Lee, J.H.; Ku, B.C.; Ajayan, P.M. In Situ Synthesis of Thermochemically Reduced Graphene Oxide Conducting Nanocomposites. Nano. Lett. 2012, 12, 1789–1793. [Google Scholar] [CrossRef] [PubMed]
  35. Merlen, A.; Buijnsters, J.G.; Pardanaud, C. A Guide to and Review of the Use of Multiwavelength Raman Spectroscopy for Characterizing Defective Aromatic Carbon Solids: From Graphene to Amorphous Carbons. Coatings 2017, 7, 153. [Google Scholar] [CrossRef]
  36. Feng, Q.; Li, X.; Wang, J. Percolation effect of reduced graphene oxide (rGO) on ammonia sensing of rGO-SnO2 composite based sensor. Sens. Actuator B 2017, 243, 1115–1126. [Google Scholar] [CrossRef]
  37. Dutta, D.; Wood, B.C.; Bhide, S.Y.; Ayappa, K.G.; Narasimhan, S. Enhanced Gas Adsorption on Graphitic Substrates via Defects and Local Curvature: A Density Functional Theory Study. J. Phys. Chem. C 2014, 118, 7741–7750. [Google Scholar] [CrossRef]
  38. Díazreyes, J.; Dorantes-García, V.; Pérez-Benítez, A.; Balderas-López, J.A. Obtaining of films of tungsten trioxide (WO3) by resistive heating of a tungsten filament. Superficies Y Vacío 2008, 21, 1665–3521. [Google Scholar]
  39. Hardcastle, F.D.; Wachs, I.E. Determination of the molecular structures of tungstates by Raman spectroscopy. J. Raman Spectrosc. 1995, 26, 397–405. [Google Scholar] [CrossRef]
  40. Xu, T.; Zhang, L.; Cheng, H.; Zhu, Y. Significantly enhanced photocatalytic performance of ZnO via graphene hybridization and the mechanism study. Appl. Catal. B 2011, 101, 382–387. [Google Scholar] [CrossRef]
  41. Lo, S.S.; Huang, D. Morphological variation and raman spectroscopy of zno hollow microspheres prepared by a chemical colloidal process. J. Surf. Colloids 2010, 26, 6762–6766. [Google Scholar] [CrossRef] [PubMed]
  42. Zaki, M.I.; Abdel-Khalik, M.; Habashy, G.M. Acid-leaching and consequent pore structure and bleaching capacity modifications of egyptian clays. Colloids Surf. 1986, 17, 241–249. [Google Scholar] [CrossRef]
  43. Shojaee, M.; Nasresfahani, S.; Sheikhi, M.H. Hydrothermally synthesized Pd-loaded SnO2/partiallyreduced graphene oxide nanocomposite for effective detection of carbon monoxide at room temperature. Sens. Actuators B Chem. 2018, 254, 457–467. [Google Scholar] [CrossRef]
  44. Anand, K.; Singh, M.P.; Singh, O.; Kohli, N.; Singh, R.C. Optical and thermal properties of precursor-controlled graphene–zinc nanocomposites. Mater. Sci. Semicon. Proc. 2013, 16, 1706–1712. [Google Scholar] [CrossRef]
  45. Lv, Y.; Zhan, W.; He, Y.; Wang, Y.; Kong, X.; Kuang, O.; Xie, Z.; Zheng, L. MOF-templated synthesis of porous Co3O4 concave nanocubes with high specific surface area and their gas sensing properties. ACS Appl. Mater. Interfaces 2014, 6, 4186–4195. [Google Scholar]
  46. Penner, R.M. Hybrid electrochemical/chemical synthesis of quantum dots. Acc. Chem. Res. 2000, 33, 78–86. [Google Scholar] [CrossRef] [PubMed]
  47. Feng, Z.; Guo, M.; Zhang, M. Hydrothermal preparation and optical properties of orientation-controlled WO3 nanorod arrays on ITO substrates. Cryst. Eng. Commun. 2013, 15, 277–284. [Google Scholar]
  48. Lupan, O.; Emelchenko, G.A.; Chai, G.; Redkin, A.N.; Gruzintsev, A.N.; Tiginyanu, I.M.; Chow, L.; Ono, L.K.; Cuenya, B.R.; Heinrich, H. Synthesis and characterization of ZnO nanowires for nanosensor applications. Mater. Res. Bull. 2010, 45, 1026–1032. [Google Scholar] [CrossRef]
  49. Zheng, H.; Ou, J.; Strano, M.S.; Kaner, R.B.; Mitchell, A.; Kalantar-zadeh, K. Nanostructured tungsten oxide–properties, synthesis, and applications. Adv. Funct. Mater. 2011, 21, 2175–2196. [Google Scholar] [CrossRef]
  50. Malard, L.M.; Pimenta, M.A.; Dresselhaus, G.; Dresselhaus, M.S. Raman spectroscopy in graphene. Phys. Rep. 2009, 473, 51–87. [Google Scholar] [CrossRef]
  51. Zhou, D.; Zhu, Z.; Liu, B. Solvothermal synthesis and characterization of a novel reduced graphene oxide (RGO)/BiVO4/SiO2, nanocomposites. Mater. Lett. 2016, 185, 32–35. [Google Scholar] [CrossRef]
  52. Yu, X.; Zhao, Z.; Sun, D.; Ren, N.; Yu, J.; Yang, R.; Liu, H. Microwave-assisted hydrothermal synthesis of Sn3O4, nanosheet/rgo planar heterostructure for efficient photocatalytic hydrogen generation. Appl. Catal. B 2018, 227, 470–476. [Google Scholar] [CrossRef]
  53. Gao, C.; Zhou, J.; Liu, G.; Wang, L. Microwave-assisted synthesis and surface decoration of lifepo 4, hexagonal nanoplates for lithium-ion batteries with excellent electrochemical performance. J. Mater. Sci. 2017, 52, 1590–1602. [Google Scholar] [CrossRef]
  54. Zang, L.Y.; Misra, H.P. Epr kinetic studies of superoxide radicals generated during the autoxidation of 1-methyl-4-phenyl-2,3-dihydropyridinium, a bioactivated intermediate of parkinsonian-inducing neurotoxin 1-methyl-4-phenyl-1,2,3,6-tetrahydropyridine. J. Biol. Chem. 1992, 267, 23601. [Google Scholar] [PubMed]
  55. Chen, Z.; Sun, P.; Fan, B.; Zhang, Z.; Fang, X. In situ template-free ion-exchange process to prepare visible-light-active g-C3N4/Nis hybrid photocatalysts with enhanced hydrogen evolution activity. J. Phys. Chem. C 2014, 118, 7801–7807. [Google Scholar] [CrossRef]
  56. Jin, L.; Chen, W.; Zhang, H.; Xiao, G.; Yu, C.; Zhou, Q. Characterization of Reduced Graphene Oxide (rGO)-Loaded SnO2 Nanocomposite and Applications in C2H2 Gas Detection. Appl. Sci. 2016, 7, 19. [Google Scholar] [CrossRef]
  57. Uddin, A.S.M.I.; Lee, K.W.; Chung, G.S. Acetylene gas sensing properties of an Ag-loaded hierarchical ZnO nanostructure-decorated reduced graphene oxide hybrid. Sens. Actuators B Chem. 2015, 216, 33–40. [Google Scholar] [CrossRef]
  58. Uddin, A.S.M.I.; Chung, G.S. Synthesis of highly dispersed ZnO nanoparticles on graphene surface and their acetylene sensing properties. Sens. Actuators B Chem. 2014, 205, 338–344. [Google Scholar] [CrossRef]
  59. Liewhiran, C.; Tamaekong, N.; Wisitsoraat, A.; Phanichphant, S. Highly selective environmental sensors based on flame-spray-made SnO2 nanoparticles. Sens. Actuators B Chem. 2012, 163, 51–60. [Google Scholar] [CrossRef]
  60. Tamaekong, N.; Liewhiran, C.; Wisitsoraat, A.; Phanichphant, S. Acetylene sensor based on Pt/ZnO thick films as prepared by flame spray pyrolysis. Sens. Actuators B Chem. 2011, 152, 155–161. [Google Scholar] [CrossRef]
  61. Lee, K.W.; Uddin, A.S.M.I.; Phan, D.T.; Chung, G.S. Fabrication of low-temperature acetylene gas sensor based on Ag nanoparticles-loaded hierarchical ZnO nanostructures. Electron. Lett. 2015, 51, 572–574. [Google Scholar] [CrossRef]
  62. Tammanoon, N.; Wisitsoraat, A.; Sriprachuabwong, C.; Phokharatkul, D.; Tuantranont, A.; Phanichphant, S.; Liewhiran, C. Ultrasensitive NO2 sensor based on ohmic metal–semiconductor interfaces of electrolytically exfoliated graphene/flame-spray-made SnO2 nanoparticles composite operating at low temperatures. ACS Appl. Mater. Interfaces 2015, 7, 24338–24352. [Google Scholar] [CrossRef] [PubMed]
  63. Garg, R.; Dutta, N.K.; Choudhury, N.R. Work function engineering of graphene. Nanomaterials 2014, 4, 267–300. [Google Scholar] [CrossRef] [PubMed]
  64. Quang, P.L.; Cuong, N.D.; Hoa, T.T.; Long, H.T.; Chu, M.H.; Le, D.T.T.; Hieu, N.Y. Simple post-synthesis of mesoporous p-type Co3O4, nanochains for enhanced H2S gas sensing performance. Sens. Actuators B Chem. 2018, 270, 158–166. [Google Scholar] [CrossRef]
  65. Acharya, S.; Bangera, K.V.; Shivakumar, G.K. Conduction mechanism in n-CdSe/p-ZnTe heterojunction. J. Electron. Mater. 2016, 45, 3324–3331. [Google Scholar] [CrossRef]
  66. Chen, W.G.; Gao, T.Y.; Li, Q.Z.; Gan, H.I. Enhanced gas sensing properties of flower-like ZnO nanostructure to acetylene. Mater. Process. Rep. 2014, 30, 96–100. [Google Scholar] [CrossRef]
Figure 1. (a) Schematic diagram of the tungsten trioxide/reduced graphene oxide (WO3/rGO) nanocomposites ceramic planar gas sensor; (b) Photographs of the blank sensor (front); (c) Photographs of the blank sensor (back); and, (d) Photographs of the well-fabricated sensor.
Nanomaterials 08 00909 g001
Figure 2. Gas sensing test system.
Nanomaterials 08 00909 g002
Figure 3. (a) A X-ray diffraction (XRD) patterns of graphite oxide (GO) and rGO; (b) XRD patterns of WO3 and different concentrations of WO3/rGO nanocomposites.
Nanomaterials 08 00909 g003
Figure 4. (a) Transmission electron microscopy (TEM) image of pure WO3 nanolamellae; (b) high-resolution TEM (HRTEM) image of WO3 nanolamellae; (c) TEM image of WG1 nanocomposites; and, (d) HRTEM image of WG1 nanocomposites.
Nanomaterials 08 00909 g004
Figure 5. Raman spectra of rGO, GO, WG1, and WO3 nanocomposites.
Nanomaterials 08 00909 g005
Figure 6. XPS (X-ray photoelectron spectroscopy) spectra of WG1 nanocomposites.
Nanomaterials 08 00909 g006
Figure 7. (a) High-resolution XPS spectra in the vicinity of the W 4f peaks; (b) O 1s peak; (c) C 1s peak of WG1; and, (d) C 1s peaks of rGO.
Nanomaterials 08 00909 g007
Figure 8. Thermogravimetric analyses-derivative thermogravimetric analysis-differential scanning calorimetry (TG-DSC-DTG) curves of prepared WG1 sample.
Nanomaterials 08 00909 g008
Figure 9. Photoluminescence (PL) emission spectra for pure WO3 and WG1 nanocomposite. WO3-rGO*: the mechanical mixture of WO3 and rGO (1 wt % GO).
Nanomaterials 08 00909 g009
Figure 10. (a) Response of W0G, WG0, WG0.5, WG1, WG2, and WG4 to 50 ppm C2H2 at different operating temperature; (b) Resistance of W0G, WG0, WG0.5, WG1, WG2, and WG4 at different operating temperature in air.
Nanomaterials 08 00909 g010
Figure 11. (a) Sensor response variation for 50 ppm C2H2 at 150 °C; (b) Dynamic sensing transient of WG1 senor to 50 ppm C2H2 gas; and, (c) Response under different gas concentrations from 0.5 ppm to 50 ppm for C2H2 of WG1 at 150 °C.
Nanomaterials 08 00909 g011
Figure 12. (a) Corresponding response variations of the WG1 sensor as a function of C2H2 gas concentrations at 150 °C; and, (b) Linear relationship between response and concentrations at low concentrations.
Nanomaterials 08 00909 g012
Figure 13. (a) The stability of W0G, WG0, and WG1 to 50 ppm C2H2 gas at 150°C; and, (b) The repeatability of WG1 gas sensor to 50 ppm C2H2 gas at 150°C.
Nanomaterials 08 00909 g013
Figure 14. Energy band models for C2H2 gas sensing mechanisms of pure rGO nanosheets.
Nanomaterials 08 00909 g014
Figure 15. (a) Representative physical models for C2H2 gas sensing mechanism of WG0; and, (b) Energy band models for C2H2 gas sensing mechanisms of WG0.
Nanomaterials 08 00909 g015
Figure 16. (a) Representative physical models for C2H2 gas sensing mechanism of WG1; and, (b) Representative physical models for C2H2 gas sensing mechanism of WG2 and WG4.
Nanomaterials 08 00909 g016
Table 1. Comparison between our work and other reported work on C2H2 gas detection.
RefMaterialsTemperature/°CMeasuring Range/ppmResponseτResponse/sτRecovery/s
[22]WO3 nanorod300 20035 (200 ppm)109
[22]WO3 nanowire300 20060 (200 ppm)67
[57]ZnO NPs 1>30030–10006.4 (100 ppm)>2 min>3 min
[58]Ag-ZnO NPs-rGO1501–100021.2 (100 ppm)2580
[57]ZnO Hrc 2>30030–100011.2 (100 ppm)>2 min>6 min
[58]Ag-ZnO Hrc-rGO2003–100012.3 (100 ppm)43100
[59]Pure SnO2300200–10,0006.3 (10,000 ppm)34>10 min
[60]Pt/ZnO3005–10,0001.1 (50 ppm)N/AN/A
[61]Ag-ZnO Hrc2001–100057 (50 ppm)N/AN/A
OurWG11501–50015 (50 ppm)5221
1 Nps: Nanoparticles, 2 Hrc: Hierarchical.

