Pure Anatase Phase Titanium Dioxide Films Prepared by Mist Chemical Vapor Deposition


Abstract
1. Introduction
2. Materials and Methods
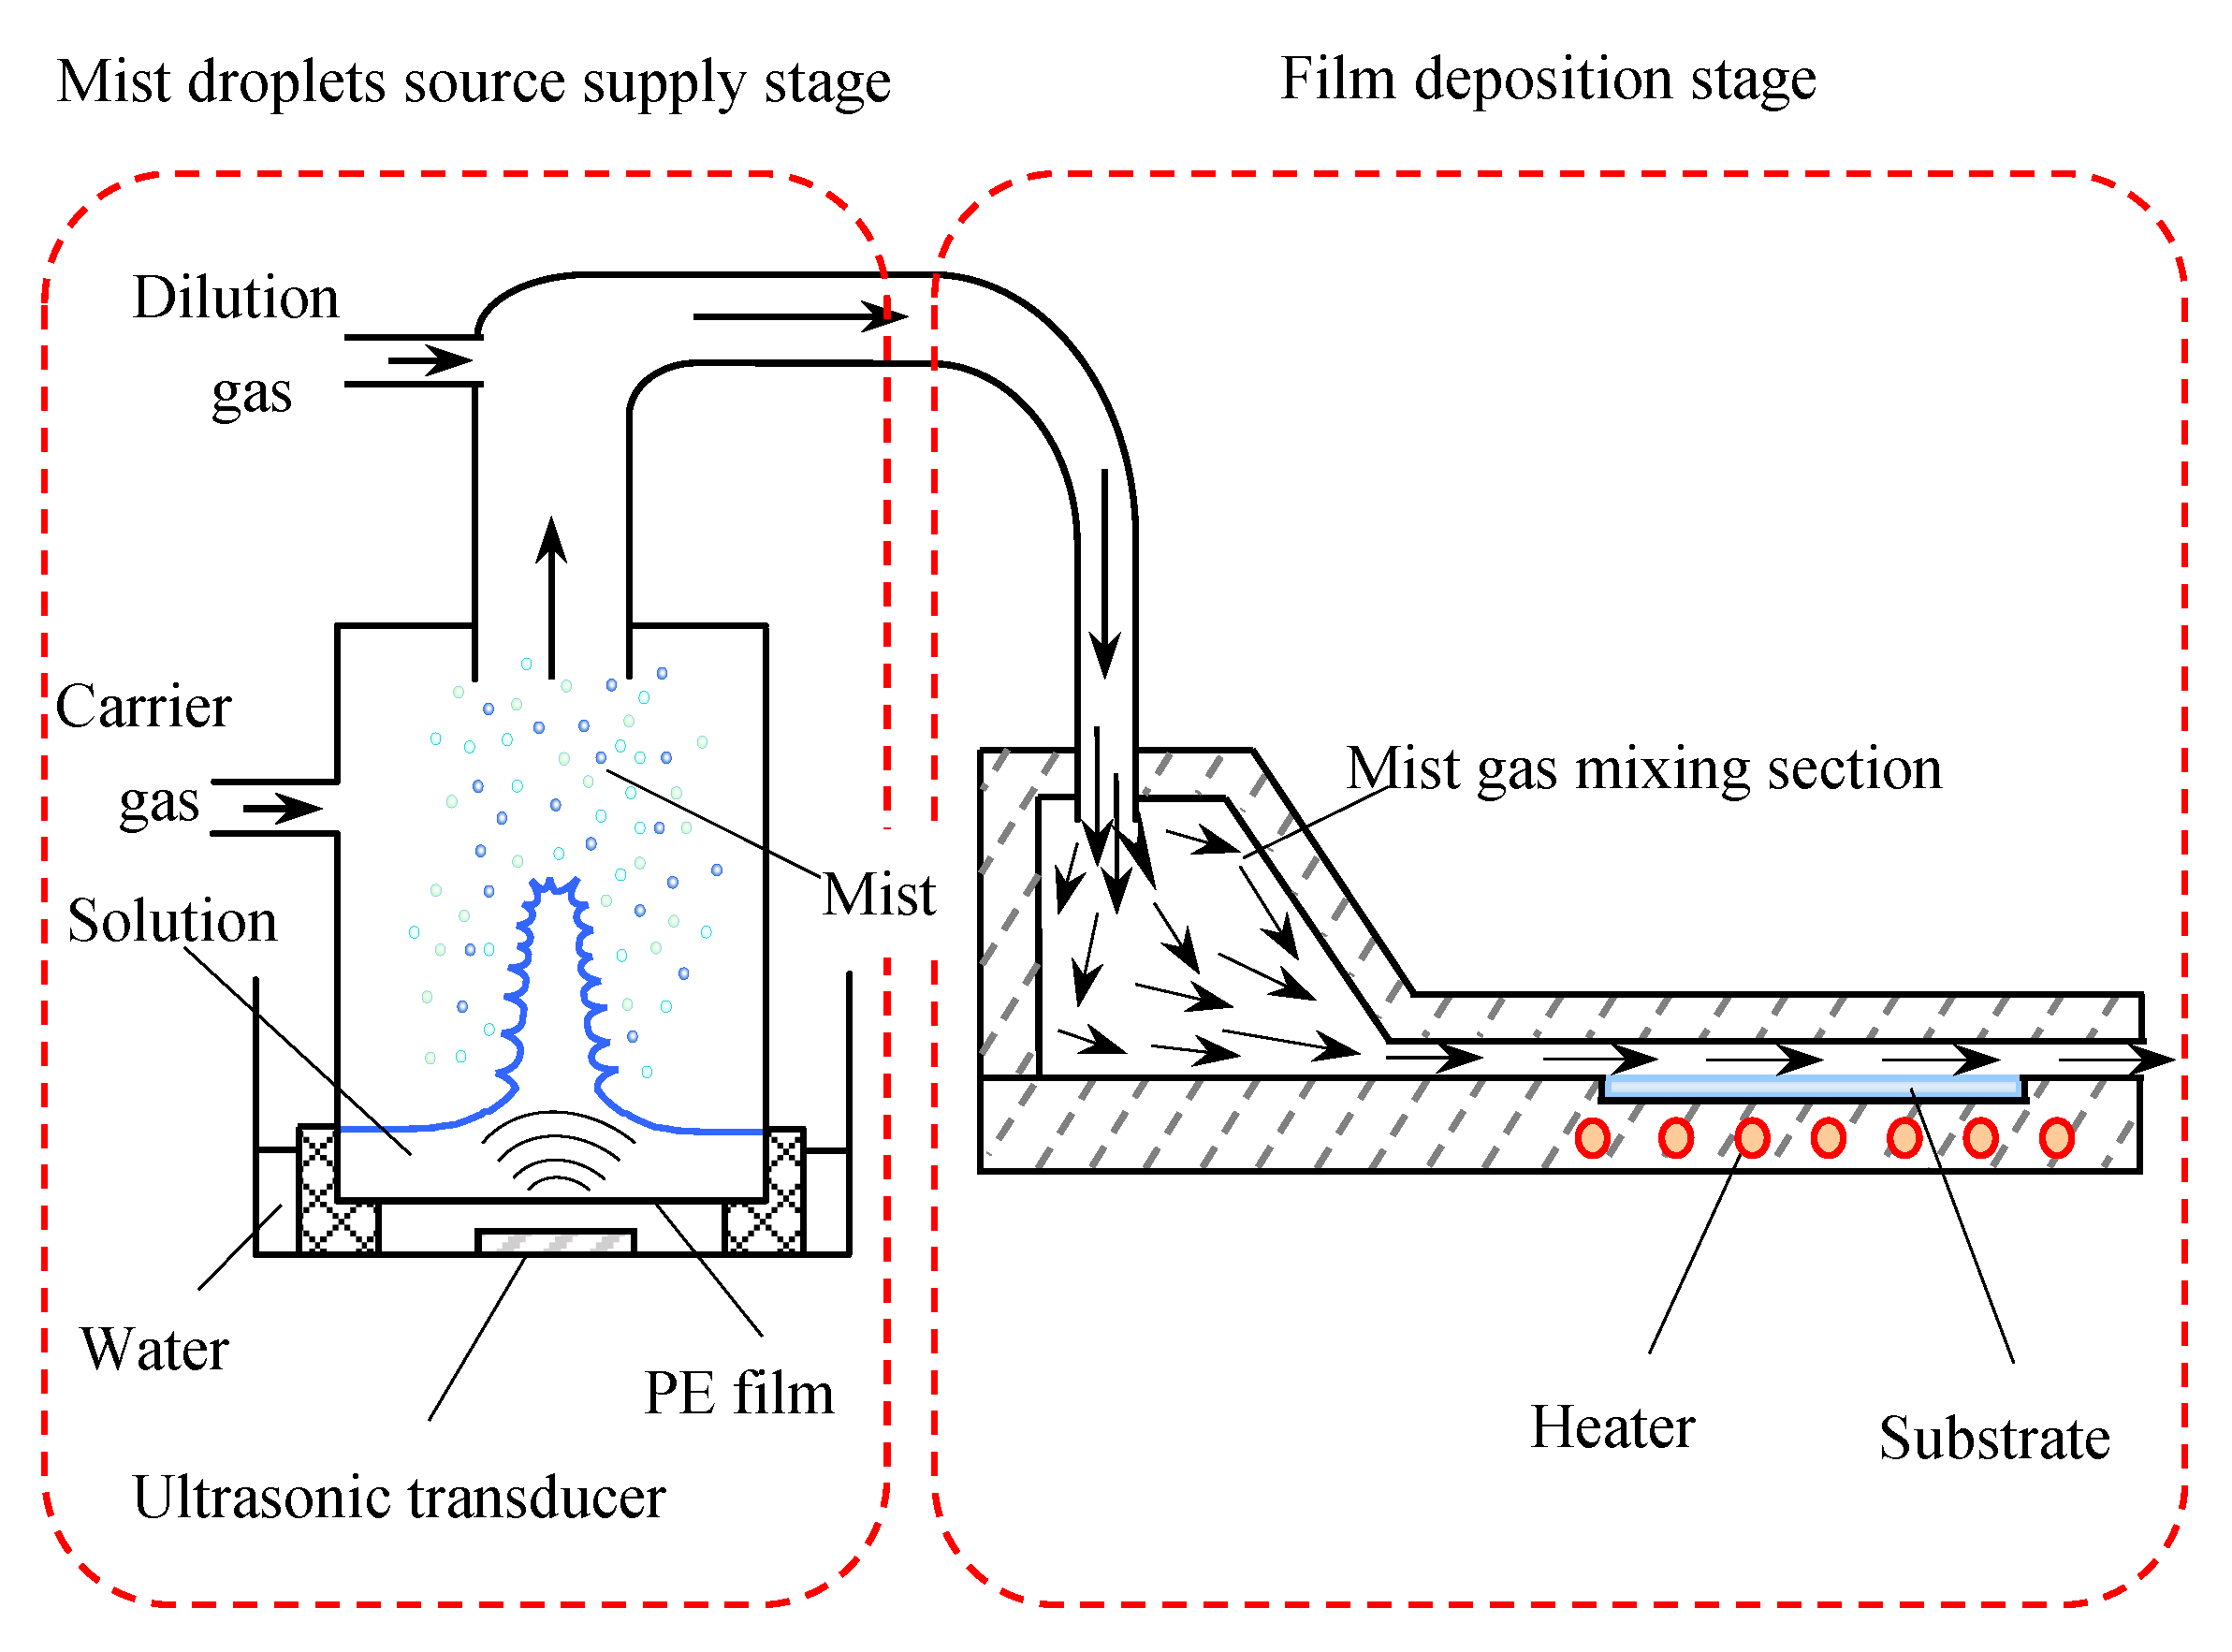
2.1. Introduction of a Novel Mist CVD System
2.2. Dependence of Deposition Temperature
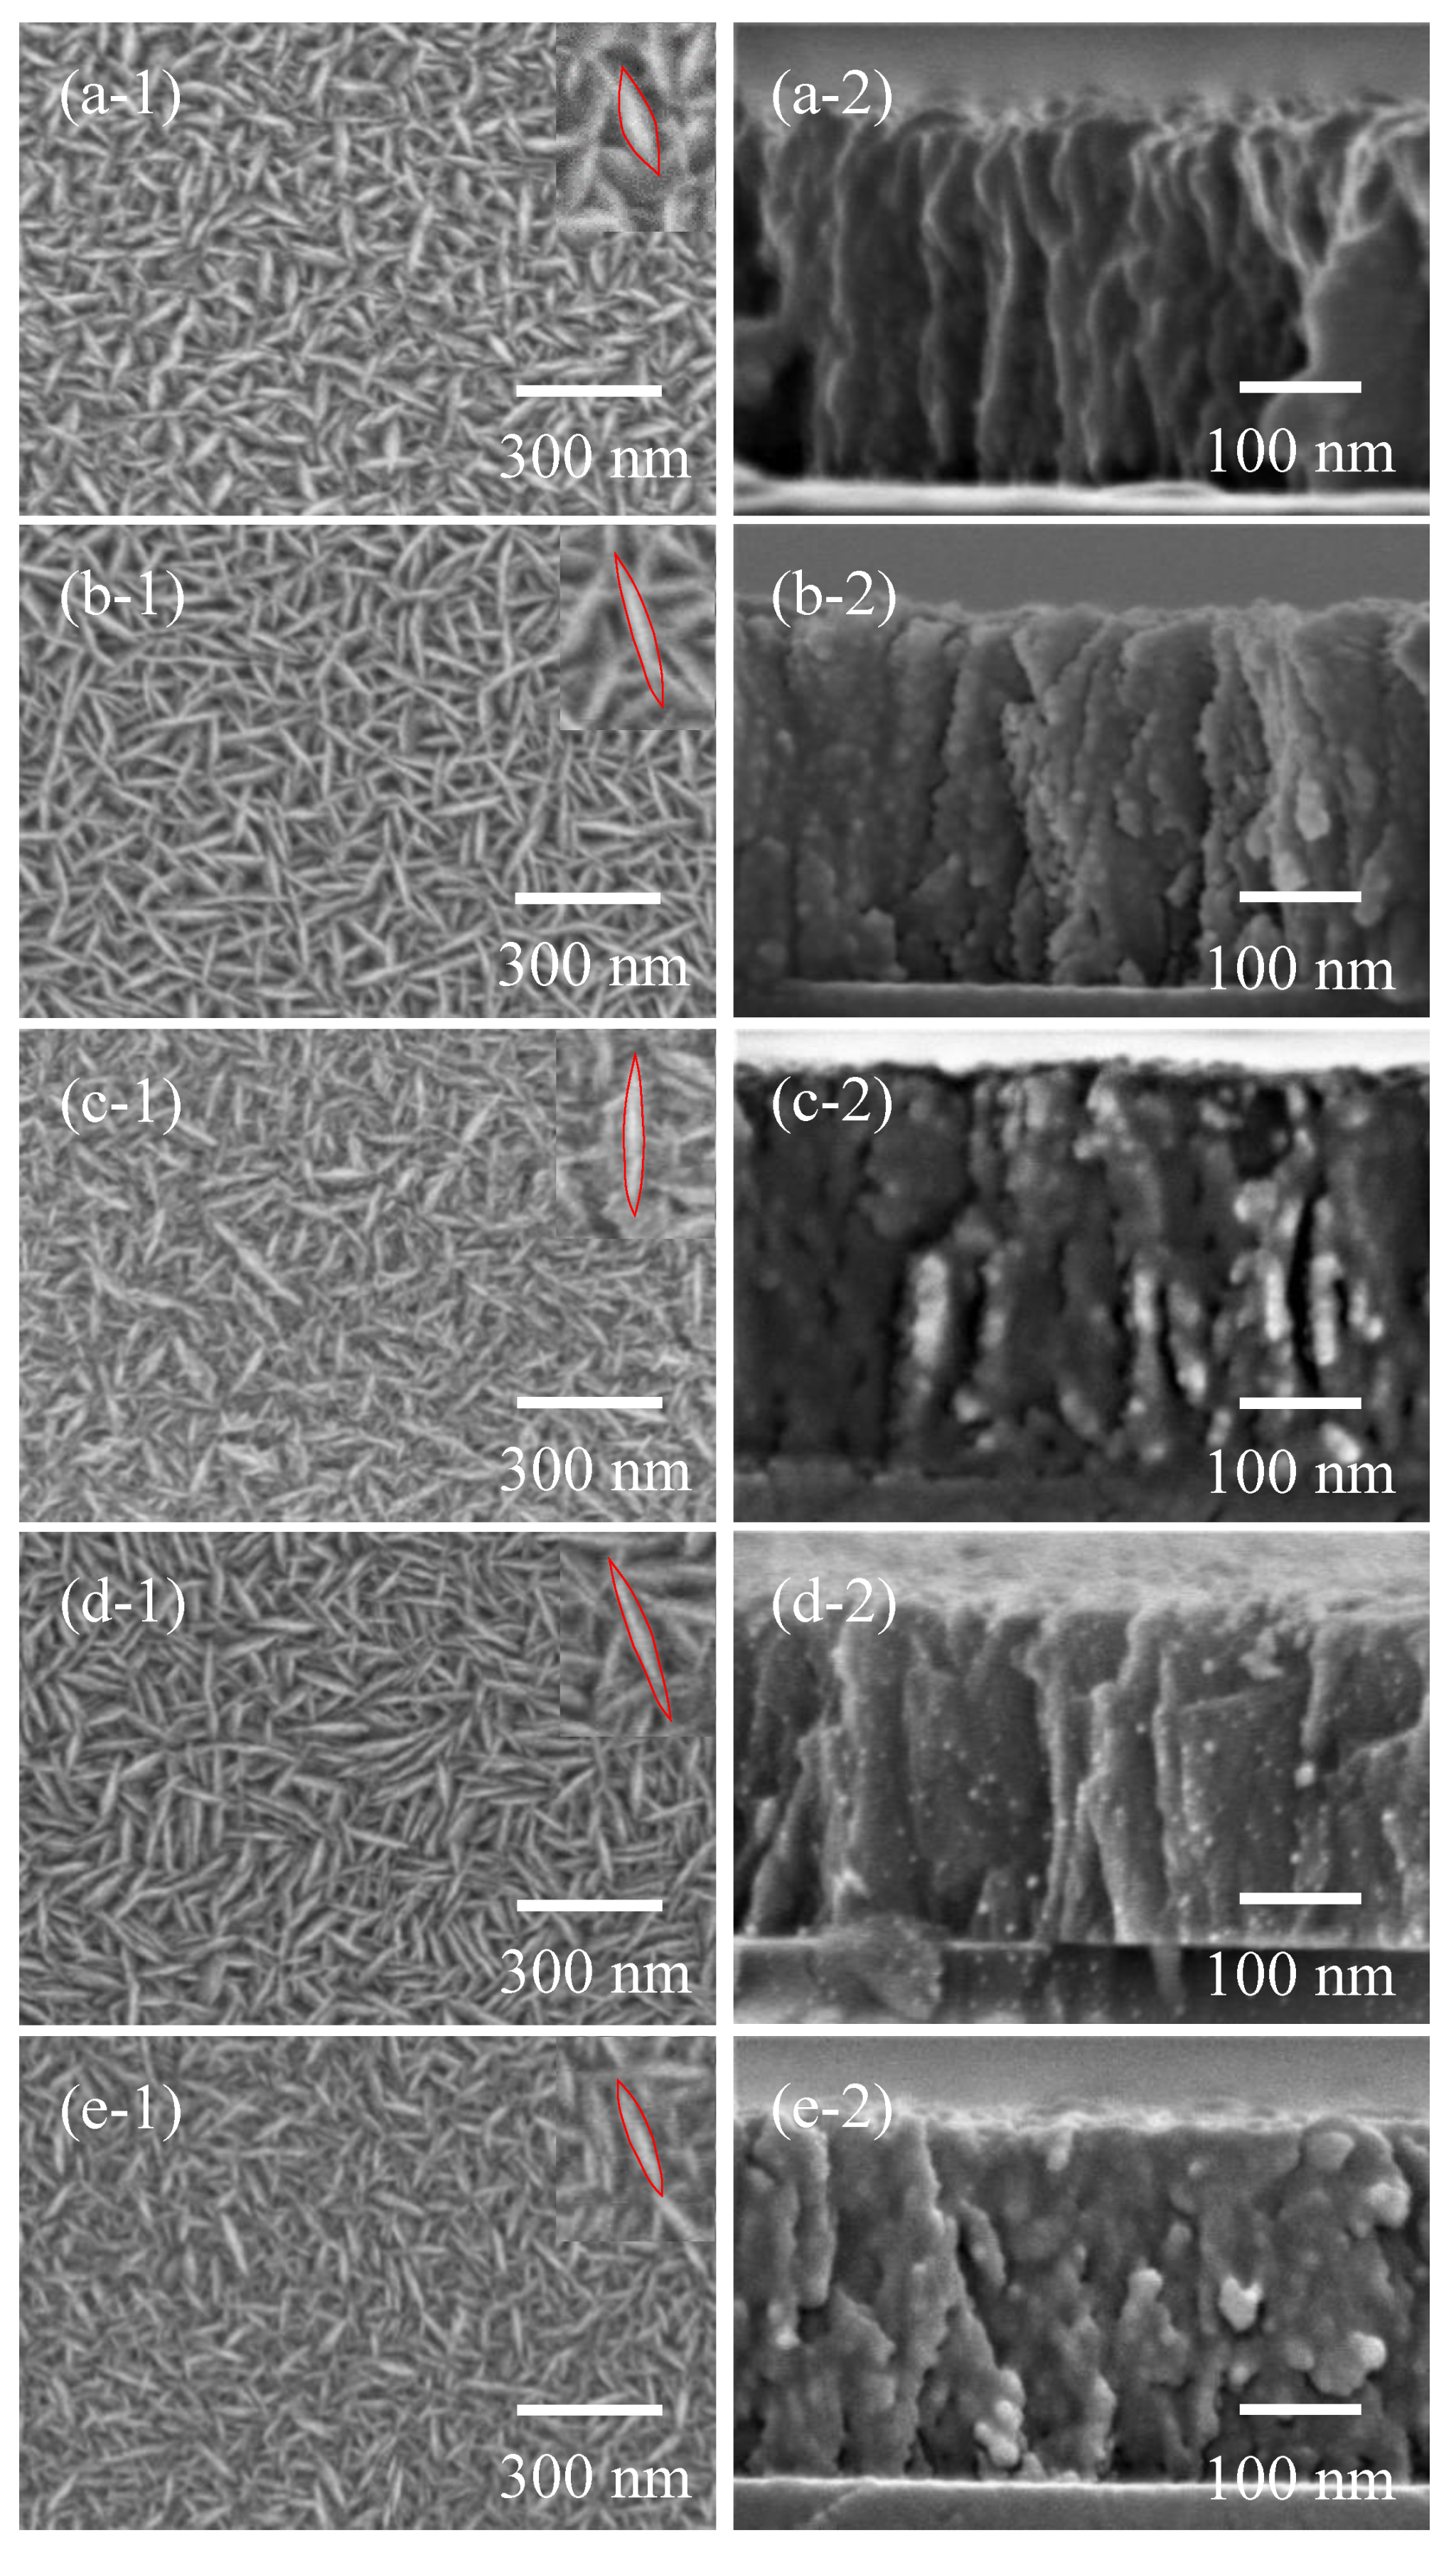
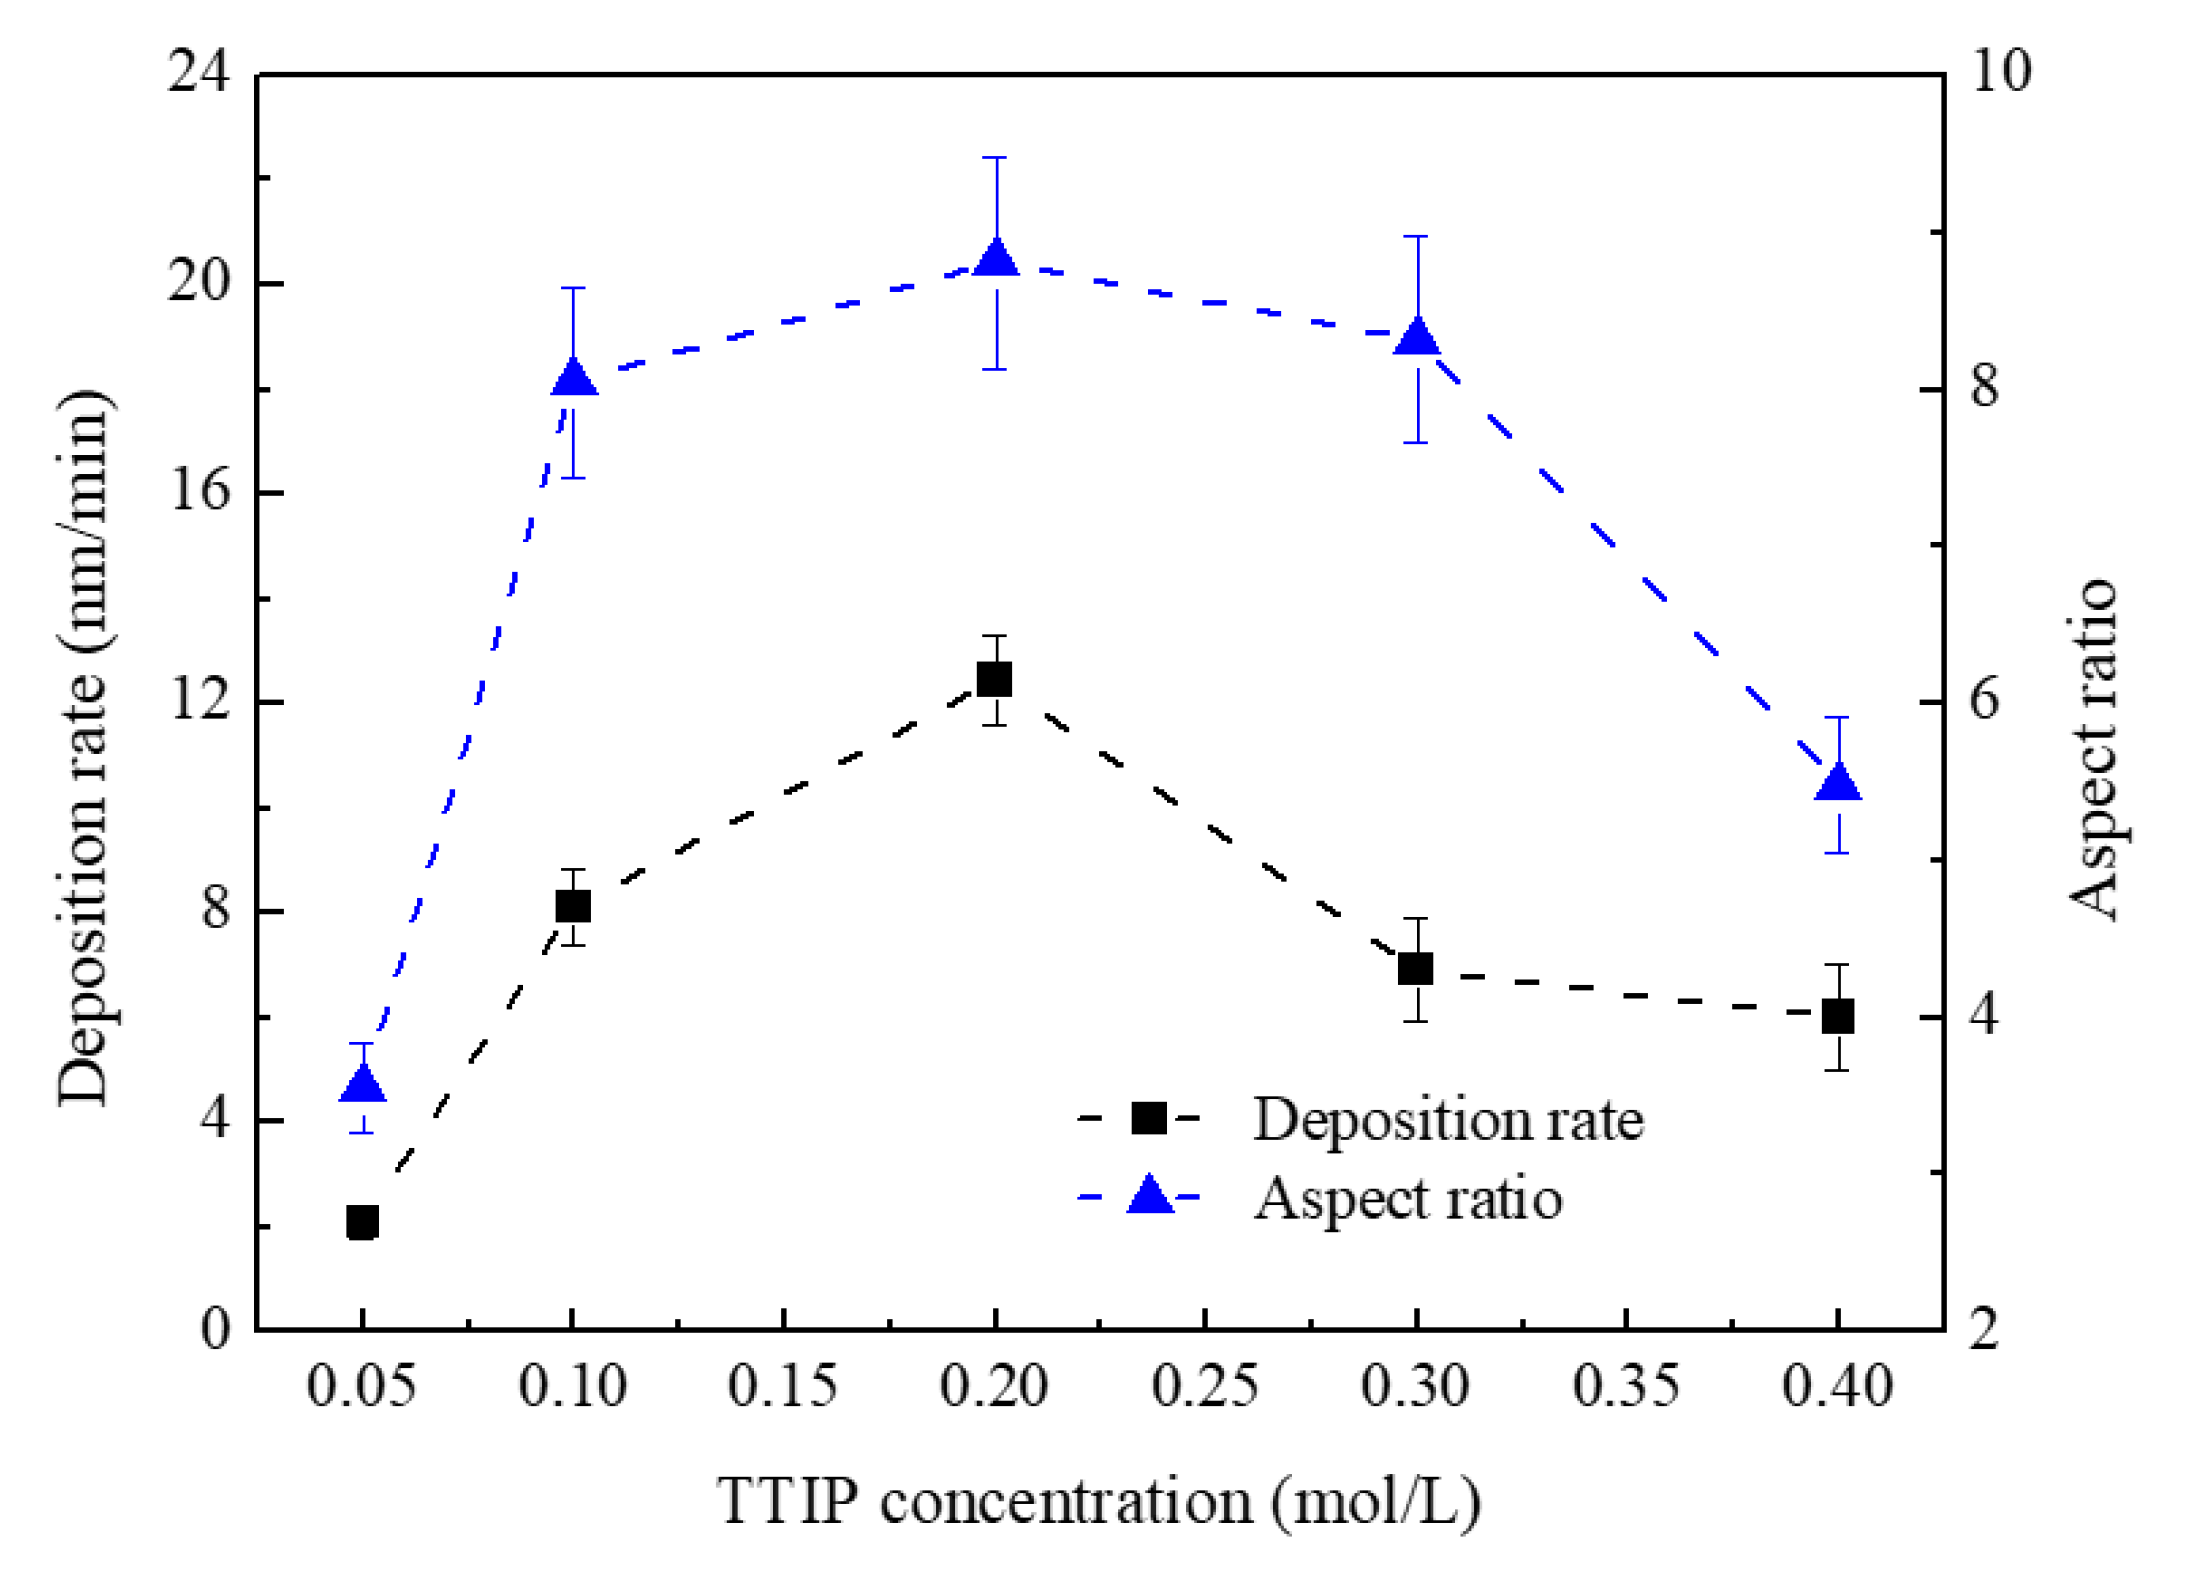
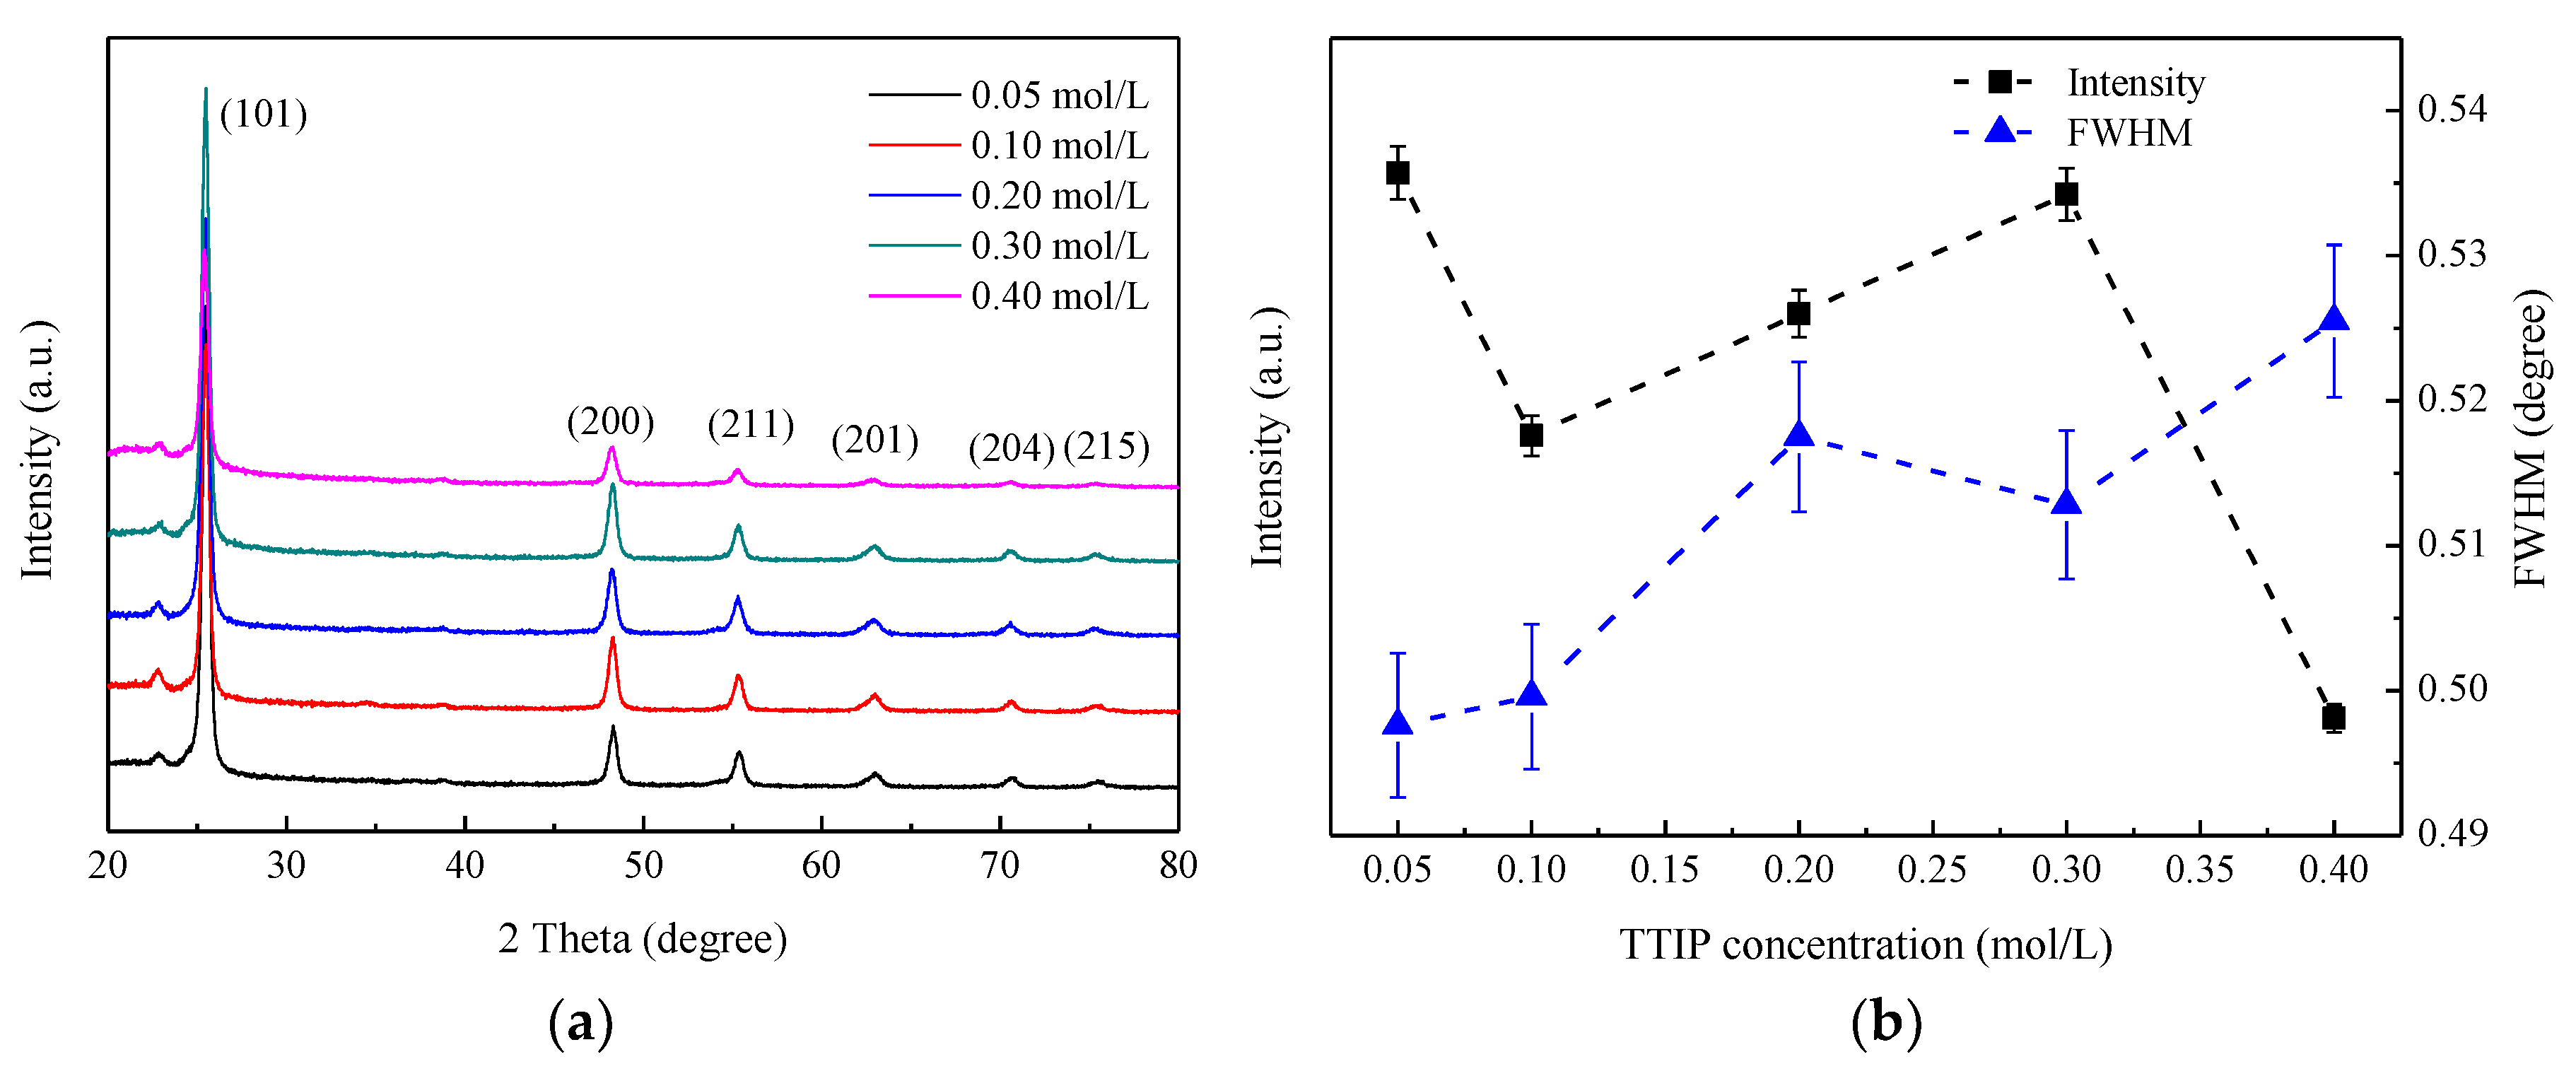
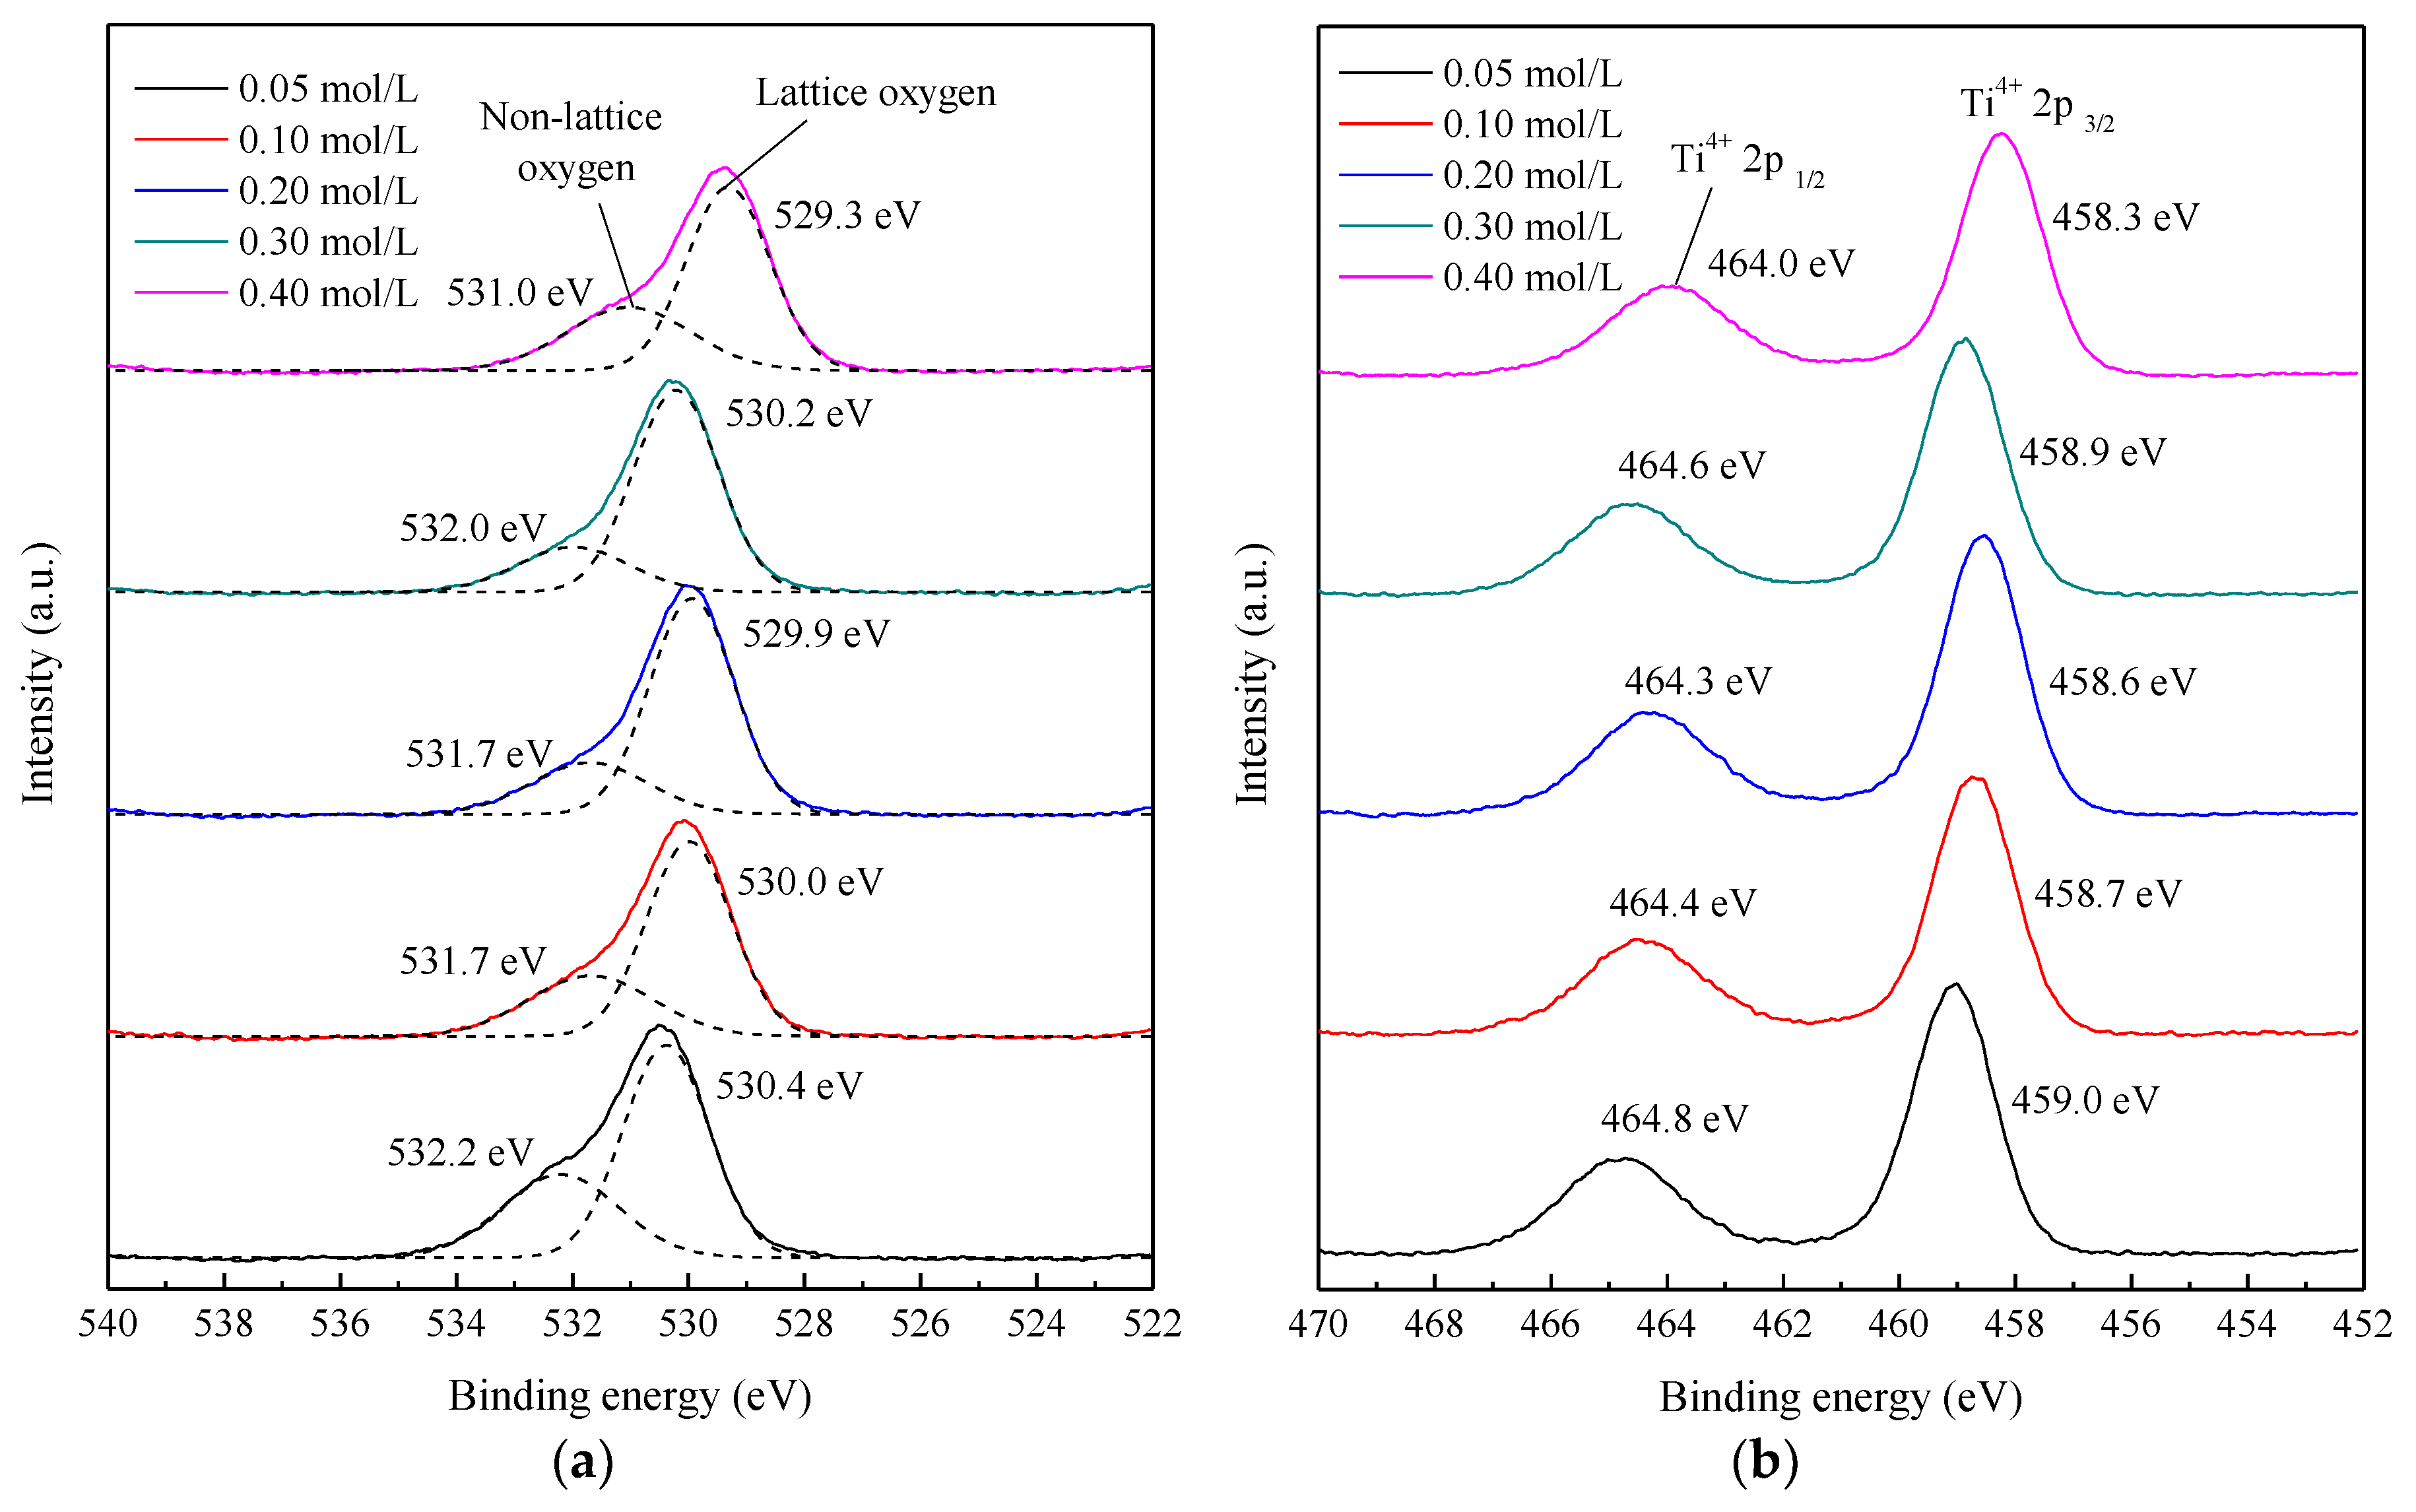
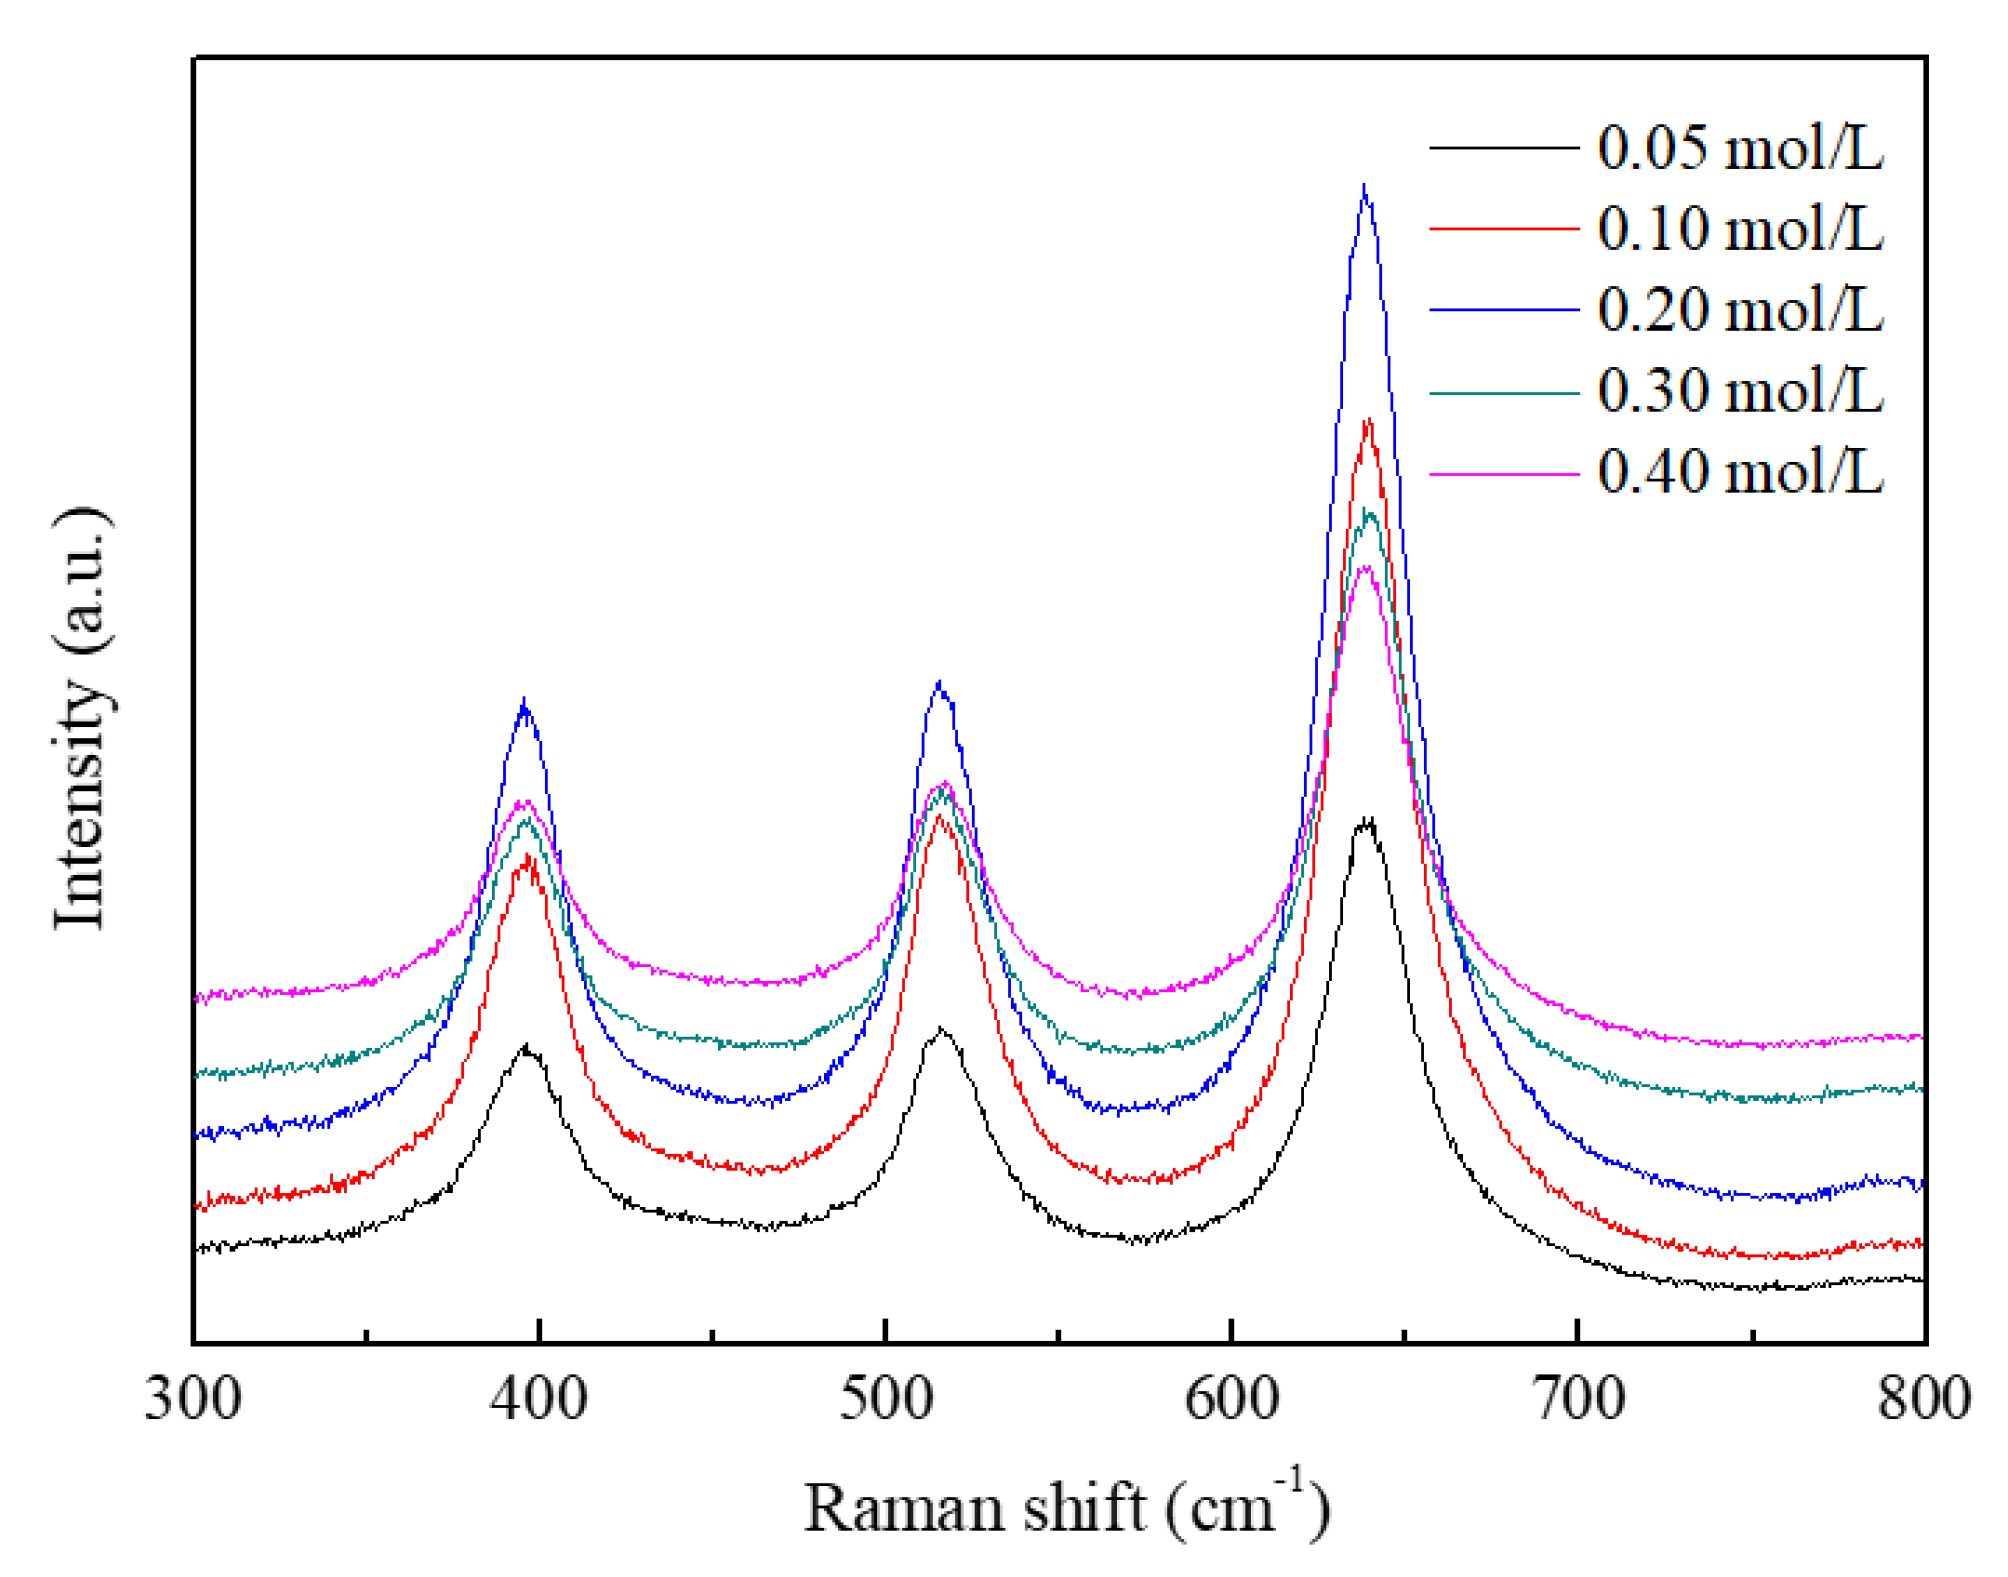
2.3. Dependence of TTIP Concentration
2.4. Characterization
3. Results and Discussion
4. Conclusions
Author Contributions
Funding
Acknowledgments
Conflicts of Interest
References
- Sakai, G.; Matsunaga, N.; Shimanoe, K.; Yamazoe, N. Theory of gas-diffusion controlled sensitivity for thin film semiconductor gas sensor. Sens. Actuators B Chem. 2001, 80, 125–131. [Google Scholar] [CrossRef]
- Brown, J.R.; Cheney, M.T.; Haycock, P.W.; Houlton, D.J.; Jones, A.C.; Williams, E.W. The gas-sensing properties of tin oxide thin films deposited by metallorganic chemical vapor deposition. J. Electrochem. Soc. 1997, 144, 295–299. [Google Scholar] [CrossRef]
- Baryshnikova, M.V.; Filatov, L.A.; Petrov, A.S.; Alexandrov, S.E. CVD deposited titania thin films for gas sensors with improved operating characteristics. Chem. Vap. Depos. 2015, 21, 327–333. [Google Scholar] [CrossRef]
- Zhang, J.; Zhao, C.; Hu, P.A.; Fu, Y.Q.; Wang, Z.; Cao, W.; Yang, B.; Placido, F. A UV light enhanced TiO2/graphene device for oxygen sensing at room temperature. RSC Adv. 2013, 3, 22185–22190. [Google Scholar] [CrossRef]
- Comert, B.; Akin, N.; Donmez, M.; Saglam, S.; Ozcelik, S. Titanium dioxide thin films as methane gas sensors. IEEE Sens. J. 2016, 16, 8890–8896. [Google Scholar] [CrossRef]
- Josephine, D.S.R.; Babu, K.J.; Kumar, G.P.G.; Sethuraman, K. Titanium dioxide anchored graphene oxide nanosheets for highly selective voltammetric sensing of dopamine. Microchim. Acta 2017, 184, 781–790. [Google Scholar] [CrossRef]
- Epifani, M.; Helwig, A.; Arbiol, J.; Díaz, R.; Francioso, L.; Siciliano, P.; Mueller, G.; Morante, J.R. TiO2 thin films from titanium butoxide: Synthesis, Pt addition, structural stability, microelectronic processing and gas-sensing properties. Sens. Actuator B 2008, 130, 599–608. [Google Scholar] [CrossRef]
- Sennik, E.; Kilinc, N.; Ozturk, Z.Z. Electrical and VOC sensing properties of anatase and rutile TiO2 nanotubes. J. Alloys Compd. 2014, 616, 89–96. [Google Scholar] [CrossRef]
- Chen, L.; Liao, X.; Jiang, W. Effect of heat treatment temperature on super-hydrophilic property of enamels with titanium dioxide thin film. J. Sol-Gel Sci. Technol. 2016, 80, 606–611. [Google Scholar] [CrossRef]
- Scuderi, V.; Buccheri, M.A.; Impellizzeri, G.; Mauro, A.D.; Rappazzo, G.; Bergum, K.; Svensson, B.G.; Privitera, V. Photocatalytic and antibacterial properties of titanium dioxide flat film. Mater. Sci. Semicond. Process. 2016, 42, 32–35. [Google Scholar] [CrossRef]
- Scheffel, B.; Modes, T.; Metzner, C. Reactive high-rate deposition of titanium oxide coatings using electron beam evaporation, spotless arc and dual crucible. Surf. Coat. Technol. 2016, 287, 138–144. [Google Scholar] [CrossRef]
- Mazur, M. Analysis of the properties of functional titanium dioxide thin films deposited by pulsed DC magnetron sputtering with various O2: Ar ratios. Opt. Mater. 2017, 69, 96–104. [Google Scholar] [CrossRef]
- Karunagaran, B.; Uthirakumar, P.; Chung, S.J.; Velumani, S.; Suh, E.K. TiO2 thin film gas sensor for monitoring ammonia. Mater. Charact. 2007, 58, 680–684. [Google Scholar] [CrossRef]
- Klaysri, R.; Ratova, M.; Praserthdam, P.; Kelly, P.J. Deposition of visible light-active c-doped titania films via magnetron sputtering using CO2 as a source of carbon. Nanomaterials 2017, 7, 113. [Google Scholar] [CrossRef] [PubMed]
- Choi, K.-H.; Chung, K.-B.; Kim, H.-K. d-orbital ordering of oxygen-deficient amorphous and anatase TiO2−x channels for high mobility thin film transistors. Appl. Phys. Lett. 2013, 102, 153511. [Google Scholar] [CrossRef]
- Jin, C.; Liu, B.; Lei, Z.; Sun, J. Structure and photoluminescence of the TiO2 films grown by atomic layer deposition using tetrakis-dimethylamino titanium and ozone. Nanoscale Res. Lett. 2015, 10, 95–104. [Google Scholar] [CrossRef] [PubMed]
- Chimupala, Y.; Hyett, G.; Simpson, R.; Mitchell, R.; Douthwaite, R.; Milne, S.J.; Brydson, R.D. Synthesis and characterization of mixed phase anatase TiO2 and sodium-doped TiO2(B) thin films by low pressure chemical vapour deposition (LPCVD). RSC Adv. 2014, 4, 48507–48515. [Google Scholar] [CrossRef]
- Ban, T.; Nakatani, T.; Ohya, Y. Morphology of anatase crystals and their aggregates synthesized hydrothermally from aqueous mixtures of titanium alkoxide and different alkylammonium hydroxides. J. Ceram. Soc. Jpn. 2009, 117, 268–272. [Google Scholar] [CrossRef]
- Campbell, S.A.; Kim, H.S.; Gilmer, D.C.; He, B.; Ma, T.; Gladfelter, W.L. Titanium dioxide (TiO2)-based gate insulators. IBM J. Res. Dev. 1999, 43, 383–392. [Google Scholar] [CrossRef]
- Wu, J.; Hao, S.; Lin, J.; Huang, M.; Huang, Y.; Lan, Z.; Li, P. Crystal morphology of anatase titania nanocrystals used in dye-sensitized solar cells. Cryst. Growth Des. 2008, 8, 247–252. [Google Scholar] [CrossRef]
- Zhang, J.; Liao, J.; Yang, F.; Xu, M.; Lin, S. Regulation of the electroanalytical performance of ultrathin titanium dioxide nanosheets toward lead ions by non-metal doping. Nanomaterials 2017, 7, 327. [Google Scholar] [CrossRef] [PubMed]
- Gouma, P.I.; Mills, M.J. Anatase-to-rutile transformation in titania powders. J. Am. Ceram. Soc. 2001, 84, 619–622. [Google Scholar] [CrossRef]
- Penn, R.L.; Banfield, J.F. Formation of rutile nuclei at anatase {112} twin interfaces and the phase transformation mechanism in nanocrystalline titania. Am. Miner. 1999, 84, 871–876. [Google Scholar] [CrossRef]
- Zhou, Y.; Fichthorn, K.A. Microscopic view of nucleation in the anatase-to-rutile transformation. J. Phys. Chem. C 2012, 116, 8314–8321. [Google Scholar] [CrossRef]
- Lee, G.H.; Zuo, J.M. Growth and phase transformation of nanometer-sized titanium oxide powders produced by the precipitation method. J. Am. Ceram. Soc. 2004, 87, 473–479. [Google Scholar] [CrossRef]
- Hanaor, D.A.H.; Sorrell, C.C. Review of the anatase to rutile phase transformation. J. Mater. Sci. 2011, 46, 855–874. [Google Scholar] [CrossRef]
- Li, X.; Li, C.; Kawaharamura, T.; Wang, D.; Nitta, N.; Furuta, M.; Furuta, H.; Hatta, A. Fabrication of zinc oxide nanostructures by mist chemical vapor deposition. Trans. Mater. Res. Soc. Jpn. 2014, 39, 161–164. [Google Scholar] [CrossRef]
- Liu, H.-Y.; Hsu, Y.-L.; Su, H.-Y.; Huang, R.-C.; Hou, F.-Y.; Tu, G.-C.; Liu, W.-H. A comparative study of amorphous, anatase, rutile, and mixed phase TiO2 films by mist chemical vapor deposition and ultraviolet photodetectors applications. IEEE Sens. J. 2018, 18, 4022–4029. [Google Scholar] [CrossRef]
- Liu, H.-Y.; Hong, S.-H.; Sun, W.-C.; Wei, S.-Y.; Yu, S.-M. TiO2-based metal-semiconductor-metal ultraviolet photodetectors deposited by ultrasonic spray pyrolysis technique. IEEE Trans. Electron. Devices 2016, 63, 79–85. [Google Scholar] [CrossRef]
- Kawaharamura, T.; Mori, K.; Orita, H.; Shirahata, T.; Fujita, S.; Hirao, T. Effect of O3 and aqueous ammonia on crystallization of MgO thin film grown by mist chemical vapor deposition. Jpn. J. Appl. Phys. 2013, 52, 035501. [Google Scholar] [CrossRef]
- Goyenola, C.; Stafström, S.; Schmidt, S.; Hultman, L.; Gueorguiev, G.K. Carbon fluoride, CFx: Structural diversity as predicted by first principles. J. Phys. Chem. C 2014, 118, 6514–6521. [Google Scholar] [CrossRef]
- Buerger, P.; Nurkowski, D.; Akroyd, J.; Mosbach, S.; Kraft, M. First-principles thermochemistry for the thermal decomposition of titanium tetraisopropoxide. J. Phys. Chem. A 2015, 119, 8376–8378. [Google Scholar] [CrossRef] [PubMed]
- Reinke, M.; Ponomarev, E.; Kuzminykh, Y.; Hoffmann, P. Surface kinetics of titanium isopropoxide in high vacuum chemical vapor deposition. J. Phys. Chem. C 2015, 119, 27965–27971. [Google Scholar] [CrossRef]
- Taylor, C.J.; Gilmer, D.C.; Colombo, D.G.; Wilk, G.D.; Campbell, S.A.; Roberts, J.; Gladfelter, W.L. Does chemistry really matter in the chemical vapor deposition of titanium dioxide? Precursor and kinetic effects on the microstructure of polycrystalline films. J. Am. Chem. Soc. 1999, 121, 5220–5229. [Google Scholar] [CrossRef]
- Reinke, M.; Kuzminykh, Y.; Hoffmann, P. Low temperature chemical vapor deposition using atomic layer deposition chemistry. Chem. Mater. 2015, 27, 1604–1611. [Google Scholar] [CrossRef]
- Reinke, M.; Ponomarev, E.; Kuzminykh, Y.; Hoffmann, P. Combinatorial characterization of TiO2 chemical vapor deposition utilizing titanium isopropoxide. ACS Comb. Sci. 2015, 17, 413–420. [Google Scholar] [CrossRef] [PubMed]
- Johnson, A.M.; Stair, P.C. Alternative low-pressure surface chemistry of titanium tetraisopropoxide on oxidized molybdenum. J. Phys. Chem. C 2014, 118, 29361–29369. [Google Scholar] [CrossRef]
- Yang, H.; Sun, C.; Qiao, S.; Zou, J.; Liu, G.; Smith, S.C.; Cheng, H.; Lu, G. Anatase TiO2 single crystals with a large percentage of reactive facets. Nature 2008, 453, 638–641. [Google Scholar] [CrossRef] [PubMed]
- Sajjadi, B.; Asgharzadehahmadi, S.; Asaithambi, P.; Raman, A.A.A.; Parthasarathy, R. Investigation of mass transfer intensification under power ultrasound irradiation using 3D computational simulation: A comparative analysis. Ultrason. Sonochem. 2017, 34, 504–518. [Google Scholar] [CrossRef] [PubMed]
- Hao, L.; Miyazawa, K.; Yoshida, H.; Lu, Y. Visible-light-driven oxygen vacancies and Ti3+ co-doped TiO2 coatings prepared by mechanical coating and carbon reduction. Mater. Res. Bull. 2018, 97, 13–18. [Google Scholar] [CrossRef]
- Xing, M.; Zhang, J.; Chen, F.; Tian, B. An economic method to prepare vacuum activated photocatalysts with high photo-activities and photosensitivities. Chem. Commun. 2011, 47, 4947–4949. [Google Scholar] [CrossRef] [PubMed]


| Solute | TTIP |
| Solvent | Ethanol |
| Concentration (mol/L) | 0.10 |
| Substrate | Quartz glass |
| Deposition temperature (°C) | 200, 250, 300, 350, 400 |
| Carrier gas, flow rate (L/min) | Compressed air, 2.5 |
| Dilution gas, flow rate (L/min) | Compressed air, 4.5 |
| Solute | TTIP |
| Solvent | Ethanol |
| Concentration (mol/L) | 0.05, 0.10, 0.20, 0.30,0.40 |
| Substrate | Quartz glass |
| Deposition temperature (°C) | 400 |
| Carrier gas, flow rate (L/min) | Compressed air, 2.5 |
| Dilution gas, flow rate (L/min) | Compressed air, 4.5 |
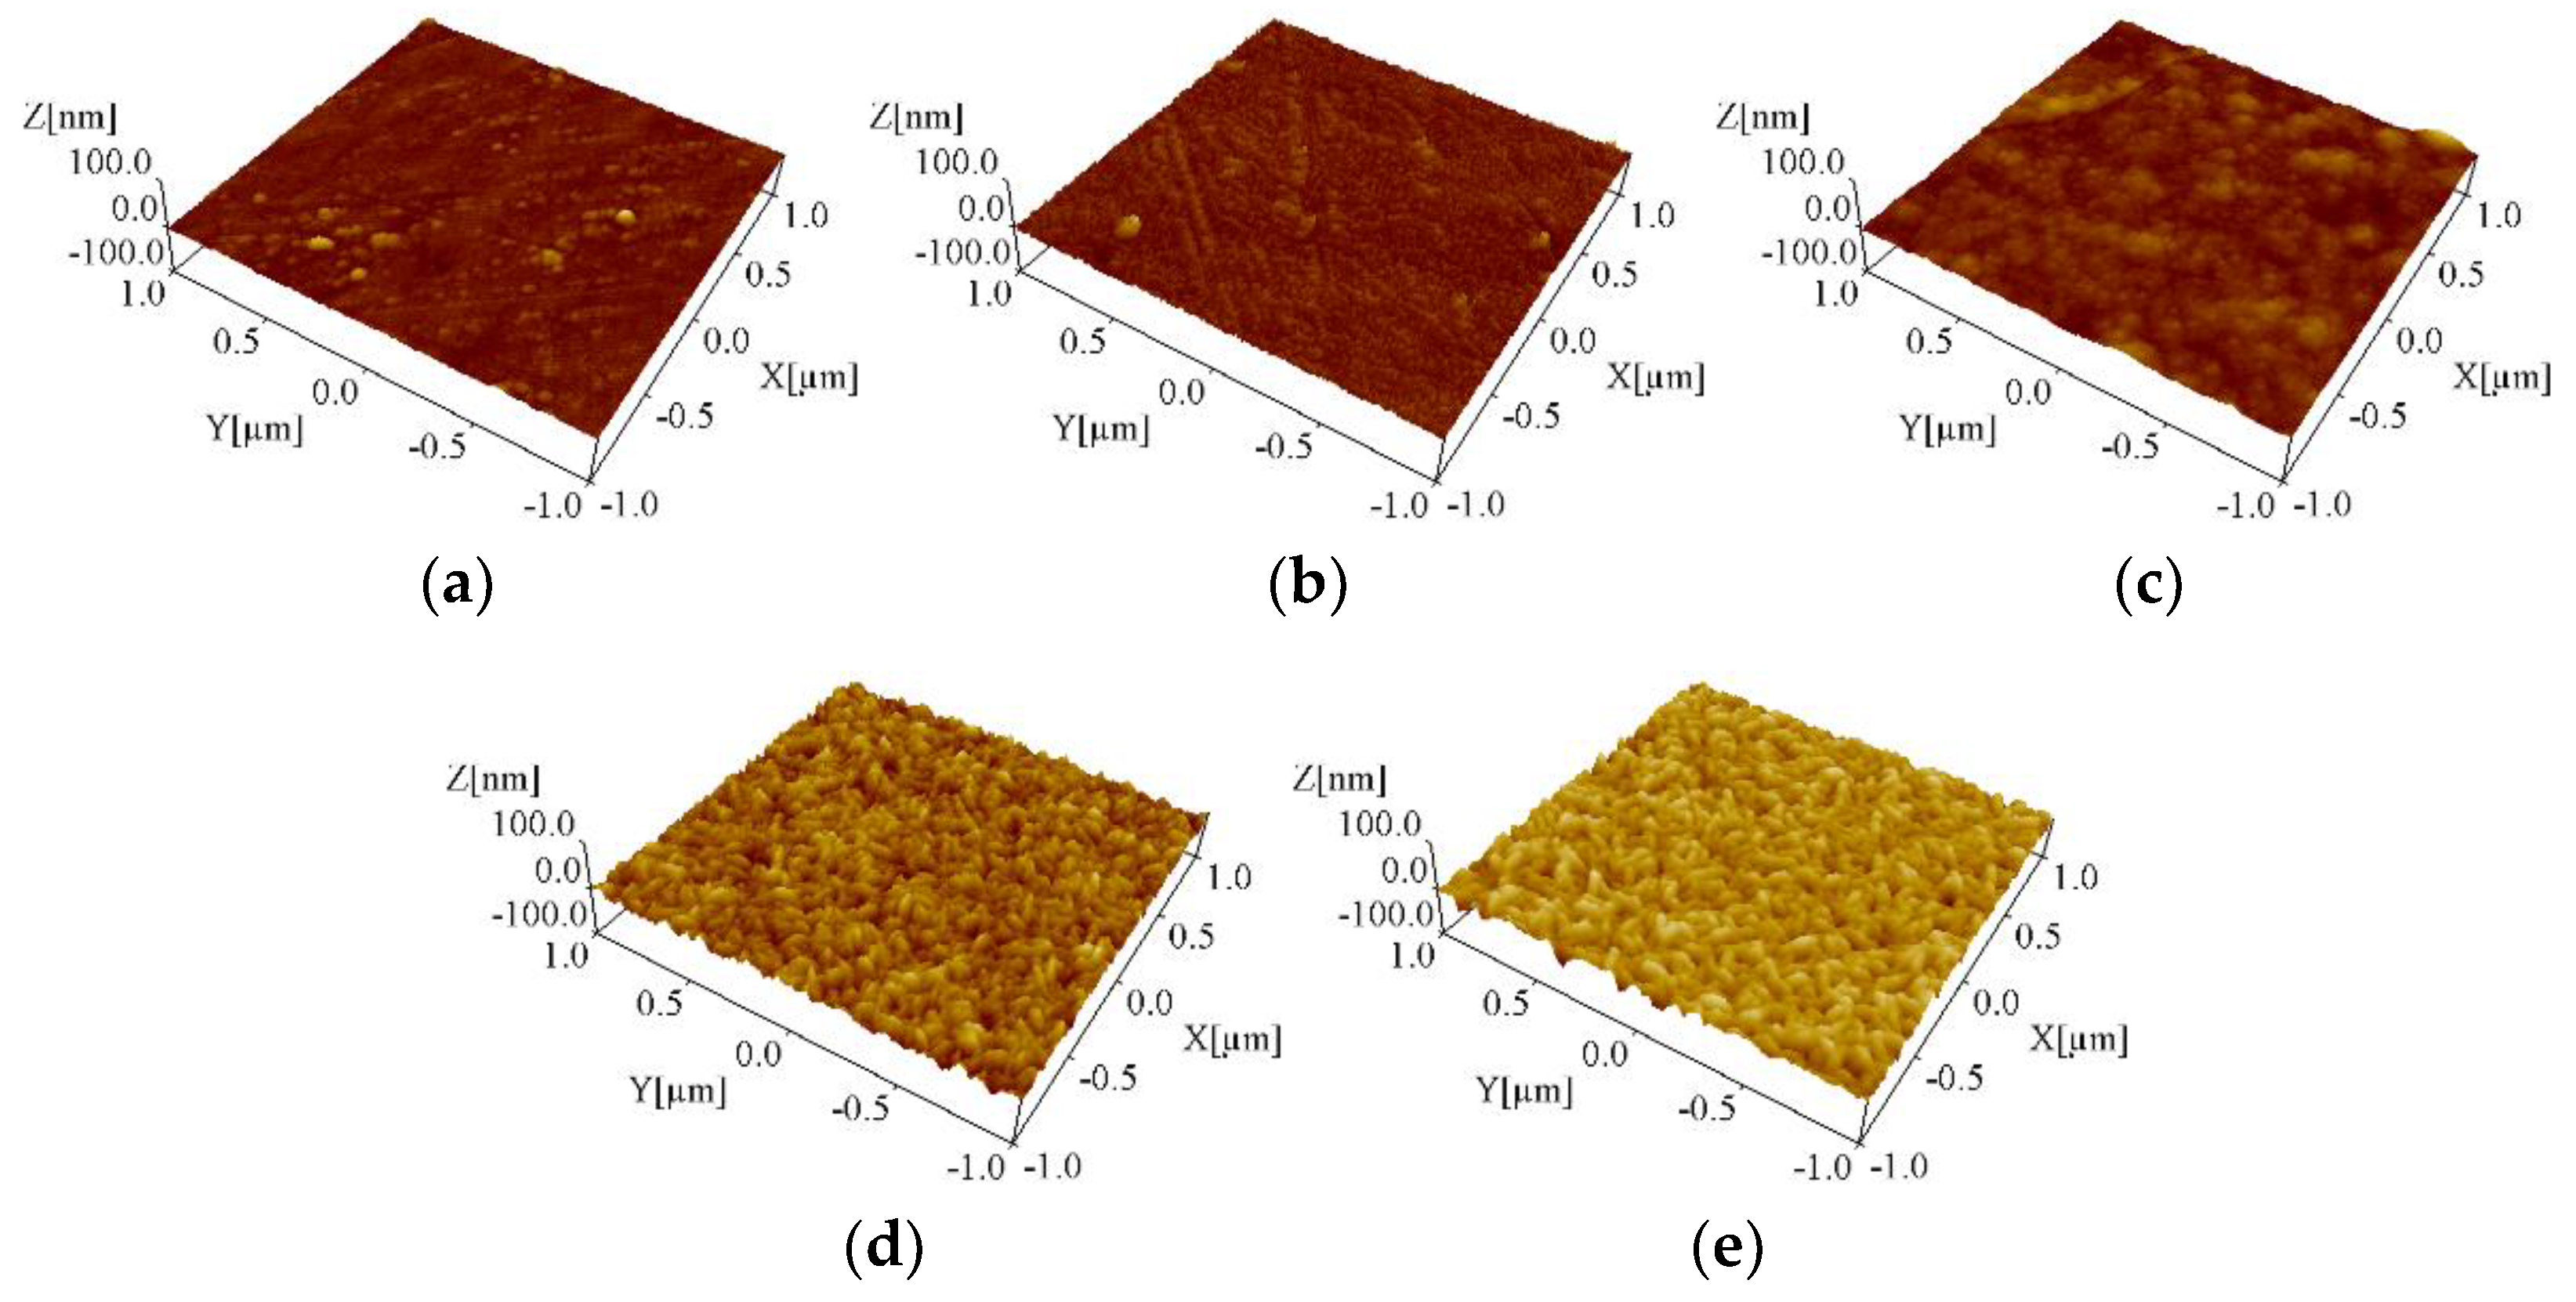
| Deposition Temperature (°C) | Surface Roughness (nm) |
|---|---|
| 200 | 1.45 |
| 250 | 3.26 |
| 300 | 2.86 |
| 350 | 6.56 |
| 400 | 6.18 |
© 2018 by the authors. Licensee MDPI, Basel, Switzerland. This article is an open access article distributed under the terms and conditions of the Creative Commons Attribution (CC BY) license (http://creativecommons.org/licenses/by/4.0/).
Share and Cite
Zhang, Q.; Li, C. Pure Anatase Phase Titanium Dioxide Films Prepared by Mist Chemical Vapor Deposition. Nanomaterials 2018, 8, 827. https://doi.org/10.3390/nano8100827
Zhang Q, Li C. Pure Anatase Phase Titanium Dioxide Films Prepared by Mist Chemical Vapor Deposition. Nanomaterials. 2018; 8(10):827. https://doi.org/10.3390/nano8100827
Chicago/Turabian StyleZhang, Qiang, and Chaoyang Li. 2018. "Pure Anatase Phase Titanium Dioxide Films Prepared by Mist Chemical Vapor Deposition" Nanomaterials 8, no. 10: 827. https://doi.org/10.3390/nano8100827
APA StyleZhang, Q., & Li, C. (2018). Pure Anatase Phase Titanium Dioxide Films Prepared by Mist Chemical Vapor Deposition. Nanomaterials, 8(10), 827. https://doi.org/10.3390/nano8100827