
Oriented Growth of α-MnO2 Nanorods Using Natural Extracts from Grape Stems and Apple Peels


Abstract
:
1. Introduction
2. Results and Discussion
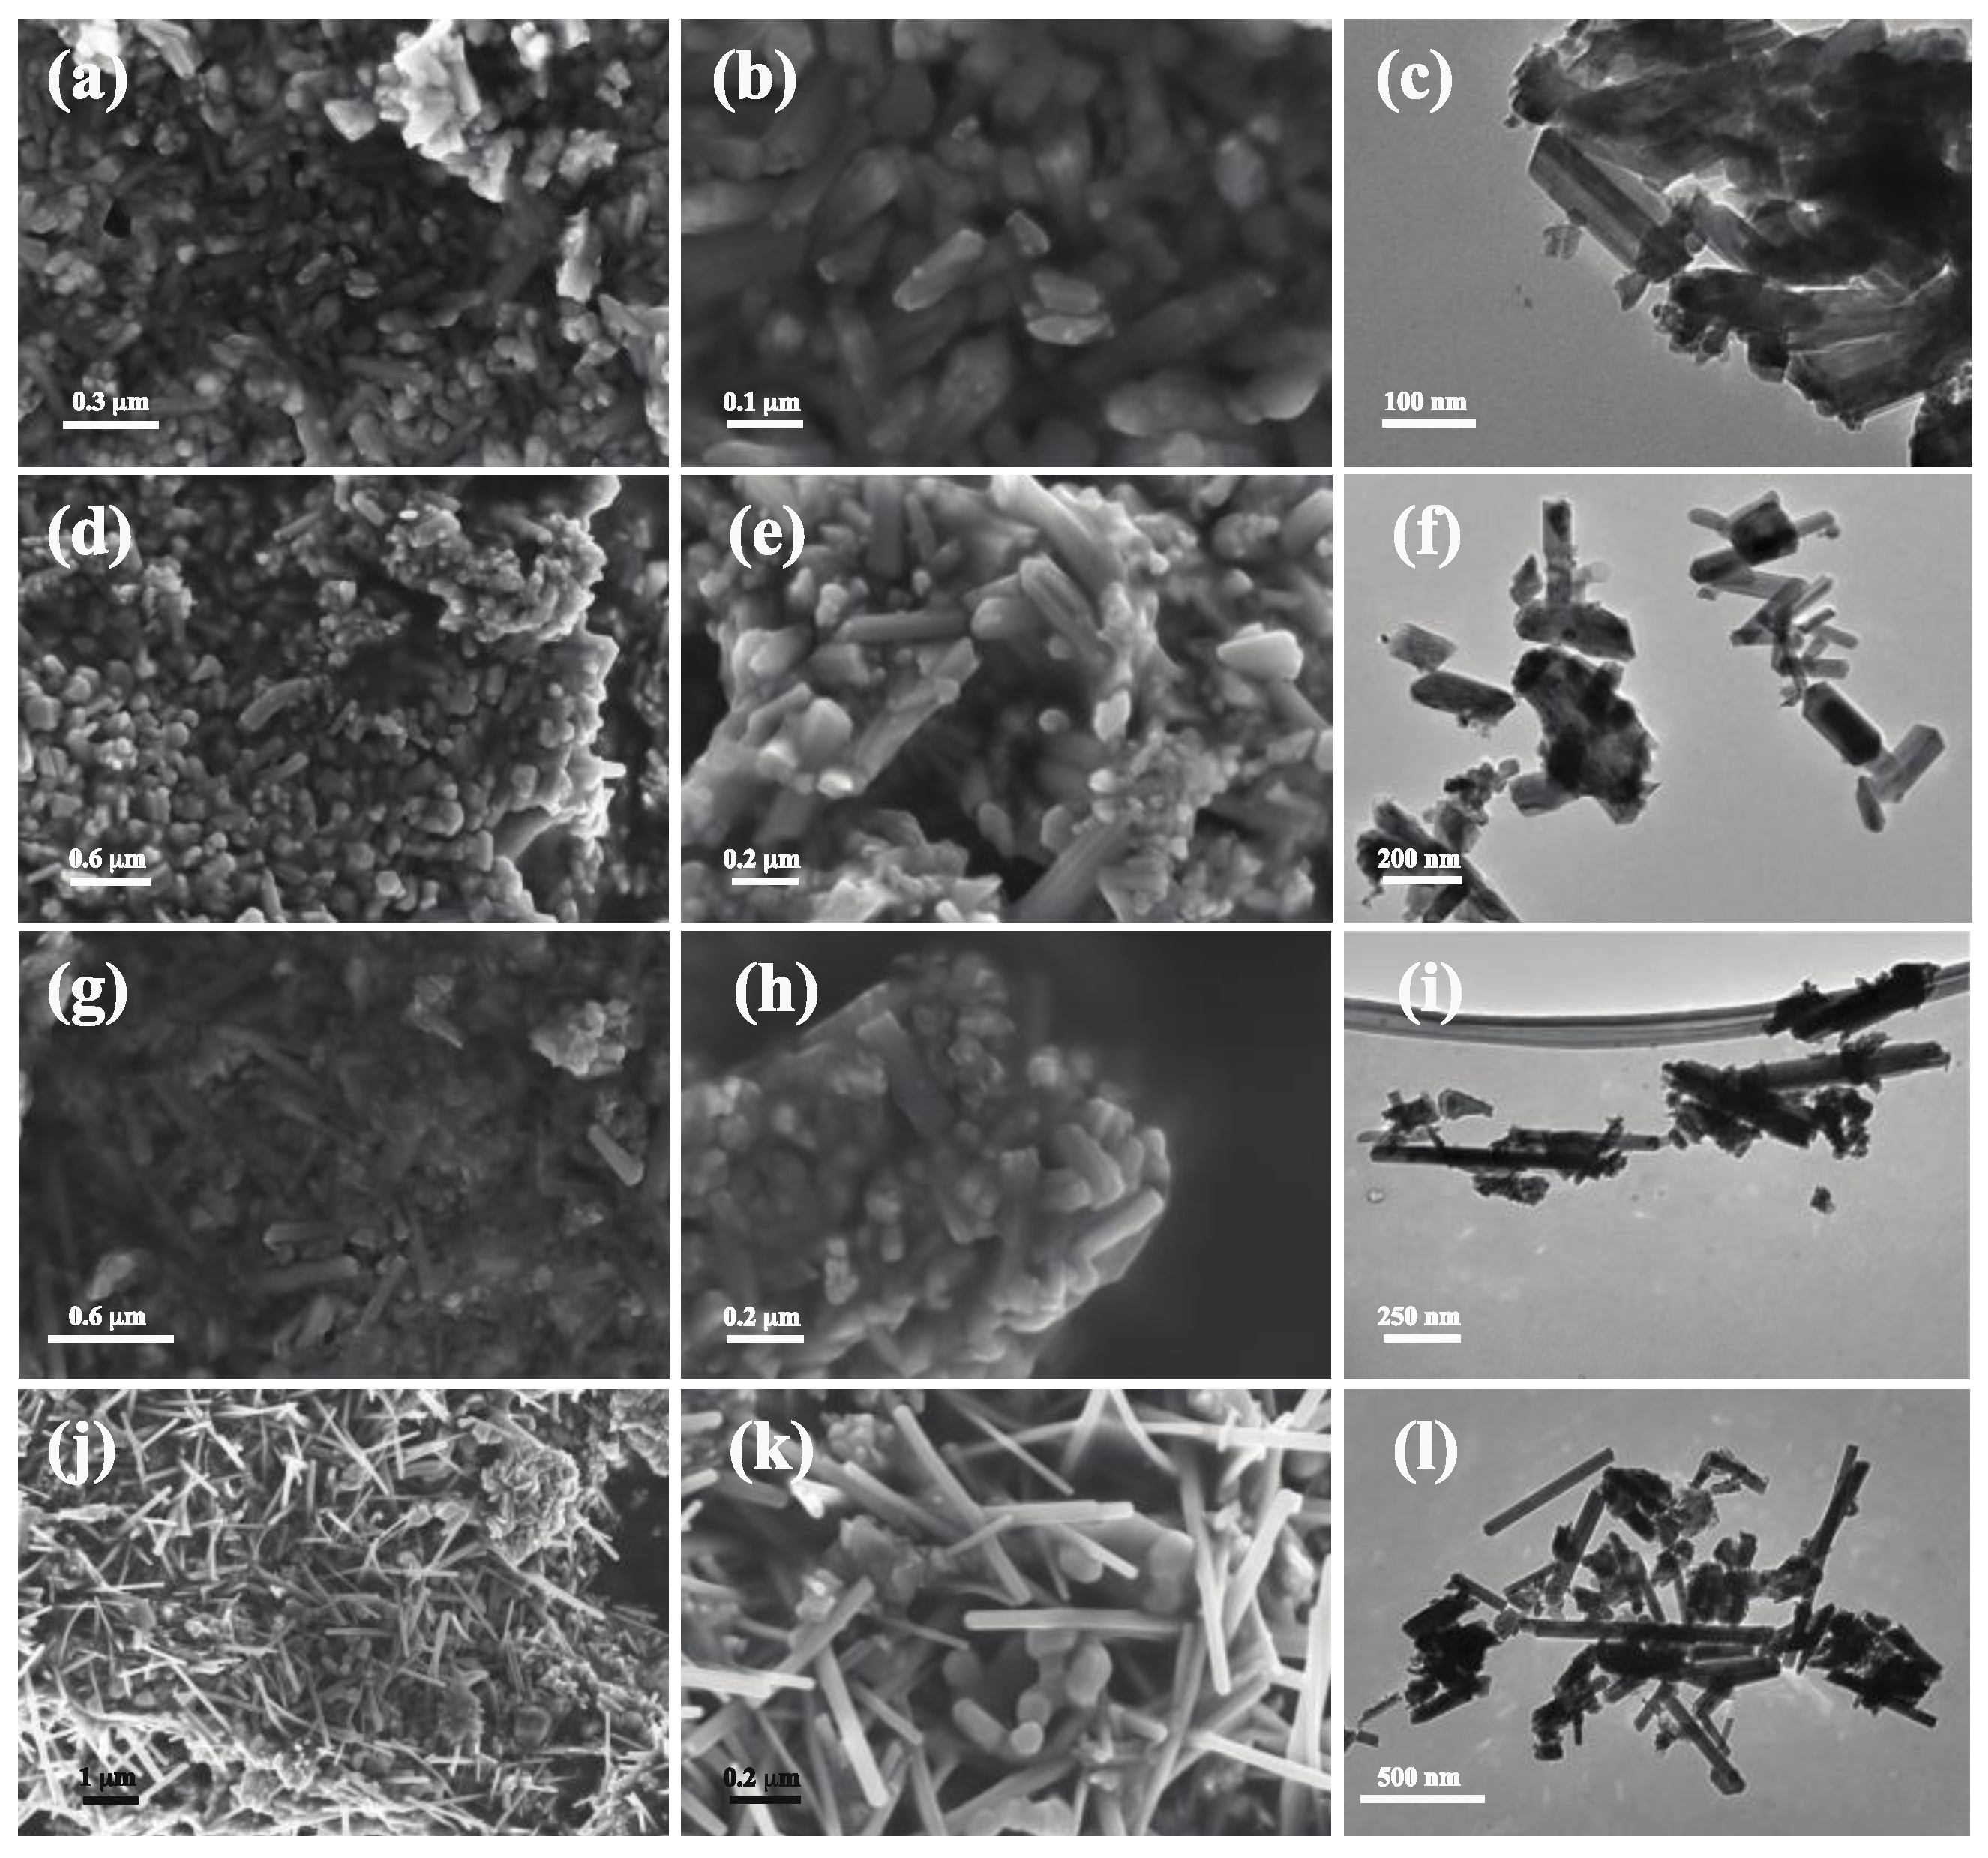
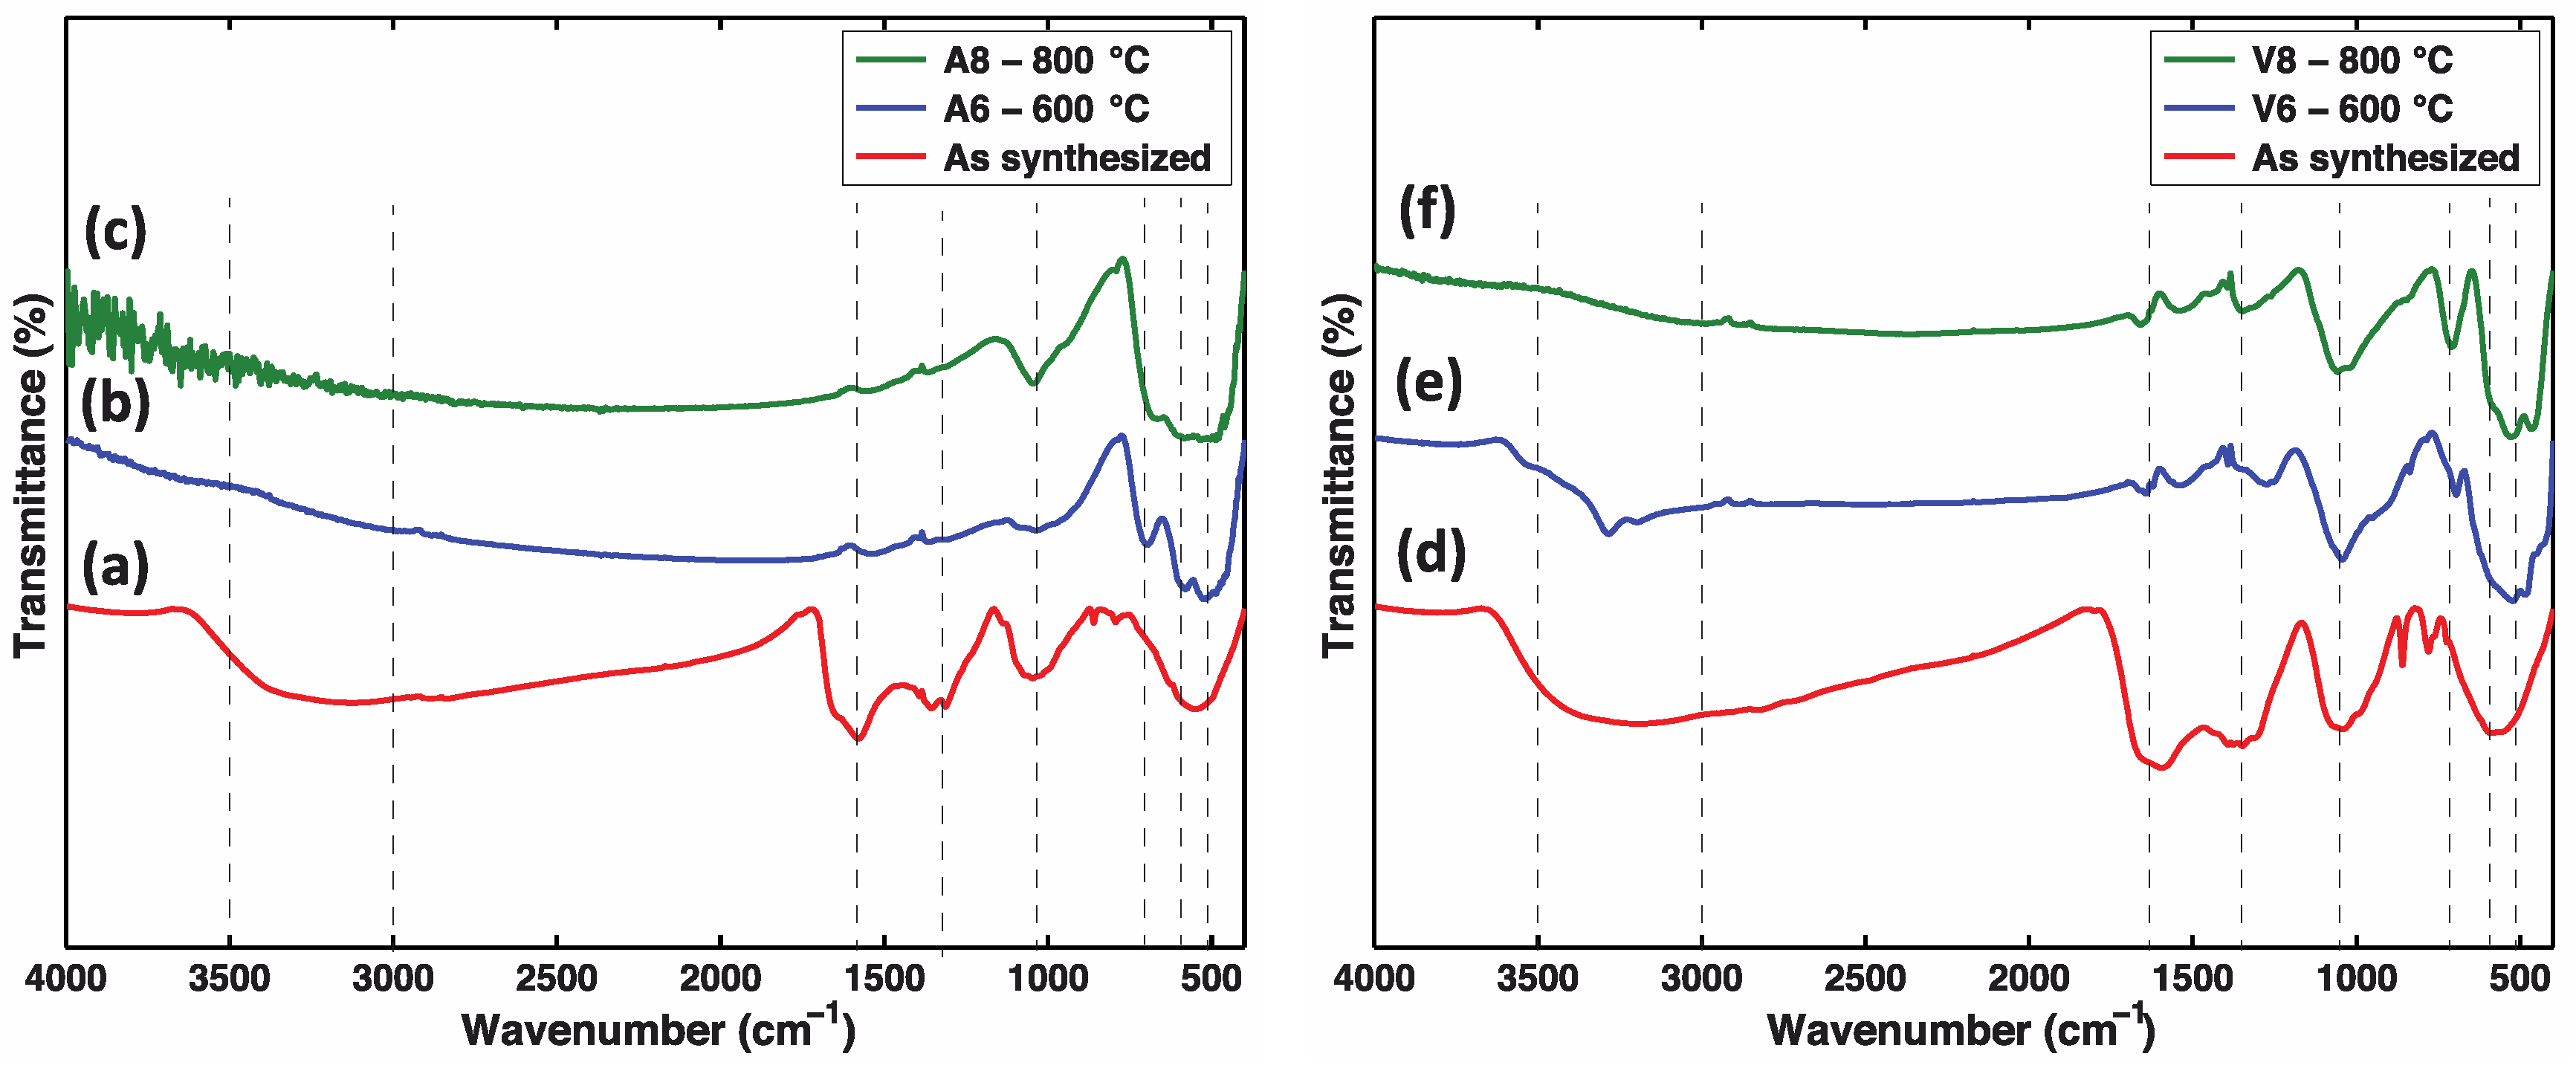
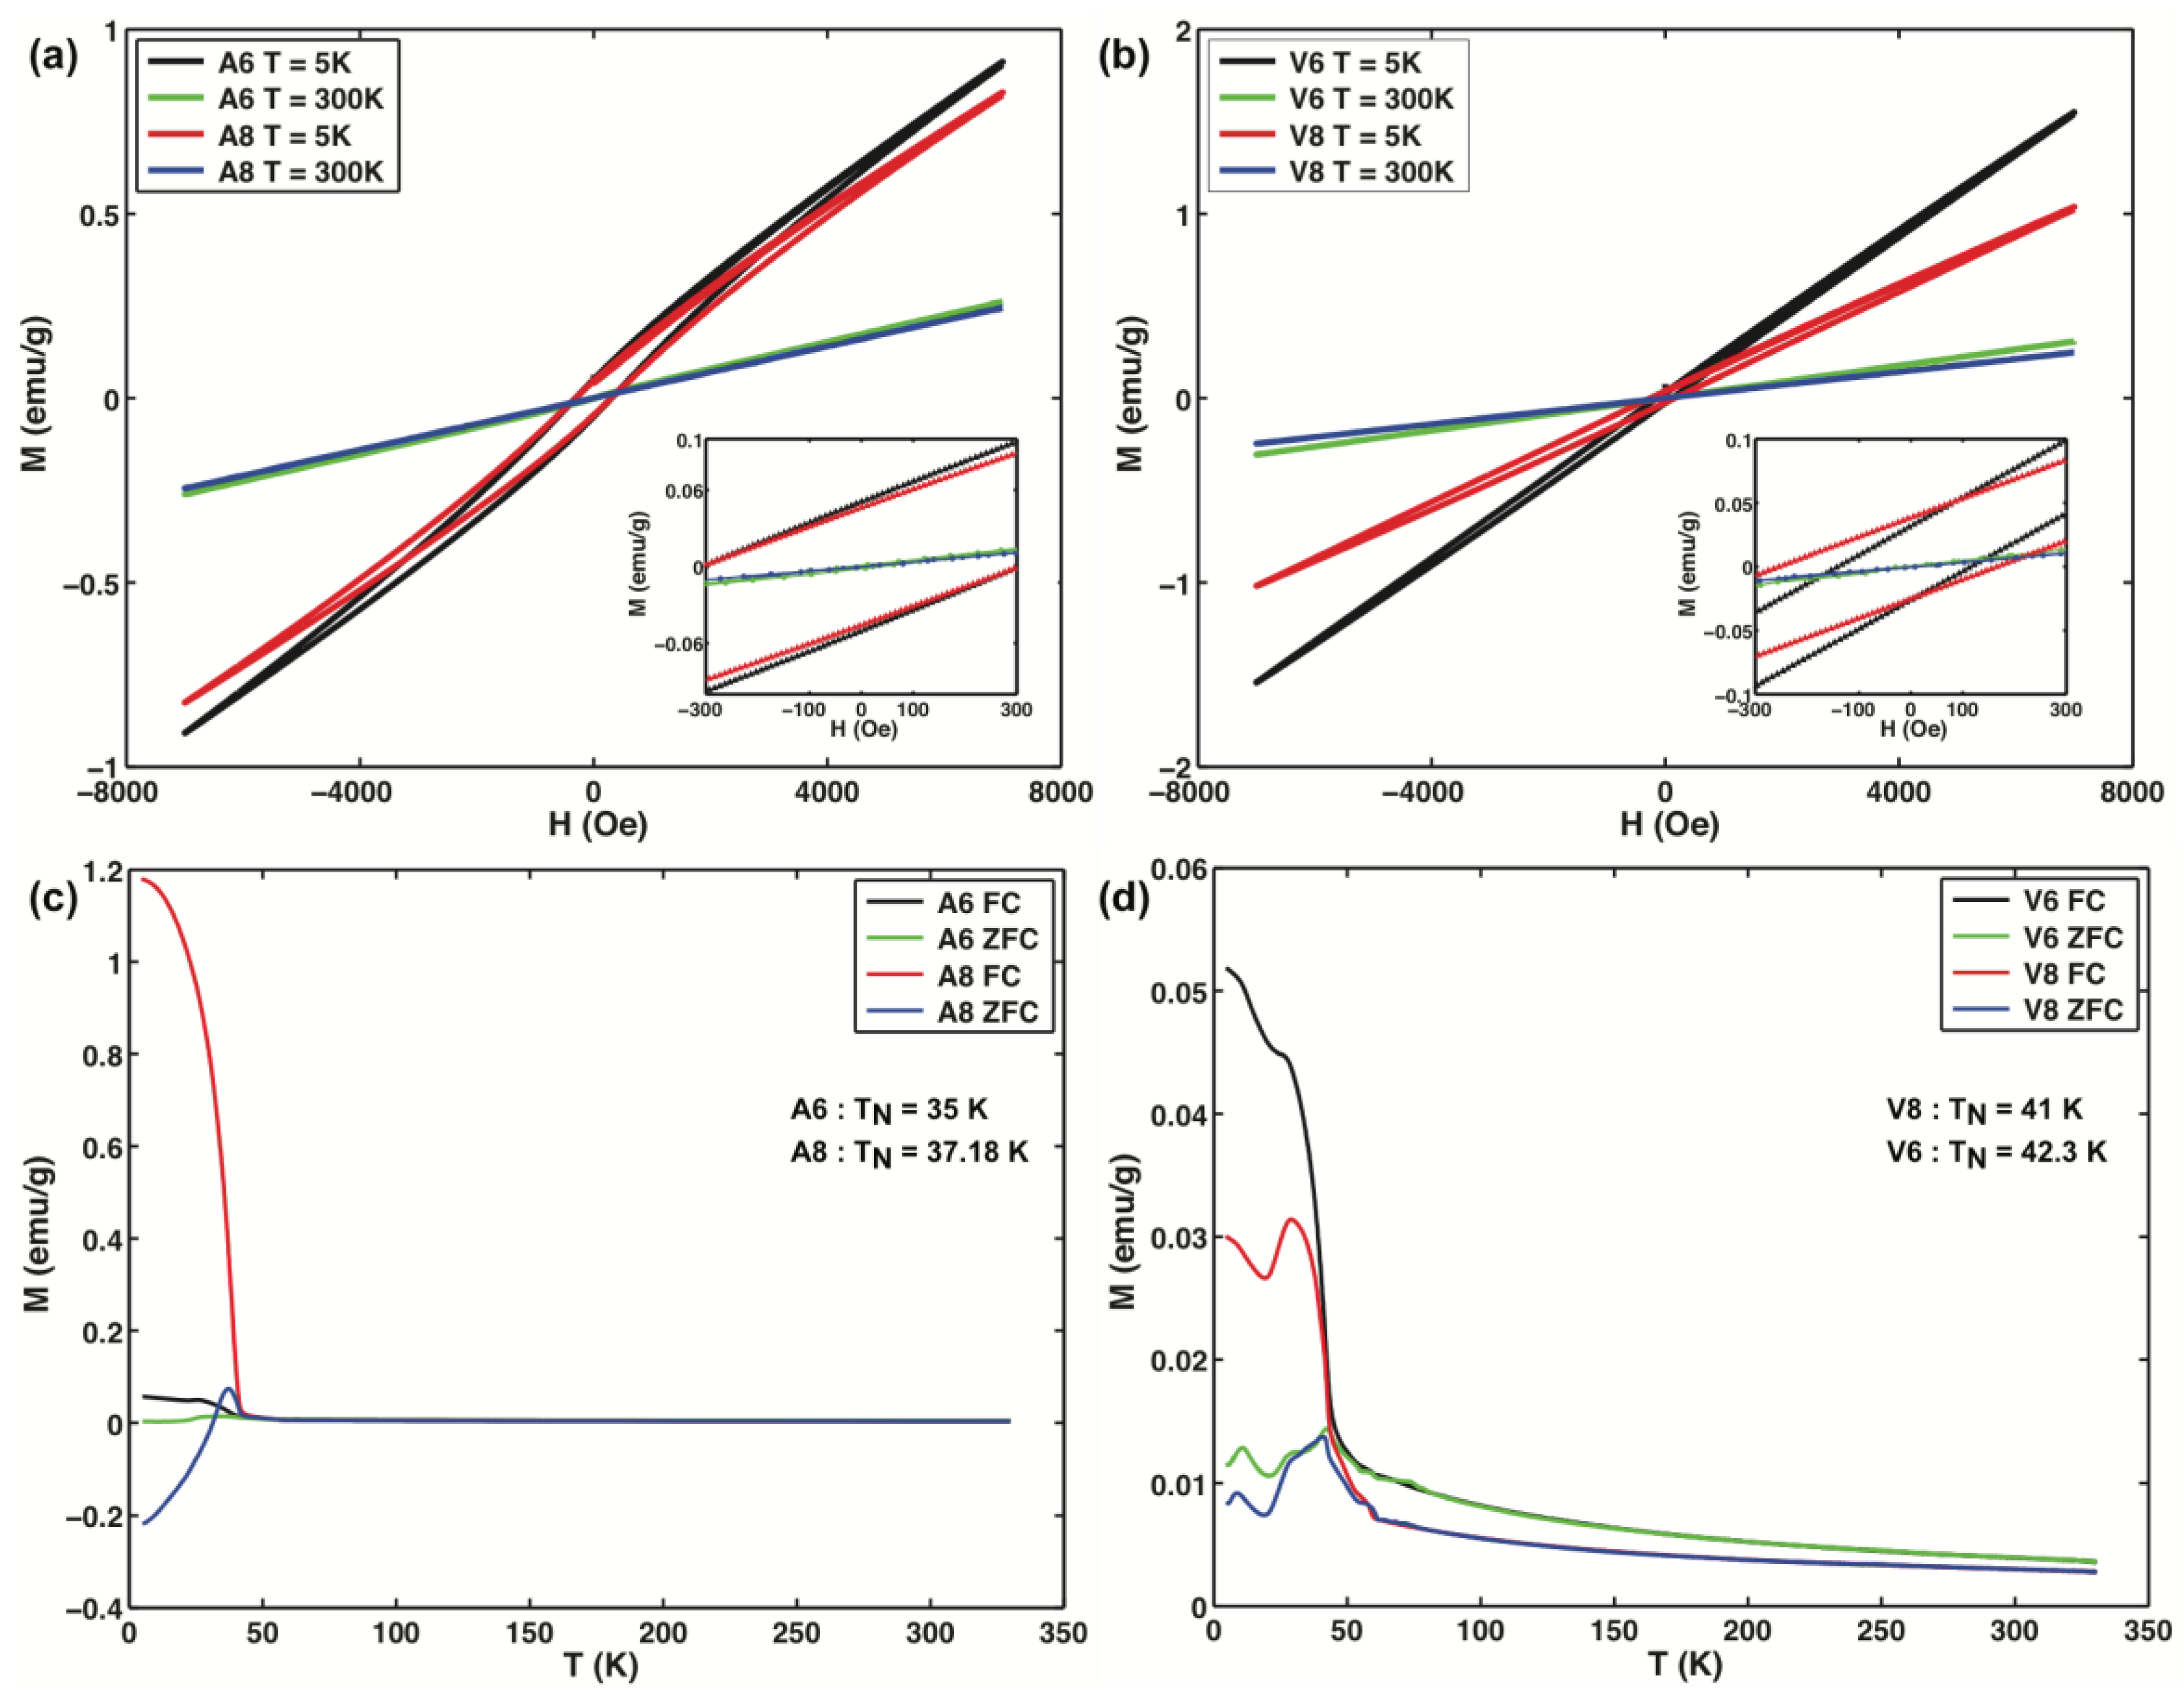
2.1. Materials Synthesis and Characterization
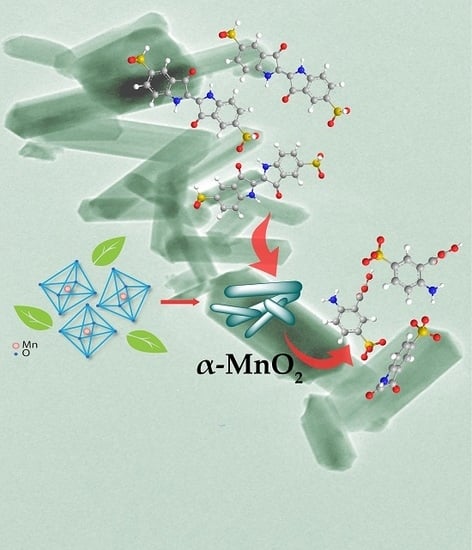
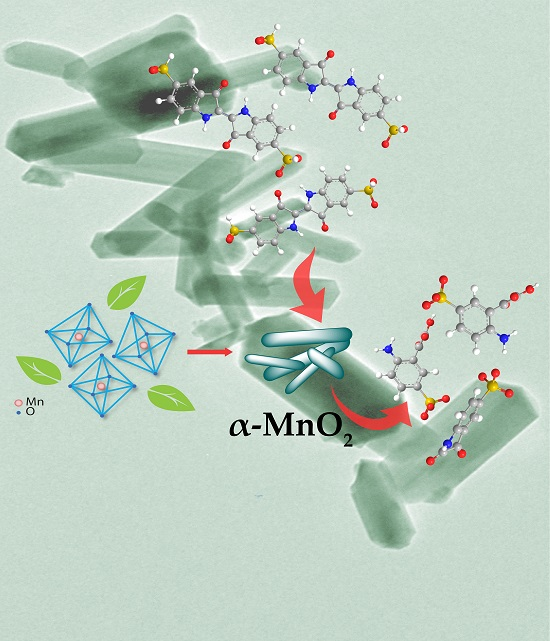
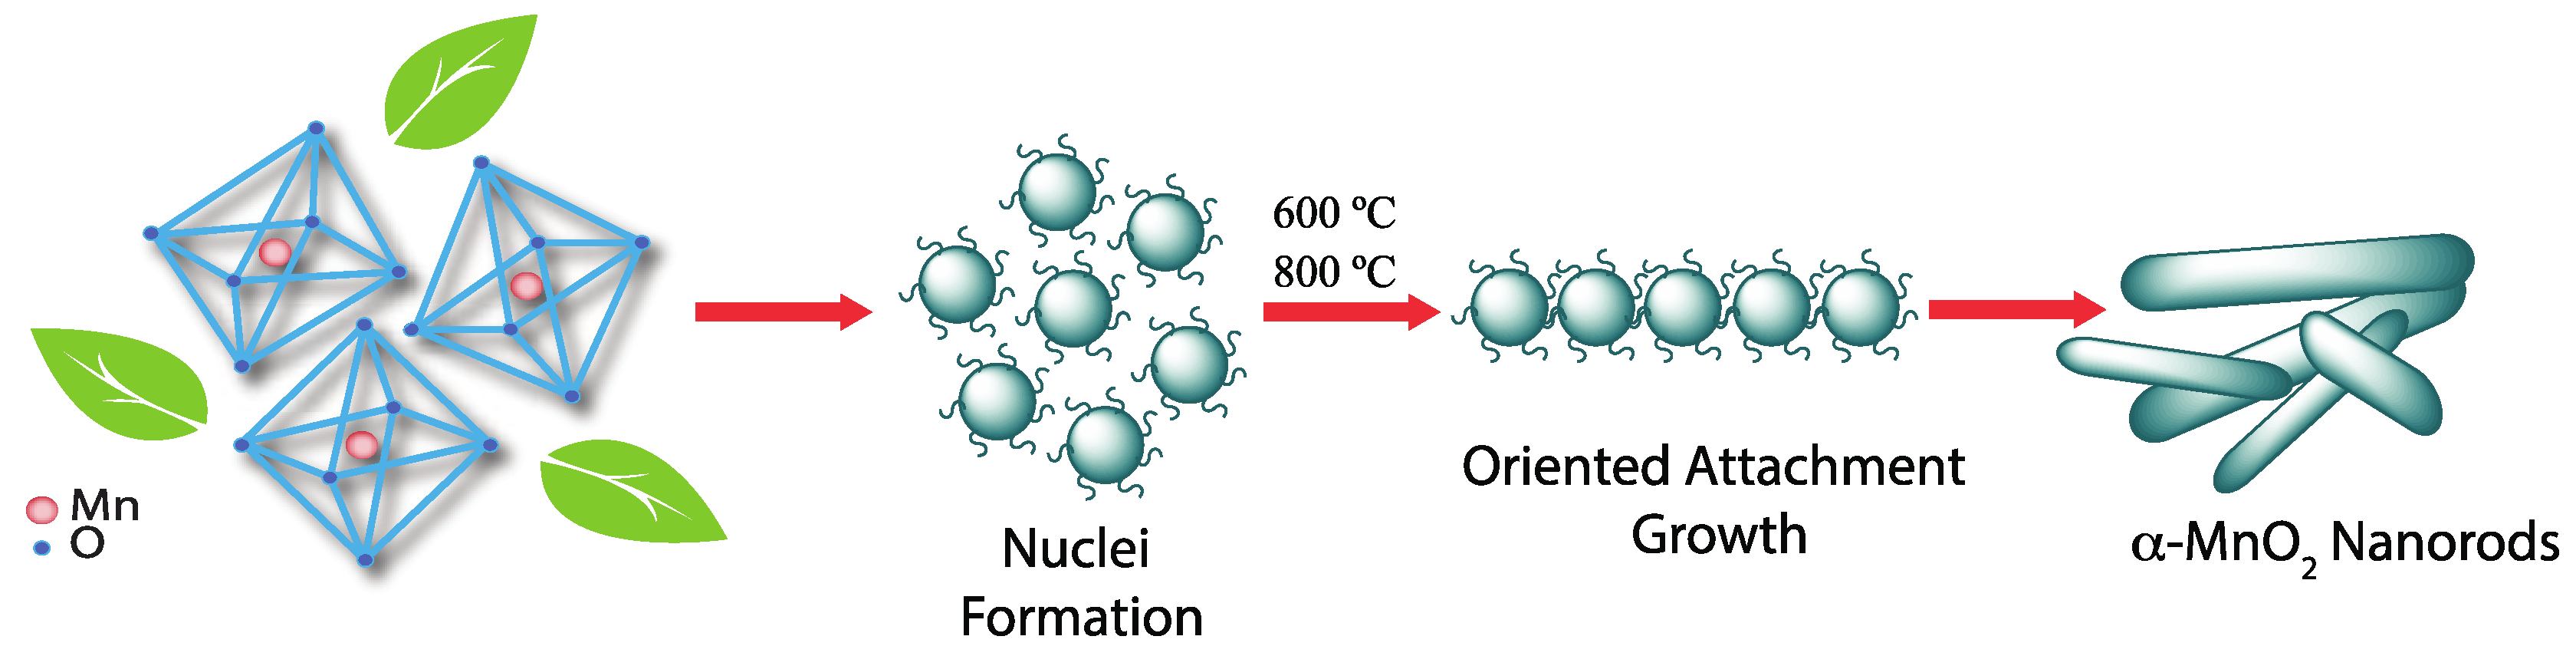
2.2. Proposed Growth Mechanism
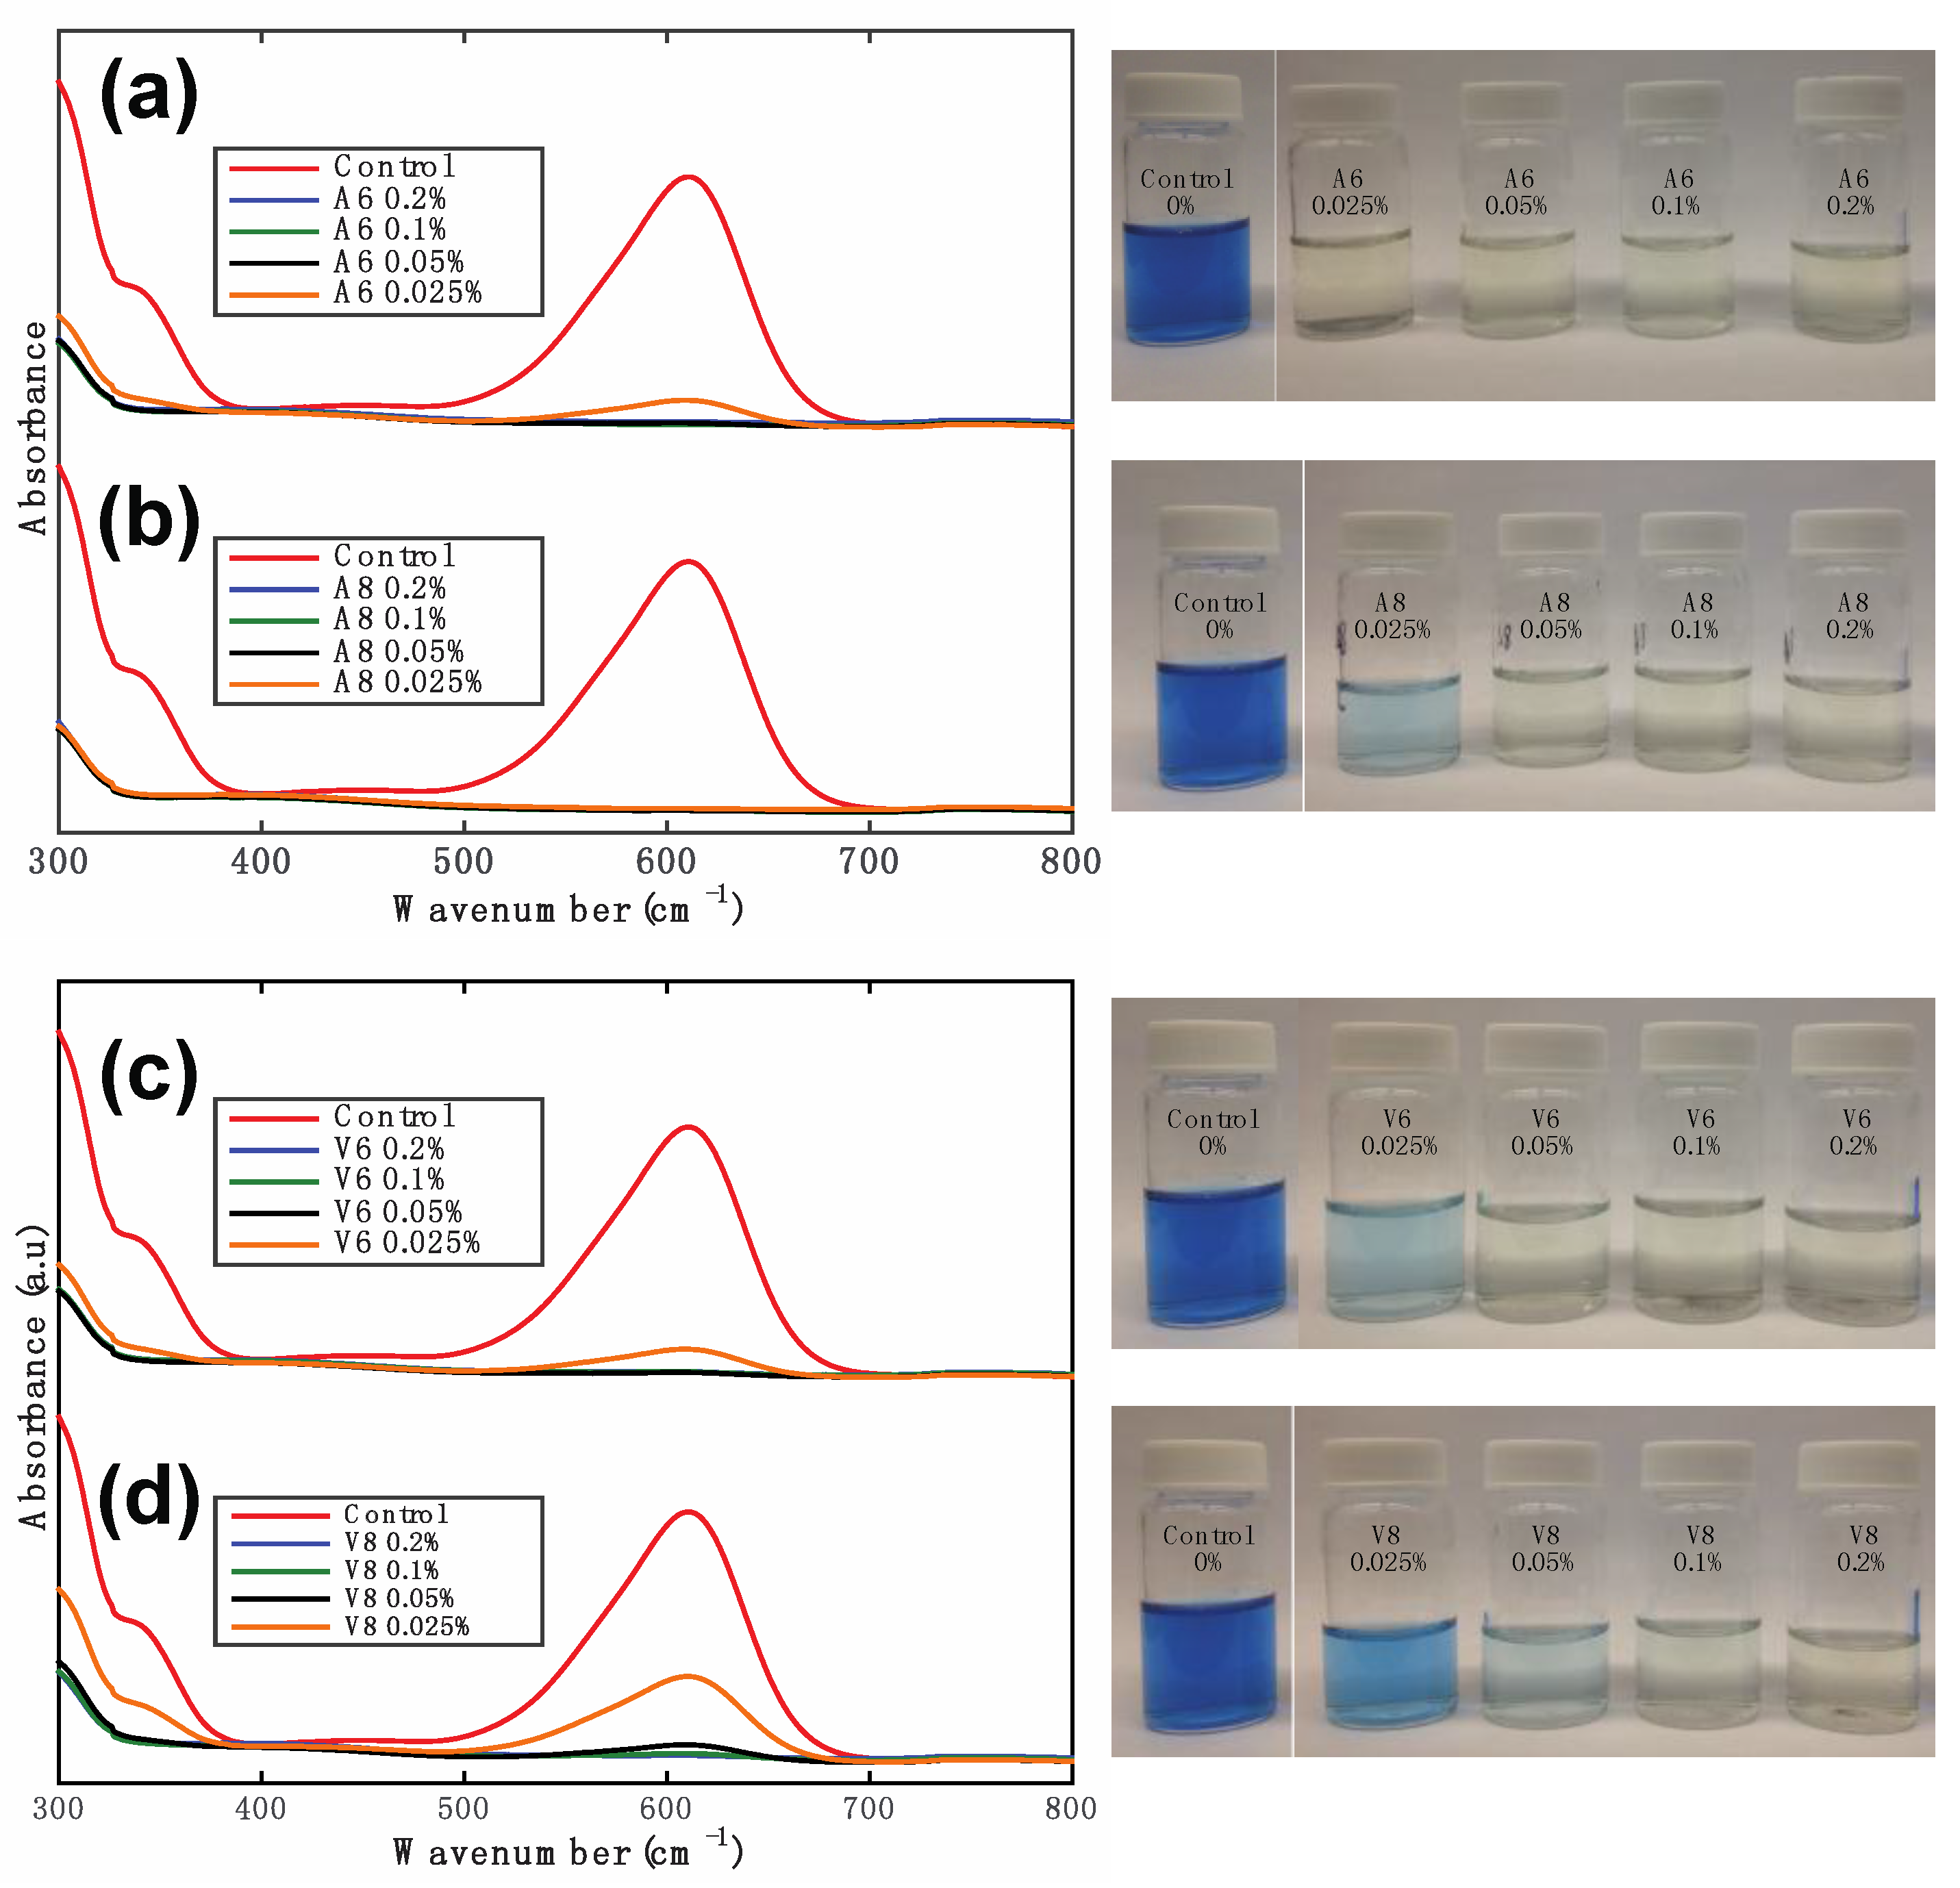
2.3. Assesing the Catalytic Activity of the Nanoparticles in Dye Degradation
3. Materials and Methods
3.1. Materials
3.2. Infusion Preparation
3.3. Nanoparticle Synthesis
3.4. Dye Degradation Experiments
3.5. Characterization
4. Conclusions
Supplementary Materials
Acknowledgments
Author Contributions
Conflicts of Interest
References
- Niu, W.; Xu, G. Crystallographic control of noble metal nanocrystals. Nano Today 2011, 6, 265–285. [Google Scholar] [CrossRef]
- Einarsrud, M.-A.; Grande, T. 1D oxide nanostructures from chemical solutions. Chem. Soc. Rev. 2014, 43, 2187–2199. [Google Scholar] [CrossRef] [PubMed]
- Guo, T.; Yao, M.-S.; Lin, Y.-H.; Nan, C.-W. A comprehensive review on synthesis methods for transition-metal oxide nanostructures. CrystEngComm 2015, 17, 3551–3585. [Google Scholar] [CrossRef]
- Xia, Y.; Xiong, Y.; Lim, B.; Skrabalak, S.E. Shape-controlled synthesis of metal nanocrystals: Simple chemistry meets complex physics? Angew. Chem. Int. Ed. 2009, 48, 60–103. [Google Scholar] [CrossRef] [PubMed]
- Zhang, Z.; Lu, M.; Xu, H.; Chin, W.-S. Shape-controlled synthesis of zinc oxide: A simple method for the preparation of metal oxide nanocrystals in non-aqueous medium. Chemistry 2007, 13, 632–638. [Google Scholar] [CrossRef] [PubMed]
- Kojtari, A.; Ji, H.-F. Metal Organic Framework Micro/Nanopillars of Cu(BTC)·3H2O and Zn(ADC)·DMSO. Nanomaterials 2015, 5, 565–576. [Google Scholar] [CrossRef] [PubMed]
- Xue, X.; Penn, R.L.; Leite, E.R.; Huang, F.; Lin, Z. Crystal growth by oriented attachment: Kinetic models and control factors. CrystEngComm 2014, 16, 1419–1429. [Google Scholar] [CrossRef]
- Welch, D.A.; Woehl, T.J.; Park, C.; Faller, R.; Evans, J.E.; Browning, N.D. Understanding the role of solvation forces on the preferential attachment of nanoparticles in liquid. ACS Nano 2016, 10, 181–187. [Google Scholar] [CrossRef] [PubMed]
- Sau, T.K.; Rogach, A.L. Nonspherical noble metal nanoparticles: Colloid-chemical synthesis and morphology control. Adv. Mater. 2010, 22, 1781–1804. [Google Scholar] [CrossRef] [PubMed]
- Tao, A.R.; Habas, S.; Yang, P. Shape control of colloidal metal nanocrystals. Small 2008, 4, 310–325. [Google Scholar] [CrossRef]
- Anastas, P.T.; Warner, J.C. Green Chemistry: Theory and Practice; Oxford University Press: New York, NY, USA, 1998. [Google Scholar]
- Virkutyte, J.; Varma, R.S. Environmentally friendly preparation of metal nanoparticles. RSC Green Chem. 2013, 19, 7–33. [Google Scholar]
- Bhau, B.S.; Ghosh, S.; Puri, S.; Borah, B.; Sarmah, D.K.; Khan, R. Green synthesis of gold nanoparticles from the leaf extract of Nepenthes khasiana and antimicrobial assay. Adv. Mater. Lett. 2015, 6, 55–58. [Google Scholar] [CrossRef]
- Vinod, V.T.P.; Saravanan, P.; Sreedhar, B.; Devi, D.K.; Sashidhar, R.B. A facile synthesis and characterization of Ag, Au and Pt nanoparticles using a natural hydrocolloid gum kondagogu (Cochlospermum gossypium). Colloids Surf. B Biointerfaces 2011, 83, 291–298. [Google Scholar] [CrossRef] [PubMed]
- Mandal, M.; Kundu, S.; Ghosh, S.K.; Panigrahi, S.; Sau, T.K.; Yusuf, S.M.; Pal, T. Magnetite nanoparticles with tunable gold or silver shell. J. Colloid Interface Sci. 2005, 286, 187–194. [Google Scholar] [CrossRef] [PubMed]
- Venkateswarlu, S.; Natesh Kumar, B.; Prathima, B.; Anitha, K.; Jyothi, N.V.V. A novel green synthesis of Fe3O4-Ag core shell recyclable nanoparticles using Vitis vinifera stem extract and its enhanced antibacterial performance. Phys. B Condens. Matter 2015, 457, 30–35. [Google Scholar] [CrossRef]
- Saif, S.; Tahir, A.; Chen, Y. Green synthesis of iron nanoparticles and their environmental applications and implications. Nanomaterials 2016, 6, 209. [Google Scholar] [CrossRef] [PubMed]
- Keihan, A.H.; Veisi, H.; Veasi, H. Green synthesis and characterization of spherical copper nanoparticles as organometallic antibacterial agent. Appl. Organomet. Chem. 2016, 1–7. [Google Scholar] [CrossRef]
- Saif, S.; Tahir, A.; Asim, T.; Chen, Y. Plant Mediated Green Synthesis of CuO Nanoparticles: Comparison of Toxicity of Engineered and Plant Mediated CuO Nanoparticles towards Daphnia magna. Nanomaterials 2016, 6, 205. [Google Scholar] [CrossRef] [PubMed]
- Veisi, H.; Rostami, A.; Shirinbayan, M. Greener approach for synthesis of monodispersed palladium nanoparticles using aqueous extract of green tea and their catalytic activity for the Suzuki-Miyaura coupling reaction and the reduction of nitroarenes. Appl. Organomet. Chem. 2016, 1–9. [Google Scholar] [CrossRef]
- Rajakumar, G.; Rahuman, A.A.; Chung, I.M.; Kirthi, A.V.; Marimuthu, S.; Anbarasan, K. Antiplasmodial activity of eco-friendly synthesized palladium nanoparticles using Eclipta prostrata extract against Plasmodium berghei in Swiss albino mice. Parasitol. Res. 2015, 114, 1397–1406. [Google Scholar] [CrossRef] [PubMed]
- Chung, I.; Rahuman, A.A.; Marimuthu, S.; Kirthi, A.V.; Anbarasan, K.; Rajakumar, G. An Investigation of the Cytotoxicity and Caspase-Mediated Apoptotic Effect of Green Synthesized Zinc Oxide Nanoparticles Using Eclipta prostrata on Human Liver Carcinoma Cells. Nanomaterials 2015, 5, 1317–1330. [Google Scholar] [CrossRef] [PubMed]
- Raveendran, P.; Fu, J.; Wallen, S.L. Completely “Green” Synthesis and Stabilization of Metal Nanoparticles. J. Am. Chem. Soc. 2003, 125, 13940–13941. [Google Scholar] [CrossRef] [PubMed]
- Ahmed, S.; Ahmad, M.; Swami, B.L.; Ikram, S. A review on plants extract mediated synthesis of silver nanoparticles for antimicrobial applications: A green expertise. J. Adv. Res. 2016, 7, 17–28. [Google Scholar] [CrossRef] [PubMed]
- Gopinath, V.; MubarakAli, D.; Priyadarshini, S.; Priyadharsshini, N.M.; Thajuddin, N.; Velusamy, P. Biosynthesis of silver nanoparticles from Tribulus terrestris and its antimicrobial activity: A novel biological approach. Colloids Surf. B Biointerfaces 2012, 96, 69–74. [Google Scholar] [CrossRef] [PubMed]
- Venkatesan, J.; Kim, S.-K.; Shim, M. Antimicrobial, Antioxidant, and Anticancer Activities of Biosynthesized Silver Nanoparticles Using Marine Algae Ecklonia cava. Nanomaterials 2016, 6, 235. [Google Scholar] [CrossRef] [PubMed]
- Xia, Q.; Ma, Y.; Wang, J. Biosynthesis of Silver Nanoparticles Using Taxus yunnanensis Callus and Their Antibacterial Activity and Cytotoxicity in Human Cancer Cells. Nanomaterials 2016, 6, 160. [Google Scholar] [CrossRef] [PubMed]
- Yan, D.; Zhang, H.; Chen, L.; Zhu, G.; Wang, Z.; Xu, H.; Yu, A. Supercapacitive properties of Mn3O4 nanoparticles bio-synthesized from banana peel extract. RSC Adv. 2014, 1, 23649–23652. [Google Scholar] [CrossRef]
- Sinha, A.; Singh, V.N.; Mehta, B.R.; Khare, S.K. Synthesis and characterization of monodispersed orthorhombic manganese oxide nanoparticles produced by Bacillus sp. cells simultaneous to its bioremediation. J. Hazard. Mater. 2011, 192, 620–627. [Google Scholar] [CrossRef] [PubMed]
- Sharma, J.K.; Srivastava, P.; Ameen, S.; Akhtar, M.S.; Singh, G. Azadirachta indica plant-assisted green synthesis of Mn3O4 nanoparticles: Excellent thermal catalytic performance and chemical sensing behavior. J. Colloid Interface Sci. 2016, 472, 220–228. [Google Scholar] [CrossRef] [PubMed]
- Stoerzinger, K.A.; Risch, M.; Han, B.; Shao-Horn, Y. Recent Insights into Manganese Oxides in Catalyzing Oxygen Reduction Kinetics. ACS Catal. 2015, 5, 6021–6031. [Google Scholar] [CrossRef]
- Tang, N.; Tian, X.; Yang, C.; Pi, Z.; Han, Q. Facile synthesis of α-MnO2 nanorods for high-performance alkaline batteries. J. Phys. Chem. Solids 2010, 71, 258–262. [Google Scholar] [CrossRef]
- Qu, Q.; Zhang, P.; Wang, B.; Chen, Y.; Tian, S.; Wu, Y.; Holze, R. Electrochemical performance of MnO2 nanorods in neutral aqueous electrolytes as a cathode for asymmetric supercapacitors. J. Phys. Chem. C 2009, 113, 14020–14027. [Google Scholar] [CrossRef]
- Tompsett, D.A.; Parker, S.C.; Islam, M.S. Surface properties of α-MnO2: Relevance to catalytic and supercapacitor behaviour. J. Mater. Chem. A 2014, 2, 15509. [Google Scholar] [CrossRef]
- Li, W.; Cui, X.; Zeng, R.; Du, G.; Sun, Z.; Zheng, R.; Ringer, S.P.; Dou, S.X. Performance modulation of α-MnO2 nanowires by crystal facet engineering. Sci. Rep. 2015, 5, 8987. [Google Scholar] [CrossRef] [PubMed]
- Jaganyi, D.; Altaf, M.; Wekesa, I. Synthesis and characterization of whisker-shaped MnO2 nanostructure at room temperature. Appl. Nanosci. 2013, 3, 329–333. [Google Scholar] [CrossRef]
- Tang, B.; Wang, G.; Zhuo, L.; Ge, J. Novel dandelion-like beta-manganese dioxide microstructures and their magnetic properties. Nanotechnology 2006, 17, 947–951. [Google Scholar] [CrossRef] [PubMed]
- Chacón-Patiño, M.L.; Blanco-Tirado, C.; Hinestroza, J.P.; Combariza, M.Y. Biocomposite of nanostructured MnO2 and fique fibers for efficient dye degradation. Green Chem. 2013, 15, 2920. [Google Scholar] [CrossRef]
- Clarke, C.E.; Kielar, F.; Talbot, H.M.; Johnson, K.L. Oxidative decolorization of acid azo dyes by a mn oxide containing waste. Environ. Sci. Technol. 2010, 44, 1116–1122. [Google Scholar] [CrossRef] [PubMed]
- Duan, L.; Sun, B.; Wei, M.; Luo, S.; Pan, F.; Xu, A.; Li, X. Catalytic degradation of Acid Orange 7 by manganese oxide octahedral molecular sieves with peroxymonosulfate under visible light irradiation. J. Hazard. Mater. 2015, 285, 356–365. [Google Scholar] [CrossRef] [PubMed]
- Dang, T.; Cheney, M.A.; Qian, S.; Joo, S.W.; Min, B. A Novel Rapid One-Step Synthesis of Manganese Oxide Nanoparticles at Room Temperature Using Poly (dimethylsiloxane). Ind. Eng. Chem. Res. 2013, 52, 2750–2753. [Google Scholar] [CrossRef]
- Najafpour, M.M.; Renger, G.; Hołyńska, M.; Moghaddam, A.N.; Aro, E.M.; Carpentier, R.; Nishihara, H.; Eaton-Rye, J.J.; Shen, J.R.; Allakhverdiev, S.I. Manganese Compounds as Water-Oxidizing Catalysts: From the Natural Water-Oxidizing Complex to Nanosized Manganese Oxide Structures. Chem. Rev. 2016, 116, 2886–2936. [Google Scholar] [CrossRef] [PubMed]
- Fei, J.; Cui, Y.; Yan, X.; Qi, W.; Yang, Y.; Wang, K.; He, Q.; Li, J. Controlled preparation of MnO2 hierarchical hollow nanostructures and their application in water treatment. Adv. Mater. 2008, 20, 452–456. [Google Scholar] [CrossRef]
- Xiao, W.; Wang, D.; Lou, X.W. Shape-Controlled Synthesis of MnO2 Nanostructures with Enhanced Electrocatalytic Activity for Oxygen Reduction. J. Phys. Chem. C 2010, 114, 1694–1700. [Google Scholar] [CrossRef]
- Wang, X.; Li, Y. Selected-Control Hydrothermal Synthesis of α- and β-MnO2 Single Crystal Nanowires. J. Am. Chem. Soc. 2002, 124, 2880–2881. [Google Scholar] [CrossRef] [PubMed]
- He, X.; Wang, J.; Kloepsch, R.; Krueger, S.; Jia, H.; Liu, H.; Vortmann, B.; Li, J. Enhanced electrochemical performance in lithium ion batteries of a hollow spherical lithium-rich cathode material synthesized by a molten salt method. Nano Res. 2014, 7, 110–118. [Google Scholar] [CrossRef]
- Wang, N.; Cao, X.; Lin, G.; Shihe, Y. λ-MnO2 Nanodisks and Their Magnetic Properties. Nanotechnology 2007, 18, 475605. [Google Scholar] [CrossRef]
- Kim, H.J.; Lee, J.B.; Kim, Y.-M.; Jung, M.-H.; Jagličić, Z.; Umek, P.; Dolinšek, J. Synthesis, structure and magnetic properties of β-MnO2 nanorods. Nanoscale Res. Lett. 2007, 2, 81–86. [Google Scholar] [CrossRef]
- Tseng, L.-T.; Lu, Y.; Fan, H.M.; Wang, Y.; Luo, X.; Liu, T.; Munroe, P.; Li, S.; Yi, J. Magnetic properties in α-MnO2 doped with alkaline elements. Sci. Rep. 2015, 5, 1–8. [Google Scholar] [CrossRef] [PubMed]
- Shafi, P.M.; Bose, A.C. Structural evolution of tetragonal MnO2 and its electrochemical behavior. AIP Conf. Proc. 2016, 1731, 2–5. [Google Scholar]
- Wu, Y.; Lu, Y.; Song, C.; Ma, Z.; Xing, S.; Gao, Y. A novel redox-precipitation method for the preparation of α-MnO2 with a high surface Mn4+ concentration and its activity toward complete catalytic oxidation of o-xylene. Catal. Today 2013, 201, 32–39. [Google Scholar] [CrossRef]
- Wu, Y.; Li, S.; Cao, Y.; Xing, S.; Ma, Z.; Gao, Y. Facile synthesis of mesoporous α-MnO2 nanorod with three-dimensional frameworks and its enhanced catalytic activity for VOCs removal. Mater. Lett. 2013, 97, 1–3. [Google Scholar] [CrossRef]
- Wang, H.; Lu, Z.; Qian, D.; Li, Y.; Zhang, W. Single-crystal α-MnO2 nanorods: Synthesis and electrochemical properties. Nanotechnology 2007, 18, 115616. [Google Scholar] [CrossRef]
- Momma, K.; Izumi, F. VESTA 3 for three-dimensional visualization of crystal, volumetric and morphology data. J. Appl. Crystallogr. 2011, 44, 1272–1276. [Google Scholar] [CrossRef]
- Sun, M.; Lan, B.; Lin, T.; Cheng, G.; Ye, F.; Yu, L.; Cheng, X.; Zheng, X. Controlled synthesis of nanostructured manganese oxide: crystalline evolution and catalytic activities. CrystEngComm 2013, 15, 7010. [Google Scholar] [CrossRef]
- Post, J.E. Manganese oxide minerals: Crystal structures and economic and environmental significance. Proc. Natl. Acad. Sci. USA 1999, 96, 3447–3454. [Google Scholar] [CrossRef] [PubMed]
- Cheng, S.; Yang, L.; Chen, D.; Ji, X.; Jiang, Z.-J.; Ding, D.; Liu, M. Phase evolution of an alpha MnO2-based electrode for pseudo-capacitors probed by in operando Raman spectroscopy. Nano Energy 2014, 9, 161–167. [Google Scholar] [CrossRef]
- Stuart, B.H. Infrared Spectroscopy: Fundamentals and Applications; John Wiley and Sons: Hoboken, NJ, USA, 2004. [Google Scholar]
- Chertihin, G.V.; Andrews, L. Reactions of Laser-Ablated Manganese Atoms with Dioxygen. Infrared Spectra of MnO, OMnO, Mn(O)2, (MnO)2, and Higher Oxide Complexes in Solid Argon. J. Phys. Chem. A 1997, 101, 8547–8553. [Google Scholar] [CrossRef]
- Di Castro, V.; Polzonetti, G. XPS study of MnO oxidation. J. Electron Spectros. Relat. Phenom. 1989, 48, 117–123. [Google Scholar] [CrossRef]
- Nesbitt, H.W.; Banerjee, D. Interpretation of XPS Mn(2P) spectra of Mn oxyhydroxides and constraints on the mechanism of MnO2 precipitation. Am. Mineral. 1998, 83, 305–315. [Google Scholar] [CrossRef]
- Biesinger, M.C.; Payne, B.P.; Grosvenor, A.P.; Lau, L.W.M.; Gerson, A.R.; Smart, R.S.C. Resolving surface chemical states in XPS analysis of first row transition metals, oxides and hydroxides: Cr, Mn, Fe, Co and Ni. Appl. Surf. Sci. 2011, 257, 2717–2730. [Google Scholar] [CrossRef]
- Naumkin, A.V.; Kraut-Vass, A.; Gaarenstroom, S.W.; Powell, C.J. NIST X-ray Photoelectron Spectroscopy Database. Available online: http://srdata.nist.gov/xps/Default.aspx (accessed on July 2016).
- Gupta, R.P.; Sen, S.K. Calculation of multiplet structure of core p-vacancy levels. Phys. Rev. B 1974, 10, 71–79. [Google Scholar] [CrossRef]
- Foord, J.S.; Jackman, R.B.; Allen, G.C. An X-ray photoelectron spectroscopic investigation of the oxidation of manganese. Philos. Mag. A 1984, 49, 657–663. [Google Scholar] [CrossRef]
- Giri, S.; Patra, M.; Majumdar, S. Exchange bias effect in alloys and compounds. J. Phys. Condens. Matter 2011, 23, 73201. [Google Scholar] [CrossRef] [PubMed]
- Yoshimori, A. A New Type of Antiferromagnetic Structure in the Rutile Type Crystal. J. Phys. Soc. Japan 1959, 14, 807–821. [Google Scholar] [CrossRef]
- Zheng, X.G.; Xu, C.N.; Nishikubo, K.; Nishiyama, K.; Higemoto, W.; Moon, W.J.; Tanaka, E.; Otabe, E.S. Finite-size effect on Néel temperature in antiferromagnetic nanoparticles. Phys. Rev. B Condens. Matter Mater. Phys. 2005, 72, 1–8. [Google Scholar] [CrossRef]
- Zhang, T.; Zhou, T.F.; Qian, T.; Li, X.G. Particle size effects on interplay between charge ordering and magnetic properties in nanosized La0.25Ca0.75MnO3. Phys. Rev. B 2007, 76, 174415. [Google Scholar] [CrossRef]
- Umek, P.; Zorko, A.; Arčon, D. Magnetic Properties of Transition-Metal Oxides: From Bulk to Nano. ChemInform 2013, 42, 2–4. [Google Scholar]
- Luo, J.; Zhu, H.T.; Zhang, F.; Liang, J.K.; Rao, G.H.; Li, J.B.; Du, Z.M. Spin-glasslike behavior of K+ containing α-MnO2 nanotubes. J. Appl. Phys. 2016, 93925, 2–7. [Google Scholar] [CrossRef]
- Polleux, J.; Pinna, N.; Antonietti, M.; Niederberger, M. Ligand-Directed Assembly of Preformed Titania Nanocrystals into Highly Anisotropic Nanostructures. Adv. Mater. 2004, 16, 2002–2005. [Google Scholar] [CrossRef]
- Tang, Z.; Kotov, N.A.; Giersig, M. Spontaneous Organization of Single CdTe Nanoparticles into Luminescent Nanowires. Science. 2002, 297, 237–241. [Google Scholar] [CrossRef] [PubMed]
- Aromal, S.A.; Philip, D. Green synthesis of gold nanoparticles using Trigonella foenum-graecum and its size-dependent catalytic activity. Spectrochim. Acta Part A Mol. Biomol. Spectrosc. 2012, 97, 1–5. [Google Scholar] [CrossRef] [PubMed]
- Kharissova, O.V.; Rasika-Dias, H.V.; Kharisov, B.I.; Olvera-Perez, B.; Jimenez-Perez, V.M. The greener synthesis of nanoparticles. Trends Biotechnol. 2013, 31, 240–248. [Google Scholar] [CrossRef] [PubMed]
- Kuppusamy, P.; Yusoff, M.M.; Maniam, G.P. Biosynthesis of metallic nanoparticles using plant derivatives and their new avenues in pharmacological applications—An updated report. Saudi Pharm. J. 2016, 24, 473–484. [Google Scholar] [CrossRef] [PubMed]
- Makarov, V.V.; Love, A.J.; Sinitsyna, O.V.; Makarova, S.S.; Yaminsky, I.V. “Green” Nanotechnologies: Synthesis of Metal Nanoparticles Using Plants. ActaNaturae 2014, 6, 35–44. [Google Scholar]
- Kumar, K.; Amutha, R.; Arumugam, P.; Berchmans, S. Synthesis of Gold Nanoparticles: An Ecofriendly Approach Using Hansenula anomala. ACS Appl. Mater. Interfaces 2011, 3, 1418–1425. [Google Scholar]
- Abdel-aal, E.I.; Haroon, A.M.; Mofeed, J. Successive solvent extraction and GC-MS analysis for the evaluation of the phytochemical constituents of the filamentous green alga Spirogyra longata. Egypt. J. Aquat. Res. 2015, 41, 233–246. [Google Scholar] [CrossRef]
- Boppana, V.B.R.; Jiao, F. Nanostructured MnO2: An efficient and robust water oxidation catalyst. Chem. Commun. (Camb.) 2011, 47, 8973–8975. [Google Scholar] [CrossRef] [PubMed]
- Yuan, A.; Wang, X.; Wang, Y.; Hu, J. Textural and capacitive characteristics of MnO2 nanocrystals derived from a novel solid-reaction route. Electrochim. Acta 2009, 54, 1021–1026. [Google Scholar] [CrossRef]
- De Keijzer, M.; Van Bommel, M.R.; Keijzer, R.H.-d.; Knaller, R.; Oberhumer, E. Indigo carmine: Understanding a problematic blue dye. In Proceedings of the Decorative: Conservation and the Applied Arts. IIC Congress, Vienna, Austria, 10–14 September 2012; pp. 87–95. [Google Scholar]
- Dähne, S.; Leupold, D. Coupling principles in organic dyes. Angew. Chem. Int. 1966, 5, 984–993. [Google Scholar] [CrossRef]


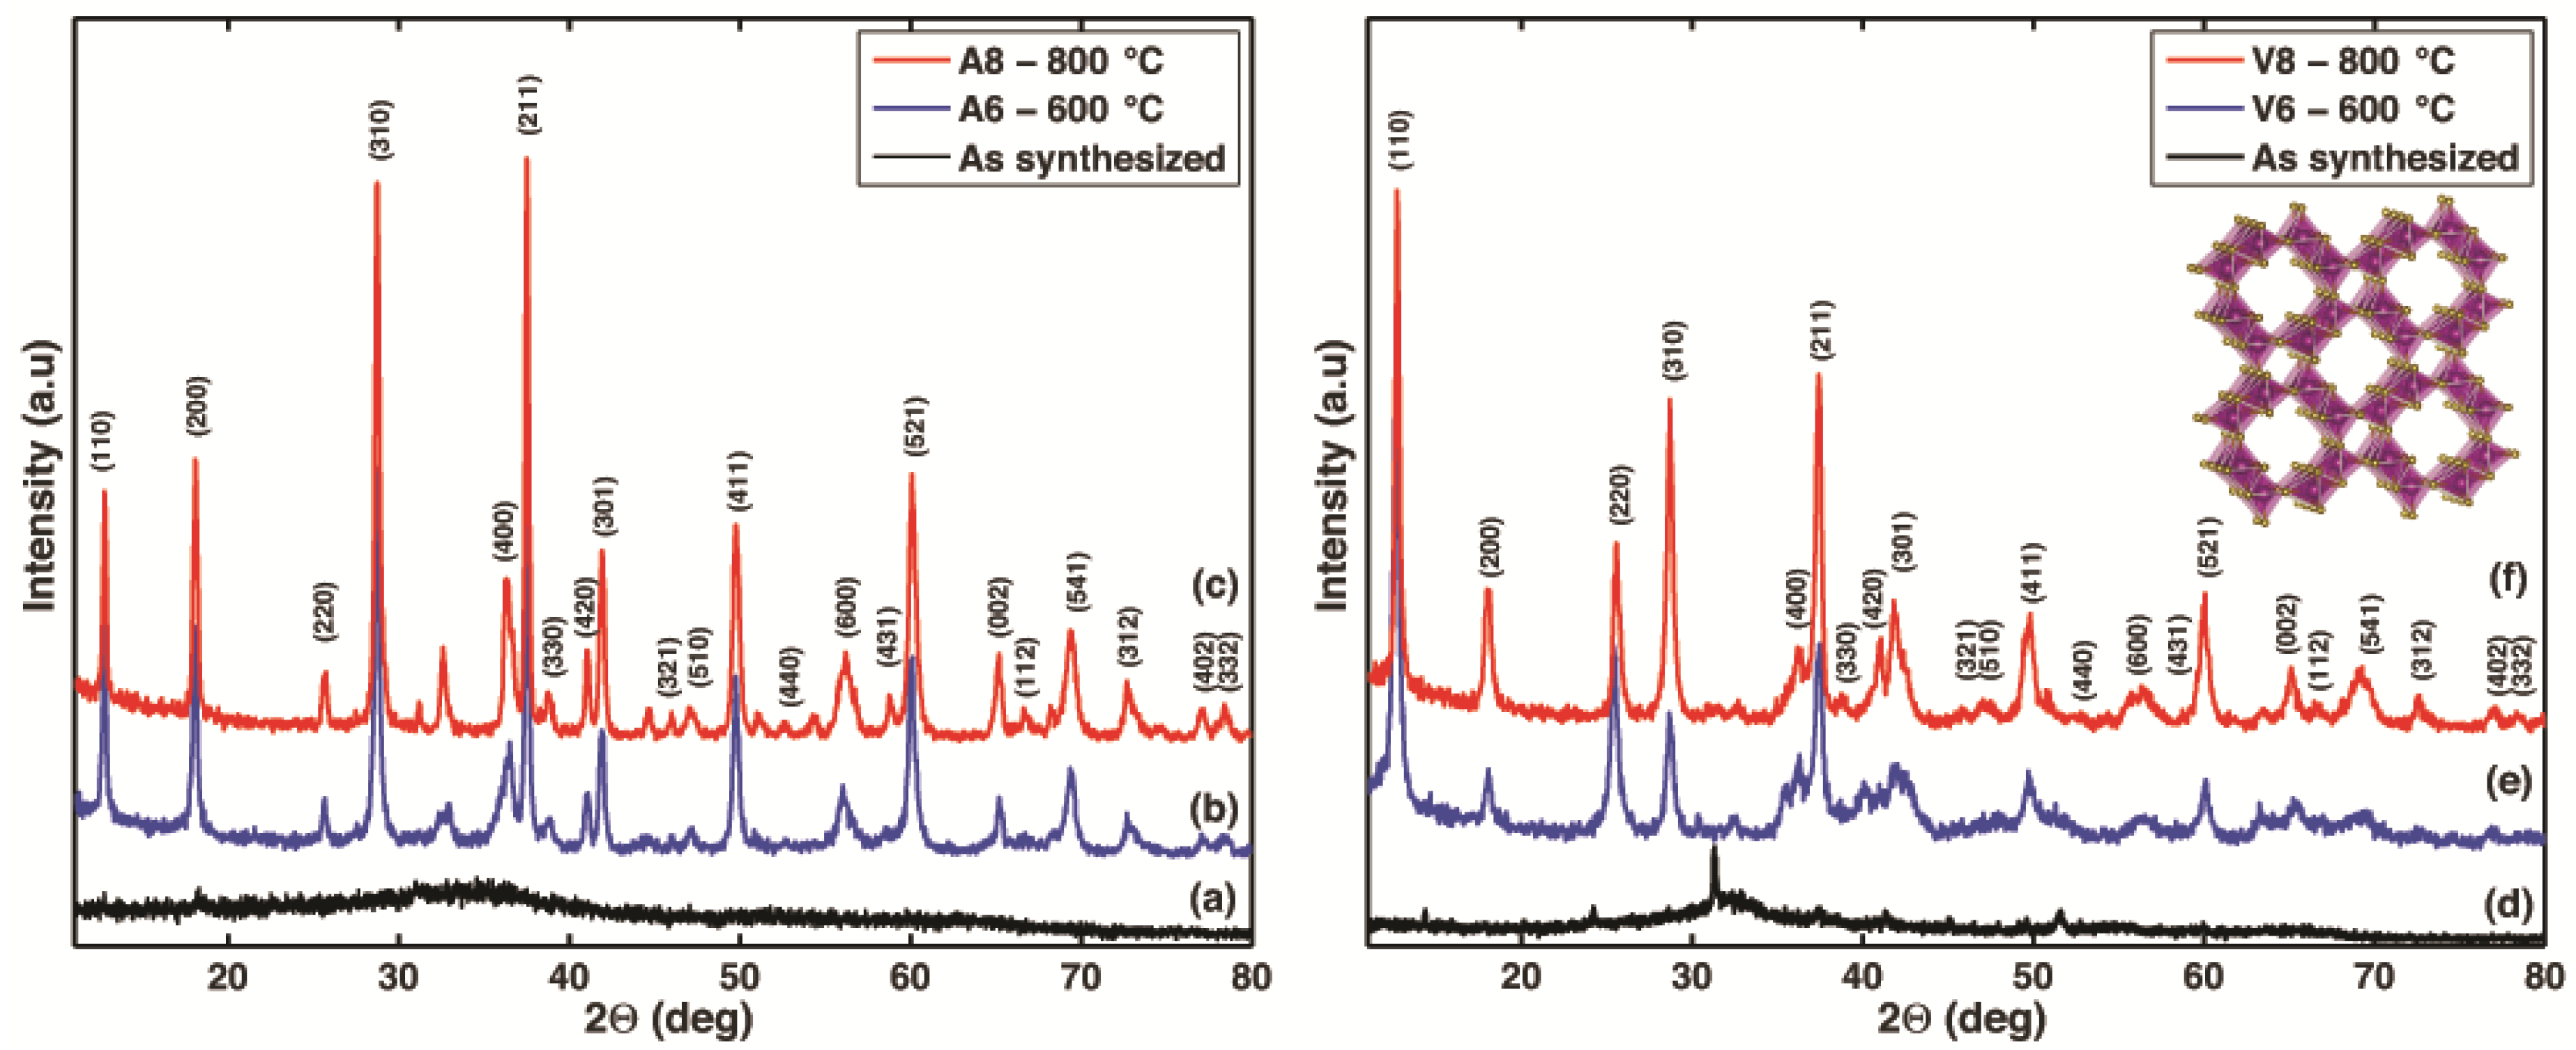
| Sample Name | Extract Used in the Synthesis | Calcination Temperature (°C) | Crystallite Size (Å ) | a (Å) | b (Å) |
|---|---|---|---|---|---|
| A6 | Malus domestica | 600 | D211: 314 | 9.892 | 2.873 |
| A8 | Malus domestica | 800 | D211: 352 | 9.814 | 2.861 |
| V6 | Vitis vinifera | 600 | D110: 243 | 9.922 | 2.854 |
| V8 | Vitis vinifera | 800 | D110: 356 | 9.874 | 2.861 |
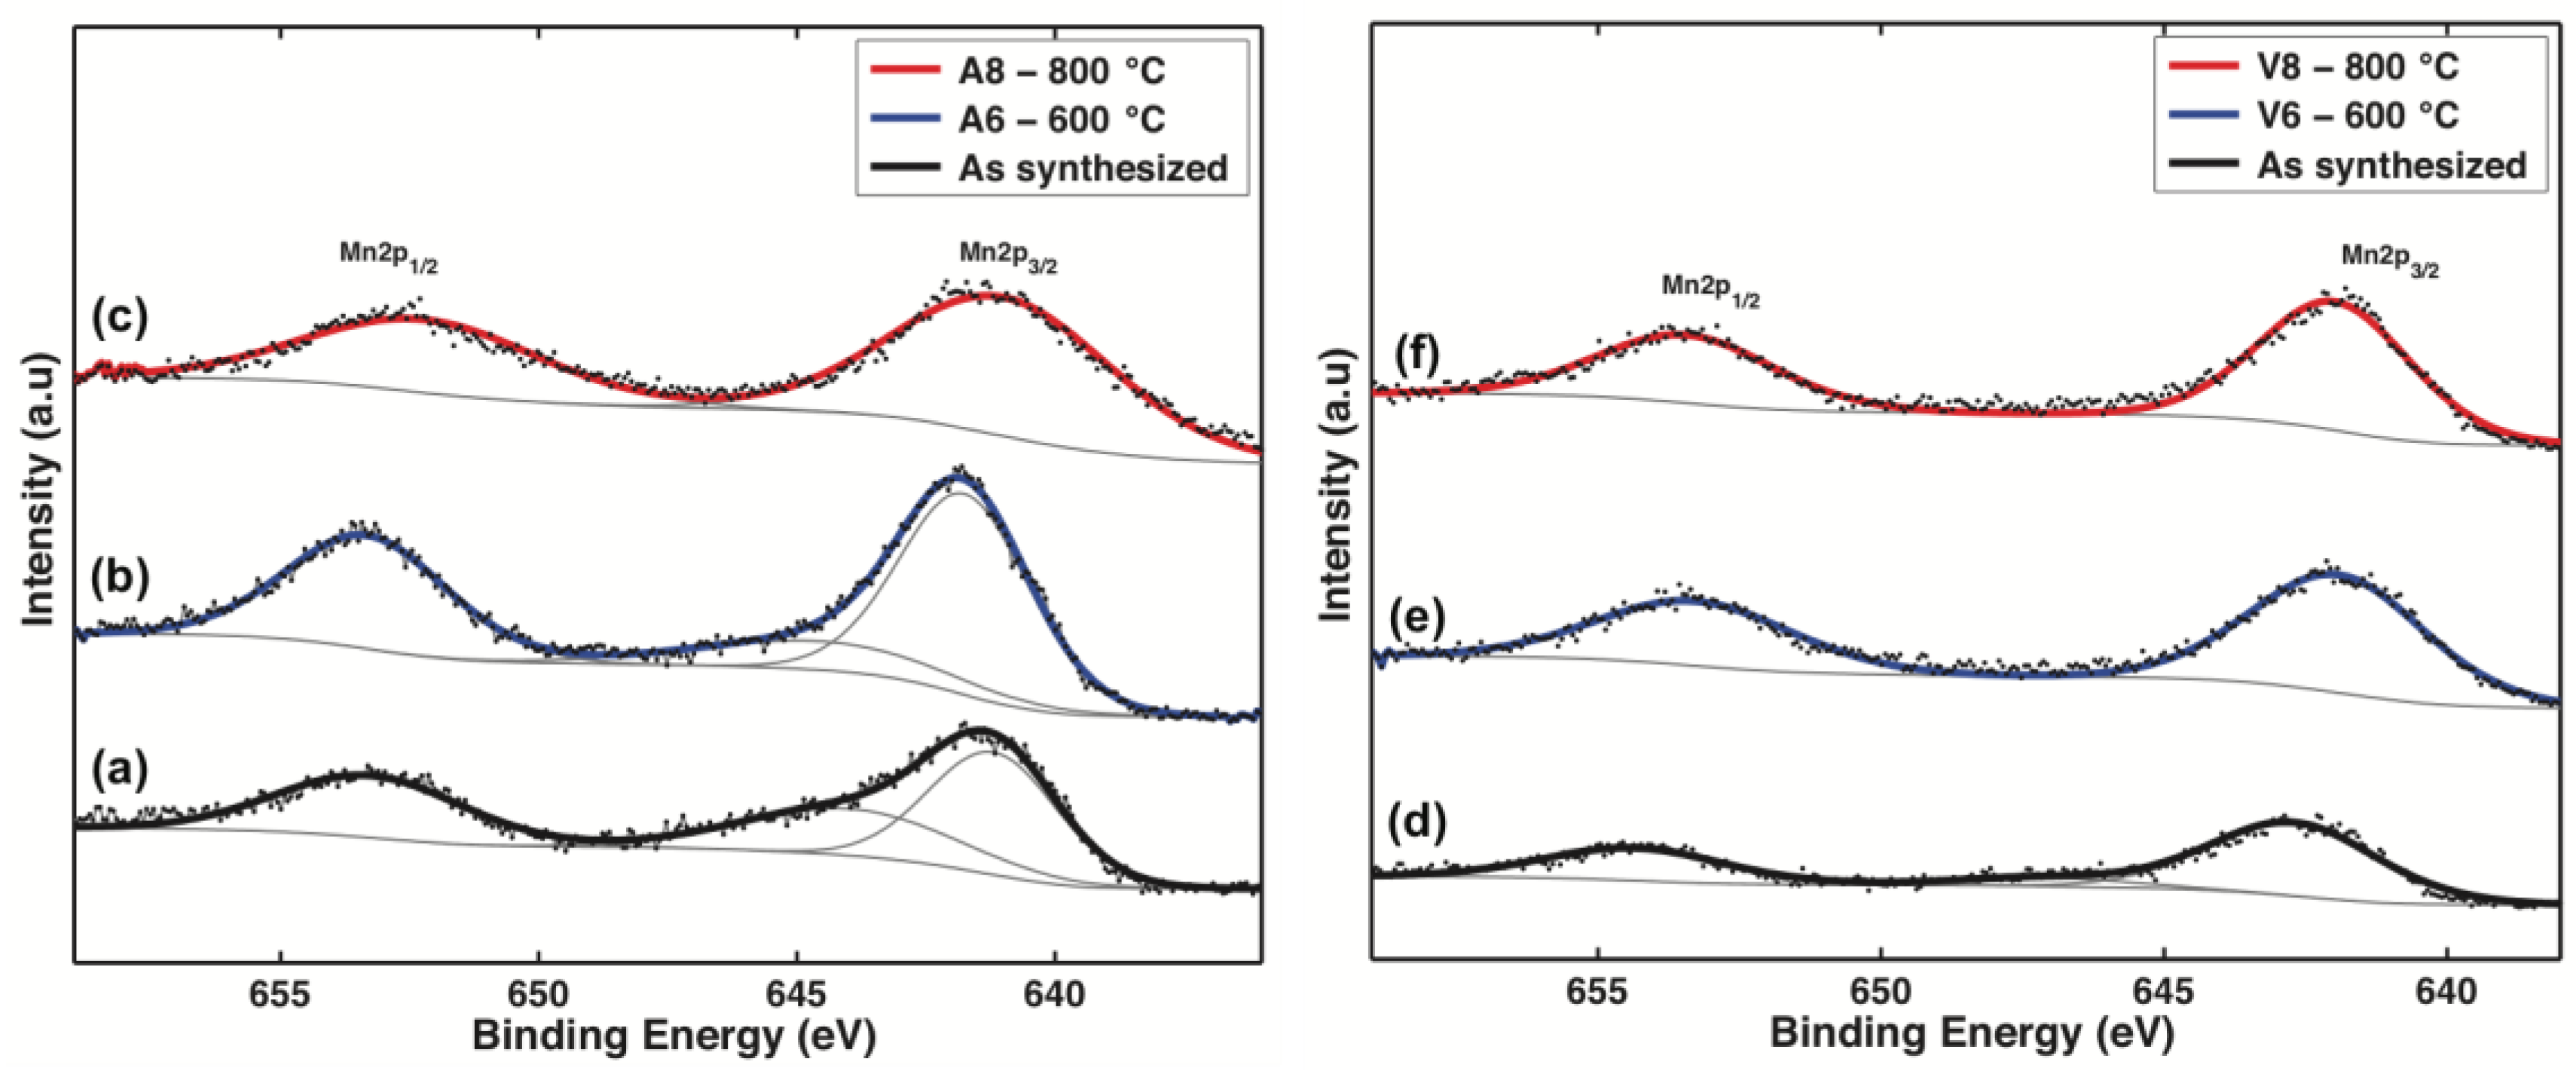
| Sample | Extract | Temp (°C) | Mn(2p3/2) (eV) | Mn(2p3/2) (eV), pk 2 | Mn(2p1/2) (eV) |
|---|---|---|---|---|---|
| As-synthesized | Malus domestica | -- | 641.19 | 643.99 | 653.26 |
| A6 | Malus domestica | 600 | 641.75 | 644.55 | 653.33 |
| A8 | Malus domestica | 800 | 640.99 | -- | 652.22 |
| As-synthesized | Vitis vinifera | -- | 642.7 | 647.1 | 654.33 |
| V6 | Vitis vinifera | 600 | 641.92 | -- | 653.28 |
| V8 | Vitis vinifera | 800 | 641.97 | -- | 653.43 |
© 2017 by the authors. Licensee MDPI, Basel, Switzerland. This article is an open access article distributed under the terms and conditions of the Creative Commons Attribution (CC BY) license (http://creativecommons.org/licenses/by/4.0/).
Share and Cite
Sanchez-Botero, L.; Herrera, A.P.; Hinestroza, J.P. Oriented Growth of α-MnO2 Nanorods Using Natural Extracts from Grape Stems and Apple Peels. Nanomaterials 2017, 7, 117. https://doi.org/10.3390/nano7050117
Sanchez-Botero L, Herrera AP, Hinestroza JP. Oriented Growth of α-MnO2 Nanorods Using Natural Extracts from Grape Stems and Apple Peels. Nanomaterials. 2017; 7(5):117. https://doi.org/10.3390/nano7050117
Chicago/Turabian StyleSanchez-Botero, Lina, Adriana P. Herrera, and Juan P. Hinestroza. 2017. "Oriented Growth of α-MnO2 Nanorods Using Natural Extracts from Grape Stems and Apple Peels" Nanomaterials 7, no. 5: 117. https://doi.org/10.3390/nano7050117
APA StyleSanchez-Botero, L., Herrera, A. P., & Hinestroza, J. P. (2017). Oriented Growth of α-MnO2 Nanorods Using Natural Extracts from Grape Stems and Apple Peels. Nanomaterials, 7(5), 117. https://doi.org/10.3390/nano7050117