
Resonance Rayleigh Scattering and SERS Spectral Detection of Trace Hg(II) Based on the Gold Nanocatalysis

 ,
,
Abstract
:1. Introduction
2. Results and Discussion
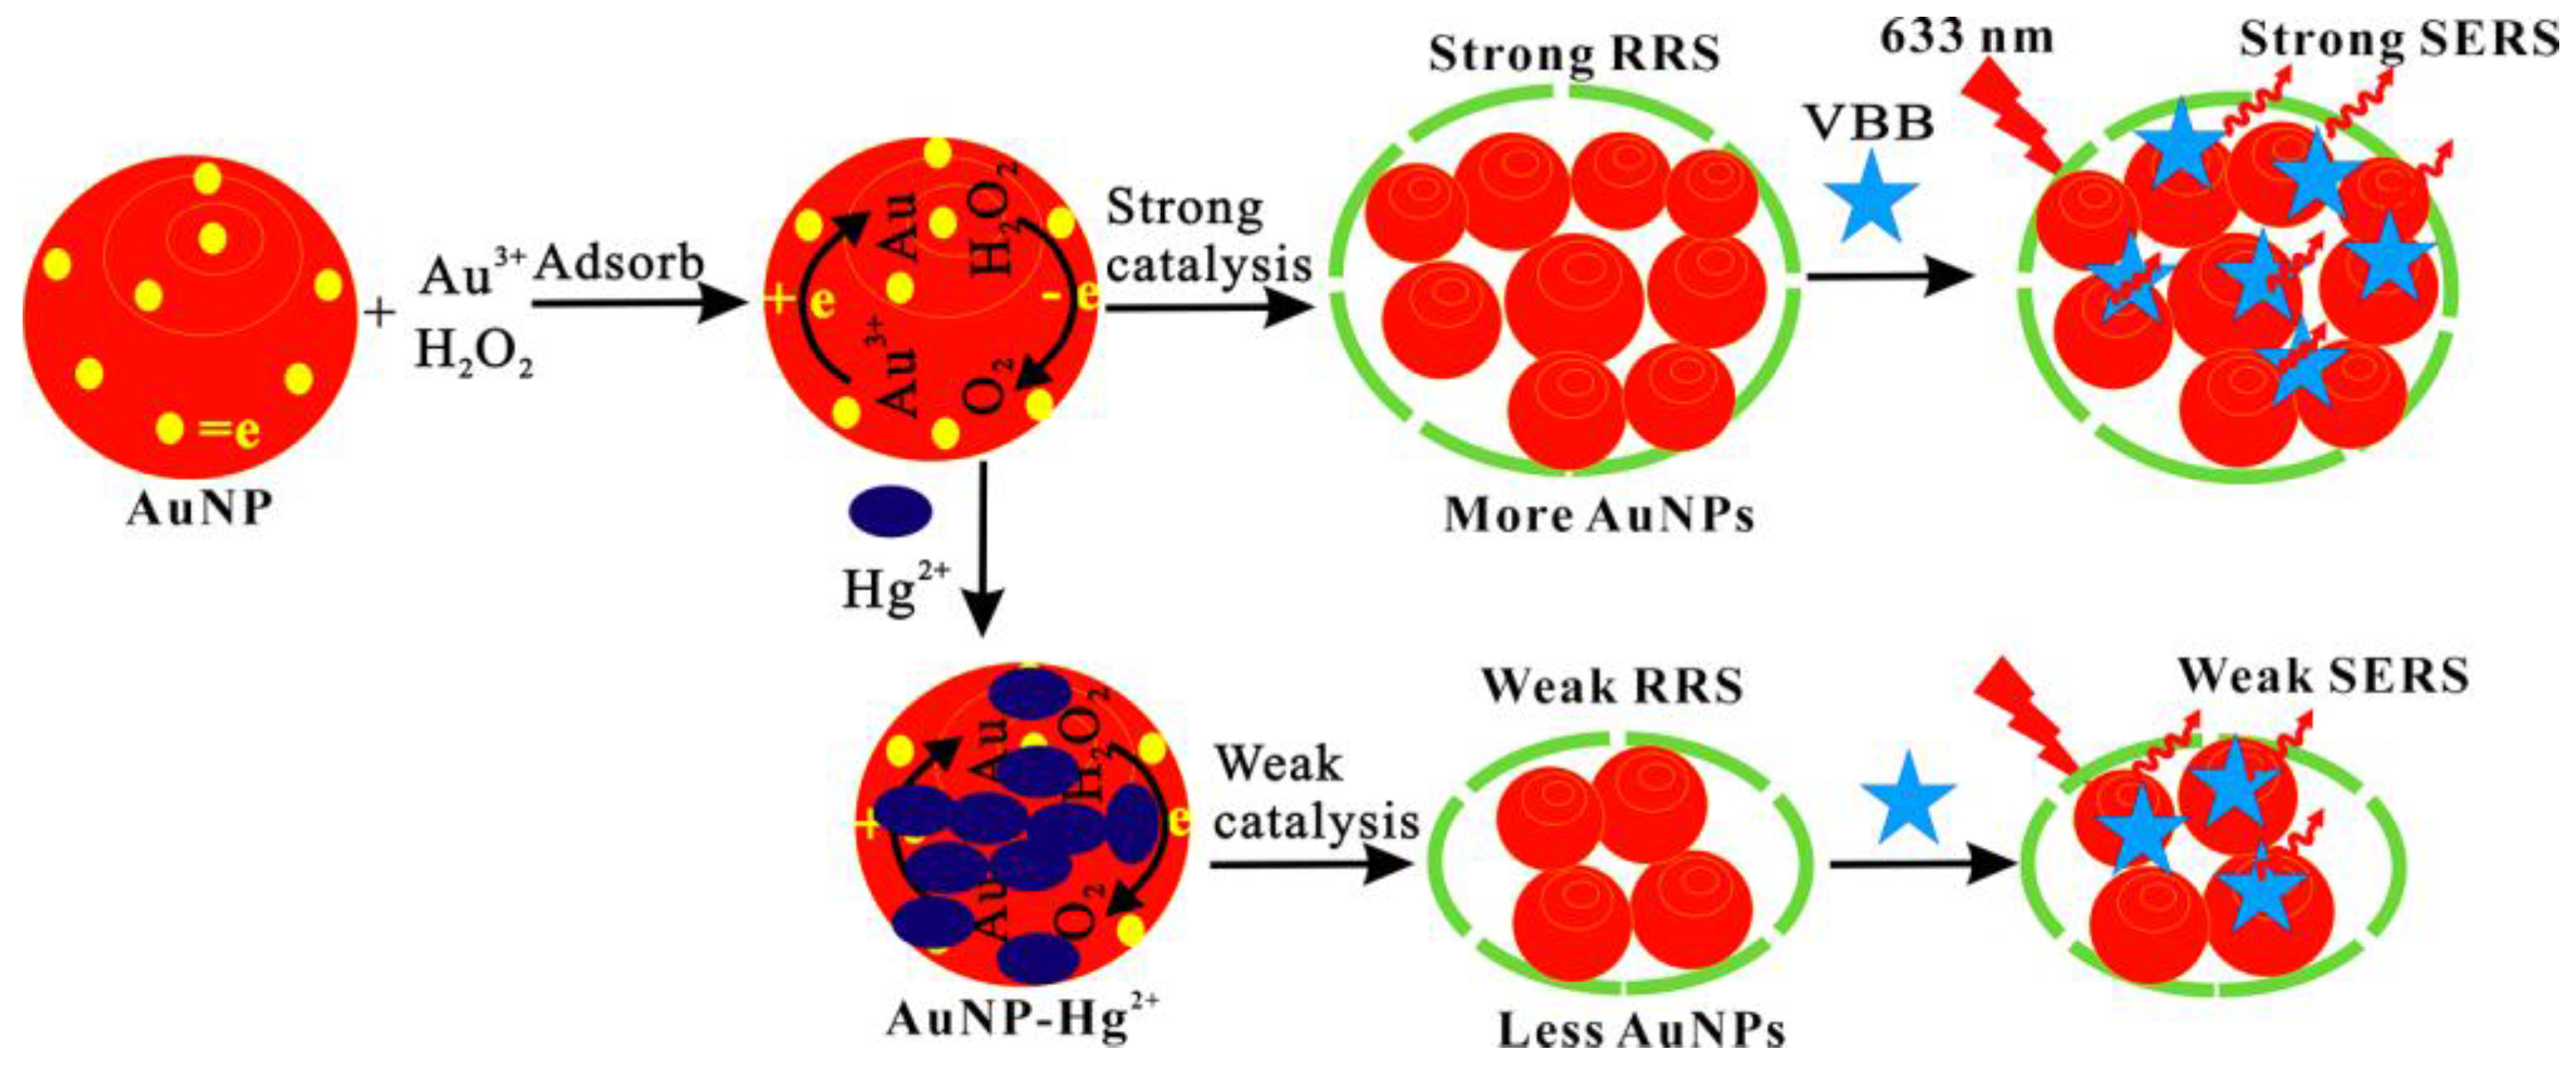
2.1. Principle
- Au3+ + AuNP = AuNP-Au3+ (adsorb)
- H2O2 + AuNP-Au3+ = Au3+-AuNP-H2O2 (adsorb)
- Au3+-AuNP-H2O2 = Au+-AuNP-H2O2 + O2
- Au+-AuNP-H2O2 = AuNP + Au + O2
- nAu = (Au)n = AuNPs
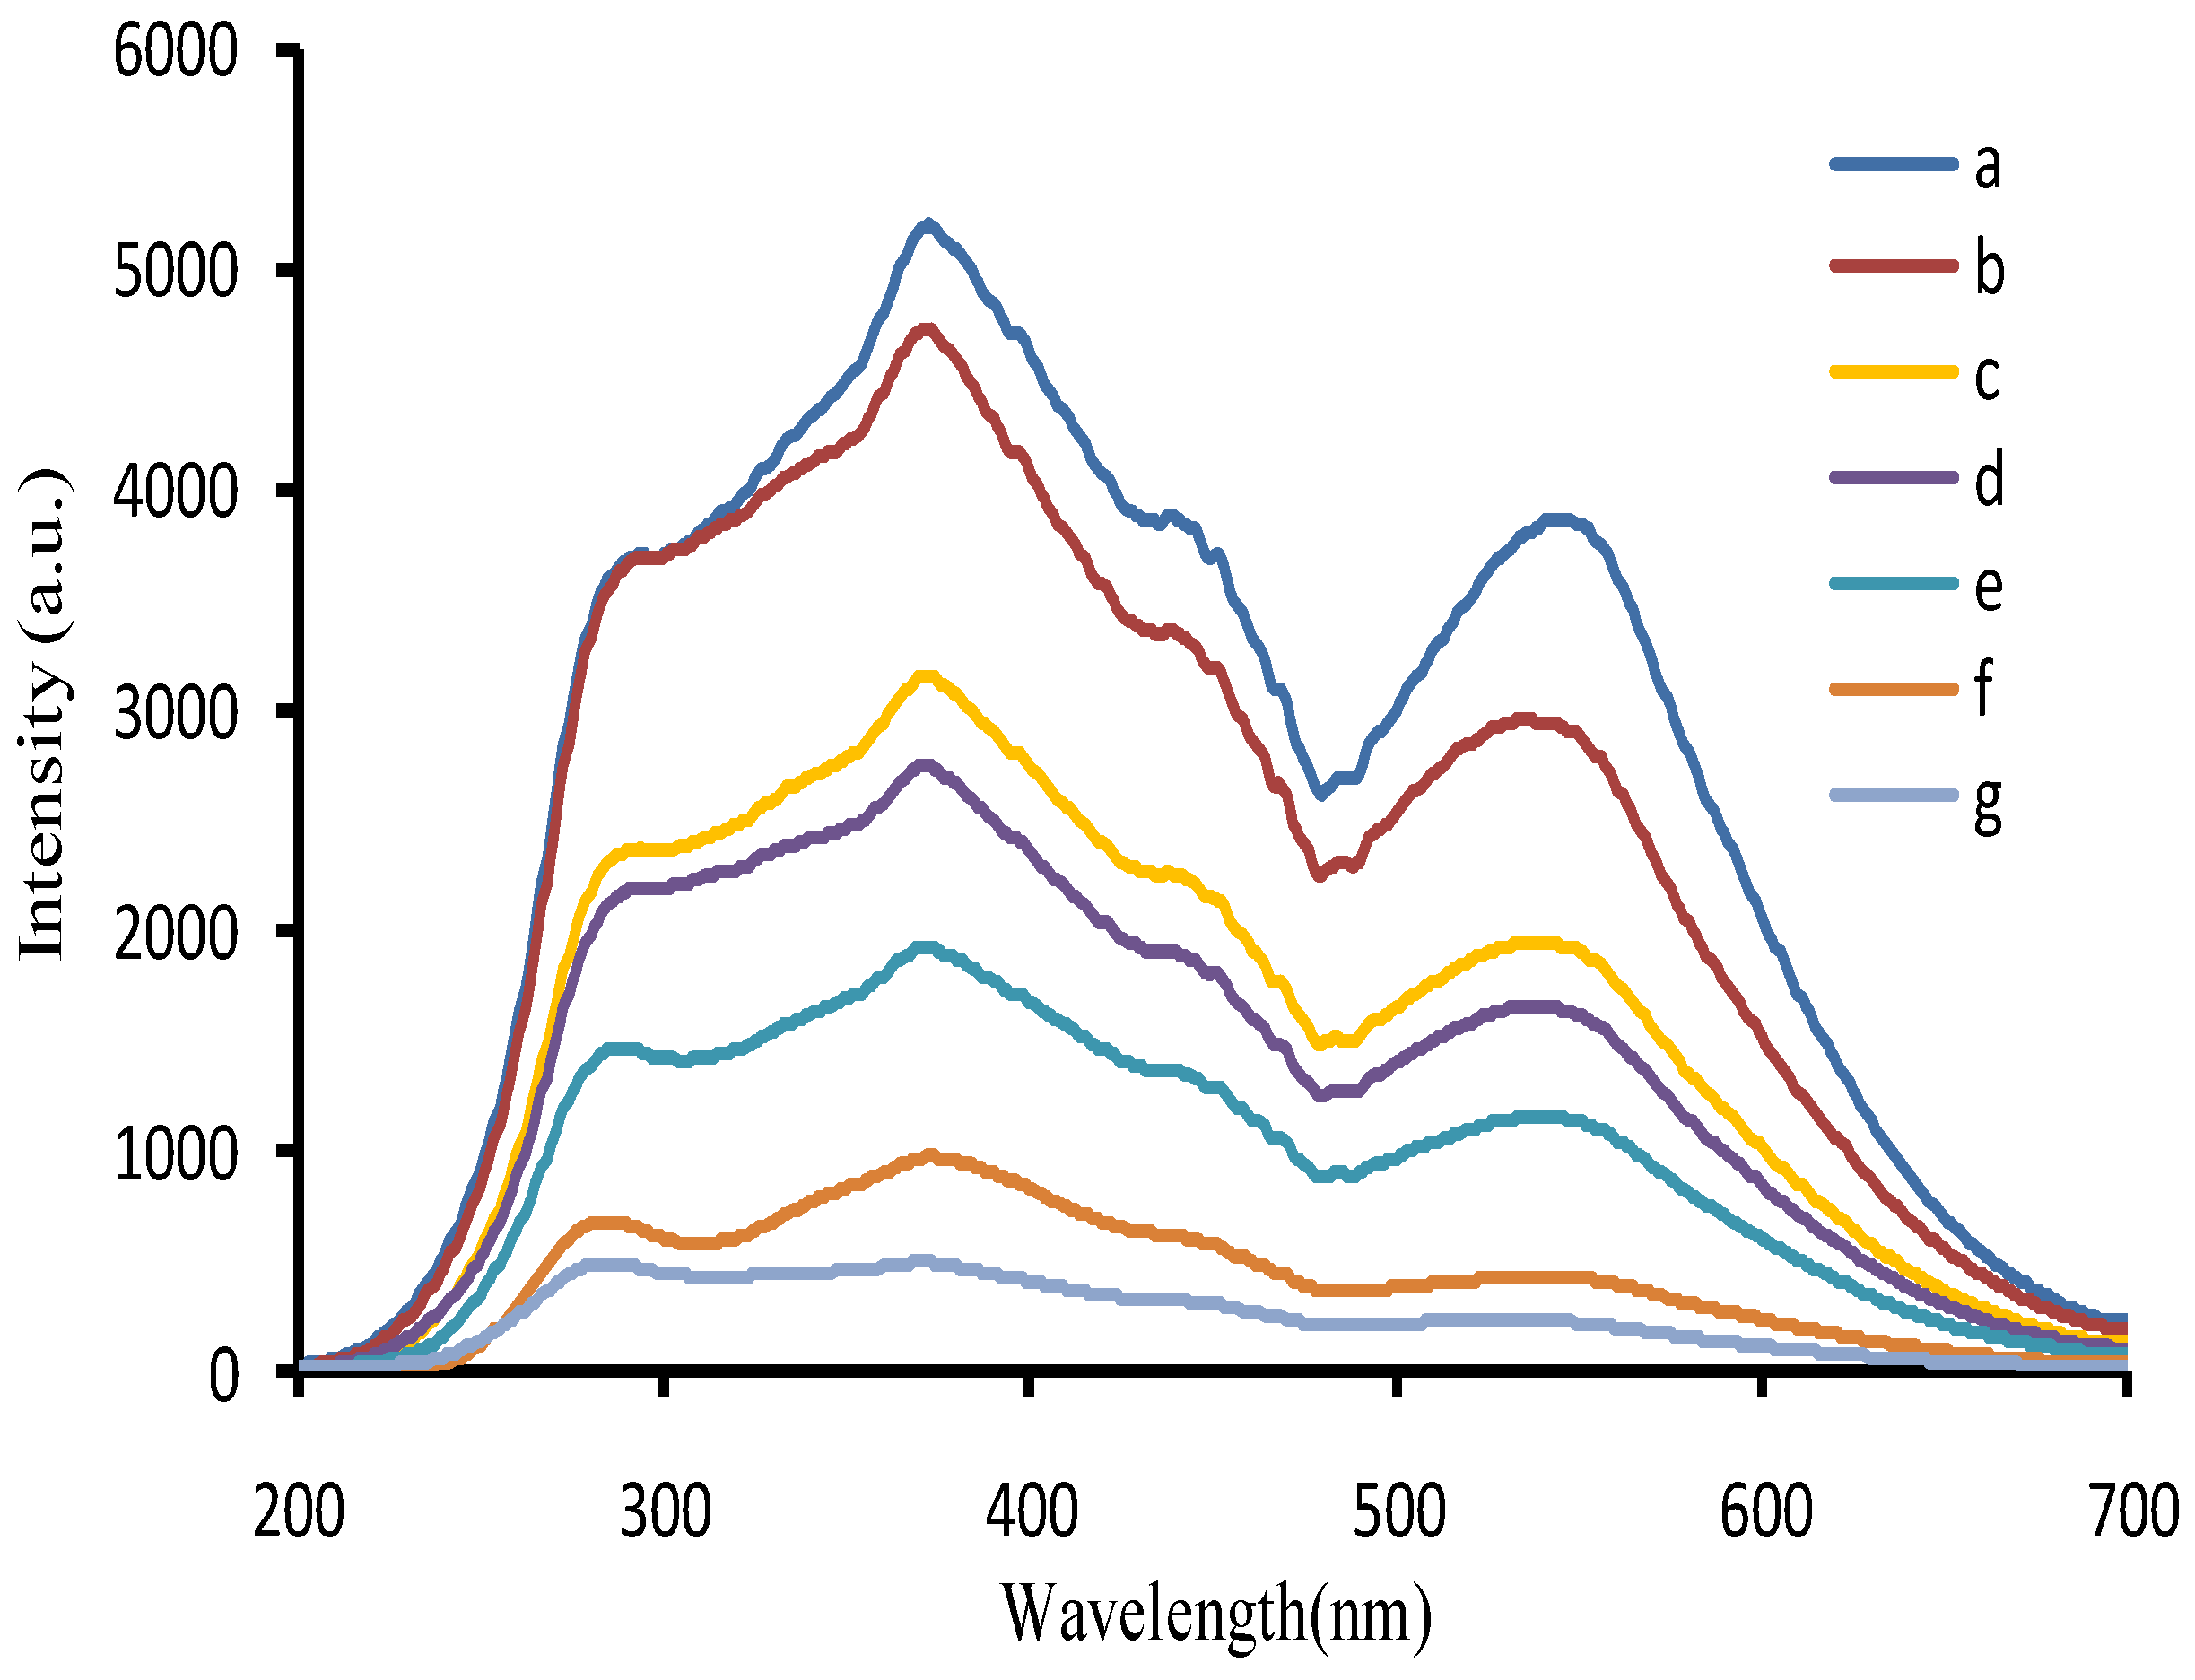
2.2. RRS Spectra
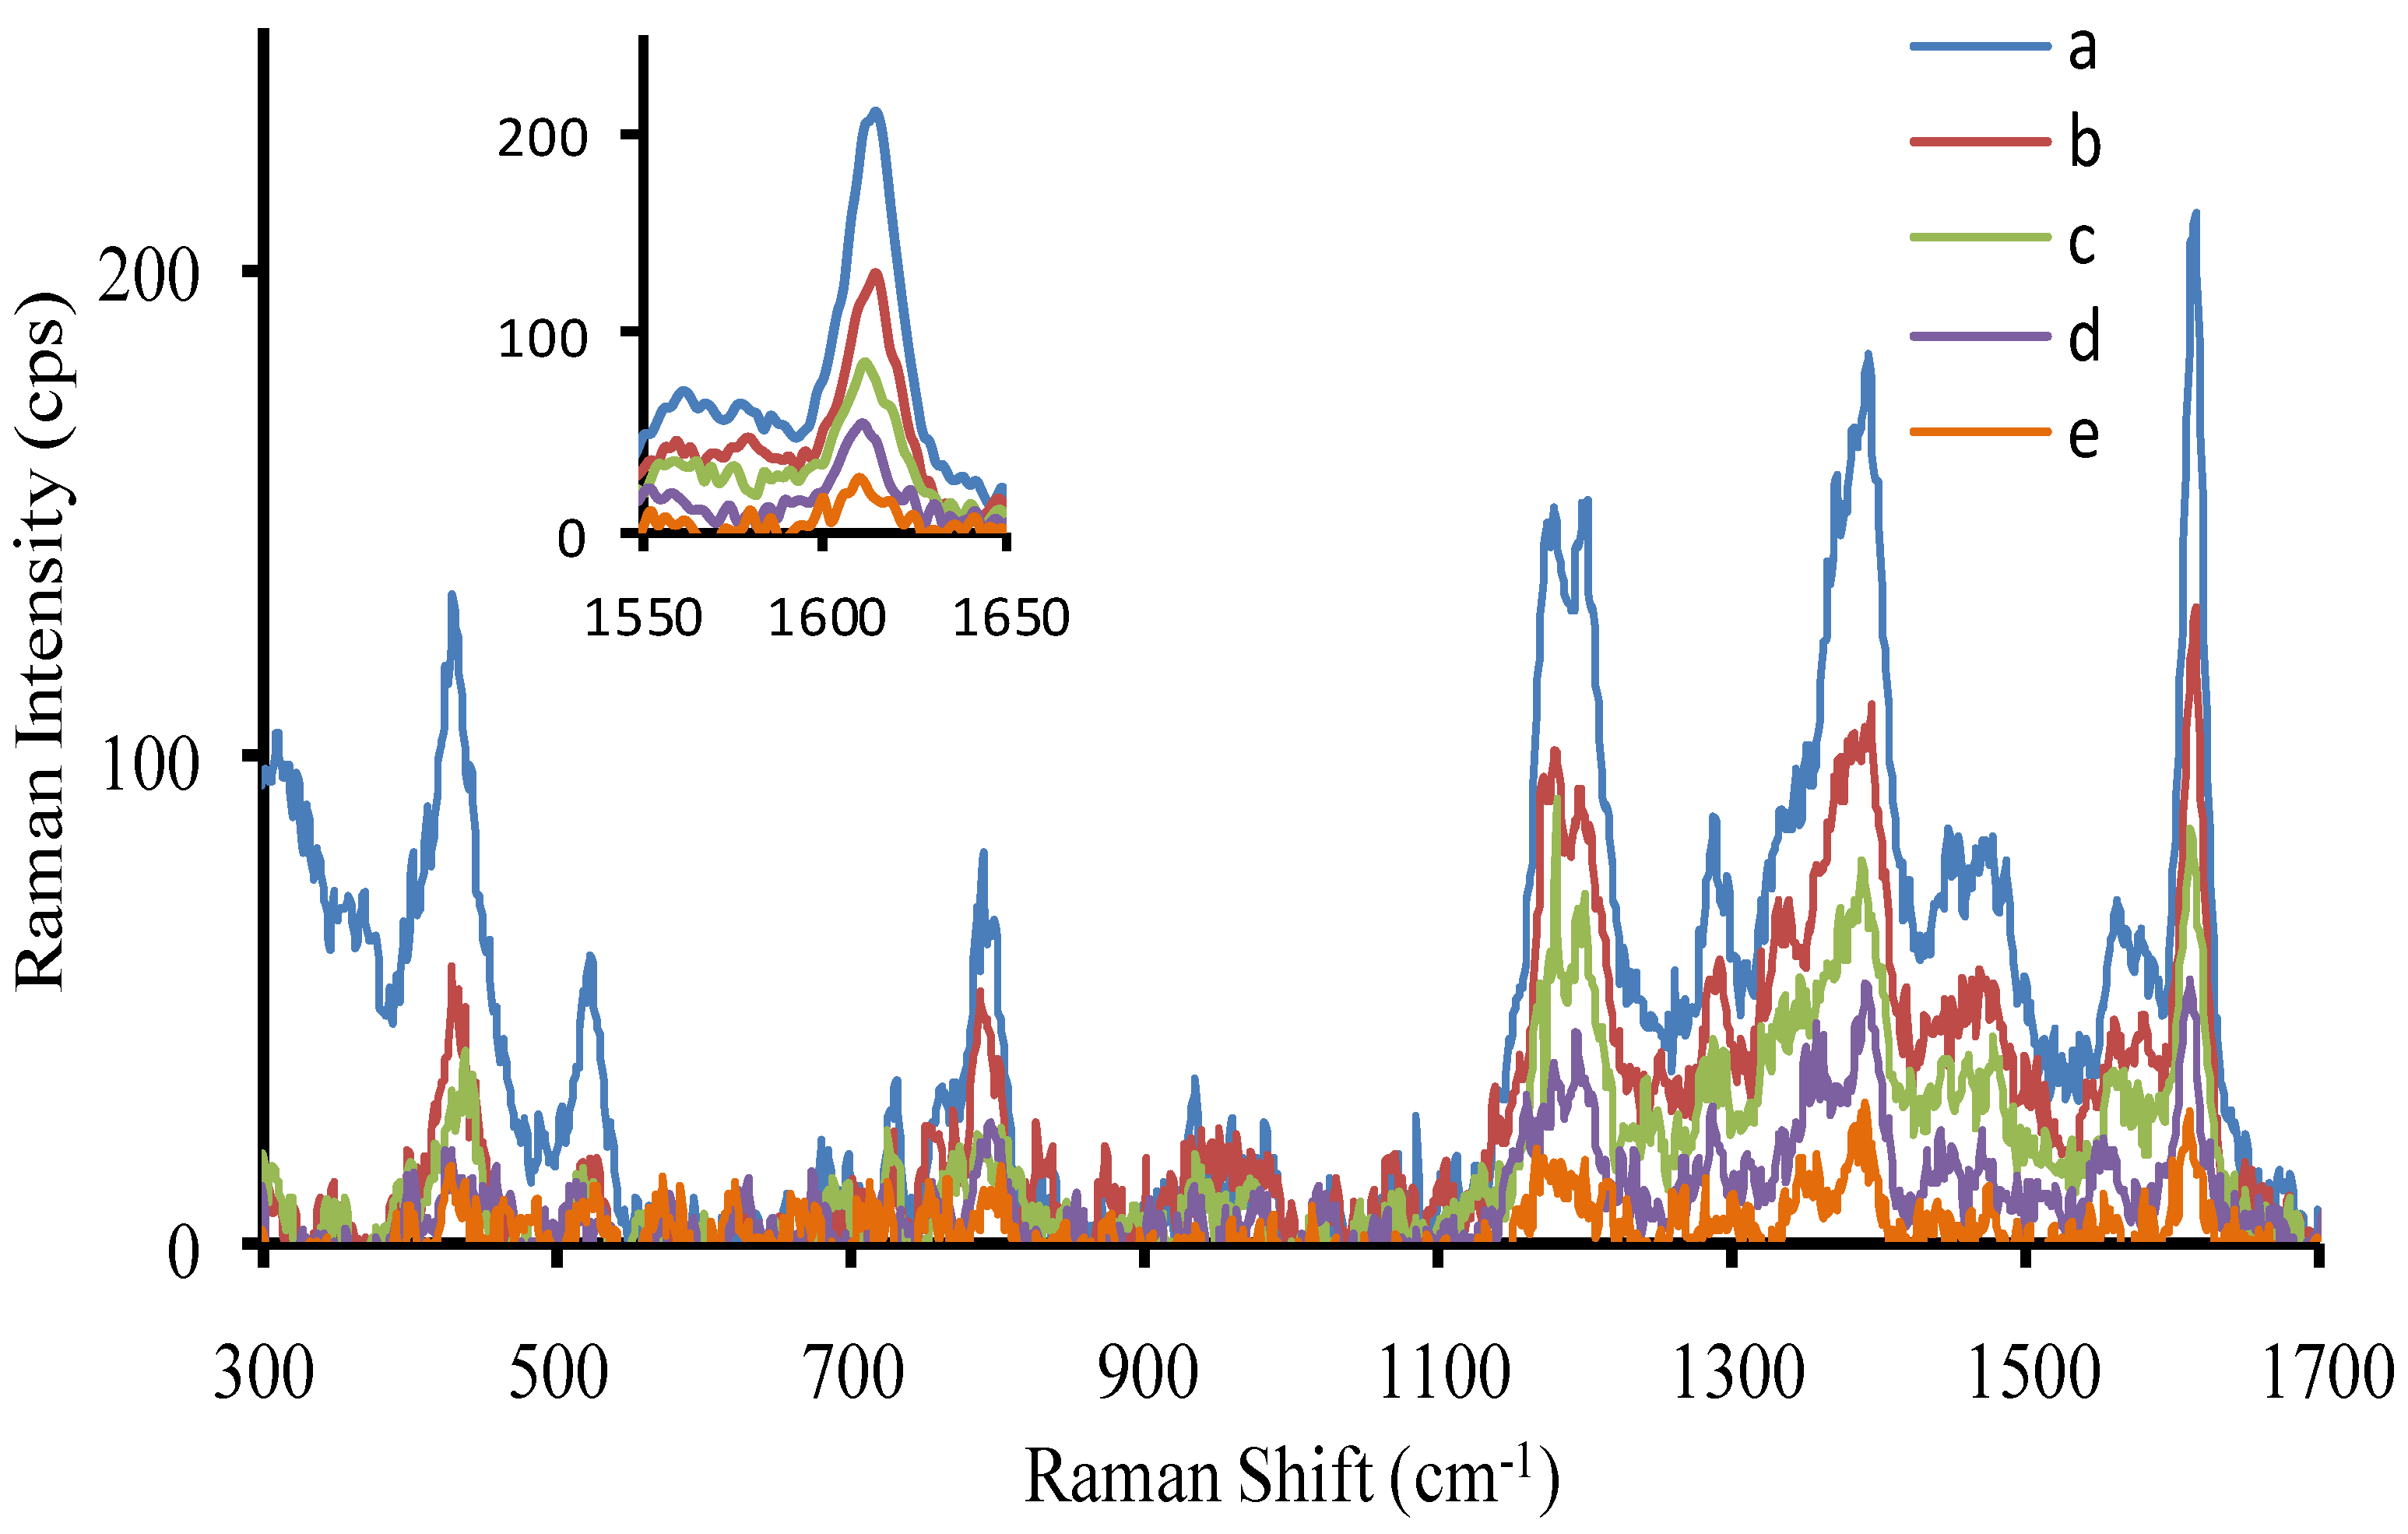
2.3. SERS Spectra
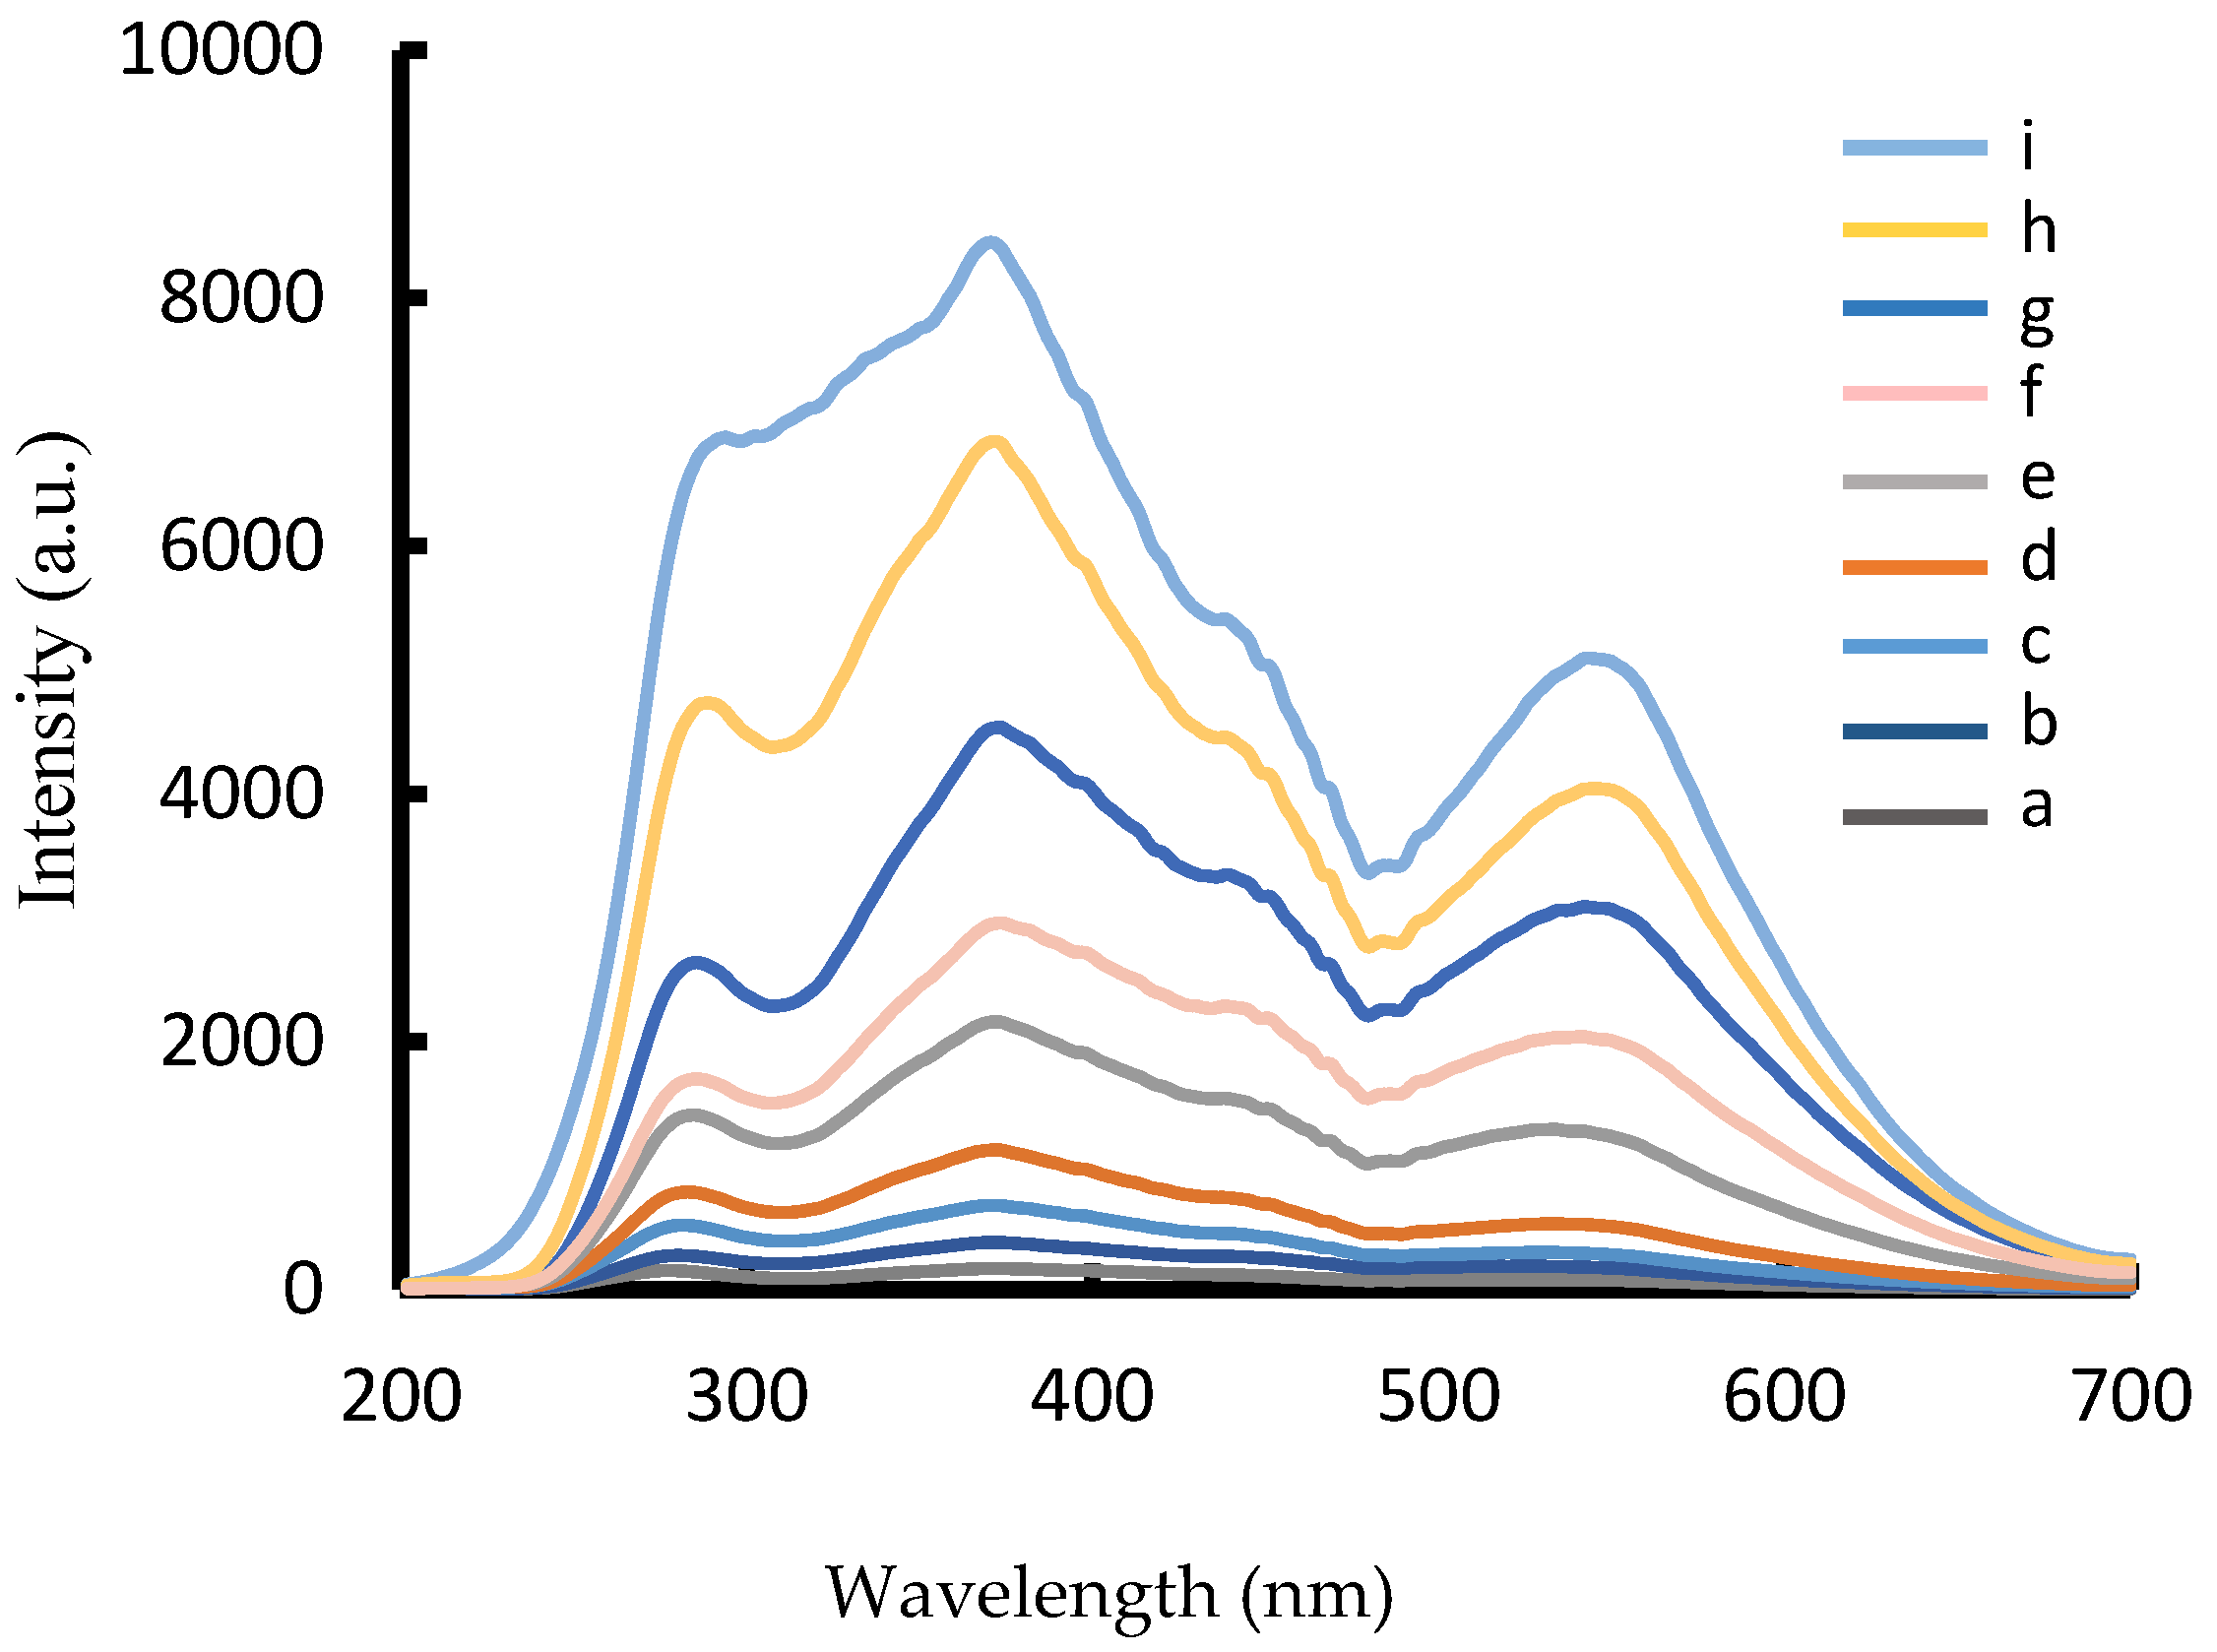
2.4. Absorption Spectra
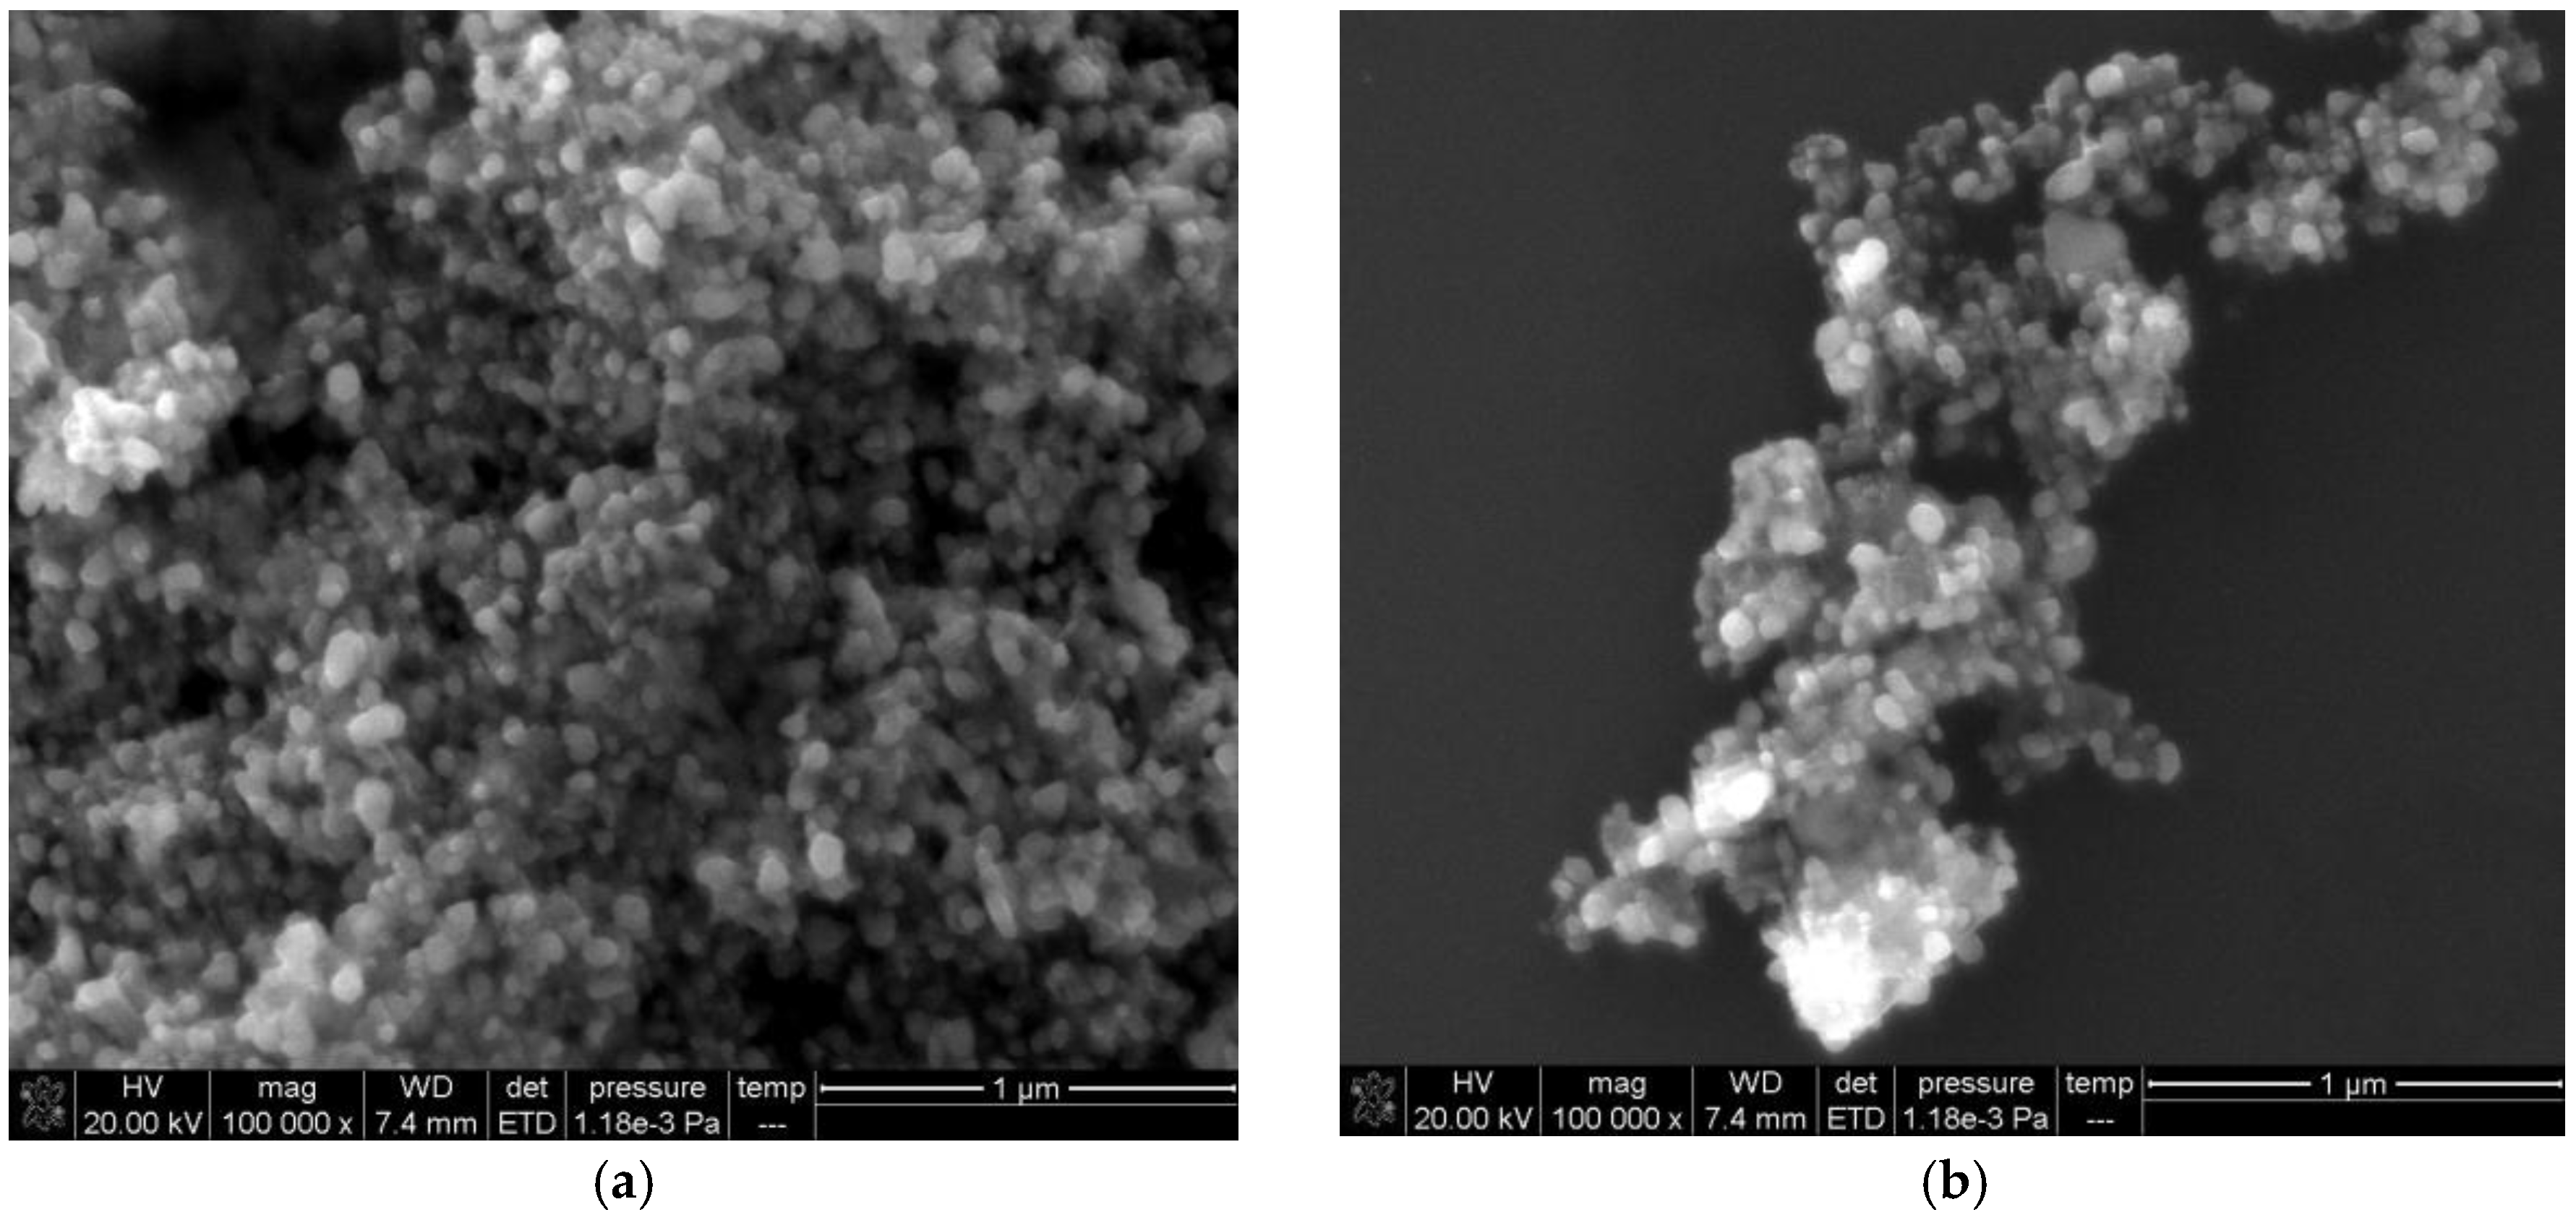
2.5. Scanning Electron Microscopy (SEM)
2.6. Optimization of Analytical Conditions
2.7. Effect of Foreign Substances
2.8. Working Curve
2.9. Analysis of Samples
3. Materials and Methods
3.1. Apparatus
3.2. Reagents
3.3. Procedure
4. Conclusions
Supplementary Materials
Acknowledgments
Author Contributions
Conflicts of Interest
References
- Luo, W.J.; Zhu, C.F.; Su, S.; Li, D.; He, Y.; Huang, Q.; Fan, C.H. Self-catalyzed, self-limiting growth of glucose oxidase-mimicking gold nanoparticles. ACS Nano 2010, 4, 7451–7458. [Google Scholar] [CrossRef] [PubMed]
- Rica, R.D.L.; Stevens, M.M. Plasmonic ELISA for the ultrasensitive detection of disease biomarkers with the naked eye. Nat. Nanotechnol. 2012, 7, 821–824. [Google Scholar] [CrossRef] [PubMed]
- Gao, L.Z.; Zhuang, J.; Nie, L.; Zhang, J.B.; Zhang, Y.; Gu, N.; Wang, T.H.; Feng, J.; Yang, D.L.; Perrett, S.; et al. Intrinsic peroxidase-like activity of ferromagnetic nanoparticles. Nat. Nanotechnol. 2007, 2, 577–583. [Google Scholar] [CrossRef] [PubMed]
- Natalio, F.; Andre, R.; Hartog, A.F.; Stoll, B.; Jochum, K.P.; Wever, R.; Tremel, W. Vanadium pentoxide nanoparticles mimic vanadium haloperoxidases and thwart biofilm formation. Nat Nanotechnol. 2012, 7, 530–535. [Google Scholar] [CrossRef] [PubMed]
- Liu, Y.; Wu, H.; Li, M.; Yin, J.J.; Nie, Z. pH dependent catalytic activities of platinum nanoparticles with respect to the decomposition of hydrogen peroxide and scavenging of superoxide and singlet oxygen. Nanoscale 2014, 6, 11904–11910. [Google Scholar] [CrossRef] [PubMed]
- Li, J.N.; Liu, W.Q.; Wu, X.C.; Gao, X.F. Mechanism of pH-switchable peroxidase and catalase-like activities of gold, silver, platinum and palladium. Biomaterials 2015, 48, 37–44. [Google Scholar] [CrossRef] [PubMed]
- Liu, Y.; Yuan, M.; Qiao, L.L.; Guo, R. An efficient colorimetric biosensor for glucose based on peroxidase-like protein-Fe3O4 and glucose oxidase nanocomposites. Biosens. Bioelectron. 2014, 52, 391–396. [Google Scholar] [CrossRef] [PubMed]
- Wan, L.J.; Liu, J.H.; Huang, X.J. Novel magnetic nickel telluride nanowires decorated with thorns: Synthesis and their intrinsic peroxidase-like activity for detection of glucose. Chem. Commun. 2014, 50, 13589–13591. [Google Scholar] [CrossRef] [PubMed]
- Shi, W.B.; Zhang, X.D.; He, S.H.; Li, J.; Huang, Y.M. Fast screening nanoparticle mimenic enzyme by chemiluminescence. Sci. Sin. Chim. 2013, 43, 1591–1598. [Google Scholar] [CrossRef]
- Shi, W.B.; Wang, Q.L.; Long, Y.J.; Cheng, Z.L.; Chen, S.H.; Zheng, H.Z.; Huang, Y.M. Carbon nanodots as peroxidase mimetics and their applications to glucose detection. Chem. Commun. 2011, 47, 6695–6697. [Google Scholar] [CrossRef] [PubMed]
- Wang, G.L.; Jin, L.Y.; Dong, Y.M.; Wu, X.M.; Li, Z.J. Intrinsic enzyme mimicking activity of gold nanoclusters upon visible light triggering and its application for colorimetric trypsin detection. Biosens. Bioelectron. 2015, 64, 523–529. [Google Scholar] [CrossRef] [PubMed]
- Ju, Y.; Li, B.X.; Cao, R. Positively-charged gold nanoparticles as peroxidase mimic and their application in hydrogen peroxide and glucose detection. Chem. Commun. 2010, 46, 8017–8019. [Google Scholar]
- Li, Y.; Ma, Q.; Liu, Z.P.; Wang, X.Y.; Su, X.G. A novel enzyme-mimic nanosensor based on quantum dot-Au nanoparticle@silica mesoporous microsphere for the detection of glucose. Anal. Chim. Acta 2014, 840, 68–74. [Google Scholar] [CrossRef] [PubMed]
- Romero, V.; Costas-Mora, I.; Lavilla, I.; Bendicho, C. Cold vapor-solid phase microextraction using amalgamation in different Pd-based substrates combined with direct thermal desorption in a modified absorption cell for the determination of Hg by atomic absorption spectrometry. Spectrochem. Acta Part B 2011, 66, 156–162. [Google Scholar] [CrossRef]
- Leopold, K.; Foulkes, M.; Worsfold, P.J. Gold-coated silica as a preconcentration phase for the determination of total dissolved mercury in natural waters using atomic fluorescence spectrometry. Anal. Chem. 2009, 81, 3421–3428. [Google Scholar] [CrossRef] [PubMed]
- Chen, J.G.; Chen, H.W.; Jin, C.H.T. Determination of ultra-trace amount methyl-, phenyl- and inorganic mercury in environmental and biological samples by liquid chromatography with inductively coupled plasma mass spectrometry after cloud point extraction preconcentration. Talanta 2009, 77, 1281–1287. [Google Scholar] [CrossRef] [PubMed]
- Liu, C.W.; Huang, C.C.; Chang, H.T. Control over surface DNA density on gold nanoparticles allows selective and sensitive detection of mercury (II). Langmuir 2008, 24, 8346–8350. [Google Scholar] [CrossRef] [PubMed]
- Luo, Y.H.; Xu, L.L.; Liang, A.H.; Deng, A.P.; Jiang, Z.L. A highly sensitive resonance Rayleigh scattering assay for detection of Hg(II) using immunonanogold as probe. RSC Adv. 2014, 4, 19234–19237. [Google Scholar] [CrossRef]
- Wen, G.Q.; Liang, A.H.; Jiang, Z.L. Functional nucleic acid nanoparticle-based resonance scattering spectral probe. Plasmonics 2013, 8, 899–911. [Google Scholar] [CrossRef]
- Liu, S.P.; Liu, Z.F.; Luo, H.Q. Resonance Rayleigh scattering method for the determination of trace amounts of cadmium with iodide-rhodamine dye systems. Anal. Chim. Acta 2000, 407, 255–260. [Google Scholar] [CrossRef]
- Liang, A.H.; Liu, Q.Y.; Wen, G.Q.; Jiang, Z.L. The surface-plasmon-resonance effect of nanogold/silver and its analytical applications. TrAC Trends Anal. Chem. 2012, 37, 32–47. [Google Scholar] [CrossRef]
- Shi, Y.; Luo, H.Q.; Li, N.B. A highly sensitive resonance Rayleigh scattering method to discriminate a parallel-stranded G-quadruplex from DNA with other topologies and structures. Chem. Commun. 2013, 49, 6209–6211. [Google Scholar] [CrossRef] [PubMed]
- Liu, Y.; Huang, C.Z. Screening sensitive nanosensors via the investigation of shape-dependent localized surface plasmon resonance of single Ag nanoparticles. Nanoscale 2013, 5, 7458–7466. [Google Scholar] [CrossRef] [PubMed]
- Cheng, Y.Q.; Li, Z.P.; Su, Y.Q.; Fan, Y.S. Ferric nanoparticle-based resonance light scattering determination of DNA at nanogram levels. Talanta 2007, 71, 1757–1761. [Google Scholar] [CrossRef] [PubMed]
- Yao, D.M.; Wen, G.Q.; Jiang, Z.L. A highly sensitive and selective resonance Rayleigh scattering method for bisphenol a detection based on the aptamer-nanogold catalysis of the HAuCl4-vitamin C particle reaction. RSC Adv. 2013, 3, 13353–13356. [Google Scholar] [CrossRef]
- Dong, J.C.; Liang, A.H.; Jiang, Z.L. A highly sensitive resonance Rayleigh scattering method for hemin based on the aptamer-nanogold probe catalysis of citrate-HAuCl4 particle reaction. RSC Adv. 2013, 3, 17703–17706. [Google Scholar] [CrossRef]
- Jiang, Z.L.; Zhang, S.S.; Liang, A.H.; Huang, S.Y. Resonance scattering spectral detection of ultratrace IgG using immunonanogold-HAuCl4-NH2OH catalytic reaction. Sci. Chin. Chem. 2008, 51, 1–7. [Google Scholar] [CrossRef]
- Liang, A.H.; Zou, M.J.; Jiang, Z.L. Immunonanogold-catalytic resonance scattering spectral assay of trace human chorionic gonadotrophin. Talanta 2008, 75, 1214–1220. [Google Scholar] [CrossRef] [PubMed]
- Jiang, Z.L.; Zhang, Y.; Liang, A.H.; Chen, C.Q.; Tian, J.N.; Li, T.S. Free-labeled nanogold catalytic detection of trace UO22+ based on the aptamer reaction and gold particle resonance scattering effect. Plasmonics 2012, 7, 185–190. [Google Scholar] [CrossRef]
- Song, J.; Huang, Y.Q.; Fan, Y.X.; Zhao, Z.H.; Yu, W.S.; Rasco, B.A.; Lai, K.Q. Detection of prohibited fish drugs using silver nanowires as substrate for surface-enhanced Raman scattering. Nanomaterials 2016, 6, 175. [Google Scholar] [CrossRef] [PubMed]
- Zhang, W.J.; Cai, Y.; Qian, R.; Zhao, B.; Zhu, P.Z. Synthesis of ball-Like Ag nanorod aggregates for surface-enhanced Raman scattering andcatalytic reduction. Nanomaterials 2016, 6, 99. [Google Scholar] [CrossRef] [PubMed]
- Li, C.N.; Ouyang, H.X.; Tang, X.P.; Wen, G.Q.; Liang, A.H.; Jiang, Z.L. A surface enhanced Raman scattering quantitative analytical platform for detection of trace Cu coupled the catalytic reaction and gold nanoparticle aggregation with label-free Victoria blue B molecular probe. Biosens. Bioelectron. 2017, 87, 888–893. [Google Scholar] [CrossRef] [PubMed]
- Wen, G.Q.; Liang, X.J.; Liu, Q.Y.; Liang, A.H.; Jiang, Z.L. A novel nanocatalytic SERS detection of trace human chorionic gonadotropin using labeled-free Victoria blue 4R as molecular probe. Biosens. Bioelectron. 2016, 85, 450–456. [Google Scholar] [CrossRef] [PubMed]
- Liu, S.P.; Liu, Z.F.; Zhou, G.M. Resonant rayleigh scattering for the determination of trace smounts of mercury (II) with thiocyanate and basic triphenylmethane dyes. Anal. Lett. 1998, 31, 1247–1259. [Google Scholar] [CrossRef]
- Wang, G.Q.; Lim, C.S.; Chen, L.X.; Chon, H.; Choo, J.; Hong, J.; deMello, A.J. Surface-enhanced Raman scattering in nanoliter droplets: Towards high-sensitivity detection of mercury (II) ions. Anal. Bioanal. Chem. 2009, 394, 1827–1832. [Google Scholar] [CrossRef] [PubMed]
- Lee, C., II; Choo, J. Selective trace analysis of mercury (II) Ions in aqueous media using SERS-based aptamer sensor. Bull. Korean Chem. Soc. 2011, 32, 2003–2007. [Google Scholar] [CrossRef]
- Jiang, Z.L.; Fan, Y.Y.; Chen, M.L.; Liang, A.H.; Liao, X.J.; Wen, G.Q.; Shen, X.C.; He, X.C.; Pan, H.C.; Jiang, H.S. Resonance scattering spectral detection of trace Hg(II) using aptamer modified nanogold as probe and nanocatalyst. Anal. Chem. 2009, 81, 5439–5445. [Google Scholar] [CrossRef] [PubMed]


| Analyte | Method | Regression Equation | Linear Range (µmol/L) | Coefficient | Detection Limit (µmol/L) |
|---|---|---|---|---|---|
| AuNPb | RRS | ΔI370 nm = 131.3C + 300 | 0.025–25 | 0.9951 | 0.008 |
| AuNPc, | RRS | ΔI370 nm = 51.5C + 267 | 0.05–75 | 0.9941 | 0.02 |
| AgNP | RRS | ΔI370 nm = 23.4C + 73 | 0.5–50 | 0.9971 | 0.2 |
| AuNPb | SERS a | ΔI1645 cm−1 = 2.28C + 72 | 0.5–50 | 0.9786 | 0.2 |
| AuNPb | SERS b | ΔI1612 cm−1 = 5.94C + 86 | 0.2–50 | 0.9942 | 0.1 |
| AuNPb | SERS c | ΔI1372 cm−1 = 1.47C − 9.1 | 0.6–50 | 0.9879 | 0.3 |
| Hg2+ | RRS | ΔI370 nm = 3650C + 111 | 0.008–1.33 | 0.9958 | 0.003 |
| Hg2+ | SERS b | ΔI1612 cm−1 = 326C + 6.4 | 0.013–0.5 | 0.9932 | 0.03 |
| Hg2+ | Abs | ΔA600 nm = 0.083C + 0.0087 | 0.5–2.33 | 0.9876 | 0.2 |
© 2017 by the authors. Licensee MDPI, Basel, Switzerland. This article is an open access article distributed under the terms and conditions of the Creative Commons Attribution (CC BY) license (http://creativecommons.org/licenses/by/4.0/).
Share and Cite
Ouyang, H.; Li, C.; Liu, Q.; Wen, G.; Liang, A.; Jiang, Z. Resonance Rayleigh Scattering and SERS Spectral Detection of Trace Hg(II) Based on the Gold Nanocatalysis. Nanomaterials 2017, 7, 114. https://doi.org/10.3390/nano7050114
Ouyang H, Li C, Liu Q, Wen G, Liang A, Jiang Z. Resonance Rayleigh Scattering and SERS Spectral Detection of Trace Hg(II) Based on the Gold Nanocatalysis. Nanomaterials. 2017; 7(5):114. https://doi.org/10.3390/nano7050114
Chicago/Turabian StyleOuyang, Huixiang, Chongning Li, Qingye Liu, Guiqing Wen, Aihui Liang, and Zhiliang Jiang. 2017. "Resonance Rayleigh Scattering and SERS Spectral Detection of Trace Hg(II) Based on the Gold Nanocatalysis" Nanomaterials 7, no. 5: 114. https://doi.org/10.3390/nano7050114
APA StyleOuyang, H., Li, C., Liu, Q., Wen, G., Liang, A., & Jiang, Z. (2017). Resonance Rayleigh Scattering and SERS Spectral Detection of Trace Hg(II) Based on the Gold Nanocatalysis. Nanomaterials, 7(5), 114. https://doi.org/10.3390/nano7050114